Abstract
The terminal equipment interconnection and the network communication environment are complex in power cyber–physical systems (CPS), and the frequent interaction between the information and energy flows aggravates the risk of false data injection attacks (FDIAs) in the power grid. This paper proposes an active defense framework against FDIAs of power CPS based on data-driven algorithms in order to ensure that FDIAs can be efficiently detected and processed in real-time during power grid operation. First, the data transmission scenario and false data injection forms of power CPS were analyzed, and the FDIA mathematical model was expounded. Then, from a data-driven perspective, the algorithm improvement and process design were carried out for the three key links of data enhancement, attack detection, and data reconstruction. Finally, an active defense framework against FDIAs was proposed. The example analysis verified that the method proposed in this paper could effectively detect FDIAs and perform data reconstruction, providing a new idea for the active defense against FDIAs of power CPS.
1. Introduction
With the deep integration of the new generation of information technologies into the power system [1,2,3], large amounts of electrical, sensing, and computing equipment are interconnected through two physical networks: the power grid and the communication network. The conventional power system with physical equipment at its core has gradually evolved into highly coupled cyber–physical systems (CPS) [4,5,6]. The power CPS is a complex network of cyber–physical integration based on a physical power grid (which includes primary energy flow equipment) and a cyber network (which conducts secondary control and protection of information flow) [7,8,9]. Its primary objectives are to open information islands by fully utilizing advanced grid entities, as well as information and communication technologies related to generation, transmission, transformation, distribution, utilization, dispatching, and other links in the power system. The integration of multi-type energy systems and spatiotemporal information reflects the characteristics of holographic state perception, ubiquitous interconnection of people and things, open platform sharing, and internal and external business innovation [10,11,12,13,14]. Given the development trend of the construction of new power systems, their dependence on CPS will only increase. At the same time, the risk of a cyber-attack on the power grid has also increased due to the more frequent information interactions resulting from the close integration of power CPS computing systems, communication networks, sensor networks, control systems, and physical systems.
In recent years, there have been frequent incidents of hackers or other personnel intruding into the power grid through cyber-attacks and ultimately destroying the power system (Figure 1). For instance, the Iranian nuclear facilities were attacked by the Stuxnet virus in 2010, the Ukrainian power grid was attacked by the BlackEnergy virus in 2015, an American wind farm was attacked by the ARP cache virus in 2017, and the control center of Venezuela’s hydropower plant underwent a cyber-attack in 2019 [15,16,17]. These are typical cases of large-scale regional blackouts caused by damage to power CPS.
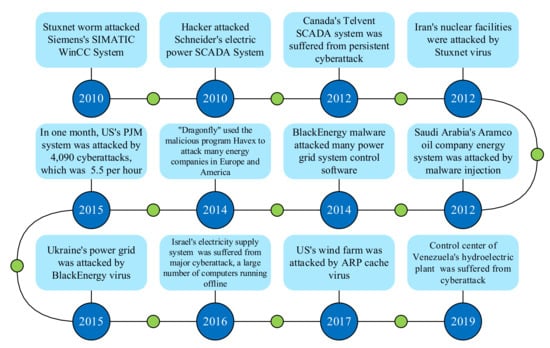
Figure 1.
Actual cases of cyber-attacks against power grids.
As one of the most threatening attack methods in many power CPS cyber-attacks, false data injection attacks (FDIAs) have strong accessibility, interference, and concealment [18]. The FDIAs for power grid state estimation were first introduced by Liu Yao et al. [19] in 2009. They reported that the attacker invades the system through the power CPS information and communication network, obtains the power CPS network parameters and topology by manipulating the measurement device, and then creates false measurement data that satisfy the constraints of state estimation, avoids the bad-data-detection process, and launches attacks without being noticed by the control center. The control center thus loses its ability to perceive the current system operating state or topology, thereby producing wrong estimates and issuing wrong instructions, which disrupt the normal operation of the power grid [20,21]. Power CPS FDIAs completely invalidate the conventional bad-data-detection mechanism and pose a serious threat to the robustness and safe operation of the power grid. Therefore, conducting a thorough cyber–physical analysis of state attacks in FDIAs, researching its active defense methods from a data-driven perspective, and strengthening the power CPS’ FDIA defense mechanism are all performed in light of the characteristics of the close integration and interdependence of power CPS’ cyber and physical components [22]. It is, therefore, very important to promote the secure and stable operation of power CPS.
Current studies on the defense methods of power CPS against FDIAs mainly focus on several aspects: data processing [18,23,24,25,26,27,28], network communication [29,30], resource allocation [31,32,33,34,35,36,37,38,39], network parameters [40,41,42], topology structure [43,44,45], and spatiotemporal coordination [46,47,48,49,50,51,52].
In terms of data processing defense methods, a spatially concealed FDIA online defense method for smart grids was proposed in [18]; it detected, eliminated, and corrected false data measured by the supervisory control and data acquisition (SCADA) instrument and phasor measurement unit (PMU). XGBoost-loaded prediction state variables and unscented Kalman filter (UKF) dynamic estimation state variables were used in [23] for adaptive hybrid prediction, and the distribution of random variables was compared through the central limit theorem to detect and correct FDIAs. A set of safe and reliable PMU measurements and Huber robust estimation were used in [24] to detect FDIAs by determining the consistency of measurement data. Wavelet transformation and deep neural networks were used in [25] to obtain the dynamic spatiotemporal characteristics of the system state through machine learning, and the differences in the state variables at the current moment were analyzed to detect FDIAs. The Kullback–Leibler (KL) divergence method was used in [26] to obtain the probability distribution difference of the measured variables’ changes and determine whether the current system was subject to FDIAs. The phase angle deviation of state estimation was deduced in [27] according to the attack model, the existence of FDIAs was detected, and the most likely attack position was searched for; then, a correction matrix was derived to correct the attacked phase angle data. A reconstruction method of injecting attack signals was proposed in [28], an adaptive sliding mode observer was used to obtain the errors of the system state and control variables, and the FDIA signals received by the system were then derived and excluded.
In terms of network communication defense methods, the control signals of the energy storage system participating in frequency modulation were taken as an example in [29], and an adjustment method of the feedback controller gain parameters was analyzed in the presence of false measurement and communication delay. A random concatenation technique of data packets was proposed in [30] to prevent hackers from obtaining the length and timing information of measurement data, thereby effectively curbing FDIAs constructed by disrupting data communication.
In terms of resource allocation defense methods, a cross-layer defense mechanism was proposed in [31]. It identified the attacked PMU by comprehensively analyzing the prior probability of the attack by FDIAs from the physical layer and the location determination information of the attack by FDIAs from the upper layer. In [32], it was assumed that the PMU was absolutely safe and reliable. The minimum number of measuring instruments an attacker would need to breach and complete FDIAs was discussed, and an optimal configuration strategy was provided to replace the PMU required by the instruments. Graph theory was used in [33] to select a set of protected measurement variables and curb the generation of FDIAs. Mixed integer linear programming, greedy algorithm search, and other methods were proposed in [34,35,36] to select the optimal measurement variables’ protection target, prevent it from being tampered with, and ensure that covert FDIAs cannot be achieved. To ensure that the secondary equipment can still execute the commands issued by the cyber side when it loses its original power supply on the physical side, it was equipped with an uninterruptible power supply in [37] to achieve operation on the physical side. Static zero-sum game, multi-stage random game, and other models were established in [38,39] from the perspective of the benefits of both attack and defense, and the game equilibrium point was solved to form a combination of attack and defense strategies for both parties to obtain optimal returns.
In terms of network parameter defense methods, in order to prevent an attacker from discovering moving target defense (MTD) and thereby strengthen system parameter information sniffing, [40] used a covert distributed flexible AC transmission system (D-FACTS) device to improve the MTD method and analyzed the cost of MTD at the same time. Several sets of D-FACTS equipment parameter setting schemes were proposed in [41] to make the loss power fluctuation of the transmission line smaller, and parameter setting schemes were randomly selected from the scheme library to curb FDIAs. The construction process of the D-FACTS equipment parameter scheme library was improved in [42] so that the system could return to the operating state of the previous moment, and false data were quantified by comparing the returned measurement data.
In terms of topology structure defense methods, the potentially vulnerable nodes in the power grid were classified in [43] by optimizing the clustering algorithm, and the conventional autoregressive model state prediction results were used to detect false data for various nodes. A set of strategies were proposed in [44] to dynamically reconfigure the microgrid so that false data attacks could not be injected. MTD and line redundancy were used in [45] to switch usage routes, and the network topology was changed so that the attacker could not steal accurate system parameters, thereby preventing FDIAs.
In terms of spatiotemporal coordination defense methods, a preliminary exploration of FDIA cyber–physical coordination analysis and defense methods was conducted in [46]. Cyber–physical bilateral information and the expert experience discretization method were combined in [47], and a collaborative FDIAs identification method was proposed based on a cyber–physical event chain. The distributed smart grid attack strategy was discussed in [48], and the impact of FDIAs on the secondary power system and power system’s security was analyzed. DSAToolsTM was used in [49] to simulate the FDIAs of the static var compensator (SVC) and static synchronous compensator (STATCOM) in an IEEE-39 bus system, and the impact on the transient stability of the system was studied. FDIAs were examined in [50] with the influence of the random failures and anomalies of the information system itself on the power grid. A cyber–physical coordinated defense research framework for FDIAs was proposed in [51], going beyond the traditional unilateral security defense system. The cybersecurity cyber–physical coordination defense system and framework of FDIAs were presented in [52] for the spatiotemporal dimensions, and a network security identification and protection scheme, including the device side and the master station side, was proposed.
In general, current studies on the defense methods of power CPS FDIAs have been a hundred flowers blooming, each showing its splendor. However, no matter the perspective, current data-driven research findings mainly have the following limitations: (1) FDIAs are low-probability events, and the attack data are unbalanced and noisy, leading to low detection accuracy and real-time detection efficiency. (2) The high dimension of historical measurement data leads to high model complexity, and the existence of redundant features has a serious impact on FDIA detection. (3) Conventional fault and FDIA measurement data have high similarity, and it is challenging to accurately classify difficult samples, resulting in high false and missed detection rates. (4) When a large amount of false data are detected, directly excluding the attacked measurement data will result in unobservable parts of the power grid.
In response to the above issues, this paper proposes an active defense framework against the FDIAs of power CPS based on data-driven algorithms. The main contributions are as follows:
- (1)
- Solving the problem of data imbalance and high dimensionality. By improving the generative adversarial network (GAN) model, balanced processing of historical measurement data was achieved. At the same time, through the joint mutual information maximization (JMIM) algorithm, the selection of the optimal feature set for attack detection was realized;
- (2)
- Solving the challenging problem of difficult sample detection. By introducing the focal loss function, the light gradient boosting machine (LightGBM) is optimized to achieve accurate detection of FDIAs;
- (3)
- Solving the unobservable problem of a local power grid. The data reconstruction of FDIAs is achieved by training a variational auto-encoder (VAE).
The remainder of this paper is organized as follows: the related principles of power CPS FDIAs are analyzed in Section 2. The active defense framework against FDIAs is proposed in Section 3. The effectiveness of the proposed method is verified and analyzed in Section 4. Finally, the conclusions of this paper are given in Section 5.
2. FDIAs Principles
2.1. Data Transmission Scenario and False Data Injection Forms
The real-time data transmission scenario and false data injection forms for power CPS are shown in Figure 2. The data collected by the PMUs were aggregated to the primary domain controller (PDC). The real-time measurement data collected by smart meters, sensors, or remote terminal units (RTUs) were aggregated to the SCADA system in the form of data packets. Afterward, the control center performed state estimation on the collected data [53], and the output results could be used for the decision analysis of other software applications in the energy management system (EMS) [18]. There are three forms in which attackers inject false data:
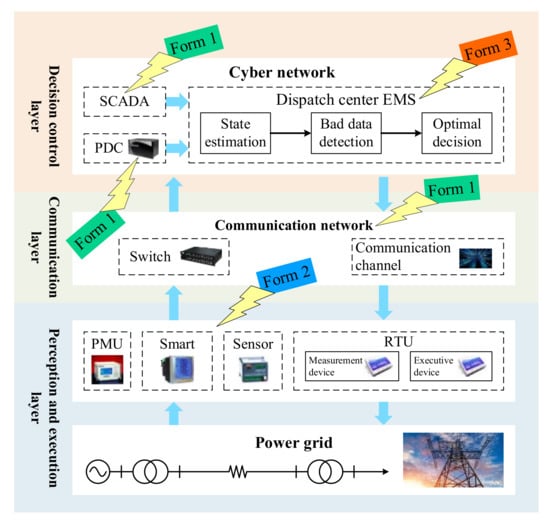
Figure 2.
Data transmission scenario and false data injection forms of power CPS.
Form 1: tampering with the data in the SCADA system, PDC, or communication network;
Form 2: directly tampering with the data of the RTU;
Form 3: invading the control center. Compared with the previous two, the realization of form 3 is extremely difficult because the actual power grid data center has strict security protection.
2.2. FDIAs Mathematical Model
Taking nonlinear state estimation, which is suitable for practical power grids, as an example [23], the FDIA mathematical model can be expressed as:
where represents the system measurement variable after injecting false data, ai represents the i-th element of attack vector a, v represents the index set of the attacked measurement variable in the power system, and false data are injected into all quantity measurements in v.
According to the EMS bad-data-detection mechanism, when there are no bad data in the power system, , where represents the detection threshold and represents the system measurement residual. Assuming that there are no bad data in the current system, if it undergoes FDIAs and the attack vector a satisfies Equation (2), that is, the system residual after being attacked satisfies , the false data can successfully avoid the conventional bad-data-detection mechanism [18].
In Equation (2), is the system measurement function, which represents the relationship between the state variable x and the measurement variable z, that is, z = h(x) + r, and r is the measurement noise.
3. Active Defense Framework against FDIAs
Most of the false data defense methods assume that the PMU measurement variable is safe and reliable. Although the protection of the PMU measurement variable can be achieved by continuously monitoring the measurement data or encryption, it does not mean that the PMU is not at risk of FDIAs. On the contrary, excessive trust in the PMU measurement variable will reduce the trust in other redundant measurement variables. Once the PMU undergoes FDIAs, and FDIAs are not identified, unpredictable security risks will be left in the power CPS. In this paper, an active defense framework against FDIAs for PMU is established based on a data-driven detection method. The framework is divided into three parts: (1) data enhancement methods against FDIAs, including balanced processing of historical measurement data and optimal feature set selection of attack detection; (2) detection method against FDIAs; and (3) data reconstruction against FDIAs.
3.1. Data Enhancement Methods against FDIAs
3.1.1. Balanced Processing of Historical Measurement Data
Most of the data used for FDIA detection are periodic measurement data, such as the current, voltage, and sequence components, while the occurrence of FDIAs in power CPS is an event with low probability. At present, there has been no instance of FDIAs being captured in the real power grid [54], leading to a serious data imbalance problem in the data-driven FDIA detection method. The performance of the algorithm directly trained on the imbalanced dataset was poor, which could lead to misjudgment [55,56,57]. GANs have been applied to generate different types of data in power grids, as they are able to learn the probability distributions of complex data and generate artificial samples [58]. If a GAN could be trained to generate high-quality normal measurement data and FDIA data, it would be of great significance to address the issues of a lack of real data in power CPS and low attack detection rate caused by data imbalance.
- (1)
- Improved GAN
GANs consist of a generative model and a discriminative model. The two models form a zero-sum game process. The discriminative model judges whether the new data generated by the generative model are good or bad. When the generative model generates enough real data, the discriminative model cannot accurately distinguish true and false data and the GAN reaches the Nash equilibrium. The GAN objective function is shown in Equation (3):
where represents the sample function generated by the generative model, x is random noise, N(y) represents the probability of judging the original sample as the real sample, y is the real sample, denotes the mathematical expectation, Wt is the probability distribution of the real sample, is the output of the generative model, , Ws is the probability distribution of , and represents the probability that the generated samples are judged as real samples.
The first GAN was proposed by Ian Goodfellow et al. in 2014 and was originally designed for image sample generation. Compared with image-based sample data, FDIA table-based data do not follow a Gaussian distribution and exhibit multi-modality. Therefore, if the data are processed directly using the original GAN, problems such as mode collapse, vanishing gradient, and non-convergence will arise. To improve the ability of the original GAN to learn tabular sample data and capture the correlation between the data, this paper adopts the combination of the Copula function and conditional tabular GAN (CTGAN) [59] to form CCTGAN. The Gaussian Copula function can learn the probability distribution of the data and describe the nonlinear correlation between random variables. The CTGAN improves the network structure and learning steps of the original GAN [60,61].
Let the k-dimensional random variable y = (y1,y2,…,yk) in the power CPS measurement data, where the marginal distribution function of yi(i = 1, 2, …, k) is G(yi). Let vi = G(vi), so vi is a random variable subject to uniform distribution between [0, 1]. Then, the relationship between the joint probability distribution function L(y) and the Copula distribution function D(v) (v = (v1,v2,…,vk)) is shown in Equation (4):
The corresponding joint probability density function can be obtained by the derivation of Equation (4), as shown in Equation (5):
where g(y1,y2,…,yk) represents the joint probability density distribution, d(v) is the k-dimensional Copula density function representing the correlation structure, and g(yi) represents the marginal probability density function of yi.
- (2)
- Data balance process
The balancing process of historical measurement data is shown in Figure 3. This process supplements each type of data on the original dataset by improving the GAN data-generation model, and finally merges various types of sample data to form a balanced historical measurement dataset.
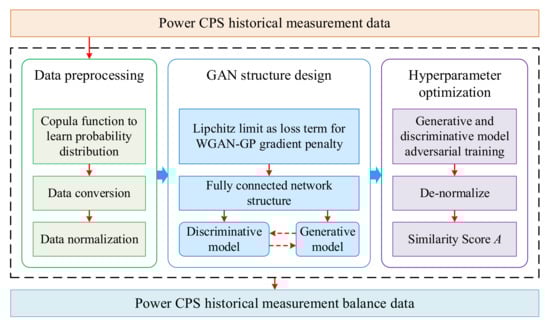
Figure 3.
Balancing process of historical measurement data.
The data balancing process based on CCTGAN in this paper is as follows:
- (1)
- Data preprocessing. Use the Gauss Copula function to learn the probability distribution of the power CPS historical measurement dataset, describe the correlation between n-dimensional random variables in the dataset, and perform data conversion. Normalize the transformed data;
- (2)
- GAN structure design. The Lipchitz restriction is added as a regular term to the Wasserstein loss of the WGAN-GP (Wasserstein GAN with Gradient Penalty) gradient penalty. The network structure adopts the full connection method. The generative model uses batch normalization and the ReLU activation function; scalar values are activated by the tanh function and discrete values are activated by the softmax function. The discriminative model uses the leaky ReLU function and dropout method [62];
- (3)
- Hyperparameter optimization. The generative and discriminative models conduct alternate adversarial training. Generate multiple sets of datasets containing the same number of normal operation data and FDIA data, and de-normalize each dataset. Use the Kolmogorov–Smirnov (K-S) test and KL divergence to calculate the similarity of data between the generated and original datasets, and obtain the similarity score A. Select the hyperparameters with similarity scores A closest to 1 as the optimal model parameters;
- (4)
- Data balance processing. The original historical measurement data are used as the input of CCTGAN to generate a balanced historical measurement dataset.
3.1.2. Optimal Feature Set Selection of Attack Detection
The power CPS has massive amounts of historical measurement data. For the FDIA detection algorithm of power CPS based on physical data mining, the high-dimensional data will increase the complexity of the model and waste computing resources. At the same time, the redundant features can greatly affect the FDIA detection accuracy [63]. The JMIM algorithm can fully consider the mutual information between the selected features and the data labels, and the selected optimal feature set can optimally represent the state of the power grid. If the JMIM algorithm can be used reasonably, the model can be lightened, the training time can be reduced, and the efficiency of the FDIA detection model can be improved.
- (1)
- JMIM algorithm principle
For the feature set F = {f1,f2,…,fN} in the historical measurement dataset D, the data are N-dimensional. Based on the joint mutual information measurement method, the JMIM algorithm selects k features from the original feature set to form a new feature subset, . The new feature set maintains high mutual information between features and labels, so the classifier can obtain a higher accuracy rate on the feature set.
Define the mutual information I(X, C) between variable X and variable C, as shown in Equation (6):
where H(x) represents the entropy of variable x, and H(x|y) represents the conditional entropy of variable x under condition y.
I(X,C) = H(C) − H(C|X),
The calculation process of joint mutual information between variables X, Y, and C is shown in Equations (7) and (8):
I(X,C|Y) = H(X|C) − H(X|C,Y),
I(X,Y;C) = I(X;C|Y) + I(Y|C).
Suppose F is the original feature set and S is the currently selected feature set, feature and feature . If feature fi is highly correlated with one feature fS in S, then I(fi;C) I(fS;C) I(fi,fS;C). When feature fi is to be selected, the currently selected feature fS, and data label L satisfy the constraints of Equations (9) and (10):
I(fi,fS;L) = I(fS;L) + I(fi;L|fS),
I(fi,fS;L) = H(L) − H(L|fi,fS).
To further derive the candidate features, the joint mutual information between the currently selected features and the labels is computed as shown in Equation (11):
The final feature selected by the JMIM algorithm is shown in Equation (12):
- (2)
- Optimal feature set selection process
The optimal feature set selection process for attack detection is shown in Figure 4. In this process, the JMIM feature-selection algorithm sequentially selects k features with the highest mutual information of the data labels in the original feature set to form the optimal feature set for attack detection.
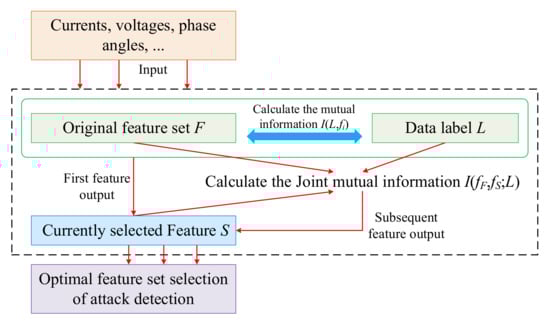
Figure 4.
Optimal feature set selection process of attack detection.
The detailed steps for selecting the optimal feature set of attack detection based on JMIM in this paper are as follows:
- (a)
- Input features, such as currents, voltages, and phase angles into the original feature set F, and initialize the set S to store the optimal features for screening;
- (b)
- Initialize parameter k, where k is the number of features finally screened by the algorithm;
- (c)
- Calculate the mutual information I(C;fi) between the features and data labels in the original feature set one by one, filter out the feature with the largest mutual information between the original feature set and the data labels, and add it to set S as the first feature;
- (d)
- Calculate the remaining features fF in feature set F, the selected features fS in S, and the joint mutual information I(fF,fS;L) between the data labels in turn;
- (e)
- Screen the next features in turn as fi = arg max fiF-S(min fSS(I(fi,fS;S))) until the k features are screened, add the features of the subsequent screening to the set S, and the final set S is the optimal feature set for attack detection.
3.2. Detection Method against FDIAs
FDIA measurement data are very similar to conventional fault measurement data. It is challenging to accurately classify difficult samples using simple statistical analysis and bad-data-detection algorithms, and there are drawbacks associated, such as high false-detection and non-detection rates. The LightGBM algorithm has good scalability, supports large-scale parallel data processing, and has the advantages of a short training time, low model complexity, and fast feature splitting in classification problems. If the LightGBM algorithm can be reasonably optimized, it can effectively improve the algorithm’s learning ability for difficult samples in the dataset and increase the classification accuracy of the attack detection model.
3.2.1. Optimize LightGBM
Gradient boosting decision tree (GBDT) is an ensemble learning framework based on decision trees. It is more lightweight than deep learning algorithms in terms of model complexity, and it does not easily fall into overfitting. It has good tolerance to noise and outliers, and has good scalability and parallelism for high-dimensional data classification problems [64]. LightGBM is improved based on GBDT, and the improvement strategy mainly integrates a histogram algorithm, depth-limited growth strategy, and parallel computing operation. The histogram algorithm reduces memory consumption and shortens the training time. The depth-limited growth strategy reduces model complexity and improves training accuracy. The parallel computing operation reduces the number of data operations and improves the data processing speed. Through the improvement of GBDT, LightGBM has a stronger ability to process massive amounts of data.
When power CPS FDIAs occur, some difficult samples were not accurately classified due to abnormal spatial distribution. To further improve the classification accuracy of the LightGBM classifier for difficult samples, a focal loss function was introduced to optimize the LightGBM algorithm to form OLGBM. For the s-th decision tree before optimization, the original logarithmic loss function of LightGBM is shown in Equation (13):
where K represents the number of categories, Cs−1 is the parameter set of the top s−1 trees, including {c1,c2,…,cs−1}, Es-1(yj;Cs−1) represents the prediction value of the model composed of the current s−1 decision trees for input sample yj under the condition that the parameter is Cs−1, B(xj,Es−1(yj;Cs−1)) represents the error function between the real value xj and the predictive value, and qi represents the probability that sample j is predicted to be in class i. The focal loss function is shown in Equation (14):
where (1 − qi) is the adjustment factor and represents the influence of the adjustment factor.
When the sample is misclassified, qi ≈ 0 and (1 − qi) ≈ 1, the loss is not affected and is close to the original logarithmic loss function. When a sample has a high probability of correct classification, qi ≈ 1, (1 − qi) ≈ 0. At this time, the weight of a sample with a high probability of correct classification is reduced and will receive less attention in the next iteration. The role of parameter is to adjust the rate at which the weight of easily classified samples decreases; increasing can enhance the influence of the adjustment factor. The focal loss function makes the classifier pay more attention to the contribution of misclassified samples during the training process, so the probability of correct classification in the next iteration process is improved, thereby improving the training accuracy of the classifier.
3.2.2. Attack Detection Process
The FDIA detection process is shown in Figure 5. In this process, the OLGBM algorithm is used to train and optimize the optimal feature set; finally, the FDIA detection model is constructed and the detection performance is evaluated according to the evaluation indicators.
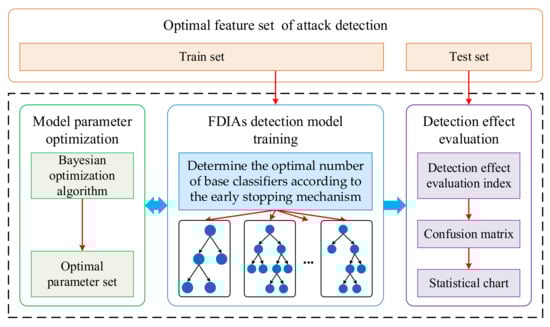
Figure 5.
FDIA detection process.
The detailed steps for FDIA detection based on OLGBM as proposed in this paper are as follows:
- (a)
- Divide the optimal feature set into a training set and testing set; the training set is used to train the attack-detection model;
- (b)
- Train the OLGBM algorithm on the train set and determine the optimal number of base classifiers according to the early stopping mechanism;
- (c)
- Under the optimal number of classifiers, the Bayesian optimization algorithm is used to search the optimal set of some important parameters of the OLGBM algorithm;
- (d)
- Train the OLGBM algorithm under the optimal parameter set to obtain the final FDIA detection model;
- (e)
- Select the test set in (a) to evaluate the detection performance of the model and present the model detection results in the form of a confusion matrix and a statistical chart.
3.3. Data Reconstruction against FDIAs
When the presence of FDIAs in the power CPS is detected, the operator of the control center will remove the attacked measurement data. However, in the actual power grid, if too much false data are detected, direct removal will make the local area of the power grid unobservable. As an unsupervised generative network model, VAE combines the idea of deep learning with Bayesian inference and can supplement the measurement data required for the normal operation of the system based on the remaining normal measurement data. If the VAE could be trained to generate simulated data that differed from the original measurement data but conformed to the correct characteristics, it would be very helpful to address the issue of unobservable power grids in local areas caused by the excessive removal of false data from the power CPS.
3.3.1. VAE Algorithm Principle
VAE consists of an encoder and a decoder. The encoder produces the hidden vector Z of the hidden layer by encoding the original training data X. Given the mean and variance of the Z distribution, according to the generated variational probability distribution of the hidden variable Z, the decoder is used to restore the approximate original training data X’, and the hidden layer features that can characterize the original training data X are obtained, in which the encoder and the generator are fitted with a neural network. Figure 6 shows the basic structure of VAE.
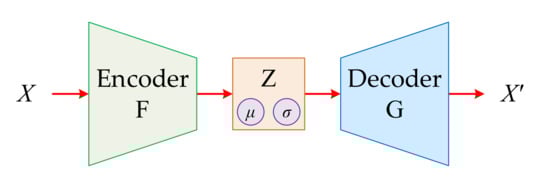
Figure 6.
Basic structure of VAE.
The distribution of the latent variable Z in the VAE can be represented by the posterior probability density function , where is the network parameter learned during the training process. As the real posterior distribution cannot be directly observed, to solve this problem, a recognition model is introduced as the approximate posterior probability of Z, where is the network parameter learned during the training process, and the KL divergence (DKL) is used to describe the similarity between the two distributions of and , as shown in Equation (15):
where represents the log-likelihood function of X. As the KL divergence is non-negative, it is always true that minimizing the KL divergence can be transformed into maximizing the variational lower bound . After deduction, the variational lower bound optimization objective function of VAE is shown in Equation (16):
where is the likelihood expectation of . To simplify the calculation process, the normal distribution N(0,1) is used as the prior distribution .
3.3.2. Data Reconstruction Process
The FDIA data reconstruction process is shown in Figure 7. In this process, the VAE data reconstruction model is used to complete the remaining normal measurement data after excluding the attacked measurement data in order to ensure the measurement data required for the normal operation of the system and solve the unobservable problem in local areas of the power grid.
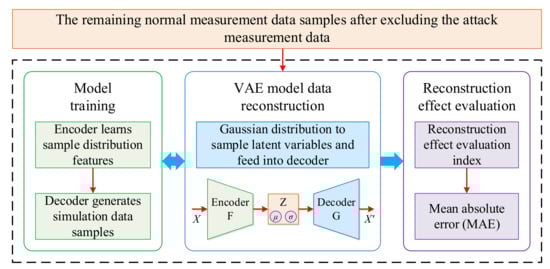
Figure 7.
FDIA data reconstruction process.
The detailed steps of FDIA data reconstruction based on VAE as proposed in this paper are as follows:
- (a)
- The remaining normal measurement data samples after excluding the attacked measurement data are used as the input to the VAE, and the VAE learns its sample distribution characteristics through the encoder;
- (b)
- The latent variable from the Gaussian distribution is sampled and input into the decoder. The decoder generates the same number of simulated data samples as the attacked measurement data;
- (c)
- The simulation data generated by the VAE are merged with the remaining normal measurement data to complete the original sample, thereby completing the reconstruction of the FDIA data;
- (d)
- The reconstruction rate and mean absolute error (MAE) evaluation indicators are selected to judge the data reconstruction performance of the VAE model.
3.4. Active Defense Framework against FDIAs
The active defense framework against FDIAs proposed in this paper is shown in Figure 8.
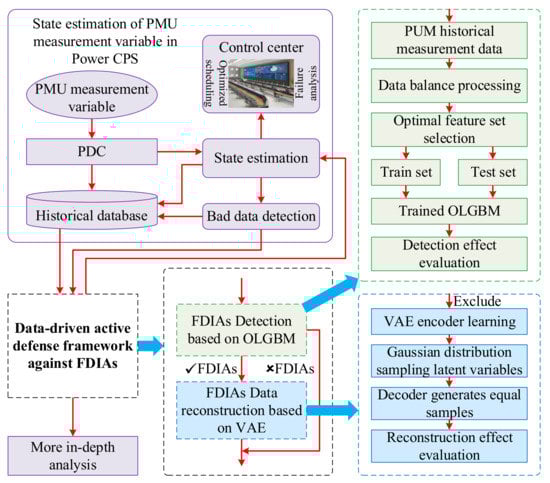
Figure 8.
Active defense framework against FDIAs.
The detection process is based on the OLGBM model. Specifically, the PMU historical measurement dataset is first collected. It contains normal data and abnormal FDIA data. The dataset is then balanced and the optimal feature set is selected and split into training and testing sets in a 7:3 ratio. The training set is used to train the model. After training, the test set is used for performance evaluation, and the model’s detection effect is judged by the evaluation indicators.
The data reconstruction process is based on the VAE model. Specifically, the normal measurement data samples remaining after excluding the attacked measurement data are input into the VAE model, producing the same amount of simulated data as the attacked measurement data. Evaluation indicators are then used to assess the data reconstruction performance of the model.
4. Example Analysis
The experimental environment in this paper is Python 3.8.2, Guido van Rossum, Google, Mountain View, Santa Clara County, CA, USA and the related third-party libraries mainly include imblearn, mifs, scikit-learn, ligthgbm, matplotlib, and scikit-plot. The proposed method is validated by taking the FDIA dataset provided by Mississippi State University and Oak Ridge National Laboratory as an example. The simulation system for collecting this dataset is shown in Figure 9.
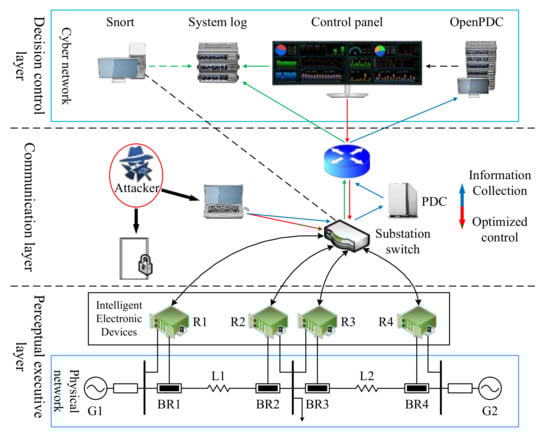
Figure 9.
Schematic diagram of the power CPS simulation system structure.
The system consists of three layers: a perceptual executive layer, communication layer, and decision control layer. The perceptual executive layer includes two generators, G1 and G2. BR1 to BR4 are circuit breakers, which are monitored by Intelligent Electronic Devices (IEDs) R1 to R4 that can open or close the corresponding circuit breaker. There are two lines in the power grid; the first line L1 extends from BR1 to BR2, and the second line L2 extends from BR3 to BR4. Each IED uses a distance protection scheme when a fault is detected, as they do not have internal verification to detect anomalies. No matter whether the fault is real or valid, it will trigger the circuit breaker. The communication layer includes a substation switch connected to IEDs, a PDC, and a router to complete the uplink (information collection) and downlink (optimized control) communication processes. Uplink communication requires a PDC to summarize the phasor data collected by IED and upload it to OpenPDC. The decision control layer includes the Snort intrusion detection system, system log, control panel, and OpenPDC. Snort performs intrusion detection on the communication layer substation switch, and the control panel displays the real-time time-series data processed by OpenPDC. One then analyzes and makes decisions about the operating status, and the system log records the communications, detected intrusions, and system operating status.
The original dataset can be divided into four types of scenarios after processing and re-labeling, as shown in Table 1.

Table 1.
Description of 4 types of scenarios after processing and re-labeling.
The original dataset contains a total of 128 physical features. The features and their descriptions are shown in Table 2.
Table 2.
Original dataset features and feature descriptions.
4.1. Data Balanced Processing Effect Evaluation
After the CCTGAN model balances the data in a class with a fewer number of samples, the size of that class becomes comparable to that of the class with the largest number of samples. The large sample dataset composed of 15 data subsets is processed by the CCTGAN model. The distribution of the number of samples before and after balancing is shown in Figure 10.
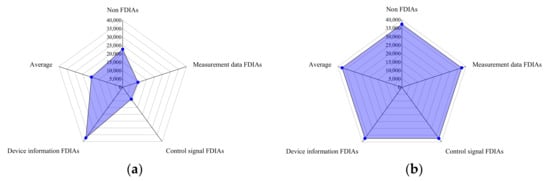
Figure 10.
Large sample dataset quantity distribution map before and after data balance processing. (a) Before data balance processing; (b) after data balance processing.
After data balance processing by the CCTGAN model, samples are supplemented with three types of scenarios: the number of non-FDIAs, measurement data FDIAs, and control signal FDIAs. The number of non-FDIA scenarios and the three types of attack scenarios in the final dataset are basically equal, and the imbalance rate of the dataset is about 0%, resulting in the balanced processing of sample data.
In order to further verify the effectiveness of the CCTGAN model and quantitatively analyze the impact of the OLGBM algorithm on the detection accuracy of FDIAs after data balance processing, the dataset adopts a large sample dataset fused with 15 sub-sample sets. The confusion matrix of the FDIA detection results before and after data balance processing is shown in Figure 11.
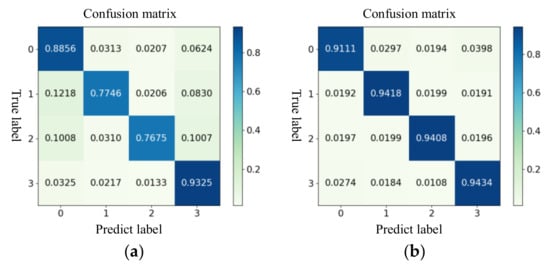
Figure 11.
Comparison of FDIA detection results before and after data balance processing. (a) Before data balance processing; (b) after data balance processing.
The analysis of Figure 11 shows that, after data balance processing, the detection accuracy of measurement data FDIAs and control signal FDIAs was improved by 16.72% and 17.33%, respectively, and the false detection rate between the other two types of scenarios was significantly reduced. The CCTGAN data balance processing model constructed in this paper is effective and plays an important role in improving the detection accuracy and reducing the false detection rate.
4.2. Optimal Feature Set Selection Effect Evaluation
The original data contained a total of 128 features, and a step-by-step search strategy was used to select the optimal feature set. The key parameter that the JMIM algorithm needs to determine is the optimal feature dimension k. Taking additional 10-dimensional features as the step size, the algorithm is executed 10 times in total. The F1-Score of the LightGBM algorithm on the test set is taken as an objective, and the feature dimension k is selected when the maximum F1-Score value is the optimal special number. Feature-selection algorithms involved in the comparison included information gain (IG), maximum relevance minimum redundancy (mRMR), joint mutual information (JMI), principal component analysis (PCA), kernel principal component analysis (KPCA), linear discriminant analysis (LDA), and the LW index with a sequence forward search algorithm (SFS-LW). The performance comparison results of different feature-selection algorithms are shown in Figure 12.
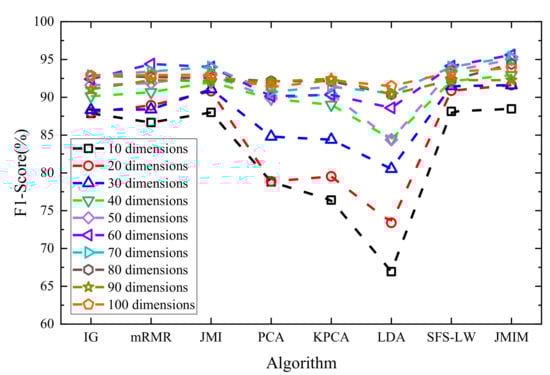
Figure 12.
Performance comparison of different feature-selection algorithms.
The analysis of Figure 12 shows that the best performance was achieved by the JMIM algorithm, the optimal feature dimension was 60, and the data dimension was reduced by 53.125%. Compared with other feature selection algorithms, the JMIM algorithm has stronger applicability, and the feature selection and de-redundancy effects are obvious.
The 60-dimensional features selected by the JMIM algorithm and their mutual information values are shown in Table 3. These features are the key features of power CPS FDIA detection, and together constitute the optimal feature set for FDIA detection. The optimal characterization of the grid state under the influence of FDIAs was determined.
Table 3.
Optimal features and mutual information values selected by the JMIM algorithm (TOP 30).
In order to further verify the effectiveness of the JMIM algorithm, the large sample dataset was used as the experimental data to analyze the influence of the optimal feature set on the FDIA detection performance. The confusion matrix of the FDIA detection results before and after JMIM feature selection is shown in Figure 13.
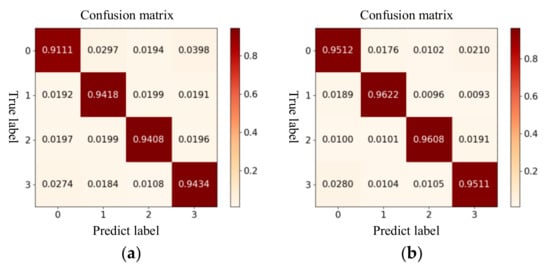
Figure 13.
Comparison of FDIA detection results before and after feature selection. (a) Before feature selection; (b) after feature selection.
The analysis of Figure 13 shows that the detection accuracy of FDIAs before the optimal feature set selection was 94.34%, the training time was 423.95 s, and the testing time was 0.62 s. After the optimal feature set was selected, the detection accuracy of FDIAs reached 96.22%, the training time was 214.93 s, and the prediction time was 0.34 s. The detection accuracy of FDIAs was improved, and the training and prediction times were also significantly shortened. It can be seen that the optimal feature set selection method based on JMIM as proposed in this paper achieved data de-redundancy to a certain extent, improved the detection accuracy of FDIAs, and further strengthened the reliability and stability of the model.
4.3. FDIAs Detection Effect Evaluation
The accuracy, precision, recall, and F1-score were used as performance indicators to assess the attack detection method. First, the influence of the focal loss function and the Bayesian-optimized OLGBM algorithm on the detection accuracy of FDIAs were quantitatively analyzed. Based on the large sample dataset, the confusion matrices of the FDIA detection results before and after applying LightGBM algorithm optimization are shown in Figure 14.
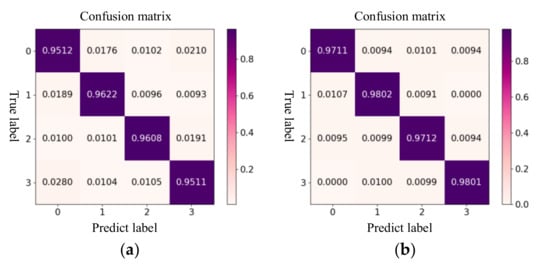
Figure 14.
Comparison of FDIA detection results before and after algorithm optimization. (a) Before algorithm optimization; (b) after algorithm optimization.
The analysis of the confusion matrix shows that, on the one hand, the detection performance for various types of FDIA was improved after applying the focal loss function and Bayesian optimization. On the other hand, the proposed method had a strong ability to distinguish FDIAs and normal events, and the overall performance of the model demonstrated its reliability. There was a maximum of 1.07% of false detections between the various types of FDIAs and non-attacks, and sometimes, no false detections were observed.
In order to further verify the applicability of the proposed method to small samples, the F1-Score indicator and the LightGBM algorithm in each optimization stage were compared and analyzed under 15 small sample datasets. The comparison results are shown in Figure 15.
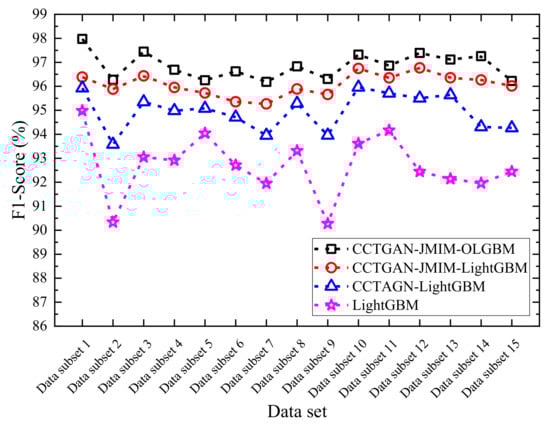
Figure 15.
Comparison of model performance in each optimization stage of the proposed method.
The analysis of Figure 15 shows that, on the small sample dataset, the average F1-Scores were 92.69%, 94.95%, and 96.07%, respectively, for the conventional LightGBM, the CCTGAN-LightGBM, and the CCTGAN-JMIM-LightGBM methods. The average F1-Score of the proposed CCTGAN-JMIM-OLGBM method for FDIA detection was as high as 96.85%. It can be seen that, for each optimization step of the proposed method, the FDIA detection performance showed a steady upward trend. Compared with the classic LightGBM method, after three optimization stages, the average F1-Score for FDIA detection was improved by 4.16%.
The proposed CCTGAN-JMIM-OLGBM was then compared with other FDIA detection algorithms, including the SOTA models. The SOTA model algorithms included convolutional neural networks–gate recurrent unit (CNN-GRU) and enhanced ensemble extreme learning machine (E3LM). The ensemble learning algorithms included extreme gradient boosting (XGBoost), gradient boosting decision tree (GBDT), random forest (RF), adaptive boosting (Adaboost), and voting classifier (VC). The classic machine learning algorithms included decision tree (DT), artificial neural network (ANN), logistic regression (LR), k-nearest neighbor (KNN), and support vector machine (SVM). Using a large sample dataset, the comparison results are shown in Figure 16.
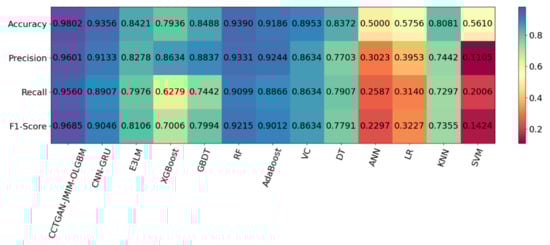
Figure 16.
Performance comparison of different FDIA detection algorithms.
By analyzing the results in Figure 16, it can be seen that, compared with the SOTA model algorithms, the proposed method improved the accuracy of FDIA detection by 13.81%, the precision by 13.23%, the recall rate by 15.84%, and the F1-score by 15.79%. Compared with the conventional ensemble learning algorithms, the proposed method improved the accuracy of FDIAs detection by 18.66%, the precision by 9.67%, the recall rate by 32.81%, and the F1-score by 26.79%. These improvements respectively became 48.02%, 84.96%, 75.54%, and 82.61% when compared with conventional machine learning algorithms. It can be seen that the FDIA detection model based on the proposed OLGBM had higher detection accuracy and stronger applicability for FDIAs than other machine learning algorithms, including SOTA model algorithms.
4.4. Data Reconstruction Effect Evaluation against FDIAs
To verify the reconstruction effect of the proposed data reconstruction method on false data, a reconstruction rate evaluation indicator is suggested. The indicator is defined as:
where Nrec represents the number of reconstructed false data samples and Ndet represents the number of false data samples detected before the reconstruction.
Four historical measurement data samples of 10,000 pieces of data, containing 1000 pieces, 500 pieces, 100 pieces, and 10 pieces of false data, are considered. They were respectively numbered 1–4, and FDIA detection was applied to each sample. The detected false data were reconstructed once and then FDIA detection was performed. If there were still false data in the detection result, the detected new false data were reconstructed twice, and so on. The effect after each reconstruction was evaluated, and the results are shown in Table 4.
Table 4.
Evaluation of false data reconstruction effect.
From the results in Table 4, it can be seen that the reconstruction rates of samples 1 and 2 were 98.8% and 99.4%, respectively, during the first reconstruction, and only reached 100% after the second reconstruction.
To further verify the effect of data reconstruction, the MAE evaluation indicator was selected:
where M represents the number of sample features, xi is the i-th eigenvalue of the reconstructed sample, and yi represents the i-th eigenvalue of the random sample after excluding the attacked measurement data. MAE describes the population mean deviation between the reconstructed and random sample eigenvalues.
The MAE value was calculated for the 15 pieces of false data that needed to be reconstructed twice in Table 4, and the calculation results of the MAE evaluation indicator are shown in Table 5.
Table 5.
Calculation results of evaluation indicator MAE.
The analysis of Table 5 shows that the overall MAE values of the 15 false data samples were in the range of 0.0052–0.0055 p.u.; the minimum value was 0.00521685 p.u., the maximum value was 0.00544320 p.u., and the overall mean was 0.005340692 p.u., which was relatively small. Due to the accuracy and reliability of the FDIAs detection method in this paper, secondary reconstruction was only required when the attack amplitude was small. False data with a small amplitude generally have an insignificant effect on system operation. It can be seen that the proposed VAE-based FDIAs data reconstruction method had a high reconstruction rate, and the experimental results also verified its effectiveness.
In summary, the proposed active defense framework against FDIAs could detect FDIAs and reconstruct data under the conditions of serious data imbalance, high data dimension, difficult samples to classify, and extensive false data removal. It could also be used with a small amount of sample data. It was still applicable to the set and was not greatly affected by noisy data samples, providing a feasible idea and scheme for the design of an active defense system for power CPS FDIAs.
5. Conclusions
For highly coupled cyber–physical power CPS, information–energy flow interactions are becoming increasingly frequent, which not only improves the grid sensing, computing, communication, and control capabilities, but also aggravates the FDIA risk of the power grid. This paper first analyzed the principle of power CPS FDIAs, then designed data enhancement, attack detection, and data reconstruction algorithms from a data-driven perspective, and proposed an active defense framework against FDIAs for PMU. The effectiveness of the proposed method provides a new idea for further improving the active security defense capability of power CPS.
Author Contributions
Conceptualization, Z.Q. and L.W.; Data curation, X.B., Y.D., Z.Z. and D.W.; Formal analysis, X.B. and Y.D.; Methodology, X.B.; Project administration, L.W.; Software, X.B. and Z.Z.; Supervision, Z.Q.; Validation, X.B. and D.W.; Writing—original draft, X.B., Y.D. and Z.Z.; Writing—review and editing, X.B., Y.D., Z.Z. and D.W. All authors have read and agreed to the published version of the manuscript.
Funding
This work is supported in part by the Jilin Province Science and Technology Development Plan Project of China under Grant YDZJ202201ZYTS692, 20220101234JC, and 20200401097GX, and in part by the Digital Agriculture Key Discipline of Jilin Province Foundation.
Data Availability Statement
Not applicable.
Conflicts of Interest
The authors declare no conflict of interest.
References
- Zhou, X.X.; Chen, S.Y.; Lu, Z.X.; Huang, Y.H.; Ma, S.C.; Zhao, Q. Technology Features of the New Generation Power System in China. Proc. CSEE 2018, 38, 1893–1904. [Google Scholar]
- Vallathan, G.; John, A.; Thirumalai, C.; Mohan, S.; Srivastava, G.; Lin, J.C.W. Suspicious activity detection using deep learning in secure assisted living IoT environments. J. Supercomput. 2021, 77, 3242–3260. [Google Scholar] [CrossRef]
- Cheng, C.F.; Chen, Y.C.; Lin, J.C.W. A Carrier-Based Sensor Deployment Algorithm for Perception Layer in the IoT Architecture. IEEE Sens. J. 2020, 20, 10295–10305. [Google Scholar] [CrossRef]
- Wang, L.; Qu, Z.Y.; Li, Y.; Hu, K.W.; Sun, J.; Xue, K.; Cui, M.S. Method for Extracting Patterns of Coordinated Network Attacks on Electric Power CPS Based on Temporal-Topological Correlation. IEEE Access 2020, 8, 57260–57272. [Google Scholar] [CrossRef]
- Qin, B.Y.; Liu, D. Research Progresses and Prospects on Analysis and Control of Cyber-physical System for Power Grid. Proc. CSEE 2020, 40, 5816–5826. [Google Scholar]
- Haes Alhelou, H.; Hamedani-Golshan, M.E.; Njenda, T.C.; Siano, P. A Survey on Power System Blackout and Cascading Events: Research Motivations and Challenges. Energies 2019, 12, 682. [Google Scholar] [CrossRef]
- Yu, T.; Cheng, L.F.; Zhang, X.S. The Weakly-Centralized Web-of-Cells Based on Cyber-Physical-Social Systems Integration and Group Machine Learning: Theoretical Investigations and Key Scientific Issues Analysis. Sci. Sin. Technol. 2019, 49, 1541–1569. [Google Scholar]
- Lin, J.C.W.; Srivastava, G.; Zhang, Y.Y.; Djenouri, Y.; Aloqaily, M. Privacy-Preserving Multiobjective Sanitization Model in 6G IoT Environments. IEEE Internet Things J. 2021, 8, 5340–5349. [Google Scholar] [CrossRef]
- Wu, J.M.T.; Srivastava, G.; Jolfaei, A.; Pirouz, M.; Lin, J.C.W. Security and Privacy in Shared HitLCPS Using a GA-Based Multiple-Threshold Sanitization Model. IEEE Trans. Emerg. Top. Comput. Intell. 2022, 6, 16–25. [Google Scholar] [CrossRef]
- Xu, C.X.; Abur, A. A Massively Parallel Framework for Very Large Scale Linear State Estimation. IEEE Trans. Power Syst. 2017, 33, 4407–4413. [Google Scholar] [CrossRef]
- Kurt, M.N.; Yılmaz, Y.; Wang, X.D. Distributed Quickest Detection of Cyber-Attacks in Smart Grid. IEEE Trans. Inf. Forensics Secur. 2018, 13, 2015–2030. [Google Scholar] [CrossRef]
- BaSin, D.; Cremers, C.; Kim, T.H.J.; Perrig, A.; Sasse, R.; Szalachowski, P. Design, Analysis, and Implementation of ARPKI: An Attack-Resilient Public-Key Infrastructure. IEEE Trans. Dependable Secur. Comput. 2016, 15, 393–408. [Google Scholar] [CrossRef]
- Lin, H.; Slagell, A.; Kalbarczyk, Z.; Sauer, P.W.; Iyer, R.K. Runtime Semantic Security Analysis to Detect and Mitigate Control-Related Attacks in Power Grids. IEEE Trans. Smart Grid 2016, 9, 163–178. [Google Scholar] [CrossRef]
- Qu, Z.Y.; Zhang, Y.; Qu, N.; Wang, L.; Li, Y.; Dong, Y.C. Method for Quantitative Estimation of the Risk Propagation Threshold in Electric Power CPS Based on Seepage Probability. IEEE Access 2018, 6, 68813–68823. [Google Scholar] [CrossRef]
- Lai, K.X.; Illindala, M.; Subramaniam, K. A tri-level optimization model to mitigate coordinated attacks on electric power systems in a cyber-physical environment. Appl. Energy 2019, 235, 204–218. [Google Scholar] [CrossRef]
- Xin, S.J.; Guo, Q.L.; Sun, H.B.; Zhang, B.M.; Wang, J.H.; Chen, C. Cyber-Physical Modeling and Cyber-Contingency Assessment of Hierarchical Control Systems. IEEE Trans. Smart Grid 2015, 6, 2375–2385. [Google Scholar] [CrossRef]
- Guo, Q.L.; Xin, S.J.; Wang, J.H.; Sun, H.B. Comprehensive Security Assessment for a Cyber Physical Energy System: A Lesson from Ukraine’s Blackout. Autom. Electr. Power Syst. 2016, 40, 145–147. [Google Scholar]
- Liu, X.R.; Wu, Z.Q. Online Defense Research of Spatial-hidden Malicious Data Injection Attacks in Smart Grid. Proc. CSEE 2020, 40, 2546–2558. [Google Scholar]
- Liu, Y.; Ning, P.; Reiter, M.K. False Data Injection Attacks against State Estimation in Electric Power Grids. ACM Trans. Inf. Syst. Secur. (TISSEC) 2011, 14, 1–13. [Google Scholar] [CrossRef]
- Liang, J.W.; Sankar, L.; Kosut, O. Vulnerability Analysis and Consequences of False Data Injection Attack on Power System State Estimation. IEEE Trans. Power Syst. 2016, 31, 3864–3872. [Google Scholar] [CrossRef]
- Xie, L.; Mo, Y.; Sinopoli, B. False Data Injection Attacks in Electricity Markets. In Proceedings of the 2010 First IEEE International Conference on Smart Grid Communications, Gaithersburg, MD, USA, 4–6 October 2010. [Google Scholar]
- Qu, Z.Y.; Dong, Y.C.; Qu, N.; Wang, L.; Li, Y.; Zhang, Y.; Mugemanyi, S. Survivability Evaluation Method for Cascading Failure of Electric Cyber Physical System Considering Load Optimal Allocation. Math. Probl. Eng. 2019, 2019, 1–15. [Google Scholar] [CrossRef]
- Liu, X.R.; Chang, P.; Sun, Q.Y. Grid False Data Injection Attacks Detection Based on XGBoost and Unscented Kalman Filter Adaptive Hybrid Prediction. Proc. CSEE 2021, 41, 5462–5476. [Google Scholar]
- Zhao, J.B.; Mili, L.; Wang, M. A Generalized False Data Injection Attacks Against Power System Nonlinear State Estimator and Countermeasures. IEEE Trans. Power Syst. 2018, 33, 4868–4877. [Google Scholar] [CrossRef]
- Yu, J.J.Q.; Hou, Y.; Li, V.O.K. Online False Data Injection Attack Detection with Wavelet Transform and Deep Neural Networks. IEEE Trans. Ind. Inform. 2018, 14, 3271–3280. [Google Scholar] [CrossRef]
- Singh, S.K.; Khanna, K.; Bose, R.; Panigrahi, B.K.; Joshi, A. Joint Transformation based Detection of False Data Injection Attacks in Smart Grid. IEEE Trans. Ind. Inform. 2018, 14, 89–97. [Google Scholar] [CrossRef]
- Fan, X.Y.; Du, L.; Duan, D.L. Synchrophasor Data Correction Under GPS Spoofing Attack: A State Estimation-Based Approach. IEEE Trans. Smart Grid 2018, 9, 4538–4546. [Google Scholar] [CrossRef]
- Ao, W.; Song, Y.D.; Wen, C.Y. Adaptive cyber-physical system attack detection and reconstruction with application to power systems. IET Control Theory Appl. 2016, 10, 1458–1468. [Google Scholar] [CrossRef]
- Farraj, A.; Hammad, E.; Kundur, D. A Distributed Control Paradigm for Smart Grid to Address Attacks on Data Integrity and Availability. IEEE Trans. Signal Inf. Process. Netw. 2018, 4, 70–81. [Google Scholar] [CrossRef]
- Sikdar, B.; Chow, J.H. Defending Synchrophasor Data Networks Against Traffic Analysis Attacks. IEEE Trans. Smart Grid 2011, 2, 819–826. [Google Scholar] [CrossRef]
- Fan, Y.W.; Zhang, Z.H.; Trinkle, M.; Dimitrovski, A.D.; Song, J.B.; Li, H.S. A Cross-Layer Defense Mechanism Against GPS Spoofing Attacks on PMUs in Smart Grids. IEEE Trans. Smart Grid 2015, 6, 2659–2668. [Google Scholar] [CrossRef]
- Yang, Q.Y.; An, D.; Min, R.; Yu, W.; Yang, X.Y.; Zhao, W. On Optimal PMU Placement-based Defense against Data Integrity Attacks in Smart Grid. IEEE Trans. Inf. Forensics Secur. 2017, 12, 1735–1750. [Google Scholar] [CrossRef]
- Bi, S.Z.; Zhang, Y.J. Graphical Methods for Defense Against False-Data Injection Attacks on Power System State Estimation. IEEE Trans. Smart Grid 2014, 5, 1216–1227. [Google Scholar] [CrossRef]
- Liu, X.; Li, Z.Y.; Li, Z.Y. Optimal Protection Strategy Against False Data Injection Attacks in Power Systems. IEEE Trans. Smart Grid 2017, 8, 1802–1810. [Google Scholar] [CrossRef]
- Davarikia, H.; Barati, M. A tri-level programming model for attack-resilient control of power grids. J. Mod. Power Syst. Clean Energy 2018, 6, 918–929. [Google Scholar] [CrossRef]
- Hao, J.P.; Piechocki, R.J.; Kaleshi, D.; Chin, W.H.; Fan, Z. Sparse Malicious False Data Injection Attacks and Defense Mechanisms in Smart Grids. IEEE Trans. Ind. Inform. 2015, 11, 1–12. [Google Scholar] [CrossRef]
- Han, Y.Q.; Guo, C.X.; Ma, S.Y.; Song, D.W. Modeling cascading failures and mitigation strategies in PMU based cyber-physical power systems. J. Mod. Power Syst. Clean Energy 2018, 6, 944–957. [Google Scholar] [CrossRef]
- Wang, Q.; Tai, W.; Tang, Y.; Ni, M.; You, S. A two-layer game theoretical attack-defense model for a false data injection attack against power systems. Electr. Power Energy Syst. 2019, 104, 169–177. [Google Scholar] [CrossRef]
- Wei, L.F.; Sarwat, A.I.; Saad, W.; Biswas, S. Stochastic Games for Power Grid Protection Against Coordinated Cyber-Physical Attacks. IEEE Trans. Smart Grid 2018, 9, 684–694. [Google Scholar] [CrossRef]
- Tian, J.; Tan, R.; Guan, X.H.; Liu, T. Enhanced Hidden Moving Target Defense in Smart Grids. IEEE Trans. Smart Grid 2019, 10, 2208–2223. [Google Scholar] [CrossRef]
- Morrow, K.L.; Heine, E.; Rogers, K.M.; Bobba, R.B.; Overbye, T.J. Topology Perturbation for Detecting Malicious Data Injection. In Proceedings of the 2012 45th Hawaii International Conference on System Sciences, Maui, HI, USA, 4–7 January 2012. [Google Scholar]
- Kuntz, K.; Smith, M.; Wedeward, K.; Collins, M. Detecting, Locating, & Quantifying False Data Injections Utilizing Grid Topology through Optimized D-FACTS Device Placement. In Proceedings of the 2014 North American Power Symposium, Pullman, WA, USA, 7–9 September 2014. [Google Scholar]
- Xu, R.Z.; Wang, R.; Guan, Z.T.; Wu, L.F.; Wu, J.; Du, X.J. Achieving Efficient Detection against False Data Injection Attacks in Smart Grid. IEEE Access 2017, 5, 13787–13798. [Google Scholar] [CrossRef]
- Talebi, M.; Li, C.Y.; Qu, Z.H. Enhanced Protection Against False Data Injection by Dynamically Changing Information Structure of Microgrids. In Proceedings of the 2012 IEEE 7th Sensor Array and Multichannel Signal Processing Workshop, Hoboken, NJ, USA, 17–20 June 2012. [Google Scholar]
- Wang, S.C.; Ren, W. Stealthy False Data Injection Attacks against State Estimation in Power Systems: Switching Network Topologies. In Proceedings of the 2014 American Control Conference, Portland, OR, USA, 4–6 June 2014. [Google Scholar]
- Tang, Y.; Li, M.Y.; Wang, Q.; Ni, M. A Review on Research of Cyber-attacks and Defense in Cyber Physical Power Systems Part Two Detection and Protection. Autom. Electr. Power Syst. 2019, 43, 1–9+18. [Google Scholar]
- Wang, Q.; Cai, X.P.; Tang, Y.; Ni, M. Methods of cyber-attack identification for power systems based on bilateral cyber-physical information. Int. J. Electr. Power Energy Syst. 2021, 125, 106515. [Google Scholar] [CrossRef]
- Liu, S.; Chen, B.; Zourntos, T.; Kundur, D.; Butler-Purry, K. A Coordinated Multi-Switch Attack for Cascading Failures in Smart Grid. IEEE Trans. Smart Grid 2014, 5, 1183–1195. [Google Scholar] [CrossRef]
- Chen, B.; Butler-Purry, K.L.; Kundur, D. Impact Analysis of Transient Stability due to Cyber Attack on FACTS Devices. In Proceedings of the 2013 North American Power Symposium, Manhattan, KS, USA, 22–24 September 2013. [Google Scholar]
- Su, S.; Wu, C.J.; Ma, J.; Zeng, X.J. Attacker’s Perspective Based Analysis on Cyber Attack Mode to Cyber-Physical System. Power Syst. Technol. 2014, 38, 3115–3120. [Google Scholar]
- Ni, M.; Li, M.L.; Li, J.; Wu, Y.J.; Wang, Q. Concept and Research Framework for Coordinated Situation Awareness and Active Defense of Cyber-physical Power Systems Against Cyber-attacks. J. Mod. Power Syst. Clean Energy 2021, 9, 477–484. [Google Scholar] [CrossRef]
- Li, M.L.; Ni, M.; Yan, Y.S.; Si, Q.H.; Xue, F.; Xu, J.B. Cyber-Physical Coordinated Defense Method Against Malicious Attacks for Security and Stability Control System. Autom. Electr. Power Syst. 2021, 45, 113–120. [Google Scholar]
- Li, Y.; Li, Z.; Chen, L. Dynamic State Estimation of Generators Under Cyber Attacks. IEEE Access 2019, 7, 125252–125267. [Google Scholar] [CrossRef]
- Wang, J.Y.; Sun, Z.W.; Bao, B.; Shi, D.Y. Malicious Synchrophasor Detection Based on Highly Imbalanced Historical Operational Data. CSEE J. Power Energy Syst. 2019, 5, 11–20. [Google Scholar] [CrossRef]
- Jiang, X.Y.; Ge, Z.Q. Data Augmentation Classifier for Imbalanced Fault Classification. IEEE Trans. Autom. Sci. Eng. 2021, 18, 1206–1217. [Google Scholar] [CrossRef]
- Liu, Y.; Wang, Y.Z.; Ren, X.G.; Zhou, H.; Diao, X.C. A Classification Method Based on Feature Selection for Imbalanced Data. IEEE Access 2019, 7, 81794–81807. [Google Scholar] [CrossRef]
- Yi, H.K.; Jiang, Q.C.; Yan, X.F.; Wang, B. Imbalanced Classification Based on Minority Clustering Synthetic Minority Oversampling Technique with Wind Turbine Fault Detection Application. IEEE Trans. Ind. Inform. 2021, 17, 5867–5875. [Google Scholar] [CrossRef]
- Xue, T.; Wang, Q. False Data Injection Attack on Power System Data-Driven Methods Based on Generative Adversarial Networks. In Proceedings of the 2021 IEEE Sustainable Power and Energy Conference, Nanjing, China, 22–24 September 2013. [Google Scholar]
- An, C.S.; Sun, J.T.; Wang, Y.F.; Wei, Q.J. A K-means Improved CTGAN Oversampling Method for Data Imbalance Problem. In Proceedings of the 2021 IEEE 21st International Conference on Software Quality, Reliability and Security, Haikou, China, 6–10 December 2021. [Google Scholar]
- Patki, N.; Wedge, R.; Veeramachaneni, K. The Synthetic Data Vault. In Proceedings of the 2016 IEEE International Conference on Data Science and Advanced Analytics, Montreal, QC, Canada, 17–19 October 2016. [Google Scholar]
- Ouyang, T.; He, Y.; Li, H.J.; Sun, Z.Y.; Baek, S. Modeling and Forecasting Short-Term Power Load with Copula Model and Deep Belief Network. IEEE Trans. Emerg. Top. Comput. Intell. 2019, 3, 127–136. [Google Scholar] [CrossRef]
- Xia, Y.S.; Wang, Y.; Zhou, L.; Fan, R.S. False Data Injection Attack Detection Method Based on Improved Generative Adversarial Network. Electr. Power Constr. 2022, 43, 58–65. [Google Scholar]
- Cao, J.; Wang, D.; Qu, Z.Y.; Cui, M.S.; Xu, P.C.; Xue, K.; Hu, K.W. A Novel False Data Injection Attack Detection Model of the Cyber-Physical Power System. IEEE Access 2020, 8, 95109–95125. [Google Scholar] [CrossRef]
- Xuan, Y.; Si, Q.G.; Zhu, J.; Sun, Z.Q.; Zhao, J.; Xu, M.J.; Xu, S.L. Multi-Model Fusion Short-Term Load Forecasting Based on Random Forest Feature Selection and Hybrid Neural Network. IEEE Access 2021, 9, 69002–69009. [Google Scholar] [CrossRef]
Publisher’s Note: MDPI stays neutral with regard to jurisdictional claims in published maps and institutional affiliations. |
© 2022 by the authors. Licensee MDPI, Basel, Switzerland. This article is an open access article distributed under the terms and conditions of the Creative Commons Attribution (CC BY) license (https://creativecommons.org/licenses/by/4.0/).