Article

Prediction of Oxidation Stability of Biodiesel Derived from Waste and Refined Vegetable Oils by Statistical Approaches

by
Hüseyin Çamur
* and
Ahmed Muayad Rashid Al-Ani
Department of Mechanical Engineering, Faculty of Engineering, Near East University, 99138 Nicosia, Cyprus
*
Author to whom correspondence should be addressed.
Energies 2022, 15(2), 407; https://doi.org/10.3390/en15020407
Submission received: 27 November 2021 / Revised: 31 December 2021 / Accepted: 2 January 2022 / Published: 6 January 2022

Abstract

:
The oxidation stability (OX) of the biodiesel is an essential parameter mainly during storage, which reduces the quality of the biodiesel, thus affecting the engine performance. Moreover, many factors affect oxidation stability. Therefore, determining the most significant parameter is essential for achieving accurate predictions. In this paper, an empirical equation (Poisson Regression Model (PRM)), machine learning models (Multilayer Feed-Forward Neural Network (MFFNN), Cascade Feed-forward Neural Network (CFNN), Radial Basis Neural Network (RBFNN), and Elman neural network (ENN)) with various combinations of input parameters are utilized and employed to identify the most relevant parameters for prediction of the oxidation stability of biodiesel. This study measured the physicochemical properties of 39 samples of waste frying methyl ester and their blends with various percentages of palm biodiesel and refined canola biodiesel. To this aim, 14 parameters including concentration amount of WFME (X1), PME (X2), and RCME (X3) in the mixture, kinematic viscosity (KV) at 40 °C, density at 15 °C (D), cloud point (CP), pour point (PP), the estimation value of the sum of the saturated ( S F A M s ), monounsaturated ( M U F A M s ), polyunsaturated ( P U F A M s ), degree of unsaturation ( D U ), long-chain saturated factor ( L C S F ), very-long-chain fatty acid ( V L C F A ), and ratio ( M U F A M s + P U F A M s S F A M s ) fatty acid composition were considered. The results demonstrated that the RBFNN model with the combination of X1, X2, X3, S F A M s , M U F A M s , P U F A M s . VLCFA, DU, LCSF, M U F A M s + P U F A M s S F A M s , KV, and D has the lowest value of root mean squared error and mean absolute error. In the end, the results demonstrated that the RBFNN model performed well and presented high accuracy in estimating the value of OX for the biodiesel samples compared to PRM, MFFNN, CFNN, and ENN.

1. Introduction

Biodiesel is considered one of the most promising potential fuels to supplement or substitute diesel. It has many advantages over diesel fuel, such as inherent lubricity, non-toxic and biodegradable, free of sulfur and aromatics, higher cetane number and flashpoint, and lower exhaust emissions, excepting higher NOx emissions [1,2,3].
Biodiesel is commonly produced from various edible and non-edible sources [4,5]. According to the literature [5,6,7], waste frying oil is considered as an efficient primary source among these sources for biodiesel production due to its low cost and easy availability. Generally, the transesterification reaction is widely used to produce biodiesel from any oil resources, where triglycerides are converted into fatty acid esters using homogeneous (acid and alkaline) or heterogeneous catalysts. Thus, the process of transesterification influences the biodiesel yield and production cost. Additionally, the operating conditions (catalyst type, temperature, methanol amount, reaction time) are attributed to biodiesel production. Hence, several researchers have used machine learning and mathematical models to maximize or optimize biodiesel production [8,9,10,11].
Moreover, the properties of produced biodiesel depend on its feedstock’s physicochemical properties and fatty acid composition. According to Yaşar [12], biodiesel’s most critical physicochemical properties, such as viscosity, density, oxidation stability, and cold flow properties, are dependent on the fatty acid characteristics of feedstock, including chain length and the number of double bonds. Moreover, several scientific researchers have predicted biodiesel’s critical properties based on its chemical structure. For instance, Giakoumis and Sarakatsanis [13] used multiple linear regression analysis to investigate the relationship between some selected properties of biodiesel (cetane number, density, kinematic viscosity, and heating values) and fatty acid weight composition. Alviso et al. [14] utilized genetic programming to estimate the physicochemical properties of biodiesel (the kinematic viscosity, flash point, cloud point, pour point, cold filter plugging point, cetane number, iodine number) and its fatty acids composition. Razavi et al. [15] predicted biodiesel properties, including pour point, cloud point, iodine value, and kinematic viscosity, as a function of fatty acids composition using the Least squares support vector machine.
As mentioned previously, the physicochemical properties of biodiesel depend on the fatty acid profile and the raw materials used for the production of biodiesel. In this study, the authors have focused on the oxidation of biodiesel produced from various oil resources. Oxidation stability (OX) is considered one of the vital fuel quality criteria for biodiesel and should be addressed since oxidation products may impair fuel quality and, subsequently, engine performance [16]. Many factors can affect the oxidation stability of biodiesel like fatty acid composition, impurities (metals, free fatty acids, additives and antioxidants, water), physical parameters (sample mass, agitation, viscosity, temperature, light, and air exposure), as well as the degree of prior sample aging [17,18,19,20,21]. Besides, biodiesel, which contains a high amount of unsaturated methyl esters, is very susceptible to oxidative degradation [22]. Oxidation of unsaturated esters in biodiesel occurs by contact with air and other pro-oxidizing conditions during the storage period [23].
Moreover, most biodiesel produced requires antioxidants to meet the minimum requirement of oxidation stability, which is outlined in EN-14214 (6 h or 8 h) and ASTM D-6751 (3 h). The addition of antioxidants to biodiesel could help slow down the process of oxidation caused by free radicals [24]. Recently, researchers have explored the influence of adding different antioxidants such as tertiary butyl-hydroquinone (TBHQ), pyrogallol (PY), propyl gallate (PG), butylated hydroxytoluene (BHT), and butylated hydroxyanisole (BHA) antioxidants on the oxidation stability of biodiesel [25,26].
Consequently, this can be a challenging problem in biodiesel research. As an ongoing study of authors on the properties of biodiesel, mainly oxidation stability [27,28,29,30], the present study aims to identify the most relevant parameters for the prediction of oxidation stability of biodiesel. In literature, several empirical models such as machine learning models, regression models, and other hybrid forecasting models are reported to predict biodiesel properties such as kinematic viscosity, density, cetene number, flash point, and so on. To the best of our knowledge, there are no studies in the literature about identifying the most appropriate input parameters for the prediction of oxidation stability using machine learning models and regression models. With this primary objective, Poisson Regression Model (PRM)) and machine learning models (Multilayer Feed-Forward Neural Network (MFFNN), Cascade Feed-forward Neural Network (CFNN), Radial Basis Neural Network (RBNN), and Elman neural network (ENN) models are developed to find the most influencing input parameters for oxidation stability of biodiesel. For this aim, model 1, model 2, and model 3 with various input variables are proposed. Model 1 is developed using the estimation value of the sum of the saturated ( S F A M s ), monounsaturated ( M U F A M s ), polyunsaturated ( P U F A M s ), degree of unsaturation ( D U ), long-chain saturated factor ( L C S F ), very-long-chain fatty acid ( V L C F A ), and ratio ( M U F A M s + P U F A M s S F A M s ) fatty acid composition. Knowing that these values are calculated based on the fatty acid composition of biodiesel, model 2 is developed by adding kinematic viscosity (at 40 °C), density (at 15 °C). Model 3 is designed using all input variables. To this aim, to achieve this, the fatty acid composition, kinematic viscosity (at 40 °C), density (at 15 °C), and cold flow properties were measured for 41 different fatty acid methyl ester biodiesels and their blends. Additionally, the influence of blending various amounts of palm biodiesel and refined canola biodiesel with waste frying biodiesel on the oxidation stability of the blend was discussed.

2. Materials and Methods
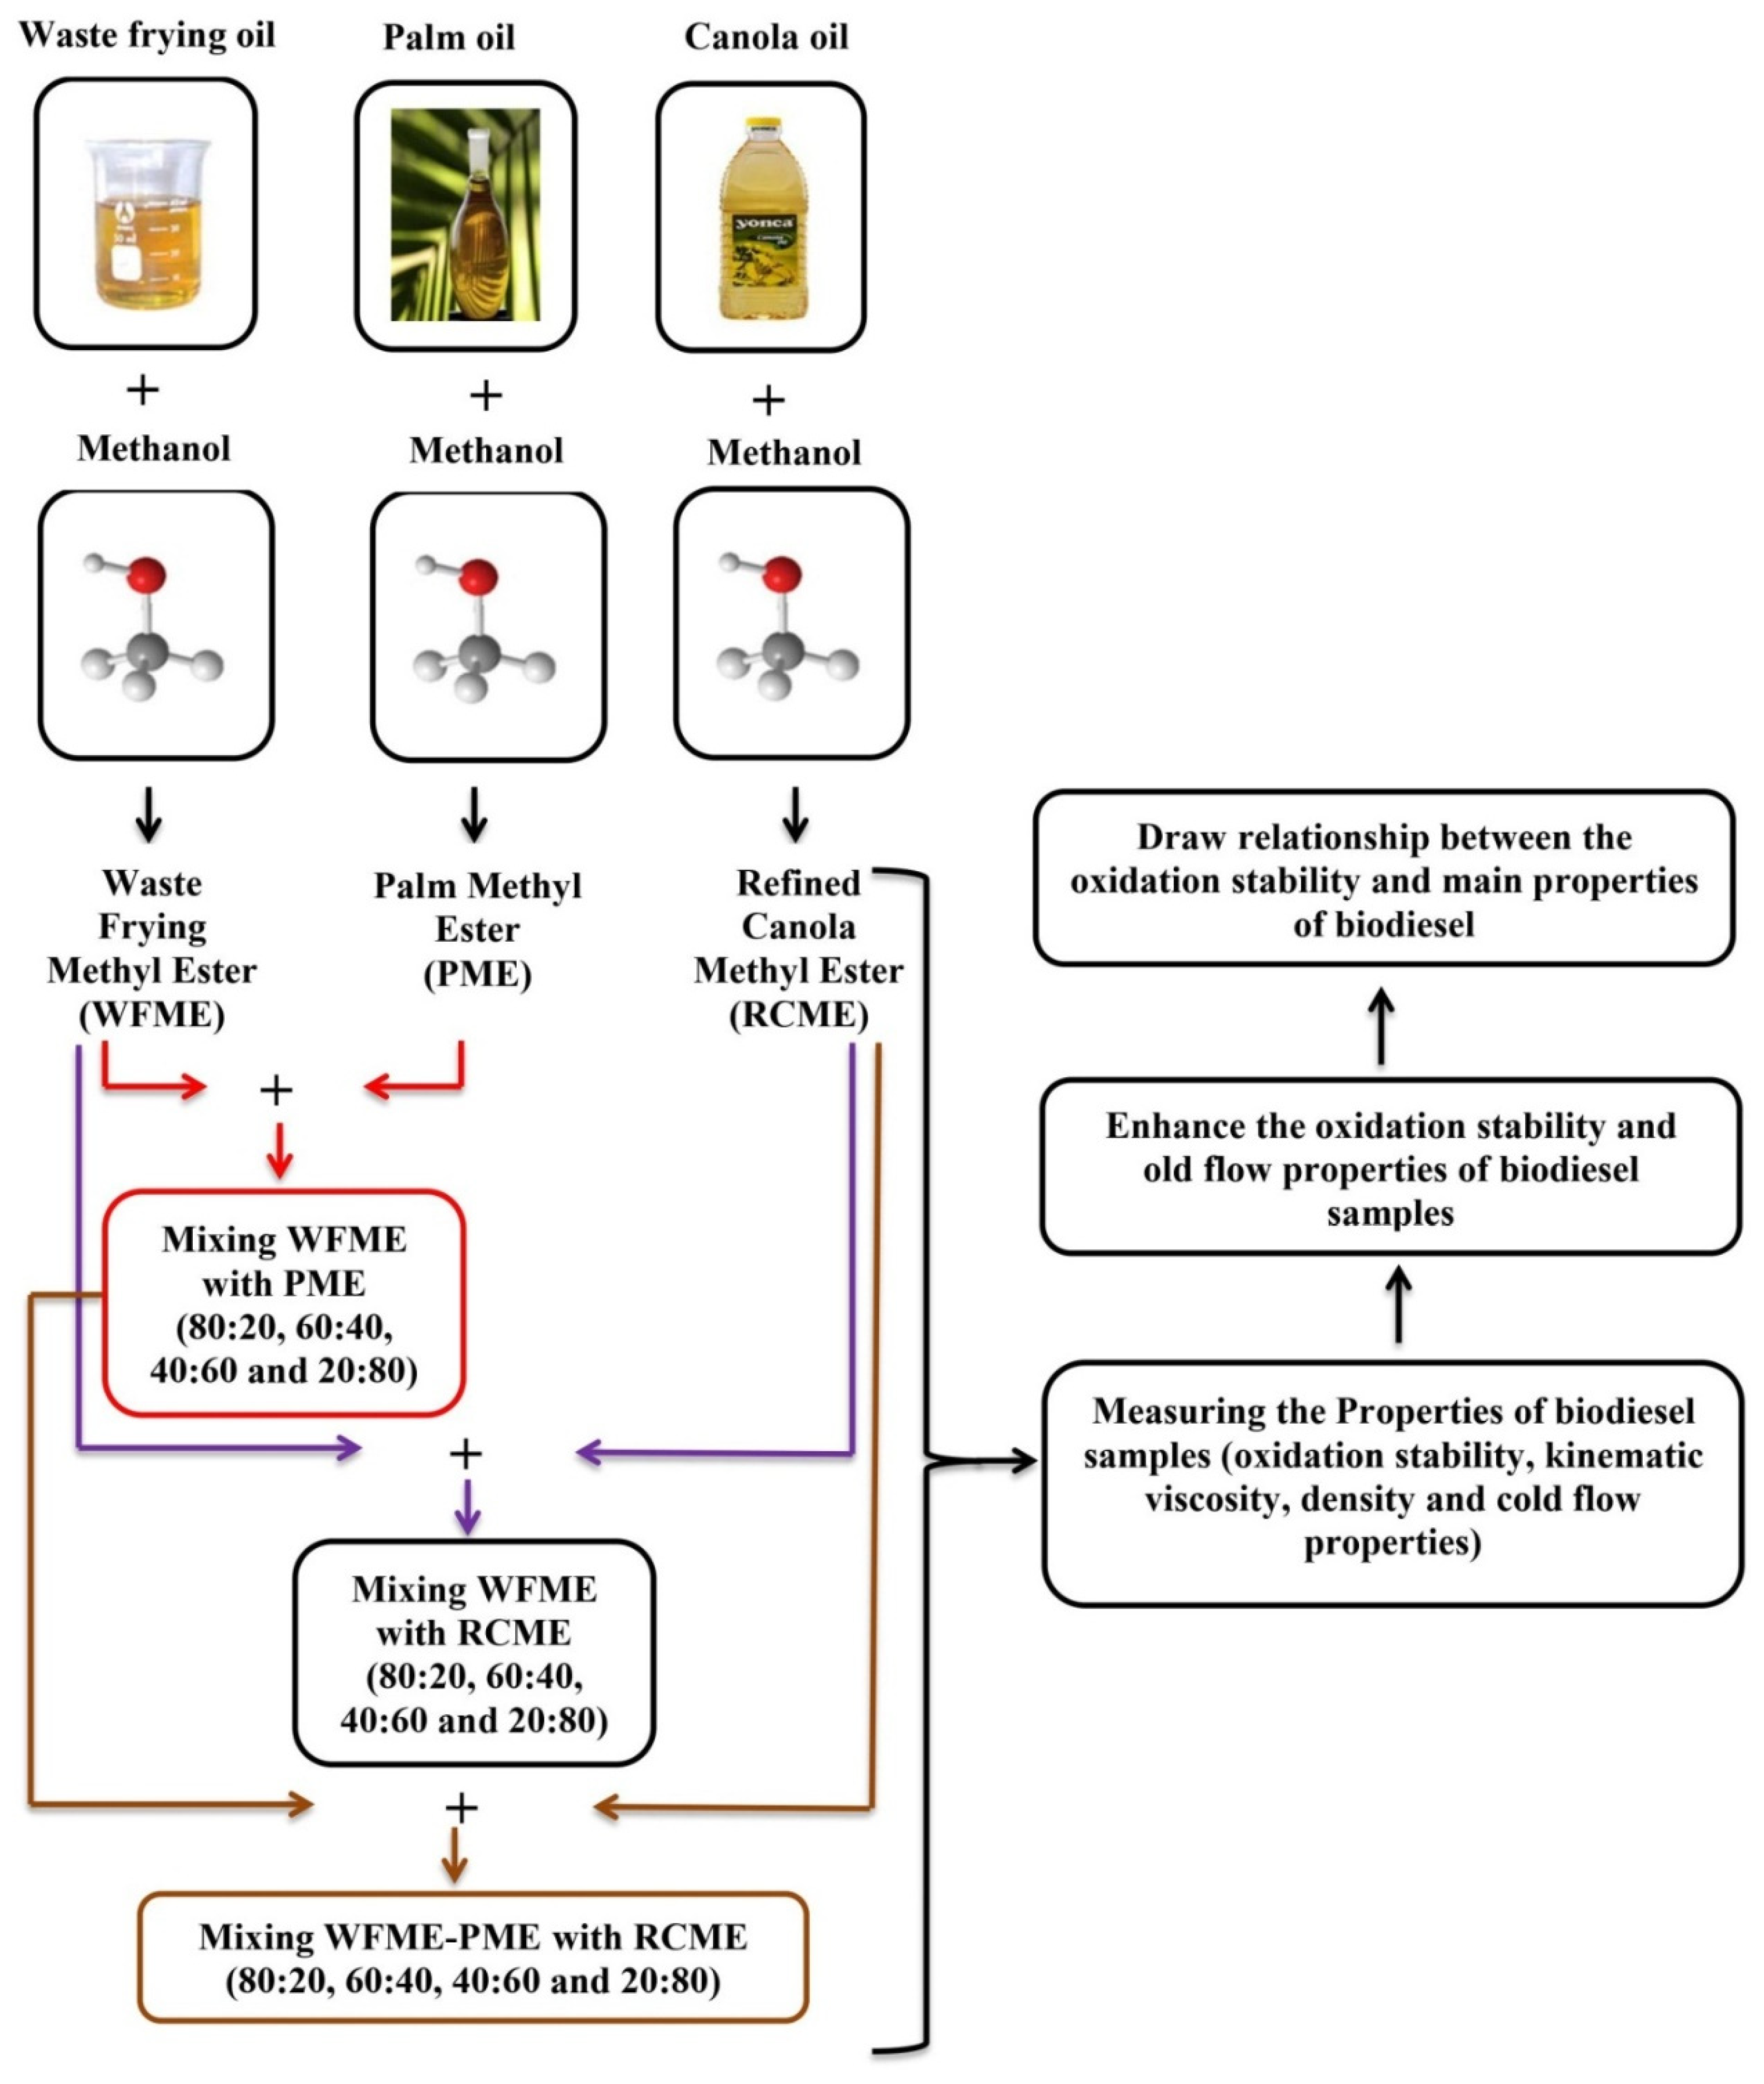
In this section, the preparation of PME-WFME-RCME fuel samples and measurements of their properties according to ASTM standards are explained. Figure 1 schematically illustrates the description of the proposed study.

2.1. Raw Materials

Forty-one different types of biodiesels with various fatty acid compositions were used in this study. Considering this, thirty-nine of these biodiesels were produced from waste vegetable oils, which were collected from households, traditional restaurants, hotels, and cafés. Additionally, canola oil and palm oil were purchased from the local market in Northern Cyprus.

2.2. Instruments

In this study, the kinematic viscosity (KV), density (D), cold flow properties including Cloud Point (CP) and Pour Point (PP), and oxidation stability (OX) were measured for all the fuel samples. The KV and D were measured using Ubbelohde viscometers and Pycnometer with a bulb capacity of 25 mL following the standard ASTM D445 [31] and ASTM D854 [32], respectively. Furthermore, CP and PP were determined according to ASTM D2500 [33] and ASTM D97 [34]. Finally, the OX was evaluated using the Rancimat instrument following EN 14112 [35]. Measuring these properties is explained in detail in Refs. [29,30].

2.3. Fuel Characteristics

All biodiesel samples were analyzed by gas chromatography (GC) to evaluate the fatty acid profile of the fuel. The estimating values of the sum of the saturated ( S F A M s ), monounsaturated ( M U F A M s ), polyunsaturated ( P U F A M s ), degree of unsaturation ( D U ), long-chain saturated factor ( L C S F ), very-long-chain fatty acid ( V L C F A ), and ratio ( M U F A M s + P U F A M s S F A M s ) are presented in Table 1. These values can be determined using Equations (1)–(7).
M U F A M s = w t % C x x : 1
P U F A M s = w t % C x x : 2 + w t % C x x : 3
S F A M s = w t % C x x : 00
D U = [ m o n o u n s a t u a r t e d   C n : 1 ] + 2 [ p o l y u n s a t u r a t e d   C n : 2 ,   3 ]
L C S F = 0.1 × [ C 16 : 0 ] + 0.5 × [ C 18 : 0 ] + [ C 20 : 0 ] + 1.5 × [ C 22 : 0 ] + 2 × [ C 24 : 00 ]
V L C F A = [ C 20 : 0 ] + [ C 20 : 1 ] + [ C 22 : 0 ] + [ C 24 : 00 ]
R = M U F A M s + P U F A M s S F A M s
The identification of the principal fatty acid compositions (FACs) in Palm methyl ester (PME) were oleic (43.20%), palmitic (39.1%), linoleic (11:00%), and stearic (4.10%) acids. Several other FACs were detected in lesser (<2%) amounts. The combined content of   M U F A M ,   P U F A M ,   S F A M ,   D U , L C S F , and V L C F A were 44.90, 43.50, 11.20, 65.90, and 0.5%, respectively. These results agreed with previous reports on the FAC profile of PME [36,37,38]. Refined canola methyl ester (RCME) was characterized by a high percentage of oleic acid (58.9%), linoleic acid (20.57%), Linolenic acid (9.34%), and Palmitic acid (4.14%). The estimated value of   M U F A M ,   P U F A M ,   S F A M ,   D U , L C S F , and V L C F A of RCME was 60.25, 39.91, 6.73, 120.07, 2.00, and 1.98%, respectively. These results agreed with previous reports on the FAC profile of RCME [39,40,41]. Moreover, it is observed that the highest content of saturated fatty acid was obtained from WFME11 followed by WFME17. Additionally, it is found that the highest content of M U F A M and lowest content of P U F A M   were recorded for WFME 12 and WFME17.

2.4. Blend Preparation

The fuel samples obtained from waste frying oils were blended with PME and RCME with various percentages from 20 to 80 (%v/v) in the step of 20 (%v/v) for improving the properties of PME-WFME and RCME-WFME samples. Furthermore, the PME-WFME samples were mixed with different concentrations of RCME (20%, 40%, 60%, and 80%) for enhancing the oxidation stability and cold flow properties of PME-WFME-RCME. The blends are prepared using a beaker and electrical stirrer with a stainless-steel propeller at room temperature for 30 min.

2.5. Empirical Models

This section explains the selected empirical models to choose the more relevant variables for oxidation stability prediction. In this study, Matlab and Minitab are employed in training and evaluating the models.

2.5.1. Artificial Neural Networks (ANN)

Machine learning models are used as alternative tools to describe a complex system [42]. They are utilized in a wide variety of applications in engineering and science. In this study, four empirical models (Multilayer feed-Forward Neural Network (FFNN), Cascade Forward Neural Network (CFNN), Radial Basis Function Neural Network (RBFNN), and Elman neural network (ENN)) are developed to predict the cold flow properties and oxidation stability of fuel samples. This work uses the value of   M U F A M ,   P U F A M ,   S F A M ,   D U , L C S F , V L C F A , volume fraction, KV, D, CP, and PP as explanatory input variables. The data are divided into training and testing groups, and the results by the models are compared with each.
(a) 
Multilayer feedforward neural network (MFFNN)
The MFFNN consists of three layers (input, hidden, and output layers). Several neurons and hidden layers should be cautiously selected as they influence the validity of training. TRAINLM is used for training function. In addition, Mean squared error (MSE) is estimated to find the best performance of the training algorithm. The declining gradient of the back-propagation algorithm is utilized to reduce the value of MSE between the actual and estimated output. The description of the developed model was given in Kassem and Gokcekus [42]. Figure 2 illustrates the explanation process of the proposed MFFNN method.
(b) 
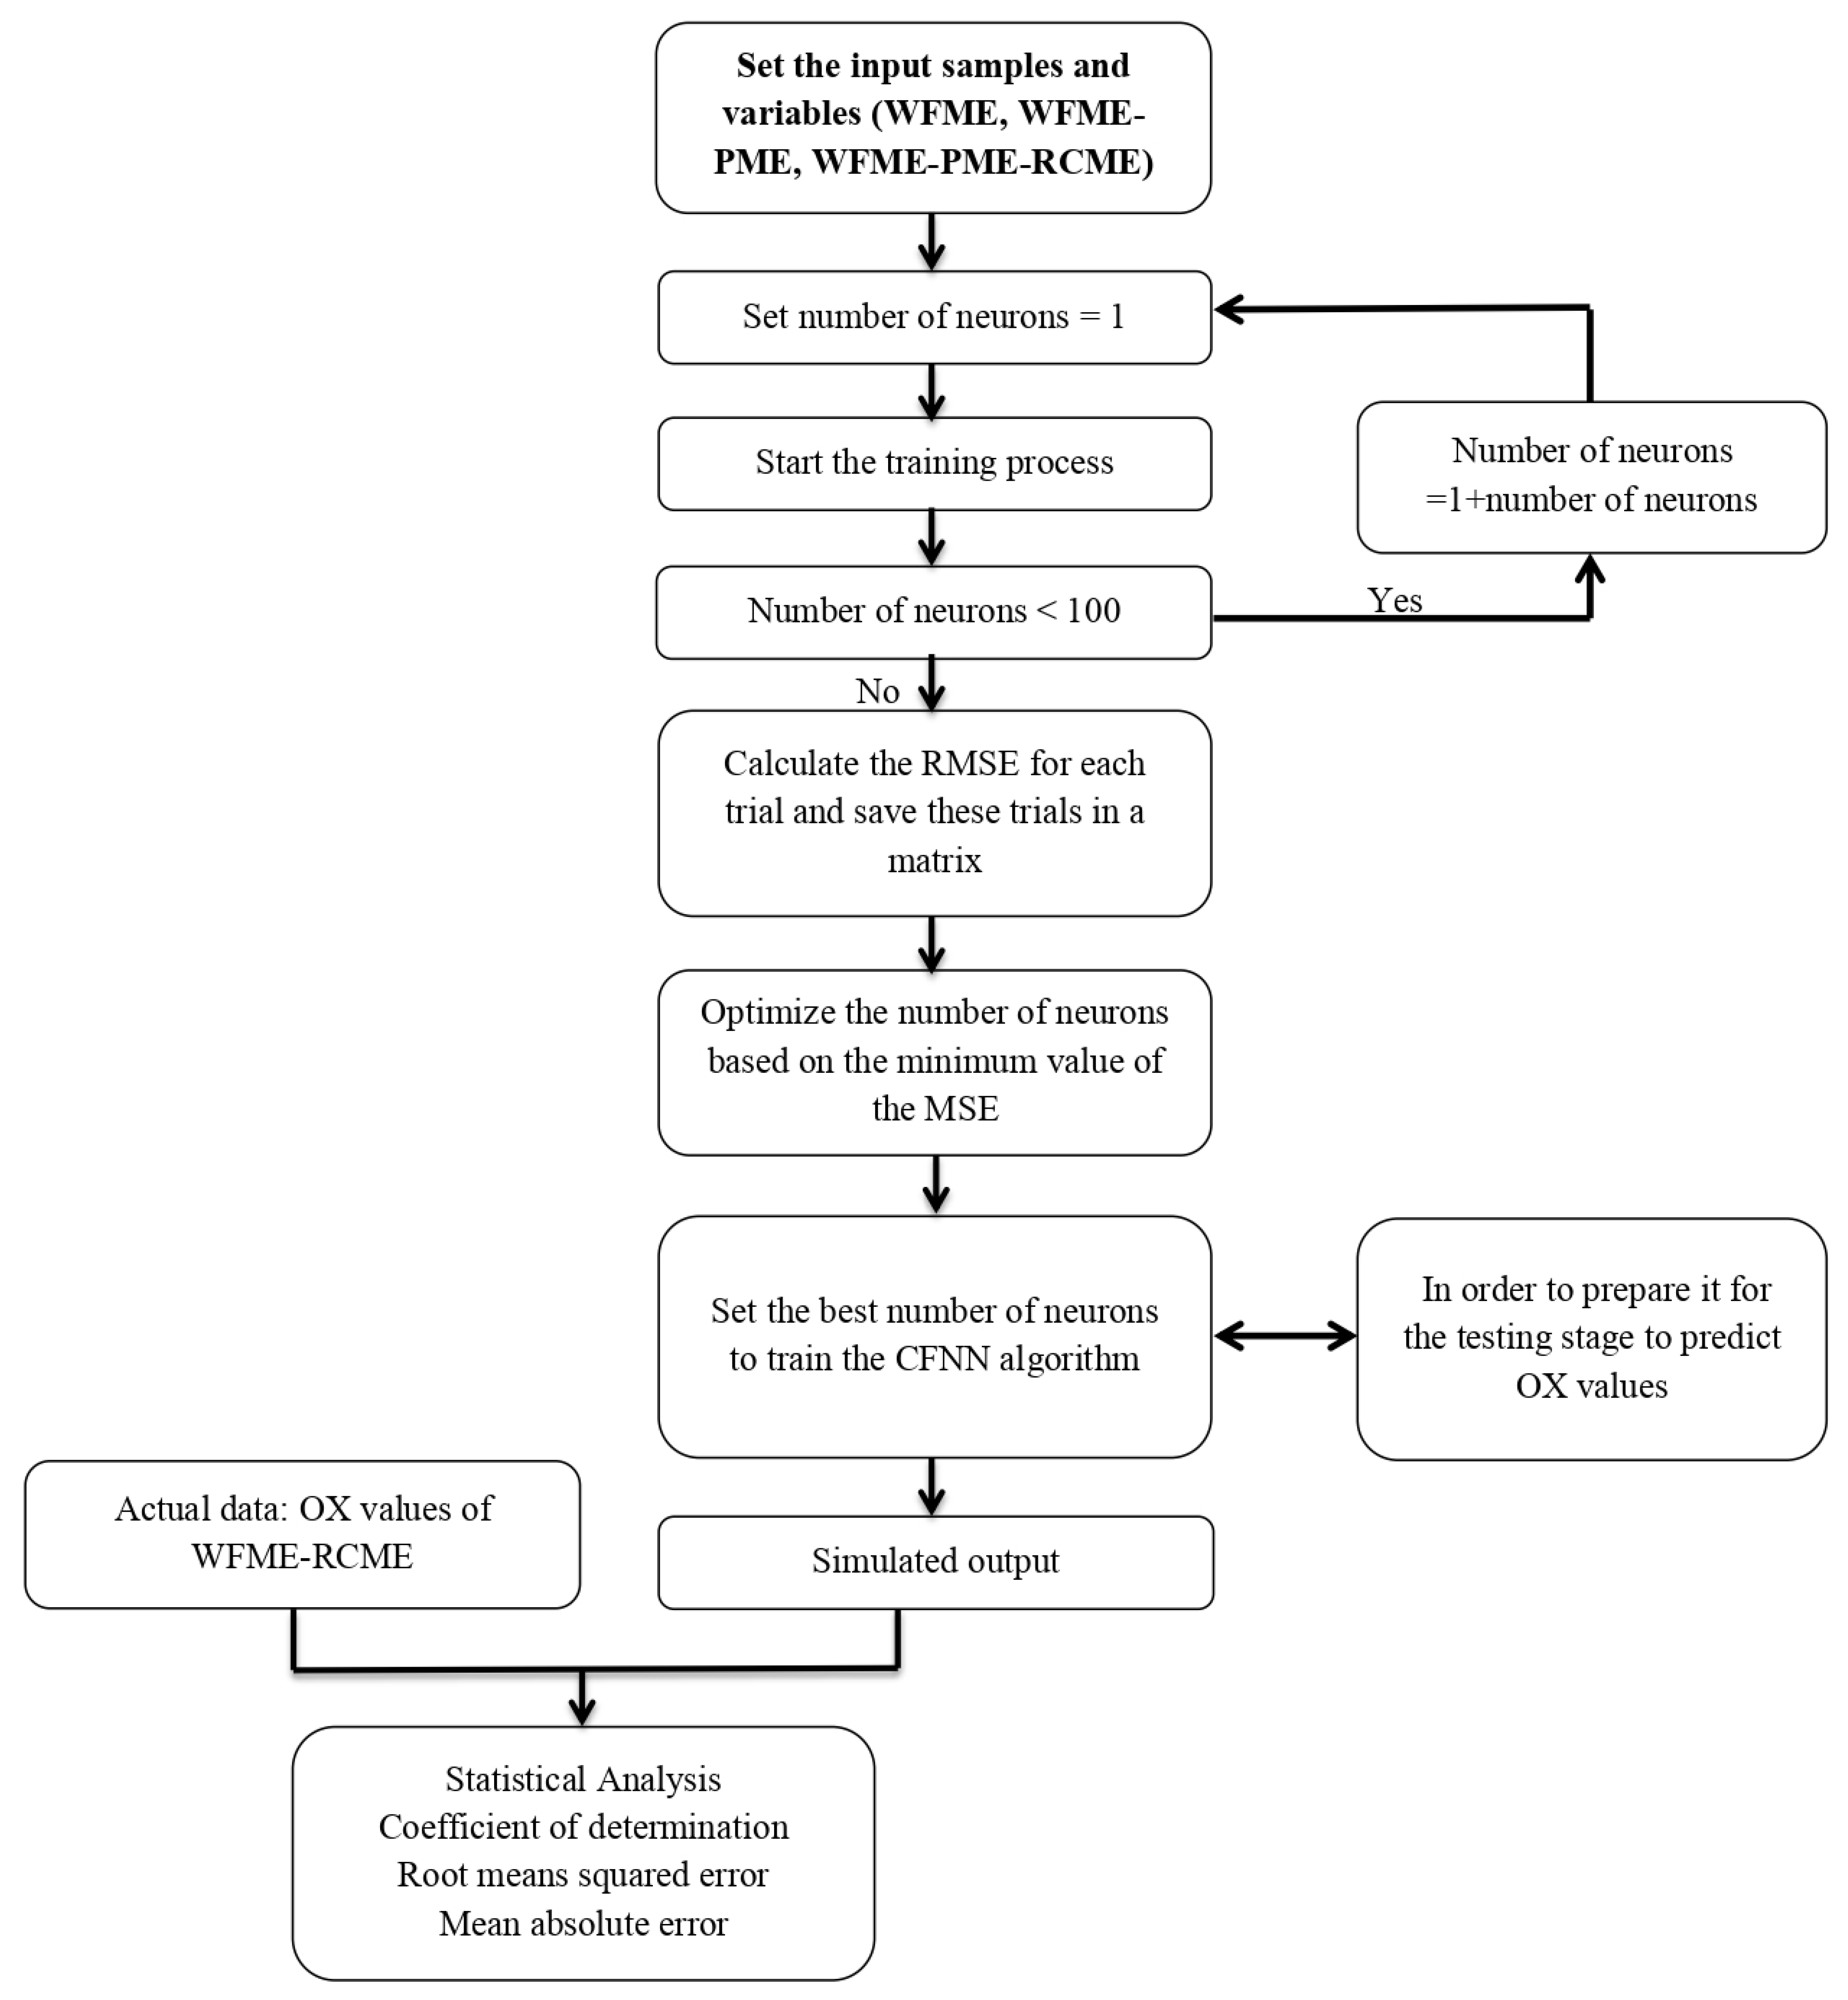
Cascade feedforward neural network (CFNN)
Figure 3 describes the steps of the proposed model (CFNN). CFNN represents a static neural network where the signals only move forward [43]. It is similar to a feedforward neural network, but it contains a connection from the input and every previous layer to the layers of the following layer [42,43,44]. The favorable position of this model is that it can convey the nonlinear association without getting rid of the linear association between input and output. The ideal number of neurons is established on the lowest value of RMSE. The description of the developed model was given in Kassem and Gokcekus [42].
(c) 
Radial basis neural networks (RBFNN)
RBFNN is a feedforward network, which includes one input, one hidden, and one output layer. It is used radial basis functions as activation functions [45]. Speed and efficiency are the most important advantages of RBFNN models compared to other multilayer perceptron models due to their simple structure. The description of the developed model was given in Kassem and Gokcekus [42]. Figure 4 illustrates the steps of the proposed model (RBFNN).
(d) 
Elmanneural network (ENN)
The ENN is a simple type of recurrent neural network. It includes four main layers: the input layer, context layer, hidden layer, and the output layer [46]. The main ENN structure is similar to the multilayer neural network. As stated earlier, there is a context layer in ENN where the inputs of this layer come about from outputs of the hidden layer, which was used to keep the hidden layer’s output values from the last time [47].

2.5.2. Poisson Regression Model (PRM)

Poisson regression is a generalized linear model (GLM) often utilized to imitate infrequent happenings and count data. Many academics in many different disciplines have employed PRM in their research work [48].
Two main assumptions have been made whilst using the Poisson Regression Model. The first is that the response variable follows a Poisson distribution.
P = e λ λ k k !
where P is the likelihood that k number of happenings will occur per interval of time and λ   is the happening rate. The second major assumption is that the response variable’s variance and mean are equal. Thus, only one parameter can define the likelihood distribution, λ [49].
The parameter, λ, is specified by the log-linear function
λ = e x p ( x i β )
where x i is a vector of input data for the time i and β is an accompanying vector of model parameters, which is further improved during training [49].

2.5.3. Model Performance Criteria

Coefficient of determination ( R 2 ), mean absolute error ( M S E ), root mean squared error ( R M S E ), mean absolute error ( M A E ), standard error of prediction ( S E P ), and average absolute deviation ( A A D ) were used to measure the estimation success of the models. The following equations were used for evaluation.
R 2 = 1 i = 1 n ( a a , i a p , i ) 2 i = 1 n ( a p , i a a , a v e ) 2  
M S E = 1 n i = 1 n ( a a , i a p , i ) 2
R M S E = 1 n i = 1 n ( a a , i a p , i ) 2
M A E = 1 n i = 1 n | a a , i a p , i |
S E P = 100 × R M S E a a , a v e
A A D = 100 n i = 1 n | a a , i a p , i | a a , i
where   n is the number of data, a p , i is the predicted values, a a , i is the actual values, a a , a v e is the average actual values, and i is the number of input variables.

3. Results

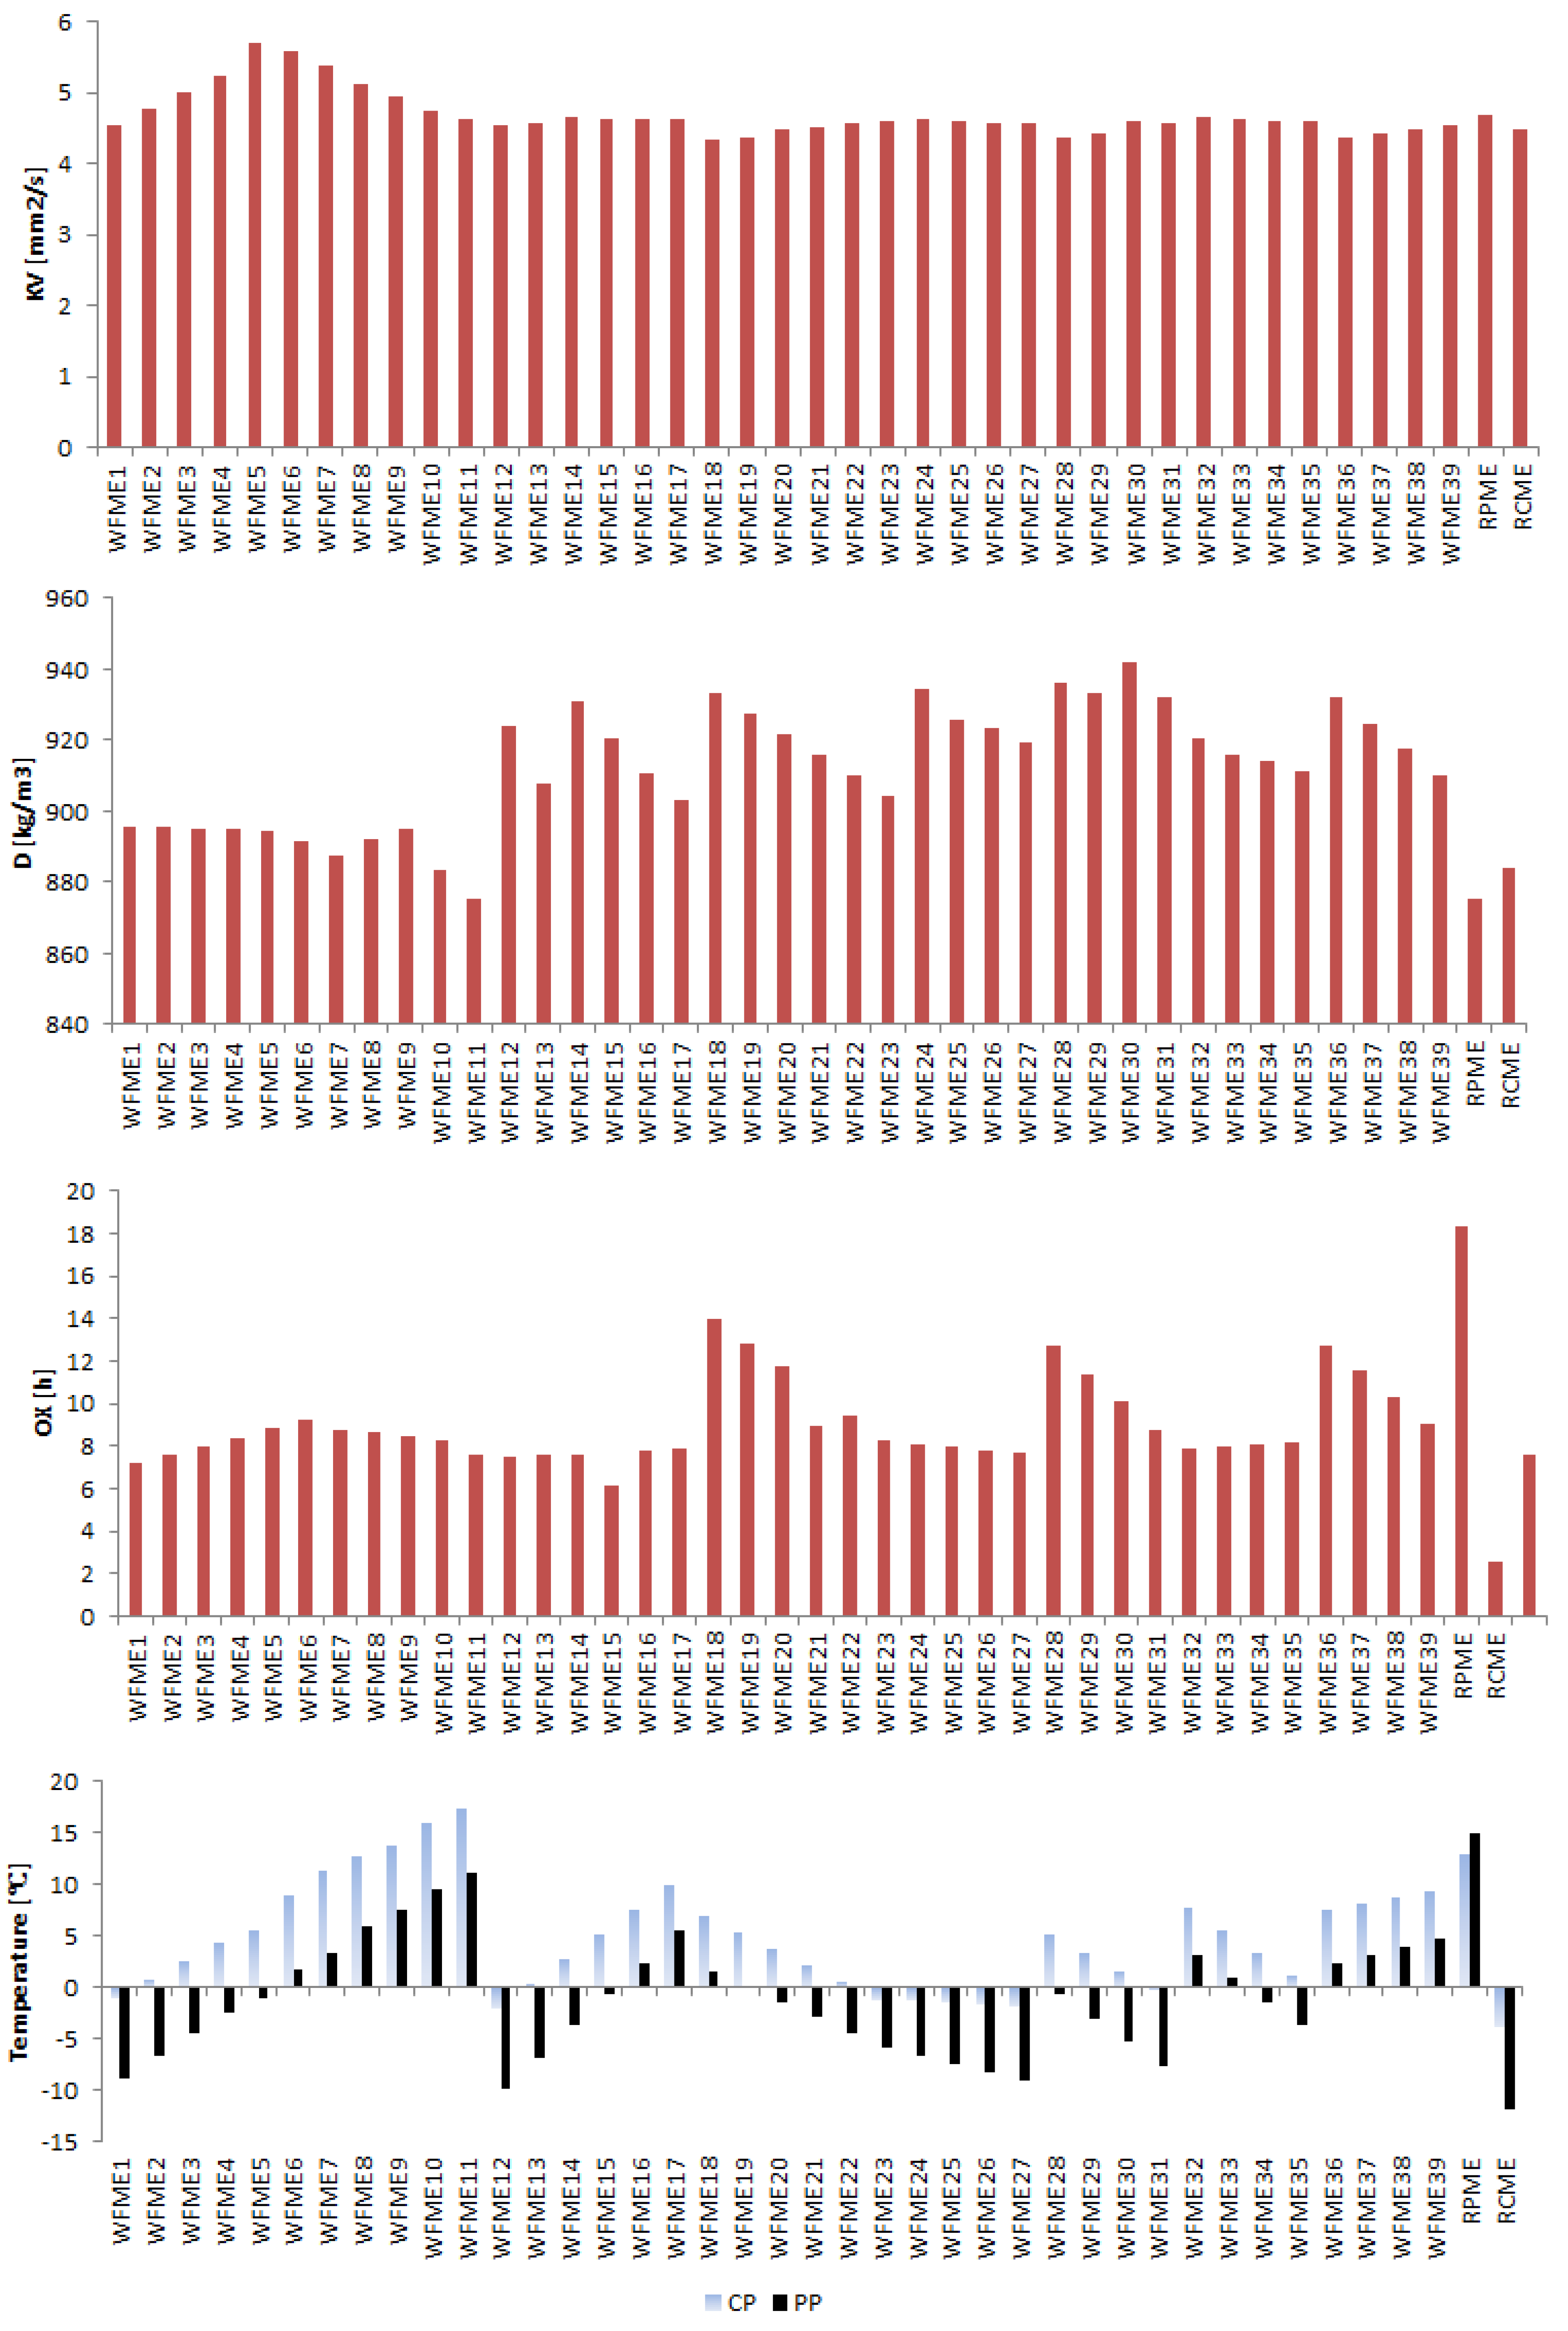
3.1. Fuel Properties

The properties of pure biodiesel samples, including kinematic viscosity (KV), density (D), oxidation properties (OX), cloud point (CP), and Pour point (PP), are illustrated in Figure 5. It should be noted that the KV and D were measured at 40 °C and 15 °C, respectively. It is found that the values of KV are within the range of 4.33–5.71 mm2/s, which met the standard required viscosity values at 40 °C of ASTM D445 (1.9–6.0 mm2/s). Additionally, in the case of the EN ISO 3104 standard (3.5–5.0 mm2/s), it is found that the KV value of WFME3, WFME4, WFME5, WFME6, WFME7, and WFME8 was above the maximum limit of the specification in the standard. These results were in agreement with previous reports on the KV value of WFME, PME, and RCME [28,50,51,52,53,54,55,56,57,58,59,60,61,62,63,64,65]. Additionally, it was found that all density values of biodiesel samples were above the minimum recommended value of ASTM D854 (860 kg/m3 at 15 °C), as shown in Figure 2. Additionally, in the case of EN14214 standard (recommended values: 860–900 kg/m3 at 15 °C), WFME1, WFME2, WFME3, WFME4, WFME5, WFME6, WFME7, WFME8, WFME9, WFME10, WFME11, PME, and RCME were below the maximum specified limit in standard. Compared with other literature results, it is noticed that these results (Figure 2) agreed with previous reports on the density of WFME, PME, and RCME [28,29,30,39,62,66,67,68].
Furthermore, it is observed that the minimum and maximum stability values were recorded for WFME15 (6.17 h) and PME (18.35 h), respectively, as shown in Figure 5. Additionally, it is noticed that all oxidation stability values of biodiesel samples were above the minimum specified limit in ASTM D6751 (>3.0 h) and EN 14214 (>6.0 h), while the OX value of WFME4–WFME10, WFME18–WFME24, WFME28–WFME39, and PME were above the minimum limit specified in EN 14214:2014 (≥8 h). These observations can be supported by other scientific researchers who measured the OX of biodiesel derived from waste frying oil, palm oil, and refined canola oil [29,68,69,70].
The acquired CP and PP values for the samples were plotted and are shown in Figure 5. It can be seen that CP and PP values were between −4.0–17.4 °C and −12.0–15.0 °C, respectively. The CP and PP values for WFME11 and PME were much higher due to the existence of a higher proportion of SFAME. It is a fact that the melting point is inversely related to double bond content; as the former increases, the latter decreases. Many scientific researchers have identified resembling cases [28,39,50,51,68].
Moreover, in this work, PME and RCME were added to the WFME samples to enhance the oxidation stability and cold flow properties (CP and PP). The KV, D, OX, CP, and PP of the sampled WFME-PME, WFME-RCME, and WFME-PME-RCME are illustrated in Figures S1–S3 as Supplementary Material, respectively. It is found that the values of KV are varied from 4.47 mm2/s (P20WFME18) to 5.60 (P20WFME38) for WFME-PME, 4.43 mm2/s (R20WFME18) to 5.56 mm2/s (R20WFME5) for WFME-RCME, and 4.480 mm2/s (RC20P20WFME18) to 5.38 mm2/s (R20P20WFME5) for WFME-PME-RCME. These values were met the standard required kinematic viscosity values at 40 °C of ASTM D445 (1.9–6.0 mm2/s). It should be mentioned that composing blending was carried out as BXWFMEY, where letter B depicts the sort of biodiesel mixed with WFME (P: PME, R: RCME), X is the Mass fraction of biodiesel in WFMEY mixtures, and Y is the number of specimens.
For example, R20P40WFME17 corresponded to a 20% concentration of RCME added to the blend of P40WFME17 (40% concentration of PME added to WFME 17). Additionally, it observed that PME and RCME could be mixed up to 80% with WFME samples without exceeding the standard accepted ratio for biodiesel density.
Furthermore, the initial OX of the WFME samples was above the minimum value specified limit in ASTM D6751 (>3.0 h) and EN 14214 (>6.0 h). In contrast, the OX value of RCME was not satisfactory according to the oxidative stability specification listed in ASTM D6751 and EN 14214. In contrast, the OX value of PME has met the recommended oxidation stability specification in EN 14214:2014 (≥8 h) due to the high percentage of SFAM. Based on the results, it is observed that it was necessary to add a high proportion of PME to the WFME samples having low OX values would help to increase the OX stability to meet the recommended oxidation stability specification in EN 14214:2014 (≥8 h). In addition, mixing WFME18 with RCME helped increase the OX stability from 2.60 h (RCME) to 11.70 (RC20 WFME18) and improved the cold flow properties of the WFME samples and WFME-PME samples, as shown in Figures S1–S3 as Supplementary material.

3.2. Empirical Models

As mentioned previously, four neural network models were employed to predict the oxidation stability of the biodiesel samples. Thus, the concentration amount of WFME, PME, and RCME in the mixture, the value of total saturated, total monounsaturated, total polyunsaturated, very-long-chain fatty acid, degree of unsaturation, long-chain saturated factor, kinematic viscosity, density, cloud point, and pour point were used as explanatory input variables. The data were divided into training and testing groups and the results by the models were compared with each other. In this study, the data are divided into about 70% of the collect data (353 data) for training and the remaining data (156 data) for testing. The training was done using data for WFME, WFME-PME, and WFME-PME-RCME, and the developed model was used to predict the oxidation stability of WFME-RCME, then compared with the actual data obtained by performing laboratory tests on actually prepared WFME-RCME samples. The summary statistics, including standard deviation (SD), coefficient of variation (CV), minimum (Min.), and maximum (Max.) of the selected variables, are listed in Table 2.
Moreover, three conditions were considered in the model development of empirical models with different input combinations and are utilized for training the model to identify the best variety of inputs to estimate the oxidation stability of biodiesel. Several empirical models with various possible combinations of the used inputs were built in this work. Next, they were trained respectively, and then the performance of these models was estimated. The best models that gave the highest performance are shown in Table 3.

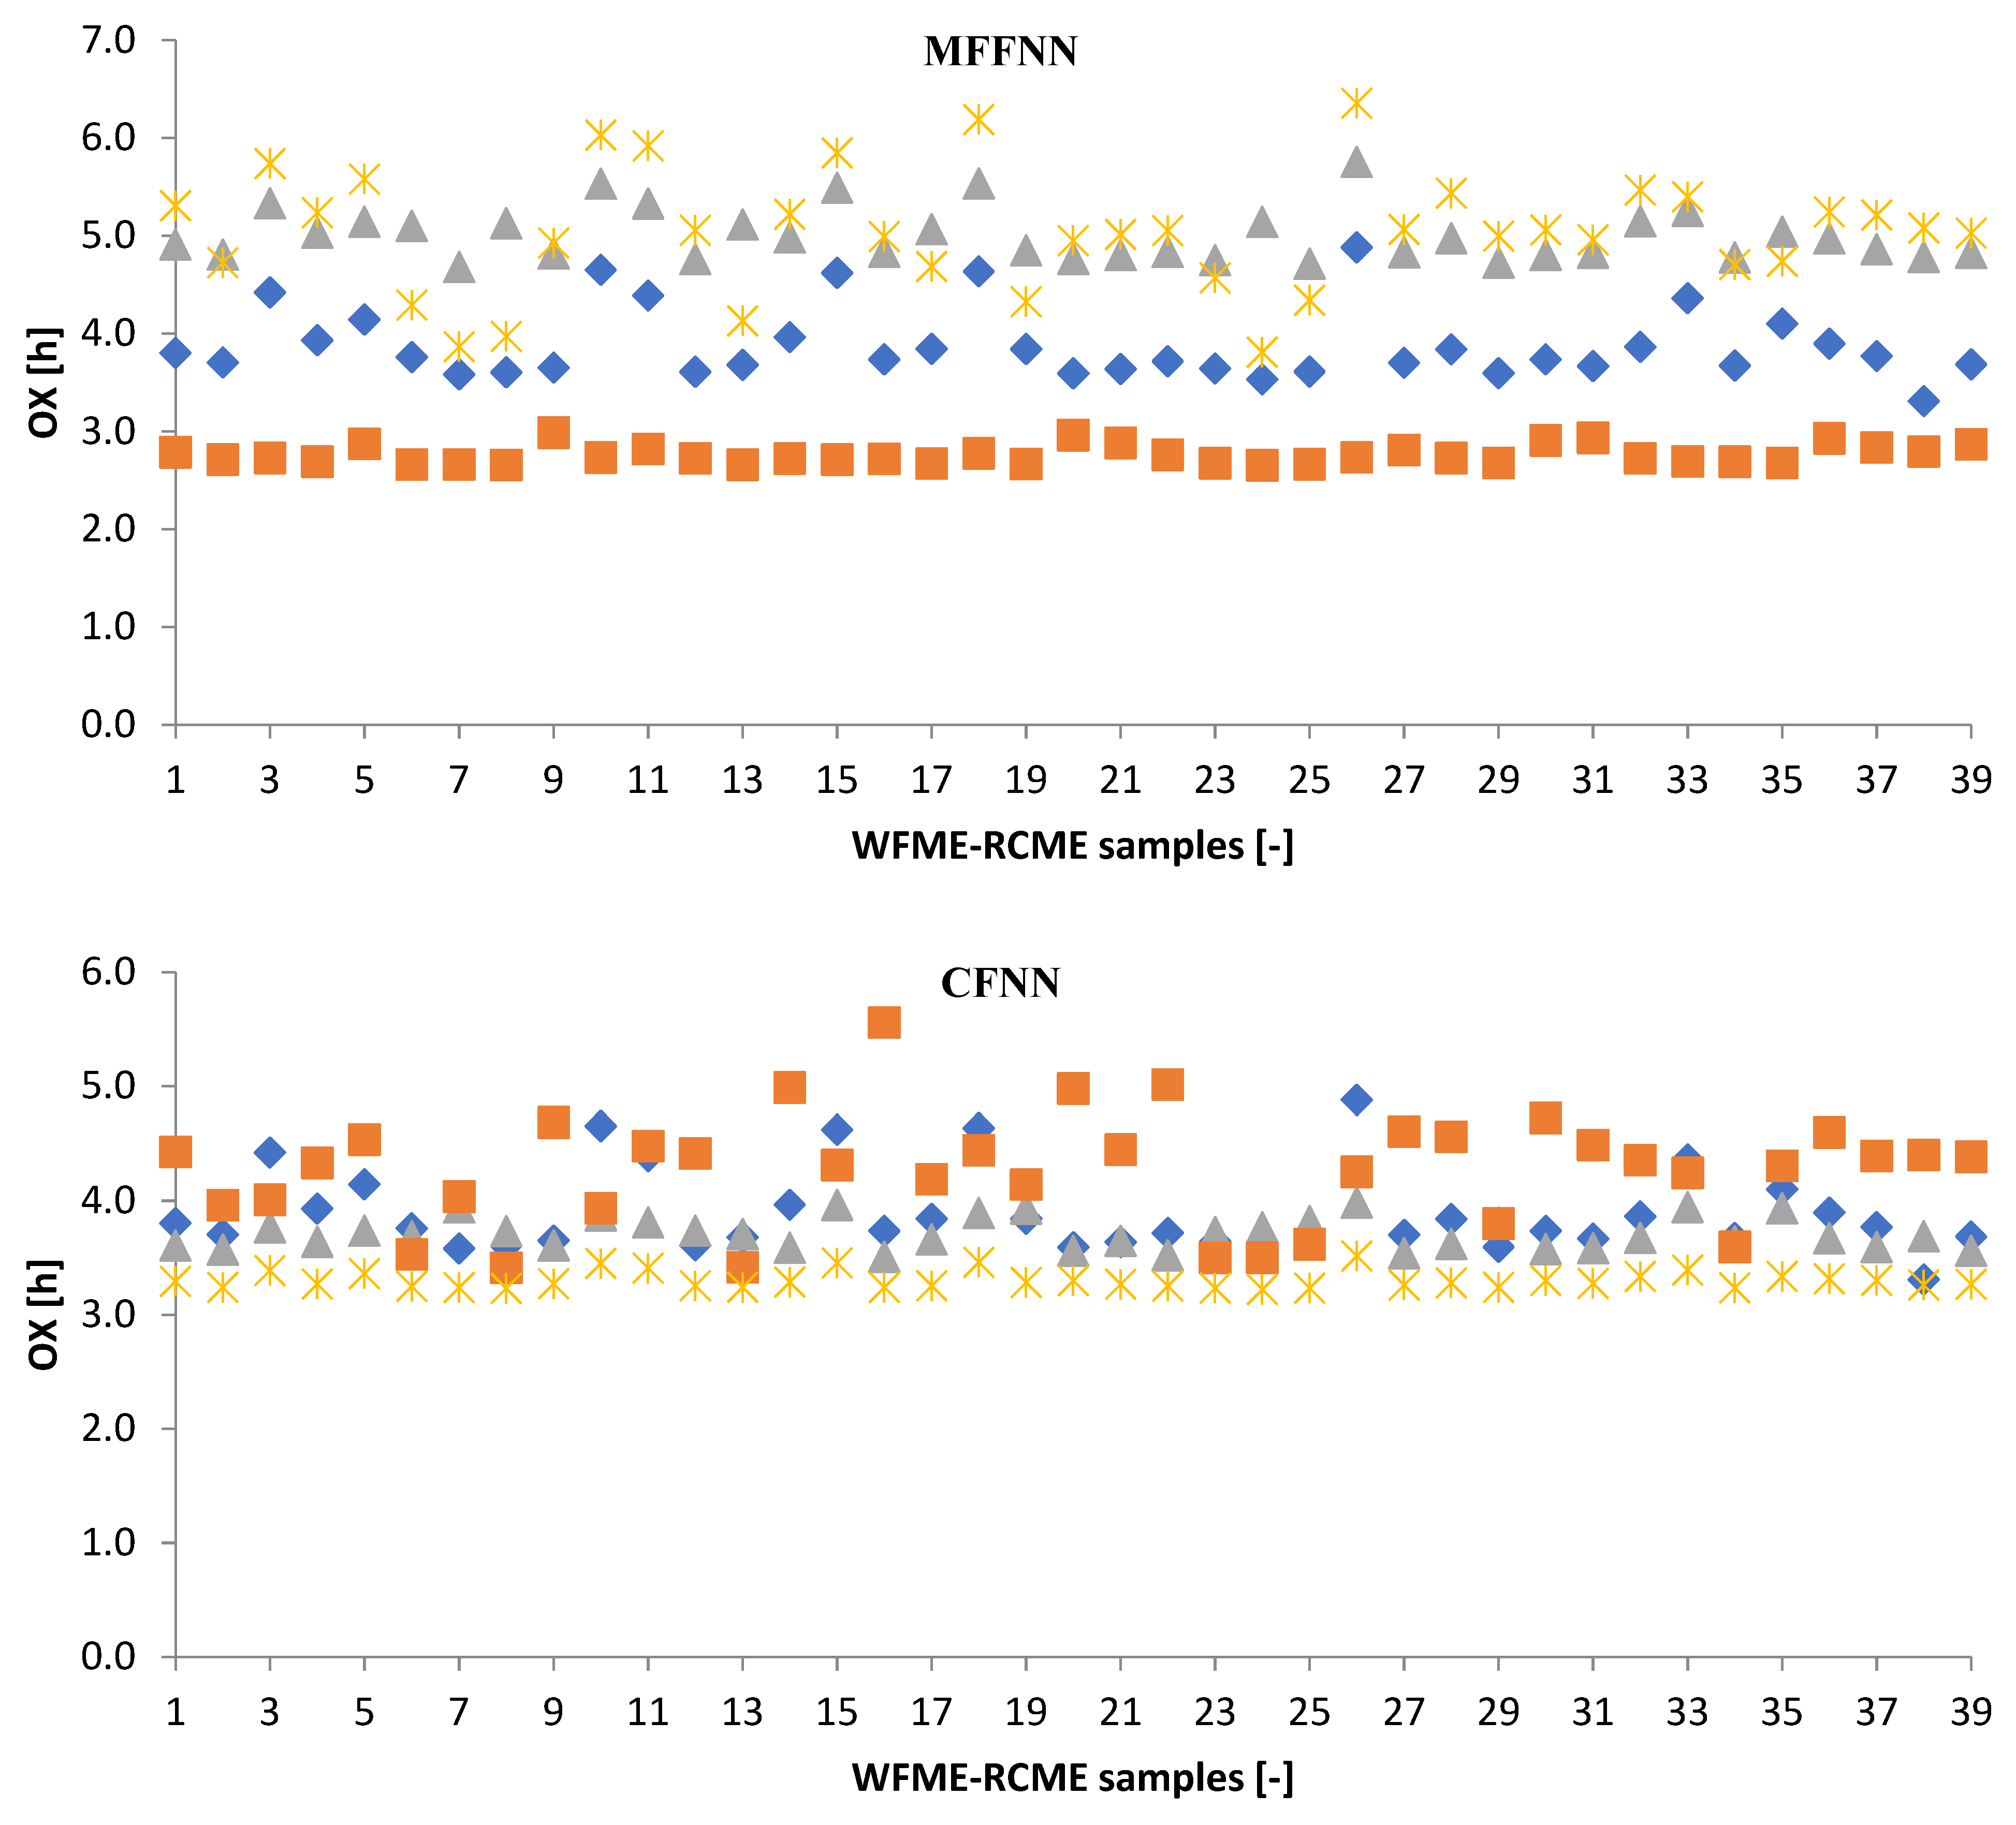
3.2.1. Machine Learning Models

A string of models were studied to reasonably guess the best number of hidden layers (HL), the number of neurons (NN), and transfer function (TF) for the MFFNN, CFNN, and ENN models. It should be mentioned that the number of HLs and NNs in the MFFNN, CFNN, and ENN models were established by using trial and error methods.
Based on the value of MSE, it was found that one hidden layer and five neurons are selected as the best for the MFFNN model (5:1:1). At the same time, it was found that one hidden layer and ten neurons were chosen as an optimum number for the CFNN model (5:1:1). Additionally, it was observed that the ENN model (5:1:1) with eight and ten neurons has the minimum MSE. Table 4 shows the best number of hidden layers (HL) and neuron (NN)s and the activation function (AF) that was chosen for each ANN model.
Furthermore, the 10th order root of the input data was utilized instead of the actual input data to better perform for the RBFNN model. This assists in evening out the variation of the input data points inside a narrow span, and this gives better precision of the applied model. The data points were haphazardly split into training and testing subcategories. This process was executed many times to stop the gathering of data points in the preferred domain of the problem and allow even spread of data points inside the training and testing subcategories. Typically, the distribution and the maximum number of neurons (MNN) have great significance in the fabric of RBFNN, as the performance and the values of these parameters crucially influence the precision of the applied model.
Similarly, the optimum values of these parameters were estimated by a trial and error approach. It was observed that the optimum values that provide the most accurate performance for the RBFNN model are 0.002 and 230 for the spread and MNN, respectively. In general, R-squared was used to evaluate the performance of artificial models. R-squared means the degree of the linear relationship between the observed and modeled values. The line is almost straight with a 45° angle, and this proves the accuracy of the provided model. For the training phase, the R-squared value was found to be approximately 0.99, as shown in Table 4. The results obtained from the ANN models show that the use of ANN is enough to predict the oxidation stability of biodiesel.

3.2.2. Poisson Regression Model (PRM)

The developed PRM was implemented to predict the oxidation stability of WFME-RCME. The data of the concentration amount of WFME, PME, and RCME in the mixture, the value of total saturated, total monounsaturated, total polyunsaturated, very-long-chain fatty acid, degree of unsaturation, long-chain saturated factor, kinematic viscosity, density, cloud point, and pour point were used to generate a mathematical equation as given in Table 5. The actual data results and the corresponding values predicted by Equations (Table 5) are displayed in Figure 6. To test the fit of the model, R-squared was determined. For higher modeling accuracy, the R-squared value should be closer to 1. In this case, the values of R-squared for training data were within the range of 0.9769–0.9811 for all proposed models.

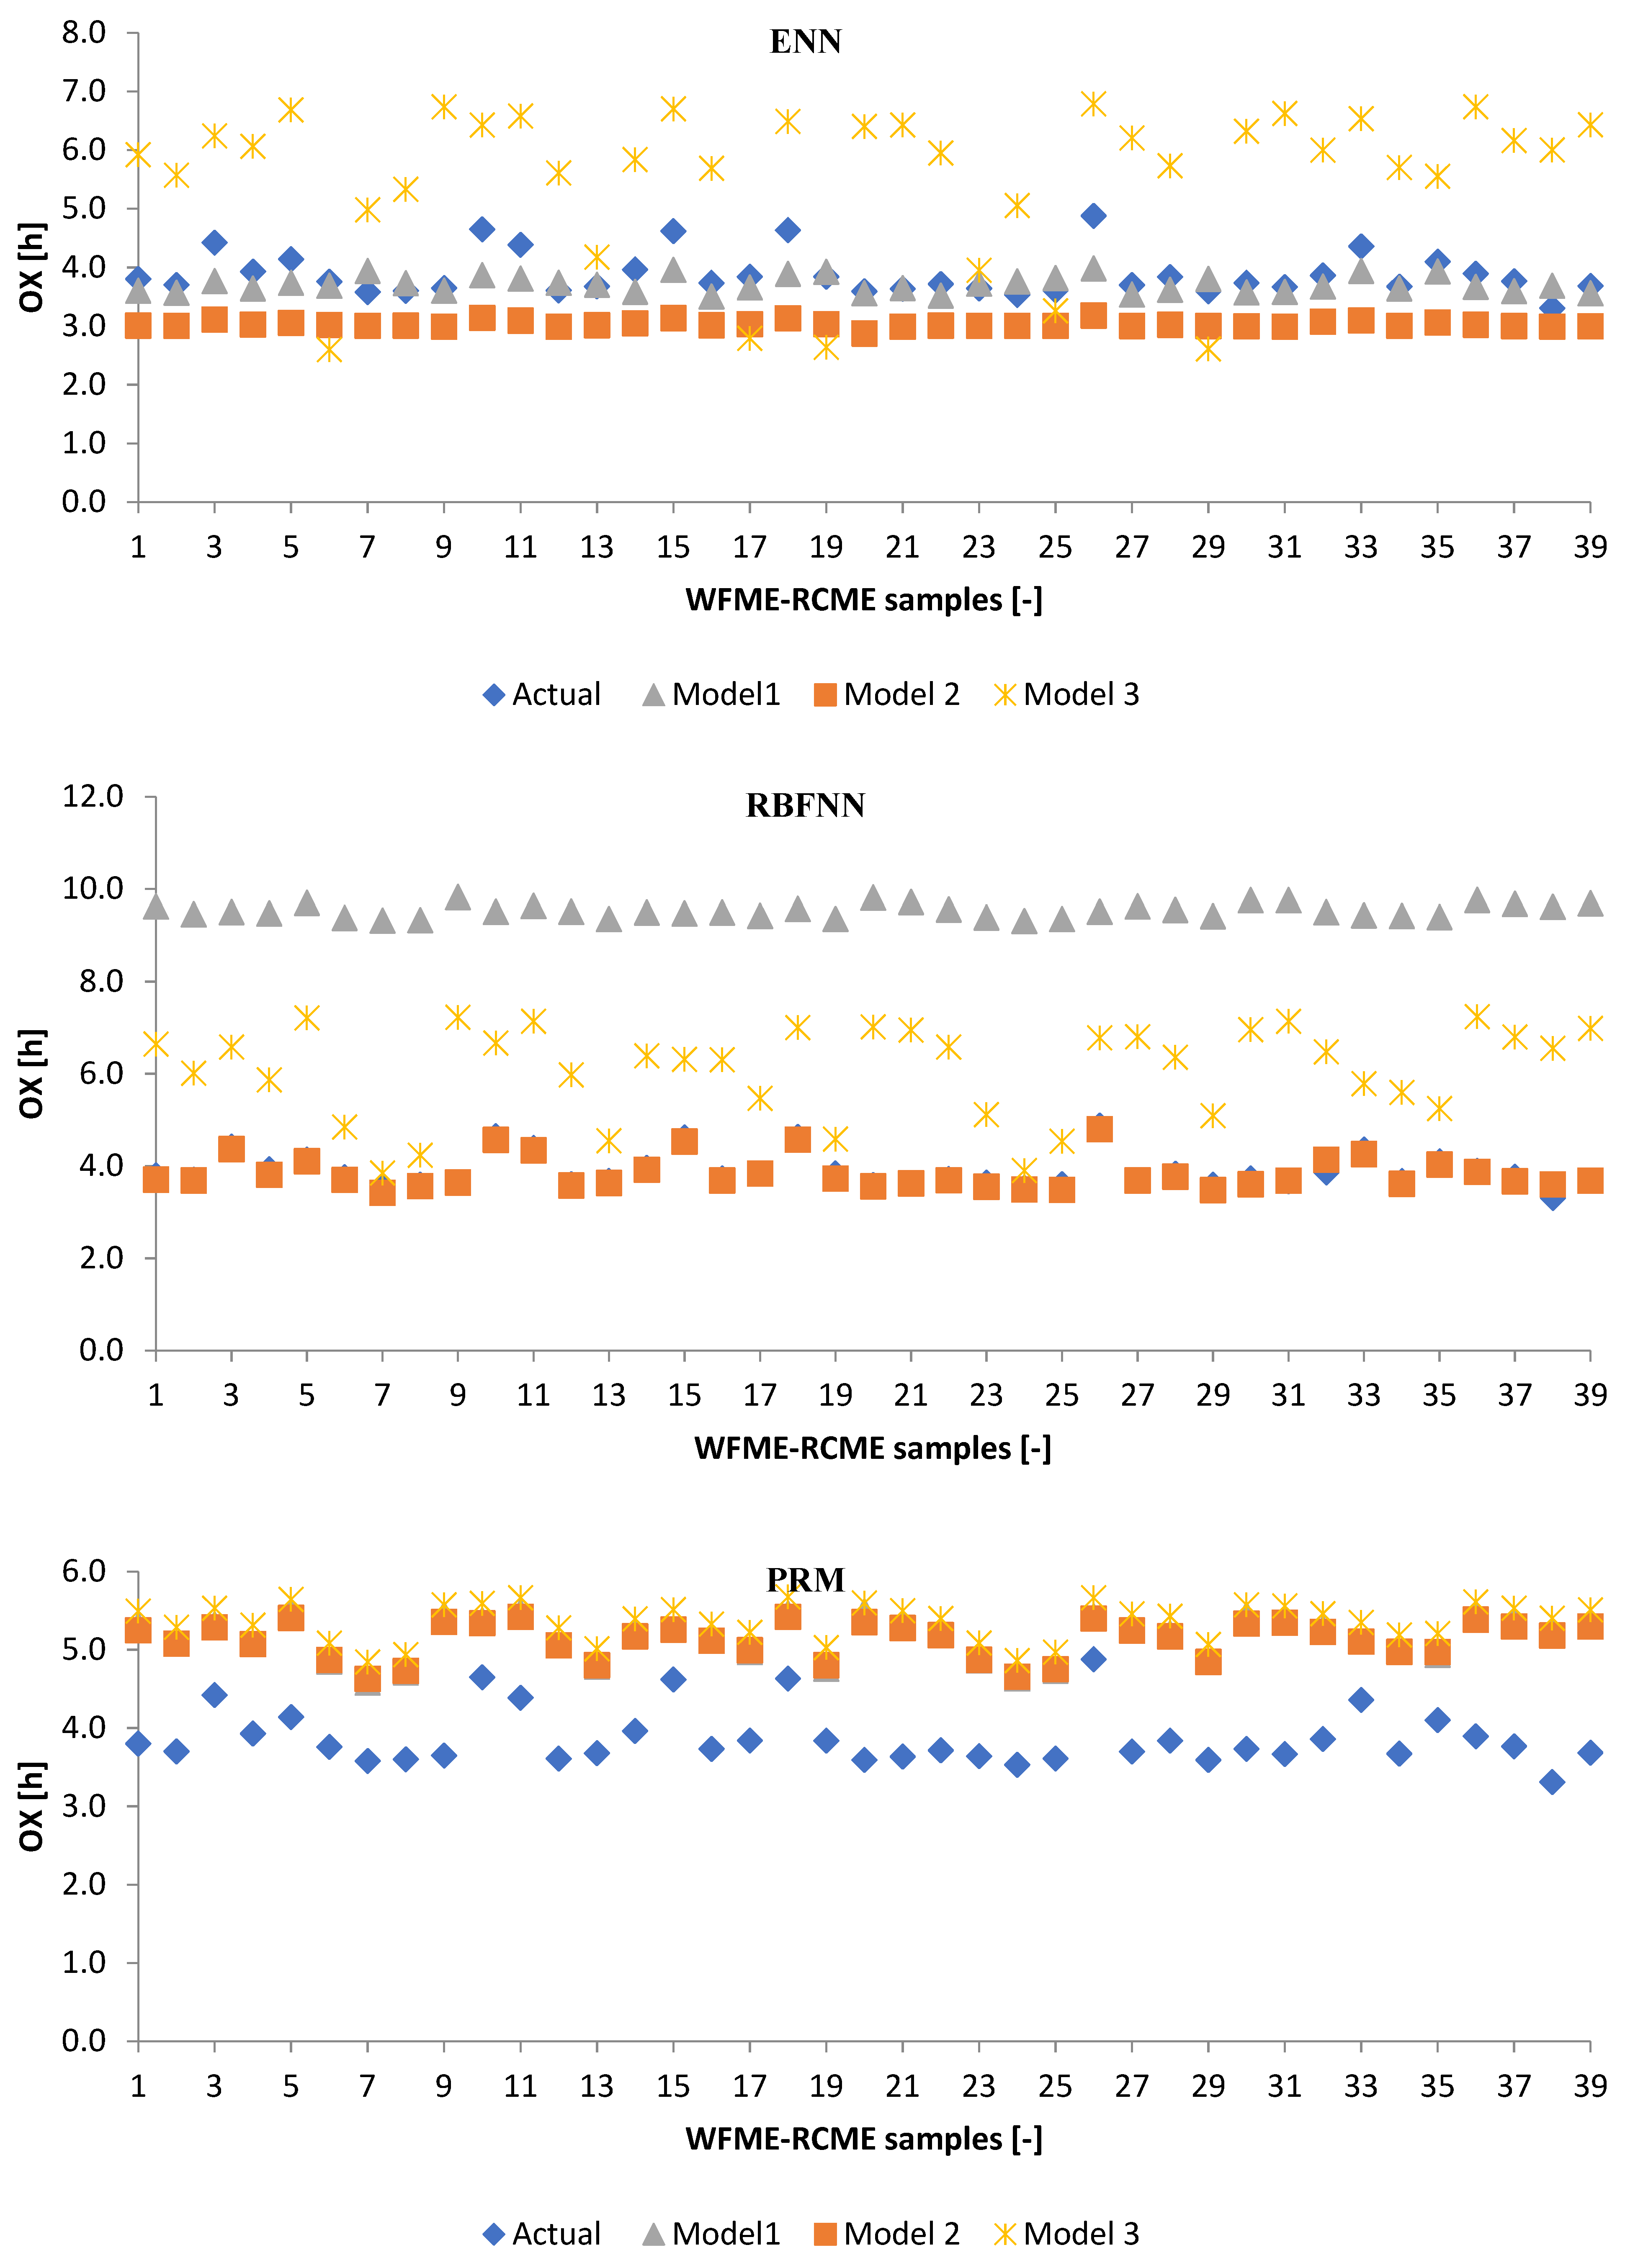
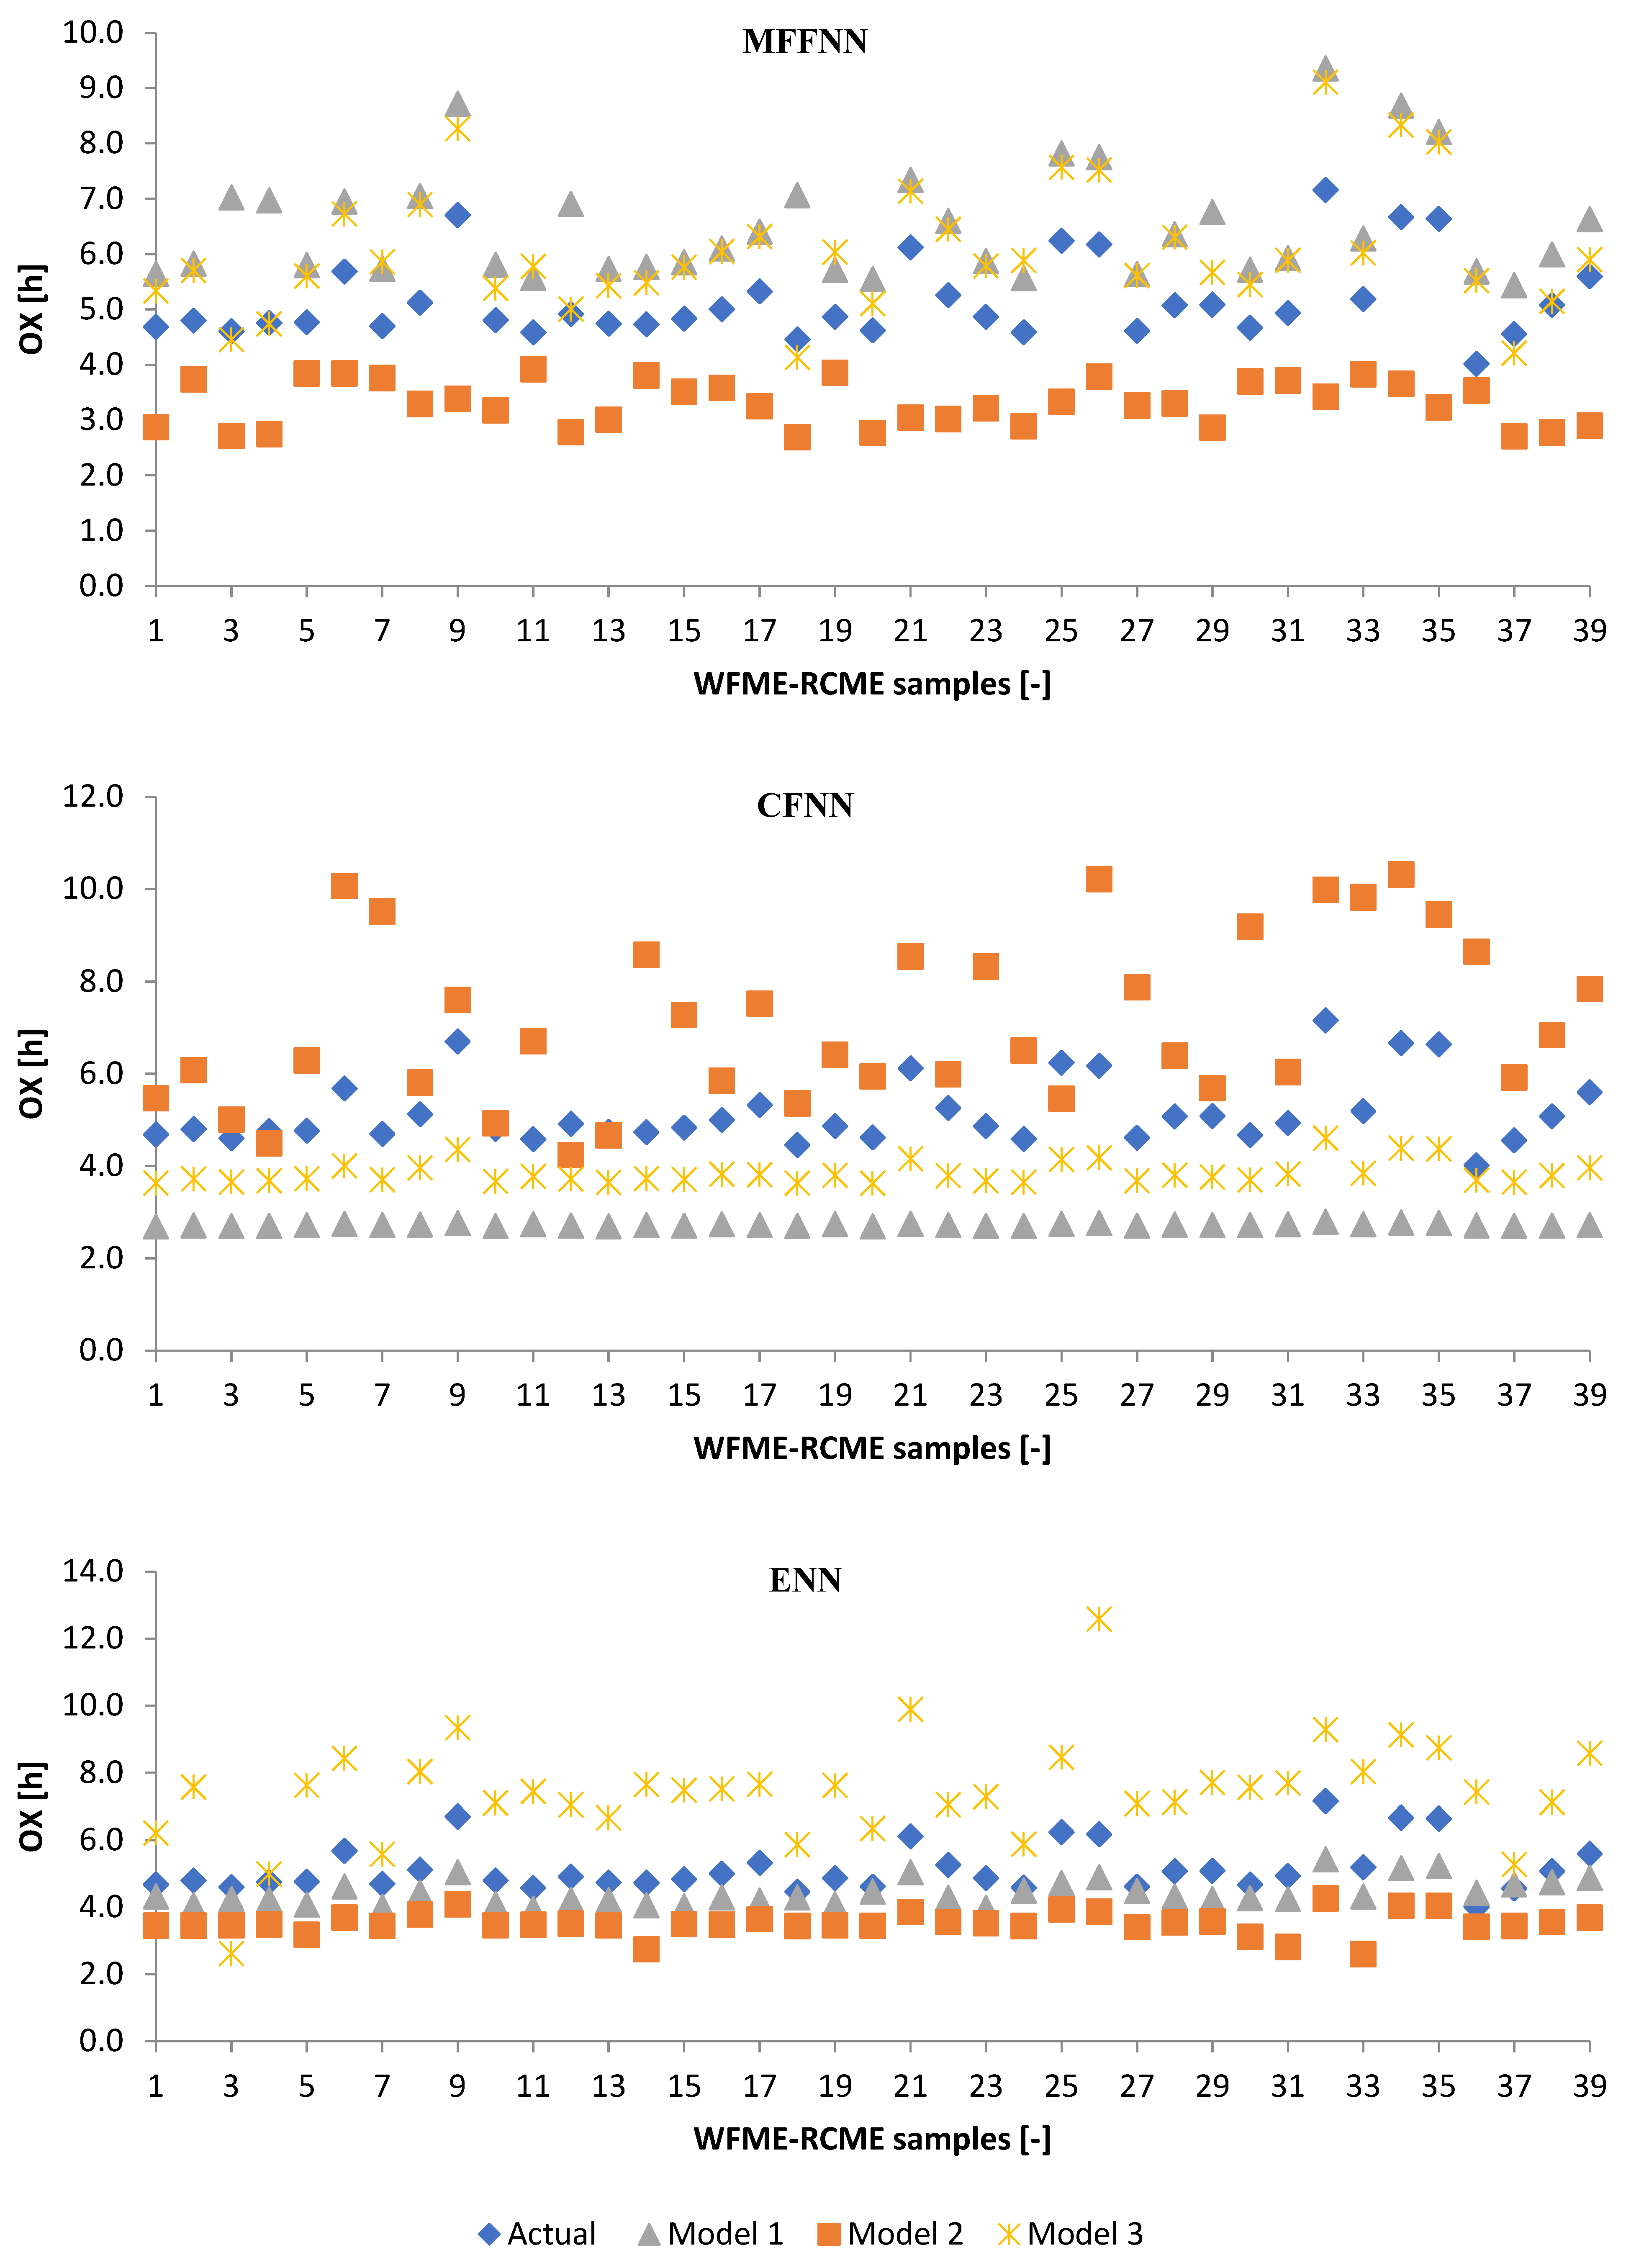
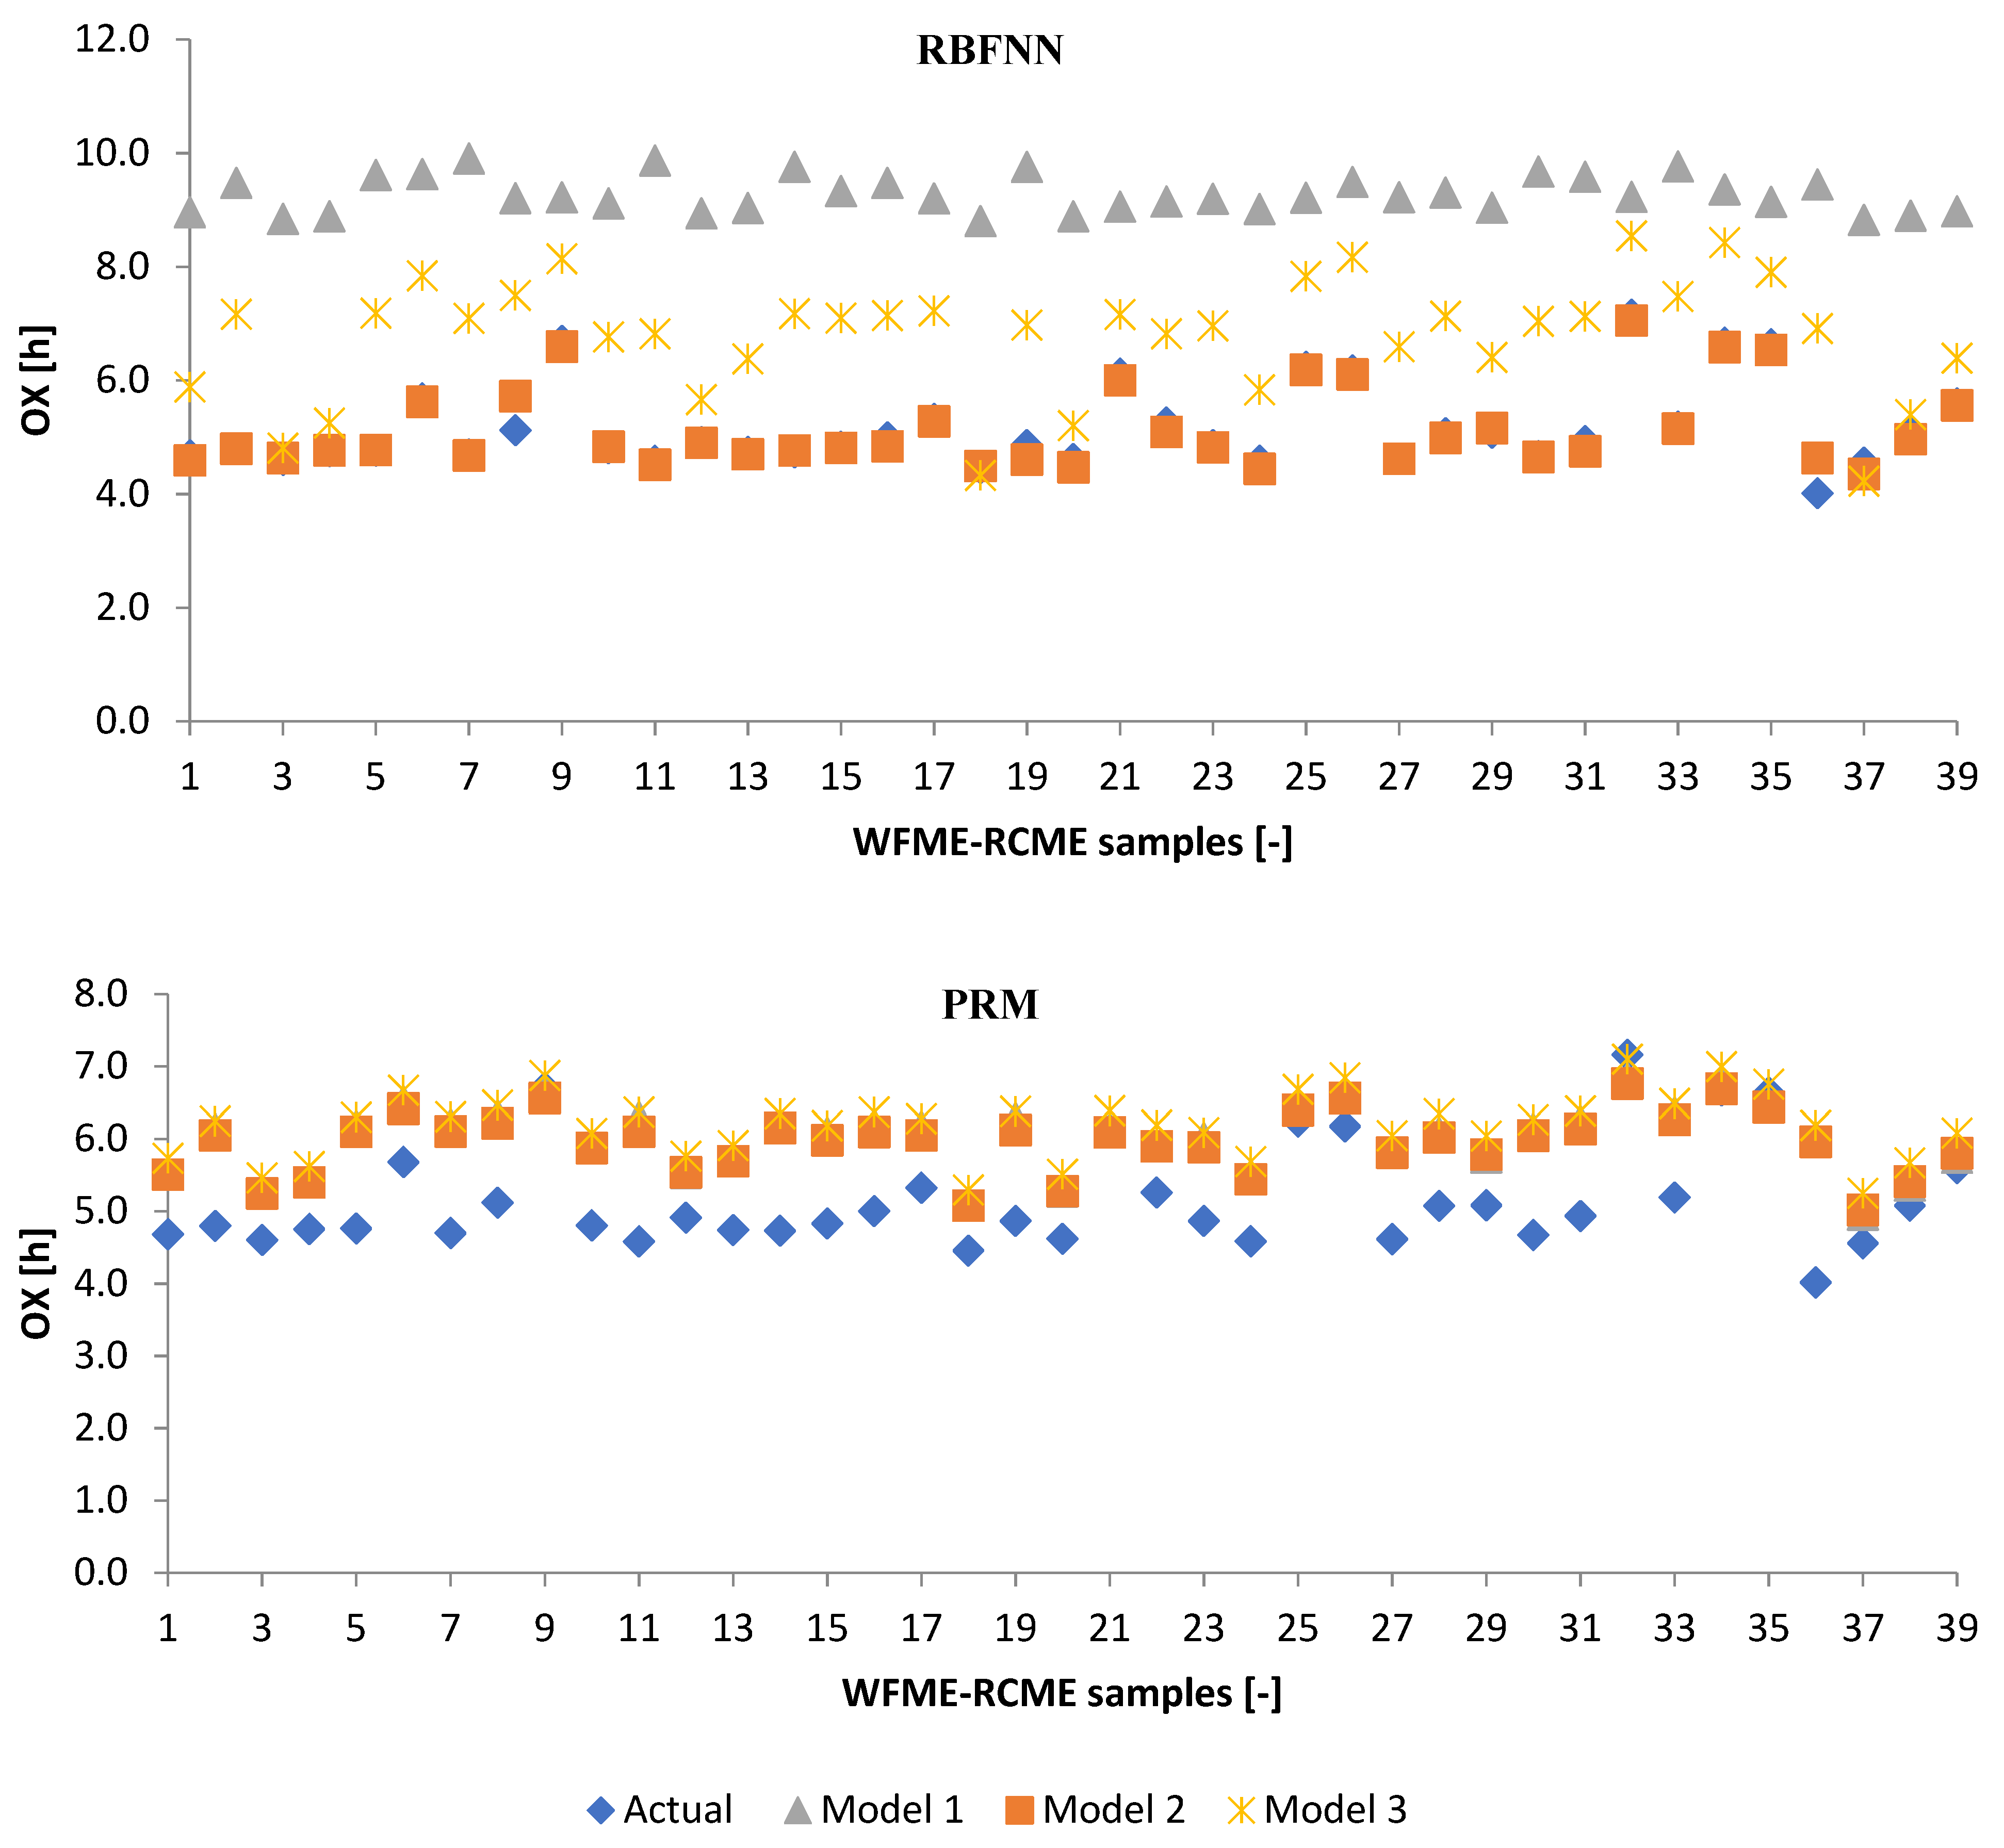
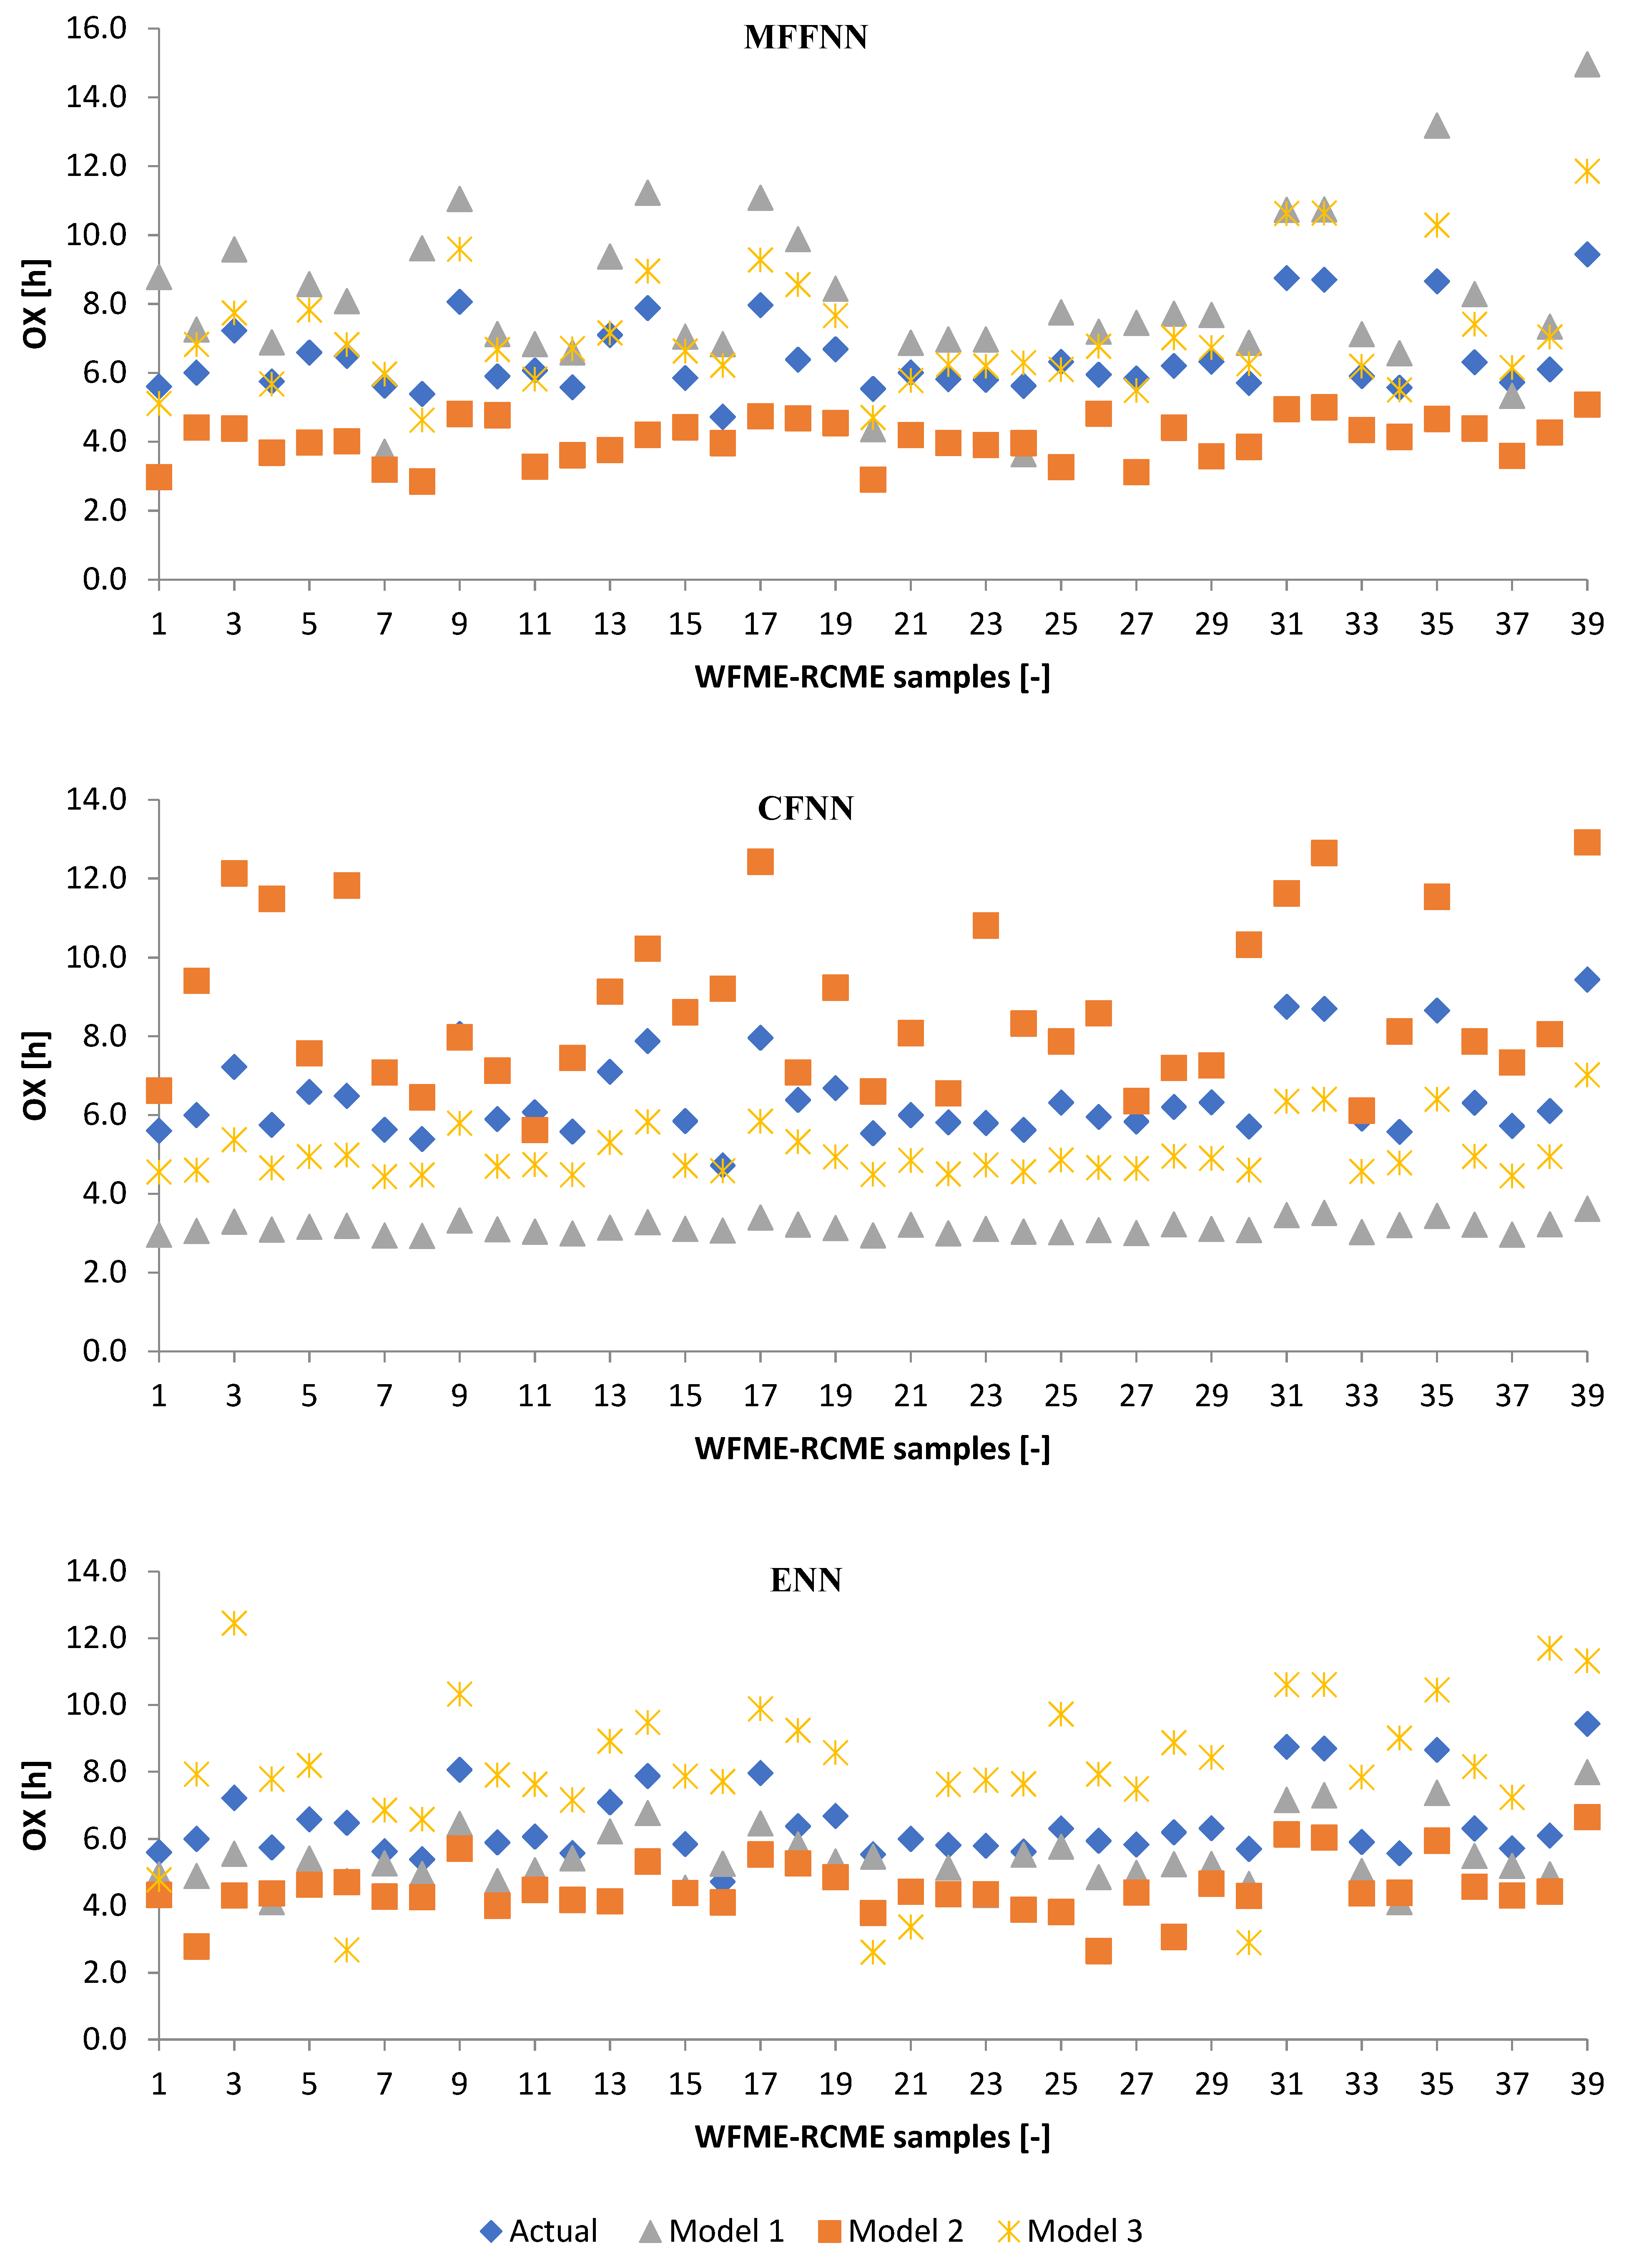
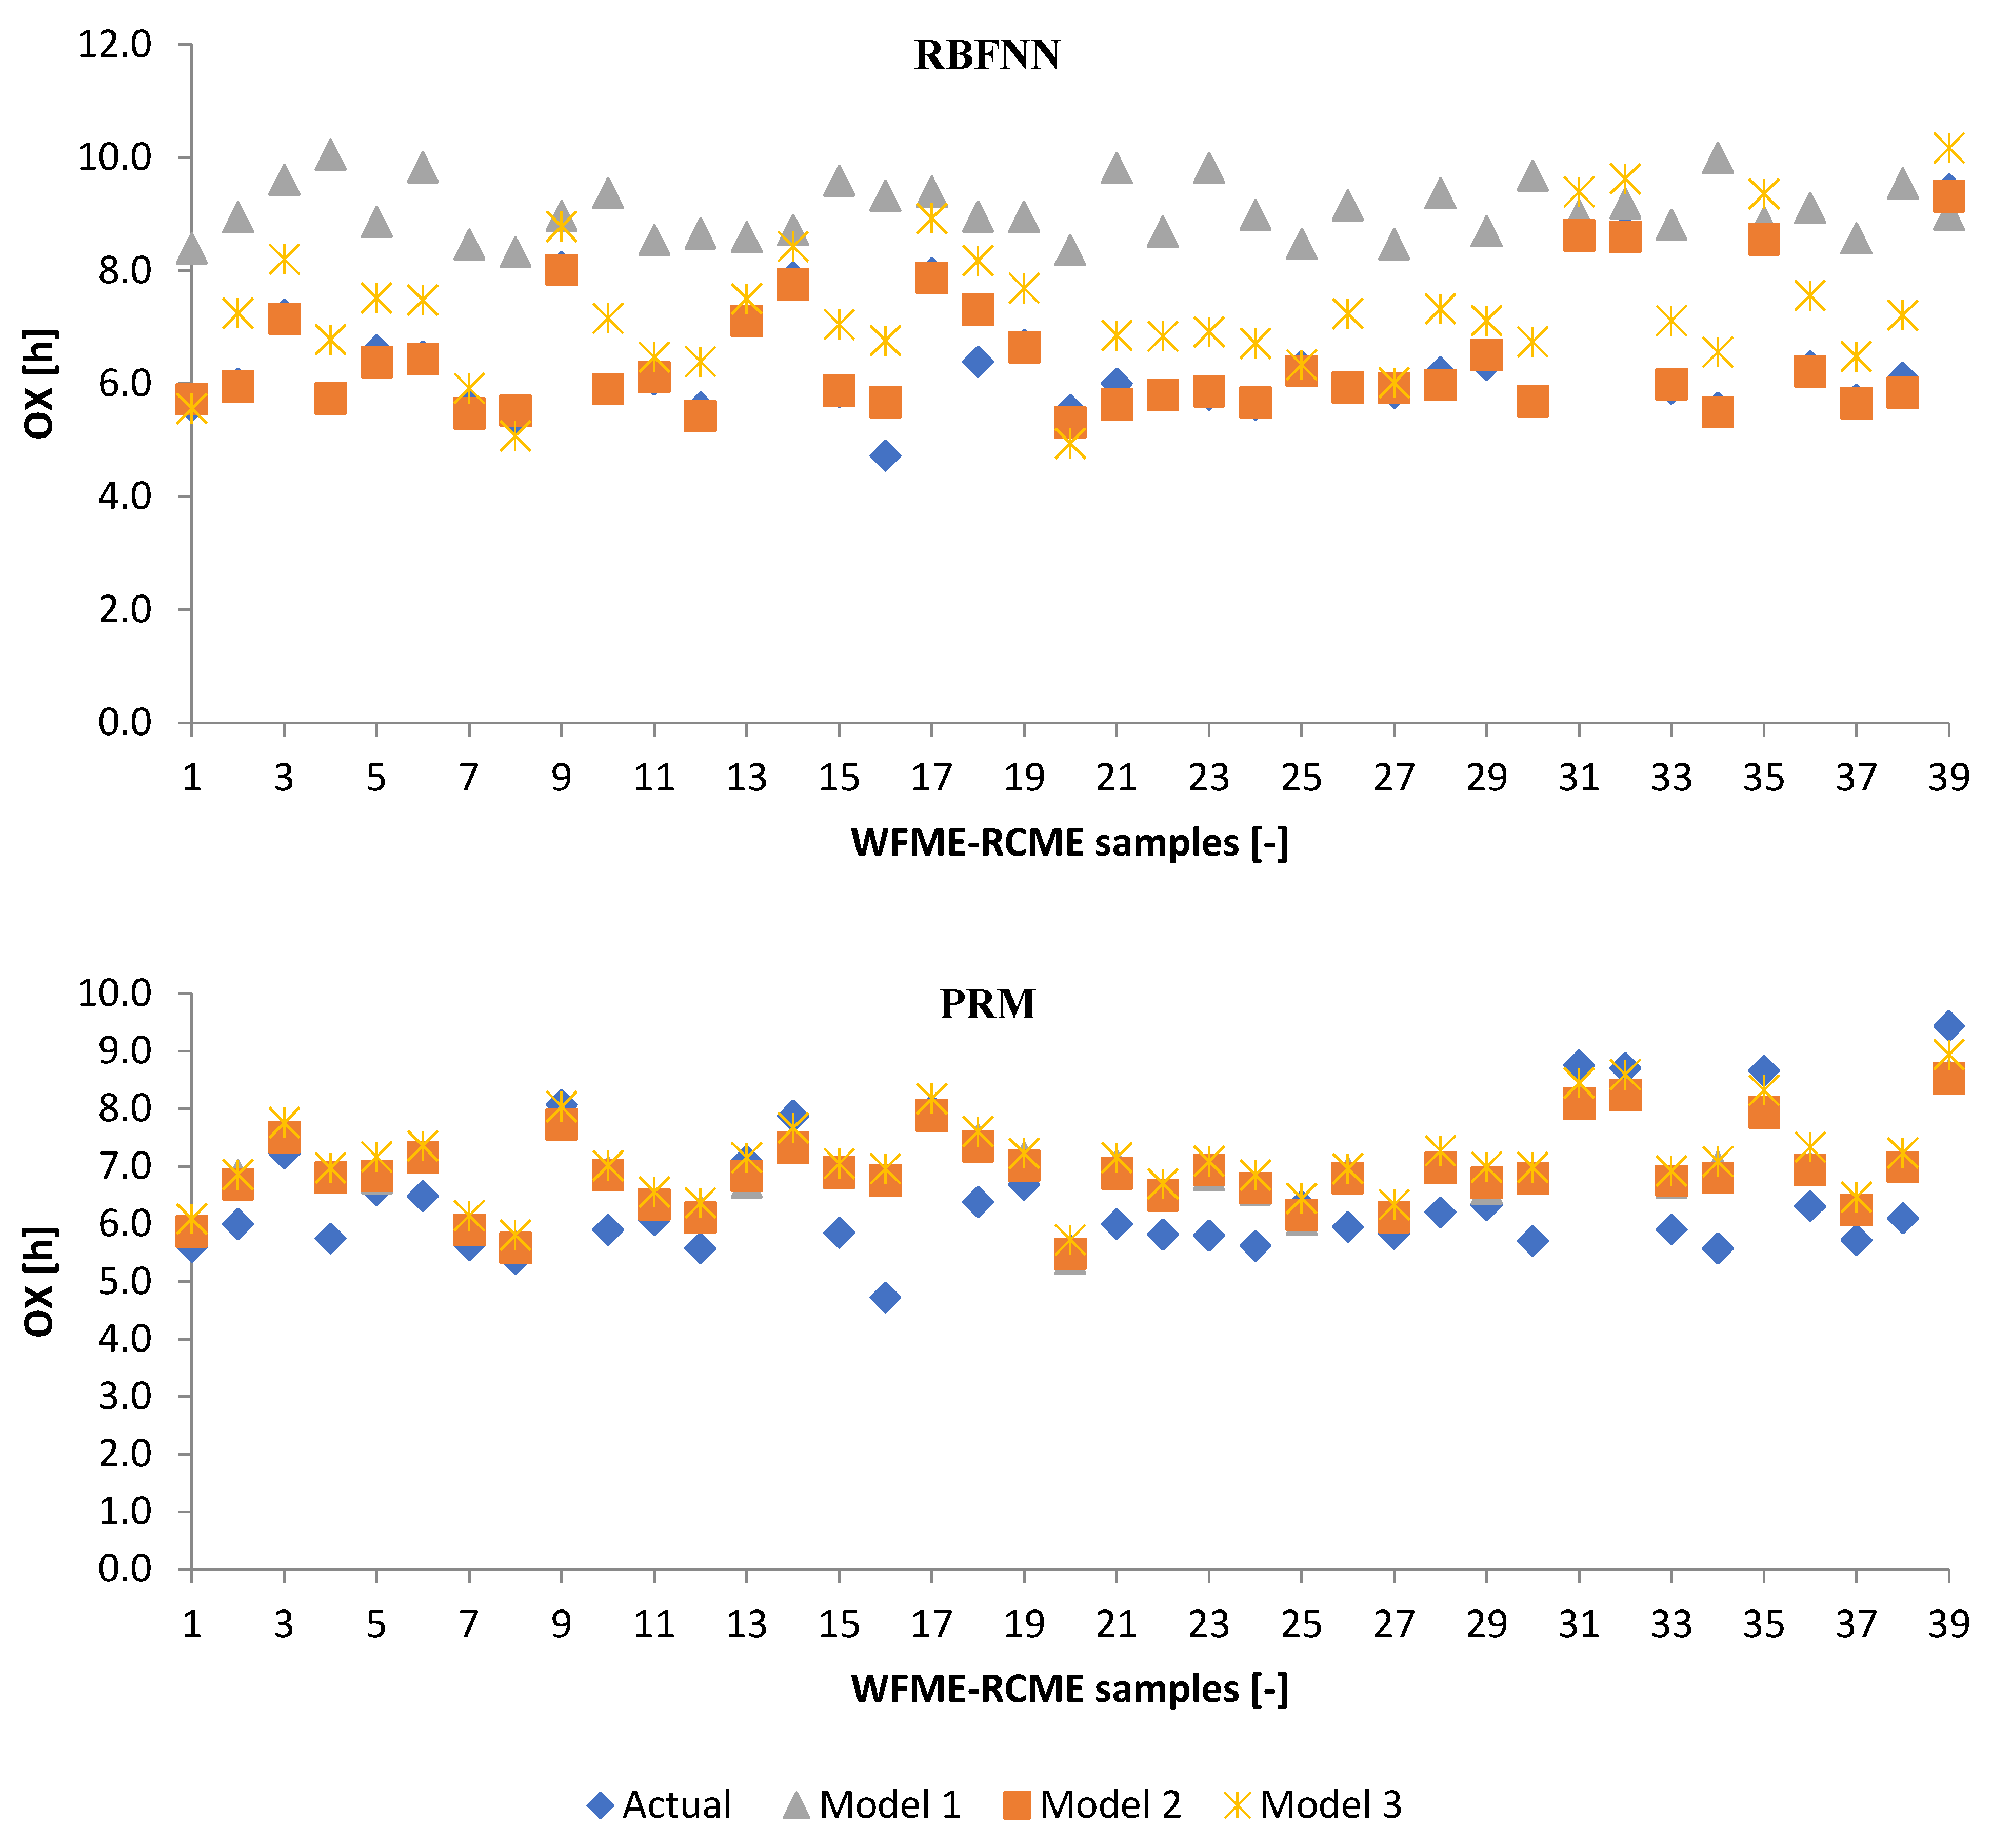
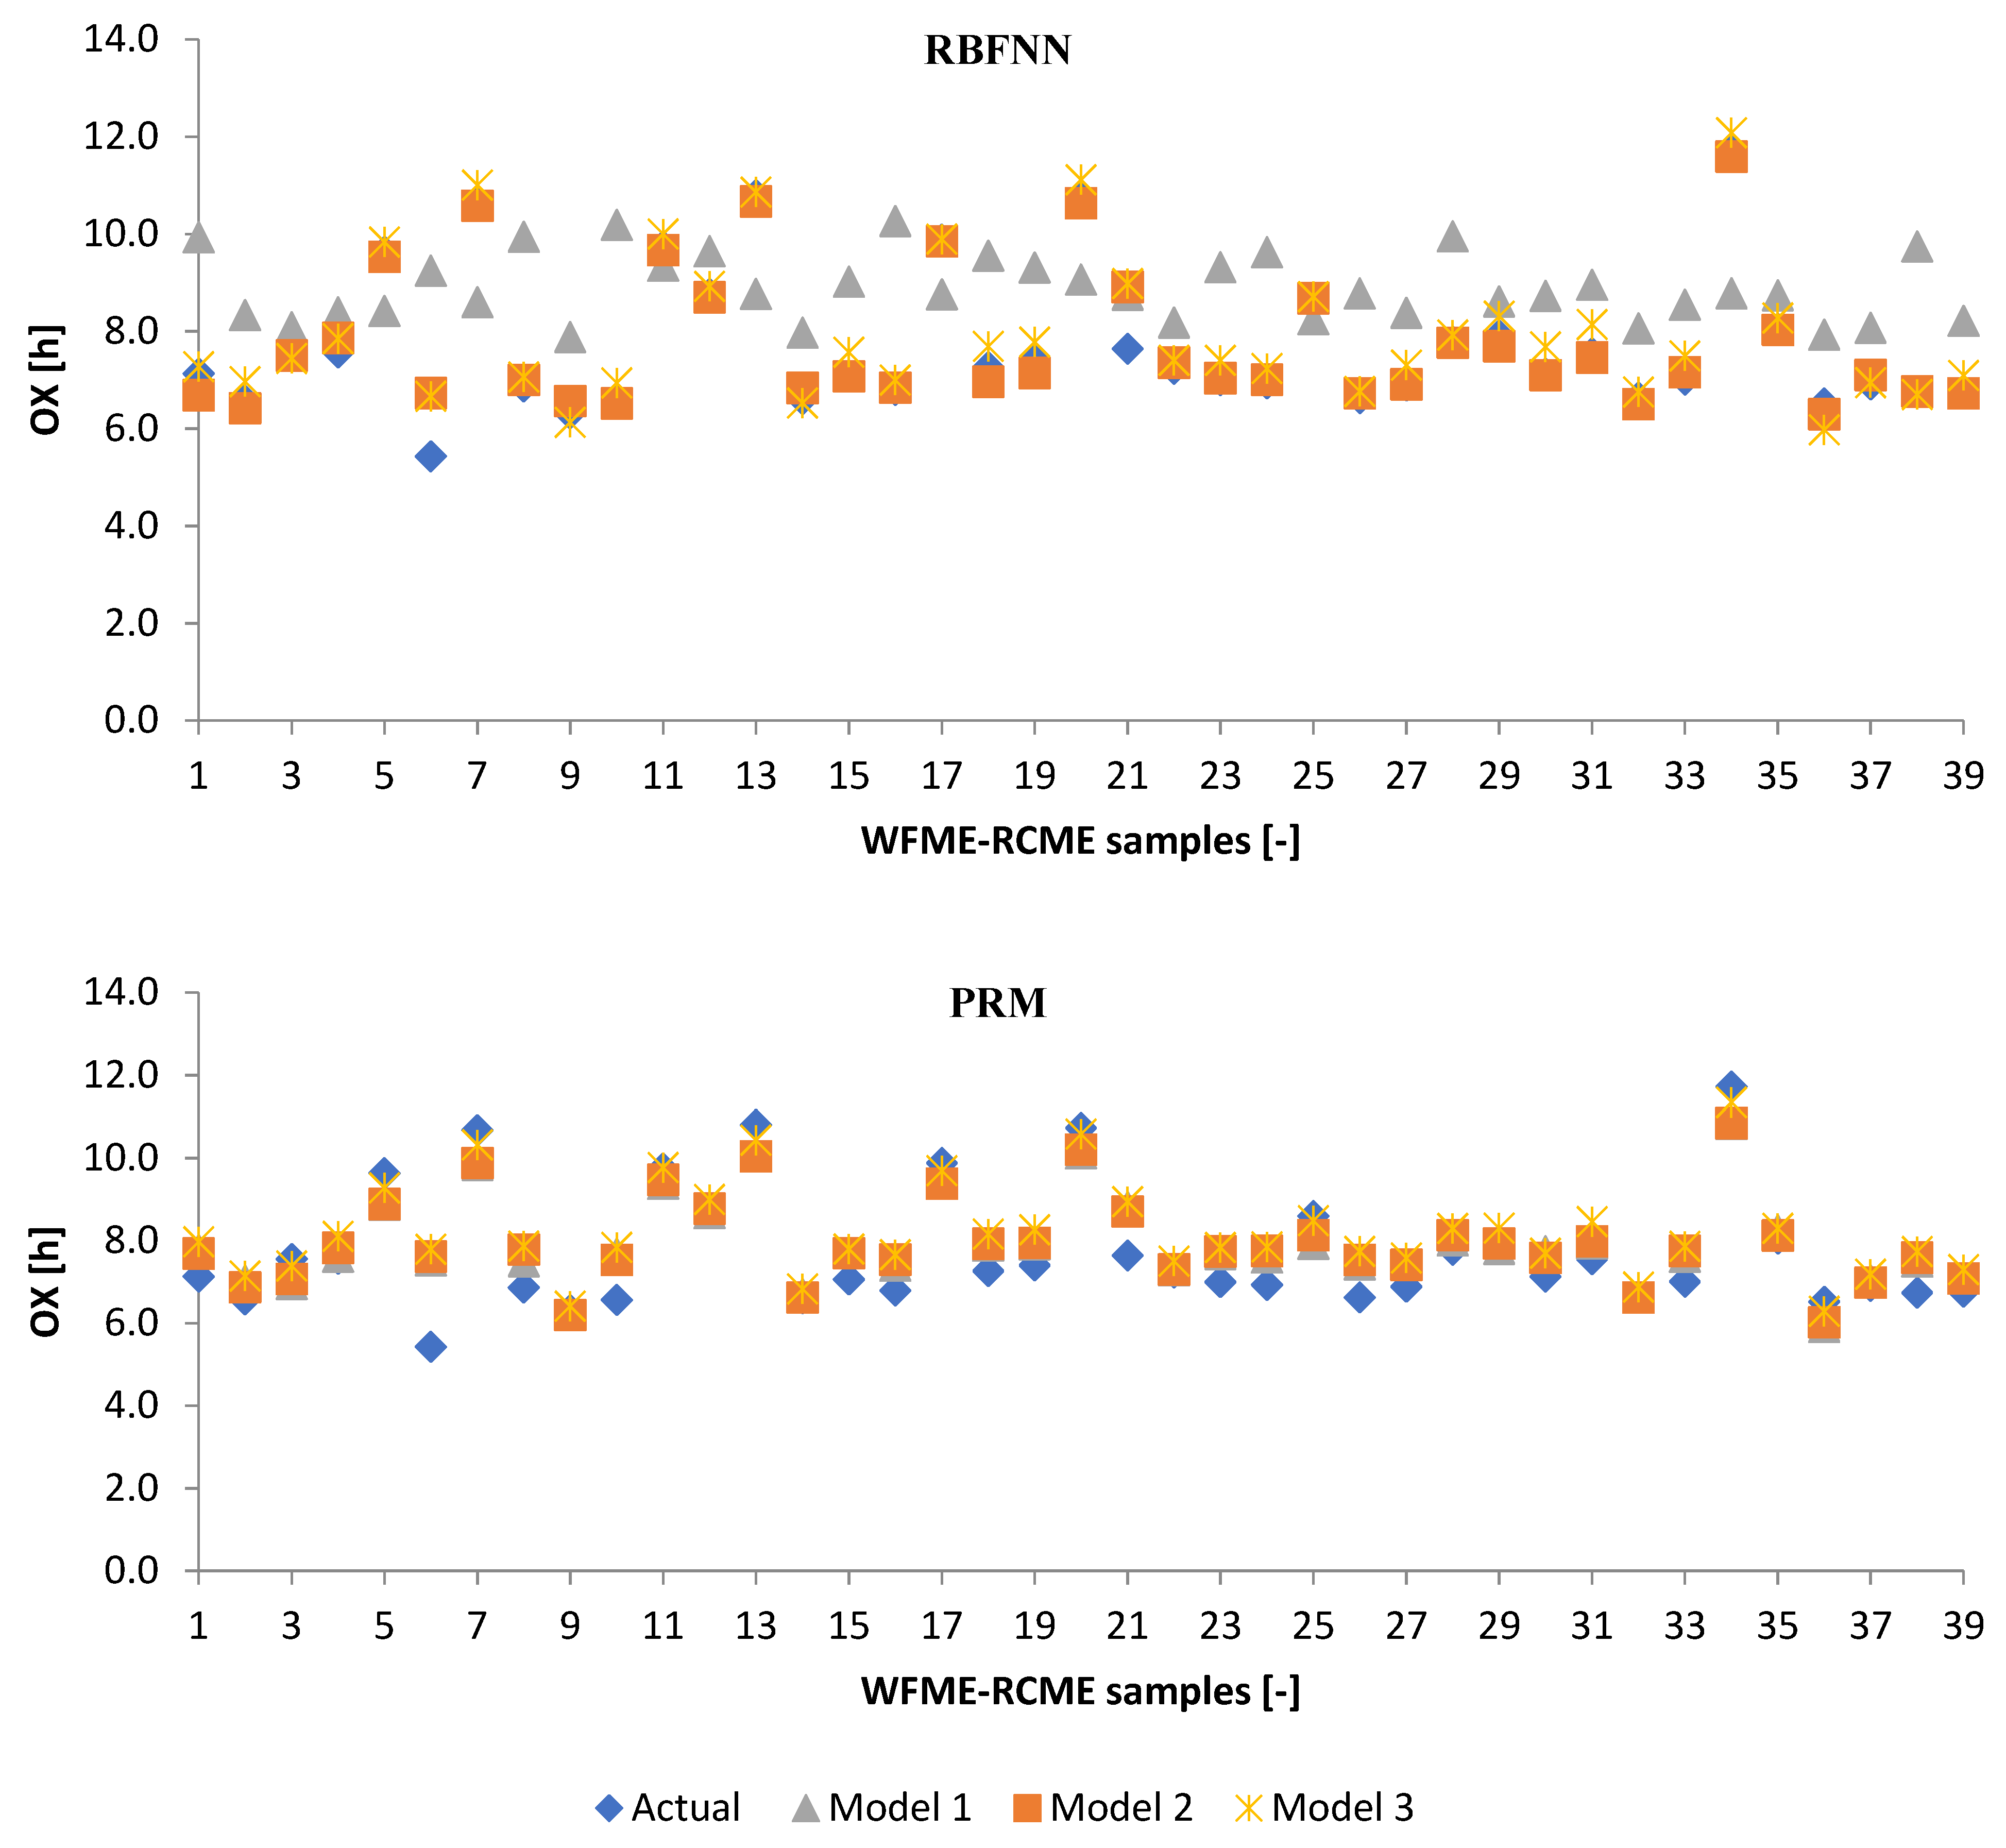
3.3. Performance Evaluation of Artificial Models and Mathematical Models for Testing Data

The data were divided into training and testing groups and the results by the models were compared with each other. In this study, the training was done using data for WFME, WFME-PME, and WFME-PME-RCME. The developed model was used to predict the OX values for WFME-RCME samples, and then compared with the actual data obtained by performing laboratory tests on actually prepared WFME-RCME.
In this study, the statistical approach using Analysis of Variance (ANOVA) parameters, namely R2, SEP, MAE, RMSE, and ADD, was used to assess and evaluate the predictive capability of MFFNN, CFNN, ENN, RBFNN, and PRM as listed in Table 6. RMSE, SEP, and MAE values are used to estimate the error in the predicted data, while ADD value measures the accuracy of the developed models [71,72]. It was observed that CFNN (model 3) and RBFNN (model 2) gave good predictions according to the R-squared values for the testing data. In addition, it was found that the RBFNN has the lowest value of RMSE, MAE, SPE, and ADD for the testing data, as shown in Table 6. Moreover, Figure 7, Figure 8, Figure 9 and Figure 10 compare the estimated and observed values of the deviator stress for all models. Out of the proposed models, Model 2 has given the best prediction with the combinations of (X1, X2, X3, S F A M s , M U F A M s , P U F A M s . VLCFA, DU, LCSF, M U F A M s + P U F A M s S F A M s , KV (at 40 °C), and D (at 15 °C)). The proposed approach illustrates how the RBFNN modeling technique can be used to identify the critical variables required to the most significant meteorological parameters affecting the oxidation stability of biodiesel.

4. Conclusions

In the present study, the potential of using PME and RCME as an additive to improve the stability and cold flow properties of WFME samples was evaluated. The kinematic viscosity, density, cloud point, pour point, and oxidation stability of 39 WFME samples and their blends with various percentages of PME and RCME were experimentally measured. The results demonstrated that adding a high proportion of PME to the WFME samples with low oxidation stability values would help increase the stability of the samples to meet the recommended oxidation stability specification in EN 14214:2014 (≥8 h). In addition, mixing WFME18 with RCME helped increase the OX stability from 2.60 h (RCME) to 11.70 (RC20WFME18) and improve the cold flow properties of the WFME and WFME-PME samples. Moreover, this study evaluated the accuracy of Poisson Regression Model (PRM)) and Multilayer Feed-Forward Neural Network (MFFNN), Cascade Feed-forward Neural Network (CFNN), Radial Basis Neural Network (RBNN), and Elman neural network (ENN) with different combinations of input parameters. The parameters include concentration amount of WFME, PME, and RCME in the mixture, the value of total saturated, total monounsaturated, total polyunsaturated, very-long-chain fatty acid, degree of unsaturation, long-chain saturated factor, kinematic viscosity, density, cloud point, and pour point. The results demonstrated that the RBFNN model combined X1, X2, X3,   S F A M s , M U F A M s , and P U F A M s . VLCFA, DU, LCSF,   M U F A M s + P U F A M s S F A M s , KV, and D had the lowest value of Root Mean Squared Error and Mean Absolute Error. In the end, the results demonstrated that the RBFNN model performed well and presented high accuracy in estimating the value of OX for the biodiesel samples compared to PRM, MFFNN, CFNN, and ENN.
An interesting future study might evaluate the accuracy of the proposed models on other combinations of different biodiesel samples having similar physical and chemical properties. Moreover, future research should focus on assessing the effects of the storage period and storage conditions on the properties of biodiesel, mainly oxidation stability, kinematic viscosity, and density, to find a suitable sample that can be used for vehicle engines in Northern Cyprus.

Supplementary Materials

The following are available online at https://www.mdpi.com/article/10.3390/en15020407/s1, Figure S1: Properties of WFME-PME with various volume of ratio, Figure S2: Properties of WFME-RCME with various volume of ratio, Figure S3: Properties of WFME-PME-RCME with various volume of ratio.

Author Contributions

A.M.R.A.-A. measured the physicochemical properties of the fuel. H.Ç. analyzed the data and wrote the paper. All authors have read and agreed to the published version of the manuscript.

Funding

This research received no external funding.

Institutional Review Board Statement

Not applicable.

Informed Consent Statement

Not applicable.

Data Availability Statement

Not applicable.

Conflicts of Interest

The authors declare no conflict of interest.

References

  1. Sharma, A.; Murugan, S. Effect of blending waste tyre derived fuel on oxidation stability of biodiesel and performance and emission studies of a diesel engine. Appl. Therm. Eng. 2017, 118, 365–374. [Google Scholar] [CrossRef]
  2. Ong, H.C.; Tiong, Y.W.; Goh, B.H.H.; Gan, Y.Y.; Mofijur, M.; Fattah, I.R.; Alam, M.A.; Lee, H.V.; Silitonga, A.S.; Mahlia, T.M.I.; et al. Recent advances in biodiesel production from agricultural products and microalgae using ionic liquids: Opportunities and challenges. Energy Convers. Manag. 2021, 228, 113647. [Google Scholar] [CrossRef]
  3. Lahane, S.; Subramanian, K.A. Impact of nozzle holes configuration on fuel spray, wall impingement and NOx emission of a diesel engine for biodiesel–diesel blend (B20). Appl. Therm. Eng. 2014, 64, 307–314. [Google Scholar] [CrossRef]
  4. Babu, D.; Karvembu, R.; Anand, R. Impact of split injection strategy on combustion, performance and emissions characteristics of biodiesel fuelled common rail direct injection assisted diesel engine. Energy 2018, 165, 577–592. [Google Scholar] [CrossRef]
  5. Babu, D.; Thangarasu, V.; Ramanathan, A. Artificial neural network approach on forecasting diesel engine characteristics fuelled with waste frying oil biodiesel. Appl. Energy 2020, 263, 114612. [Google Scholar] [CrossRef]
  6. Fawaz, E.G.; Salam, D.A. Preliminary economic assessment of the use of waste frying oils for biodiesel production in Beirut, Lebanon. Sci. Total Environ. 2018, 637, 1230–1240. [Google Scholar] [CrossRef] [PubMed]
  7. Nezhad, M.K.; Aghaei, H. Tosylated cloisite as a new heterofunctional carrier for covalent immobilization of lipase and its utilization for biodiesel production from waste frying oil. Renew. Energy 2021, 164, 876–888. [Google Scholar] [CrossRef]
  8. Wang, Y.; Heydari, H. Developing an Extreme Learning Machine-Based Model for Estimating the Isothermal Compressibility of Biodiesel. Int. J. Chem. Eng. 2021, 2021, 6099019. [Google Scholar] [CrossRef]
  9. Gupta, K.K.; Kalita, K.; Ghadai, R.K.; Ramachandran, M.; Gao, X.Z. Machine Learning-Based Predictive Modelling of Biodiesel Production—A Comparative Perspective. Energies 2021, 14, 1122. [Google Scholar] [CrossRef]
  10. Sultana, N.; Hossain, S.Z.; Abusaad, M.; Alanbar, N.; Senan, Y.; Razzak, S.A. Prediction of biodiesel production from microalgal oil using Bayesian optimization algorithm-based machine learning approaches. Fuel 2022, 309, 122184. [Google Scholar] [CrossRef]
  11. Kumar, V.; Kalita, K.; Madhu, S.; Ragavendran, U.; Gao, X.Z. A Hybrid Genetic Programming–Gray Wolf Optimizer Approach for Process Optimization of Biodiesel Production. Processes 2021, 9, 442. [Google Scholar] [CrossRef]
  12. Yaşar, F. Comparision of fuel properties of biodiesel fuels produced from different oils to determine the most suitable feedstock type. Fuel 2020, 264, 116817. [Google Scholar] [CrossRef]
  13. Giakoumis, E.G.; Sarakatsanis, C.K. Estimation of biodiesel cetane number, density, kinematic viscosity and heating values from its fatty acid weight composition. Fuel 2018, 222, 574–585. [Google Scholar] [CrossRef]
  14. Alviso, D.; Artana, G.; Duriez, T. Prediction of biodiesel physico-chemical properties from its fatty acid composition using genetic programming. Fuel 2020, 264, 116844. [Google Scholar] [CrossRef]
  15. Razavi, R.; Bemani, A.; Baghban, A.; Mohammadi, A.H.; Habibzadeh, S. An insight into the estimation of fatty acid methyl ester based biodiesel properties using a LSSVM model. Fuel 2019, 243, 133–141. [Google Scholar] [CrossRef]
  16. Kumar, N. Oxidative stability of biodiesel: Causes, effects and prevention. Fuel 2017, 190, 328–350. [Google Scholar] [CrossRef]
  17. Pullen, J.; Saeed, K. Experimental study of the factors affecting the oxidation stability of biodiesel FAME fuels. Fuel Process. Technol. 2014, 125, 223–235. [Google Scholar] [CrossRef]
  18. Knothe, G.; Dunn, R.O. Dependence of oil stability index of fatty compounds on their structure and concentration and presence of metals. J. Am. Oil Chem. Soc. 2003, 80, 1021–1026. [Google Scholar] [CrossRef]
  19. McCormick, R.L.; Ratcliff, M.; Moens, L.; Lawrence, R. Several factors affecting the stability of biodiesel in standard accelerated tests. Fuel Process. Technol. 2007, 88, 651–657. [Google Scholar] [CrossRef]
  20. Dunn, R.O. Antioxidants for improving storage stability of biodiesel. Biofuels Bioprod. Biorefin. Innovation Sustain. Economy 2008, 2, 304–318. [Google Scholar] [CrossRef]
  21. Park, J.Y.; Kim, D.K.; Lee, J.P.; Park, S.C.; Kim, Y.J.; Lee, J.S. Blending effects of biodiesels on oxidation stability and low temperature flow properties. Bioresour. Technol. 2008, 99, 1196–1203. [Google Scholar] [CrossRef]
  22. Knothe, G. Dependence of biodiesel fuel properties on the structure of fatty acid alkyl esters. Fuel Process. Technol. 2005, 86, 1059–1070. [Google Scholar] [CrossRef]
  23. Pereira, G.G.; Garcia, R.K.; Ferreira, L.L.; Barrera-Arellano, D. Soybean and soybean/beef-tallow biodiesel: A comparative study on oxidative degradation during long-term storage. J. Am. Oil Chem. Soc. 2017, 94, 587–593. [Google Scholar] [CrossRef]
  24. Zhou, J.; Xiong, Y.; Liu, X. Evaluation of the oxidation stability of biodiesel stabilized with antioxidants using the Rancimat and PDSC methods. Fuel 2017, 188, 61–68. [Google Scholar] [CrossRef]
  25. Neuana, N.F.; de Sousa Barboza, J.C.; dos Santos, E.P.; da Silva, M.L.C.P. A novel application of Mangifera indica L and Eugenia uniflora L extracts as antioxidants to control biodiesel oxidation stability. Environ. Prog. Sustain. Energy 2021, 40, e13540. [Google Scholar] [CrossRef]
  26. Nogales-Delgado, S.; Encinar, J.M.; González, J.F. Safflower Biodiesel: Improvement of its Oxidative Stability by using BHA and TBHQ. Energies 2019, 12, 1940. [Google Scholar] [CrossRef] [Green Version]
  27. Çamur, H.; Alassi, E. Physicochemical Properties Enhancement of Biodiesel Synthesis from Various Feedstocks of Waste/Residential Vegetable Oils and Palm Oil. Energies 2021, 14, 4928. [Google Scholar] [CrossRef]
  28. Kassem, Y.; Çamur, H.; Alassi, E. Biodiesel production from four residential waste frying oils: Proposing blends for improving the physicochemical properties of methyl biodiesel. Energies 2020, 13, 4111. [Google Scholar] [CrossRef]
  29. Kassem, Y.; Çamur, H. Effects of storage under different conditions on the fuel properties of biodiesel admixtures derived from waste frying and canola oils. Biomass Convers. Biorefinery 2018, 8, 825–845. [Google Scholar] [CrossRef]
  30. Saeed RH, S.; Kassem, Y.; Çamur, H. Effect of Biodiesel Mixture Derived from Waste Frying-Corn, Frying-Canola-Corn and Canola-Corn Cooking Oils with Various Ages on Physicochemical Properties. Energies 2019, 12, 3729. [Google Scholar] [CrossRef] [Green Version]
  31. ASTM D445–09; Standard Test Method for Kinematic Viscosity of Transparent and Opaque Liquids (and Calculation of Dynamic Viscosity). ASTM: West Conshohocken, PA, USA, 2009.
  32. ASTM D854-14; Standard Test Methods for Specific Gravity of Soil Solids by Water Pycnometer. ASTM: West Conshohocken, PA, USA, 2014.
  33. ASTM D2500-17a; Standard Test Method for Cloud Point of Petroleum Products. ASTM: West Conshohocken, PA, USA, 2017.
  34. ASTM D97-17b; Standard Test Method for Pour Point of Petroleum Products. ASTM: West Conshohocken, PA, USA, 2017.
  35. EN 14112; Fat and Oil Derivatives. Fatty Acid Methyl Esters (FAME). Determination of Oxidation Stability (Accelerated Oxidation Test). National Standards Authority of Ireland: Dublin, Ireland, 2003.
  36. Magalhães, A.M.; Pereira, E.; Meirelles, A.J.; Sampaio, K.A.; Maximo, G.J. Proposing blends for improving the cold flow properties of ethylic biodiesel. Fuel 2019, 253, 50–59. [Google Scholar] [CrossRef]
  37. Verma, P.; Sharma, M.P.; Dwivedi, G. Evaluation and enhancement of cold flow properties of palm oil and its biodiesel. Energy Rep. 2016, 2, 8–13. [Google Scholar] [CrossRef] [Green Version]
  38. Ali, O.M.; Mamat, R.; Abdullah, N.R.; Abdullah, A.A. Analysis of blended fuel properties and engine performance with palm biodiesel–diesel blended fuel. Renew. Energy 2016, 86, 59–67. [Google Scholar] [CrossRef] [Green Version]
  39. Moser, B.R. Influence of extended storage on fuel properties of methyl esters prepared from canola, palm, soybean and sunflower oils. Renew. Energy 2011, 36, 1221–1226. [Google Scholar] [CrossRef]
  40. Öztürk, E. Performance, emissions, combustion and injection characteristics of a diesel engine fuelled with canola oil–hazelnut soapstock biodiesel mixture. Fuel Process. Technol. 2015, 129, 183–191. [Google Scholar] [CrossRef]
  41. Uyaroğlu, A.; Uyumaz, A.; Çelikten, İ. Comparison of the combustion, performance, and emission characteristics of inedible Crambe abyssinica biodiesel and edible Hazelnut, Corn, soybean, sunflower, and Canola biodiesels. Environ. Prog. Sustain. Energy 2018, 37, 1438–1447. [Google Scholar] [CrossRef]
  42. Kassem, Y.; Gokcekus, H. Do quadratic and Poisson regression models help to predict monthly rainfall? Desalination Water Treat. 2021, 215, 288–318. [Google Scholar] [CrossRef]
  43. Gündoğdu, S.; Elbir, T. Application of feedforward and cascade forward neural network models for prediction of hourly ambient air temperature based on MERRA-2 reanalysis data in a coastal area of Turkey. Meteorol. Atmos. Phys. 2021, 133, 1481–1493. [Google Scholar] [CrossRef]
  44. Alkhasawneh, M.S.; Tay, L.T. A hybrid intelligent system integrating the cascade forward neural network with Elman neural network. Arab. J. Sci. Eng. 2018, 43, 6737–6749. [Google Scholar] [CrossRef]
  45. Jianyu, L.; Siwei, L.; Yingjian, Q.; Yaping, H. Numerical solution of elliptic partial differential equation using radial basis function neural networks. Neural Netw. 2003, 16, 729–734. [Google Scholar] [CrossRef]
  46. Guo, C.; Lu, J.; Tian, Z.; Guo, W.; Darvishan, A. Optimization of critical parameters of PEM fuel cell using TLBO-DE based on Elman neural network. Energy Convers. Manag. 2019, 183, 149–158. [Google Scholar] [CrossRef]
  47. Ren, G.; Cao, Y.; Wen, S.; Huang, T.; Zeng, Z. A modified Elman neural network with a new learning rate scheme. Neurocomputing 2018, 286, 11–18. [Google Scholar] [CrossRef]
  48. Sadler, J.M.; Goodall, J.L.; Morsy, M.M.; Spencer, K. Modeling urban coastal flood severity from crowd-sourced flood reports using Poisson regression and Random Forest. J. Hydrol. 2018, 559, 43–55. [Google Scholar] [CrossRef]
  49. Coxe, S.; West, S.G.; Aiken, L.S. The analysis of count data: A gentle introduction to Poisson regression and its alternatives. J. Personal. Assess. 2009, 91, 121–136. [Google Scholar] [CrossRef]
  50. Evcil, A.; Al-Shanableh, F.; Savas, M.A. Variation of solid fraction with cold flow properties of biodiesel produced from waste frying oil. Fuel 2018, 215, 522–527. [Google Scholar] [CrossRef]
  51. El-Araby, R.; Amin, A.; El Morsi, A.K.; El-Ibiari, N.N.; El-Diwani, G.I. Study on the characteristics of palm oil–biodiesel–diesel fuel blend. Egypt. J. Pet. 2017, 27, 187–194. [Google Scholar] [CrossRef]
  52. Dunn, R.O. Fuel properties of biodiesel/ultra-low sulfur diesel (ULSD) blends. J. Am. Oil Chem. Soc. 2011, 88, 1977–1987. [Google Scholar] [CrossRef]
  53. Doğan, T.H. The testing of the effects of cooking conditions on the quality of biodiesel produced from waste cooking oils. Renew. Energy 2016, 94, 466–473. [Google Scholar] [CrossRef]
  54. Fu, J.; Turn, S.Q.; Takushi, B.M.; Kawamata, C.L. Storage and oxidation stabilities of biodiesel derived from waste cooking oil. Fuel 2016, 167, 89–97. [Google Scholar] [CrossRef] [Green Version]
  55. Mejía, J.D.; Salgado, N.; Orrego, C.E. Effect of blends of Diesel and Palm-Castor biodiesels on viscosity, cloud point and flashpoint. Ind. Crops Prod. 2013, 43, 791–797. [Google Scholar] [CrossRef]
  56. Atabani, A.E.; Mahlia TM, I.; Masjuki, H.H.; Badruddin, I.A.; Yussof, H.W.; Chong, W.T.; Lee, K.T. A comparative evaluation of physical and chemical properties of biodiesel synthesized from edible and non-edible oils and study on the effect of biodiesel blending. Energy 2013, 58, 296–304. [Google Scholar] [CrossRef]
  57. Campus, P. Comparative analysis of fuel characteristics of bio-diesel produced from selected oil-bearing seeds in Nigeria. Eur. J. Sci. Res. 2011, 58, 238–246. [Google Scholar]
  58. Balat, M. Potential alternatives to edible oils for biodiesel production–A review of current work. Energy Convers. Manag. 2011, 52, 1479–1492. [Google Scholar] [CrossRef]
  59. Karmakar, A.; Karmakar, S.; Mukherjee, S. Properties of various plants and animals feedstocks for biodiesel production. Bioresour. Technol. 2010, 101, 7201–7210. [Google Scholar] [CrossRef]
  60. Gui, M.M.; Lee, K.T.; Bhatia, S. Feasibility of edible oil vs. non-edible oil vs. waste edible oil as biodiesel feedstock. Energy 2008, 33, 1646–1653. [Google Scholar]
  61. Zuleta, E.C.; Rios, L.A.; Benjumea, P.N. Oxidative stability and cold flow behavior of palm, sacha-inchi, jatropha and castor oil biodiesel blends. Fuel Process. Technol. 2012, 102, 96–101. [Google Scholar] [CrossRef]
  62. Dey, S.; Reang, N.M.; Das, P.K.; Deb, M. A comprehensive study on prospects of economy, environment, and efficiency of palm oil biodiesel as a renewable fuel. J. Clean. Prod. 2021, 286, 124981. [Google Scholar] [CrossRef]
  63. Mosarof, M.H.; Kalam, M.A.; Masjuki, H.H.; Ashraful, A.M.; Rashed, M.M.; Imdadul, H.K.; Monirul, I.M. Implementation of palm biodiesel based on economic aspects, performance, emission and wear characteristics. Energy Convers. Manag. 2015, 105, 617–629. [Google Scholar] [CrossRef]
  64. Abd Wafti, N.S.; Lau HL, N.; Choo, Y.M. Production technology of biodiesel from palm fatty acid distillate using mild acid catalyst. J. Oil Palm Res. 2015, 27, 352–359. [Google Scholar]
  65. May, C.Y.; Liang, Y.C.; Foon, C.S.; Ngan, M.A.; Hook, C.C.; Basiron, Y. Key fuel properties of palm oil alkyl esters. Fuel 2005, 84, 1717–1720. [Google Scholar] [CrossRef]
  66. Kalam, M.A.; Masjuki, H.H. Biodiesel from palmoil—An analysis of its properties and potential. Biomass Bioenergy 2002, 23, 471–479. [Google Scholar] [CrossRef]
  67. Monirul, I.M.; Masjuki, H.H.; Kalam, M.A.; Zulkifli, N.W.M.; Rashedul, H.K.; Rashed, M.M.; Mosarof, M.H. A comprehensive review on biodiesel cold flow properties and oxidation stability along with their improvement processes. RSC Adv. 2015, 5, 86631–86655. [Google Scholar] [CrossRef]
  68. Can, Ö.; Öztürk, E.; Yücesu, H.S. Combustion and exhaust emissions of canola biodiesel blends in a single-cylinder DI diesel engine. Renew. Energy 2017, 109, 73–82. [Google Scholar] [CrossRef]
  69. Uzun, B.B.; Kılıç, M.; Özbay, N.; Pütün, A.E.; Pütün, E. Biodiesel production from waste frying oils: Optimization of reaction parameters and determination of fuel properties. Energy 2012, 44, 347–351. [Google Scholar] [CrossRef]
  70. Bharti, R.; Singh, B. Green tea (Camellia assamica) extract as an antioxidant additive to enhance the oxidation stability of biodiesel synthesized from waste cooking oil. Fuel 2020, 262, 116658. [Google Scholar] [CrossRef]
  71. Betiku, E.; Odude, V.O.; Ishola, N.B.; Bamimore, A.; Osunleke, A.S.; Okeleye, A.A. Predictive capability evaluation of RSM, ANFIS and ANN: A case of reduction of high free fatty acid of palm kernel oil via esterification process. Energy Convers. Manag. 2016, 124, 219–230. [Google Scholar] [CrossRef]
  72. Hariram, V.; Bose, A.; Seralathan, S. Dataset on optimized biodiesel production from seeds of Vitis vinifera using ANN, RSM and ANFIS. Data Brief 2019, 25, 104298. [Google Scholar] [CrossRef] [PubMed]
Figure 1. Flowchart of analysis procedure in the present study.
Energies 15 00407 g001
Figure 2. The proposed algorithm of predicting OX values using MFFNN.
Energies 15 00407 g002
Figure 3. The proposed algorithm of predicting OX values using CFNN.
Energies 15 00407 g003
Figure 4. The proposed algorithm of predicting OX values using RBFNN.
Energies 15 00407 g004
Figure 5. Properties of pure biodiesel samples.
Energies 15 00407 g005
Figure 6. Comparison between estimated data with experimental data of oxidation stability.
Energies 15 00407 g006
Figure 7. Comparison of the predicted and observed values of the OX values of WFME-RCME (20–80%).
Energies 15 00407 g007aEnergies 15 00407 g007b
Figure 8. Comparison of the predicted and observed values of the OX values of WFME-RCME (40–60%).
Energies 15 00407 g008aEnergies 15 00407 g008b
Figure 9. Comparison of the predicted and observed values of the OX values of WFME-RCME (60–40%).
Energies 15 00407 g009aEnergies 15 00407 g009b
Figure 10. Comparison of the predicted and observed values of the OX values of WFME-RCME (80–20%).
Energies 15 00407 g010aEnergies 15 00407 g010b
Table 1. Quantified MUFAMEs, PUFAMEs, SFAME, DU, LCSF, VLCFA, and R.
Samples S F A M M U F A M P U F A M V L C F A D U L C S F M U F A M s + P U F A M s S F A M s
WFME17.7464.0128.331.50120.671.8111.93
WFME29.5062.8327.811.43118.462.019.54
WFME311.2761.6527.301.35116.252.207.90
WFME413.0360.4726.781.28114.042.406.70
WFME516.5558.1125.751.13109.622.795.07
WFME620.0855.7524.720.98105.203.194.01
WFME725.3852.2223.180.7598.583.782.97
WFME830.6548.6821.630.5391.934.372.29
WFME934.2046.3220.600.3887.524.771.96
WFME1039.4742.7819.050.1580.885.351.57
WFME1142.9940.4218.020.0076.465.751.36
WFME127.7465.4327.331.92120.091.8111.98
WFME1314.7960.4325.271.54110.962.605.79
WFME1421.8455.4323.211.15101.843.383.60
WFME1528.8950.4221.140.7792.714.172.48
WFME1635.9445.4219.080.3883.594.961.79
WFME1742.9940.4217.020.0074.465.751.34
WFME1822.1352.0725.481.31103.034.133.50
WFME1922.7051.0026.221.29103.434.203.40
WFME2023.2849.9326.951.27103.834.283.30
WFME2123.8548.8527.691.26104.234.353.21
WFME2224.4347.7828.421.24104.634.433.12
WFME2325.0046.7129.161.22105.034.503.03
WFME2421.5550.4528.791.36108.043.963.68
WFME2518.1054.2028.431.50111.053.424.57
WFME2614.6457.9428.061.64114.072.895.87
WFME2711.1961.6927.701.78117.082.357.99
WFME2819.2554.7425.851.43106.443.664.19
WFME2916.3757.4126.221.55109.853.205.11
WFME3013.5060.0926.591.68113.272.746.42
WFME3110.6262.7626.961.80116.682.278.45
WFME3239.3941.6819.450.2480.575.501.55
WFME3335.7942.9421.880.4986.695.251.81
WFME3432.2044.1924.300.7392.805.002.13
WFME3528.6045.4526.730.9898.924.752.52
WFME3626.3049.7423.791.0597.324.452.80
WFME3730.4747.4122.100.7991.604.782.28
WFME3834.6545.0820.400.5285.895.101.89
WFME3938.8242.7518.710.2680.175.421.58
RCME6.7360.2529.911.98120.072.0013.40
PME44.9043.5011.200.5065.906.361.22
WFME: Waste frying methyl ester
PME:Palm methyl ester
RCME:Refined canola methyl ester
Table 2. Statistical parameters of used variables.
DataVariable ExplanationSDCVMax.Min.Unit
TrainingX1Concentration amount of WFME in the mixture26.4747.4320100%
X2Concentration amount of PME in the mixture26.4759.89080%
X3Concentration amount of RCME in the mixture28.98131.16080%
S F A M s Total saturated8.01326.026.7344.9wt%
M U F A M s Total monounsaturated4.7519.6340.4265.43wt%
P U F A M s Total polyunsaturated3.88619.7511.229.91wt%
V L C F A Very-long-chain fatty acid0.346138.0301.98wt%
D U Degree of unsaturation11.6413.1365.9120.67wt%
L C S F Long-chain saturated factor0.930619.771.8086.36wt%
M U F A M s + P U F A M s S F A M s Ratio1.529759.161.218313.3967-
KV (at 40 °C)Kinematic viscosity0.18593.954.32855.705Mm2/s
D (at 15 °C)Density13.841.54875941.79Kg/m3
CPCloud Point3.67850.36−417.4 °C
PPPour Point5.203120.92−1215 °C
XOOxidation stability2.6821.892.618.35h
TestingX1Concentration amount of WFME in the mixture22.4344.872080%
X2Concentration amount of PME in the mixture0*00%
X3Concentration amount of RCME in the mixture22.4344.872080%
S F A M s Total saturated6.76544.036.93235.738wt%
M U F A M s Total monounsaturated4.3997.8444.38664.394wt%
P U F A M s Total polyunsaturated2.2548.2819.59829.76wt%
V L C F A Very-long-chain fatty acid0.356723.610.3961.968wt%
D U Degree of unsaturation8.347.5483.58120.55wt%
L C S F Long-chain saturated factor0.767426.061.84624.999wt%
M U F A M s + P U F A M s S F A M s Ratio2.97445.011.7913.081-
KV (at 40 °C)Kinematic viscosity0.18954.094.43435.5595Mm2/s
D (at 15 °C)Density11.91.32880.83934.41Kg/m3
CPCloud Point3.413811.73−3.613.12 °C
PPPour Point3.817−57.83−11.66.48 °C
XOOxidation stability1.74430.063.30811.72h
* Not determined.
Table 3. Proposed models with different input combinations.
Model NameCombination of Input
Model 1 X 1 ,   X 2 ,   X 3 ,   S F A M s ,   M U F A M s ,   P U F A M s . VLCFA, DU, LCSF, and M U F A M s + P U F A M s S F A M s
Model 2 X 1 ,   X 2 ,   X 3 ,   S F A M s ,   M U F A M s ,   P U F A M s . VLCFA, DU, LCSF M U F A M s + P U F A M s S F A M s , KV (at 40 °C) and D (at 15 °C)
Model 3 X 1 ,   X 2 ,   X 3 ,   S F A M s ,   M U F A M s ,   P U F A M s . VLCFA, DU, LCSF M U F A M s + P U F A M s S F A M s , KV (at 40 °C), D (at 15 °C), CP and PP
Table 4. Performance of the proposed models.
Machine Learning ModelModel NameTFHLNNMSE
(Training)
EpochR2
(Training)
MFFNNModel 115TANSIG9.29× 10−5 7590.9984
Model 215TANSIG1.66 × 10−4 180.9936
Model 315TANSIG9.06 × 10−5 3250.9962
CFNNModel 115LOGSIG2.06 × 10−4 190.9911
Model 215LOGSIG7.26 × 10−5 3450.9978
Model 315LOGSIG2.02 × 10−4 80.9916
ENNModel 118TANSIG3.74 × 10−5 9990.9988
Model 2110TANSIG1.42 × 10−4 2940.9897
Model 3110TANSIG1.06 × 10−4 9120.9992
Table 5. The mathematical equation used to predict the OX value of biodiesel samples.
Model NameMathematical Equation
Model 1 O X = E X P ( 7.2 + 0.027 · X 1 + 0.121 · X 3 3.5 · S F A M s + 7.47 · M U F A M s + 1.43 · P U F A M s 2.24 · V L C F A + 10.38 · L C S F 0.74 · ( M U F A M s + P U F A M s S F A M s ) )
Model 2 O X = E X P ( 7.2 + 0.016 · X 1 + 0.147 · X 3 3.5 · S F A M s + 7.33 · M U F A M s + 1.33 · P U F A M s 2.25 · V L C F A + 10.39 · L C S F 0.58 · ( M U F A M s + P U F A M s S F A M s ) + 0.158 · K V + 0.172 · D )
Model 3 O X = E X P ( 7.0 + 0.046 · X 1 + 0.135 X 3 4.1 · S F A M s + 7.4 · M U F A M s + 1.06 · P U F A M s 2.18 V L C F A + 11.1 · L C S F 0.55 · ( M U F A M s + P U F A M s S F A M s ) + 0.20 · K V + 0.139 · D + 0.61 · C P 0.80 · P P )
Table 6. Performance evaluation of the models.
Volume Fraction of RCMEStatistical IndicatorFFNNCFNNENN
Model 1Model 2Model 3Model 1Model 2Model 3Model 1Model 2Model 3
80%R20.79910.00510.58900.33890.00600.89490.33890.82830.1349
RMSE1.13281.18381.22430.34540.69590.65020.34540.90312.0591
MAE1.11951.12161.15800.26370.56010.58130.26370.84791.9408
SEP [%]40.580128.903523.15966.173011.116715.65658.695025.701352.2759
ADD [%]29.362628.331129.86486.447314.752414.46126.447321.346850.3830
60%R20.79160.02180.82050.73090.23970.93540.67570.50710.4765
RMSE1.43192.01041.03722.53192.48431.40000.86271.71902.5829
MAE1.34921.85670.92322.43352.03431.31240.75401.63302.3980
SEP [%]40.834635.976614.180434.258133.674348.117221.373742.430954.0799
ADD [%]26.269235.016117.657046.293039.764424.697513.961931.006946.5722
40%R20.72520.39230.87310.80050.42750.94400.77370.61570.3441
RMSE2.22802.51511.02363.41912.78971.49651.12222.03312.4568
MAE1.93702.36900.83383.28882.33181.41461.02411.91952.2607
SEP [%]47.564736.777810.296937.605332.804544.873322.648838.187241.5207
ADD [%]29.442436.098412.504750.189236.640121.408015.702729.480035.9919
20%R20.76400.73050.89680.91580.74930.95520.86990.49410.8288
RMSE2.75852.44530.72002.84331.81420.79450.99001.77291.1751
MAE2.35672.32270.55722.75891.57830.75100.86371.39761.0920
SEP [%]43.649830.07955.568029.665619.785315.133213.620719.947515.8655
ADD [%]29.822029.89997.208435.425420.92529.650311.280017.683514.8233
80%R20.00020.94270.10200.15940.21710.2508
RMSE5.66550.09422.38671.32781.29011.5098
MAE5.65200.06892.19231.27981.24861.4761
SEP [%]147.09201.235722.998524.953020.560228.6048
ADD [%]147.58421.804557.021433.788632.977838.8593
60%R20.00020.94710.43750.43070.49380.5447
RMSE4.18720.16761.79041.00190.94611.1475
MAE4.11230.10231.63460.86990.82971.0388
SEP [%]80.07581.371217.626814.615712.252117.3059
ADD [%]82.77782.072332.341617.995917.164921.3994
40%R20.00020.94810.81180.68530.71230.7552
RMSE2.87450.24640.97420.78560.75970.8964
MAE2.639240.142690.881320.672870.648380.76202
SEP [%]40.99051.775589.730329.785868.9142511.0382
ADD [%]44.30972.3823414.207111.075710.626212.8206
20%R20.000320.948780.951320.835210.836610.86433
RMSE1.976980.329380.423310.669560.679090.75028
MAE1.767360.18270.324110.548330.547790.60237
SEP [%]22.76052.100913.648296.887766.85047.60394
ADD [%]24.21132.614054.475437.418357.466858.56032
Publisher’s Note: MDPI stays neutral with regard to jurisdictional claims in published maps and institutional affiliations.

