1. Introduction
Climate change caused by global warming is the greatest environmental challenge to our world today [
1]. The Intergovernmental Panel on Climate Change (IPCC) asserted unequivocally that the blame is mostly on humans [
2]. Thus, humans need to intervene to mitigate climate change [
3], which motivated the Paris Agreement. Carbon capture and storage (CCS), which includes transport, is widely recognised as a promising measure to mitigate CO
2 emissions associated with the combustion of fossil fuels in power plants, cement plants and other process industries [
4]. A number of carbon capture technologies and techniques have already been recognised: the absorption of CO
2 into solvents followed by desorption [
5], the separation of CO
2 from exhaust gas by means of membrane [
5], the adsorption of CO
2 on solid adsorbents [
6], the separation of CO
2 from flue gas through cryogenic means [
5] and the direct injection of exhaust gas into naturally occurring gas hydrate reservoirs so CO
2 forms hydrate mainly with pore water [
7]. Mechanisms of CO
2 hydrate formation and stabilisation are described in [
8,
9,
10].
Solvent-based CO
2 capture technologies, especially the monoethanolamine (MEA) process, are the most mature option and are ready for industrial deployment [
3,
11]. The key challenge is still the high cost of its industrial deployment. CO
2 capture and compression processes account for 80% of this cost, while the CO
2 transport and storage processes each account for 10% of the cost [
4,
12]. Consequently, there is a necessity to investigate cost reduction possibilities, particularly in the CO
2 capture process.
Several research efforts have been devoted to reducing the cost of the energy required. These include improved process configuration designs through flowsheet modifications [
13] and the development of improved solvents and blends of solvents [
14,
15,
16]. Recently, the recovery of waste heat to provide heat for desorption to reduce the cost of the heat demand has been studied [
17,
18]. Another essential aspect which needs to be given attention is the process units that make up the CO
2 capture process. It is therefore important to seek cost reduction possibilities in the most important or expensive equipment units of the process. The lean/rich heat exchanger, which is also often called the cross-exchanger, is one of the important cost centres of the process. If any of the shell and tube heat exchanger types are used as the lean/rich heat exchanger, the lean/rich heat exchanger can account for 12–33% of the total plant cost (TPC) depending on the process scope [
3,
14,
19,
20,
21].
Most of the CO
2 absorption and desorption technoeconomic studies broadly specify shell and tube heat exchangers (STHXs). Nevertheless, references [
3,
19,
20,
22,
23] have advocated for the plate heat exchanger (PHE) to replace the conventional STHX in CO
2 capture processes to reduce cost. We have shown that the specific type of heat exchanger employed in the carbon capture process has a significant influence on the capture cost [
3]. However, besides the preliminary results we presented at the 61st International Conference of Scandinavian Simulation Society (SIMS 2020) [
20], we did not find any work in the literature where a comprehensive cost optimisation of the lean/rich heat exchanger in a CO
2 absorption and desorption process using different types of heat exchangers, based on the minimum temperature approach (
) or logarithmic mean temperature difference (LMTD) was conducted, which is needed to identify cost reduction potential. This work therefore seeks to perform a trade-off analysis between energy and different heat exchangers’ costs based on optimal
. This is to examine how much of the carbon capture or avoided cost can be saved or reduced through finding the optimum
. Conducting this study with only one specific type of heat exchanger is not comprehensive enough or sufficient to draw a conclusion on the impact of
on the cost of carbon capture and actual CO
2 emissions reduction.
This study is based on initial cost estimates. The initial cost estimation of heat exchangers in solvent-based CO
2 capture plants is based on the required heat exchanger area. This is evaluated from the heat duty, overall heat transfer coefficient (
U) and the logarithmic mean temperature difference (LMTD). The LMTD is calculated based on
at the cold and hot sides of a heat exchanger. In some studies, the LMTD is approximated to the
[
14,
23] since it is merely slightly higher than the
. Therefore, for a given thermal load, it is the
that determines the size of the heat transfer area needed in the lean/rich heat exchanger [
19]. According to reference [
11], the heat exchanger surface area needed in a lean/rich heat exchanger doubles if the
of 5 °C is applied instead of 10 °C. In addition,
also determines the amount of heat that can be recovered from the regenerated lean amine by the rich amine stream. Eimer [
23] calculated that 7% more heat and 7% less heat would be recovered if a
of 5 °C and 15 °C, respectively, are used instead of 10 °C. Therefore, a cost reduction study focused on a lean/rich heat exchanger using different heat exchangers, as was completed in [
3], is incomplete without studying the influence of
.
There are arguments about the influence of
on cost saving potential. According to [
24], reference [
25] argued that a reduction in reboiler heat consumption through a reduction in the
in a lean/rich heat exchanger is not significant. Arguments for higher
suggest that this lowers the cost of a heat exchanger required, as found in [
11]. Different researchers have applied different
in their studies. References [
26,
27] specified 5 °C in their work. Reference [
11] conducted their study using both 5 °C and 10 °C and emphasised that the
is an important parameter to optimise in the solvent-based CO
2 capture process. Reference [
28] used 8.5 °C, while reference [
22] applied 11 °C and claimed it to be close to the optimum. Reference [
29] performed their study with 15 °C. In their study, Alhajaj et al. [
4] specified 20 °C to greatly reduced the influence of the lean/rich heat exchanger on the plant’s capital cost, while 10 °C is most commonly used [
14,
30,
31].
For comprehensiveness, the fixed tube sheet shell and tube heat exchanger (FTS-STHX), U-tube shell and tube heat exchanger (UT-STHX), floating head shell and tube heat exchanger (FH-STHX) and the gasketed-plate heat exchanger (PHE) were selected for this study. The FTS-STHX is probably the most common type found in the process industry [
32]; thus, in this study, it was selected as the base case scenario for the lean/rich heat exchanger. In addition, 10 °C was also specified as the base case
since it is most common in the literature. The impact of available excess heat from the cement plant on cost optimum
was also studied. How the
affects the actual amount of CO
2 emissions reduction was investigated.
Objectives
This study was a trade-off analysis of energy cost and the cost of different but the most common types of heat exchangers that can be applied as a lean/rich heat exchanger in a CO2 absorption and desorption process. The aim was to evaluate the cost optimum in terms of the commercial metric known as CO2 capture cost (CCC) and CO2 avoided cost (CAC), which considers CO2 emissions in operation of the capture plant. The specific objectives in this study were:
To evaluate the economic (cost reduction) and environmental (emissions reduction) implications of selecting a shell and tube type or a plate heat exchanger based on optimal cost, through trade-off analysis of energy and heat exchanger costs with respect to .
To give a comprehensive assessment of the influence of . on heat recovery in a lean/rich exchanger, on the heat exchange area of a lean/rich heat exchanger and heat duties of a reboiler and lean amine cooler.
To evaluate the impact of available excess heat from the cement plant on cost optimum . Since the Norcem AS cement plant at Brevik in Norway was used as a case study, steam produced from the excess or waste heat was assumed to cover 50% CO2 capture steam requirement.
To perform sensitivity analysis of steam cost and total plant cost on the economic performance of the capture processes at different .
2. Methodology
2.1. Scope of Analysis
All the cost estimates in this work are initial cost estimates. The cost optimisation in the study also refers purely to finding the minimum cost through trade-off analysis of energy consumption costs and the cost of a lean/rich heat exchanger resulting from varying . The optimum is the one that gives the minimum cost.
Since the most common in the literature is between 5 °C and 15 °C, the trade-off analysis is conducted for a range of 5 °C to 20 °C. In the case of the PHE, the range was extended to 3 °C to determine the optimum cost.
Detailed mechanical engineering design and optimisation are not necessary in initial cost estimation. Thus, details such as tube length and tube diameter are outside the scope of this work. In each case, a specific type of heat exchanger, for example, in the case of the fixed tube sheet shell and tube heat exchanger (FTS-STHX), only an FTS-STHX was used as the lean/rich heat exchanger, as the lean MEA cooler and as cooler for cooling the direct contact cooling (DCC) unit circulation water stream. The condenser, condensate cooler and intercoolers were specified as UT-STHX in all cases.
The cost metrics of CO2 capture cost and CO2 avoided cost were used. However, CO2 avoided cost was only estimated for the cement plant’s flue gas treatment processes. The capture cost is a mere commercial metric, but the avoided cost considers actual climate change or CO2 emission implications in operation of the plant.
The cost estimates were based on Nth-of-a-kind (NOAK) plants. These are chemical plants that have been commercially built after the technology has been successfully adopted and experience has been gained from first-of-a-kind (FOAK) plants.
Energy provision for the plant was assumed to be from the combustion of natural gas. Thus, the CO
2 emissions that result from energy (steam) production were accounted for as 0.00018 tCO
2/kWh (thermal) [
33]. Meanwhile, for electricity, it was four times this value for steam by assuming 25% efficiency in the conversion of steam to electricity [
34,
35,
36].
For comprehensiveness, 90% CO
2 absorption from flue gas of two different industrial processes with different flow rates and CO
2 concentrations were considered. They were exhaust gas from a 400 MW combined-cycle (NGCC) power plant in Mongstad near Bergen and flue gas from the Norcem AS cement plant at Brevik both in Norway [
37,
38].
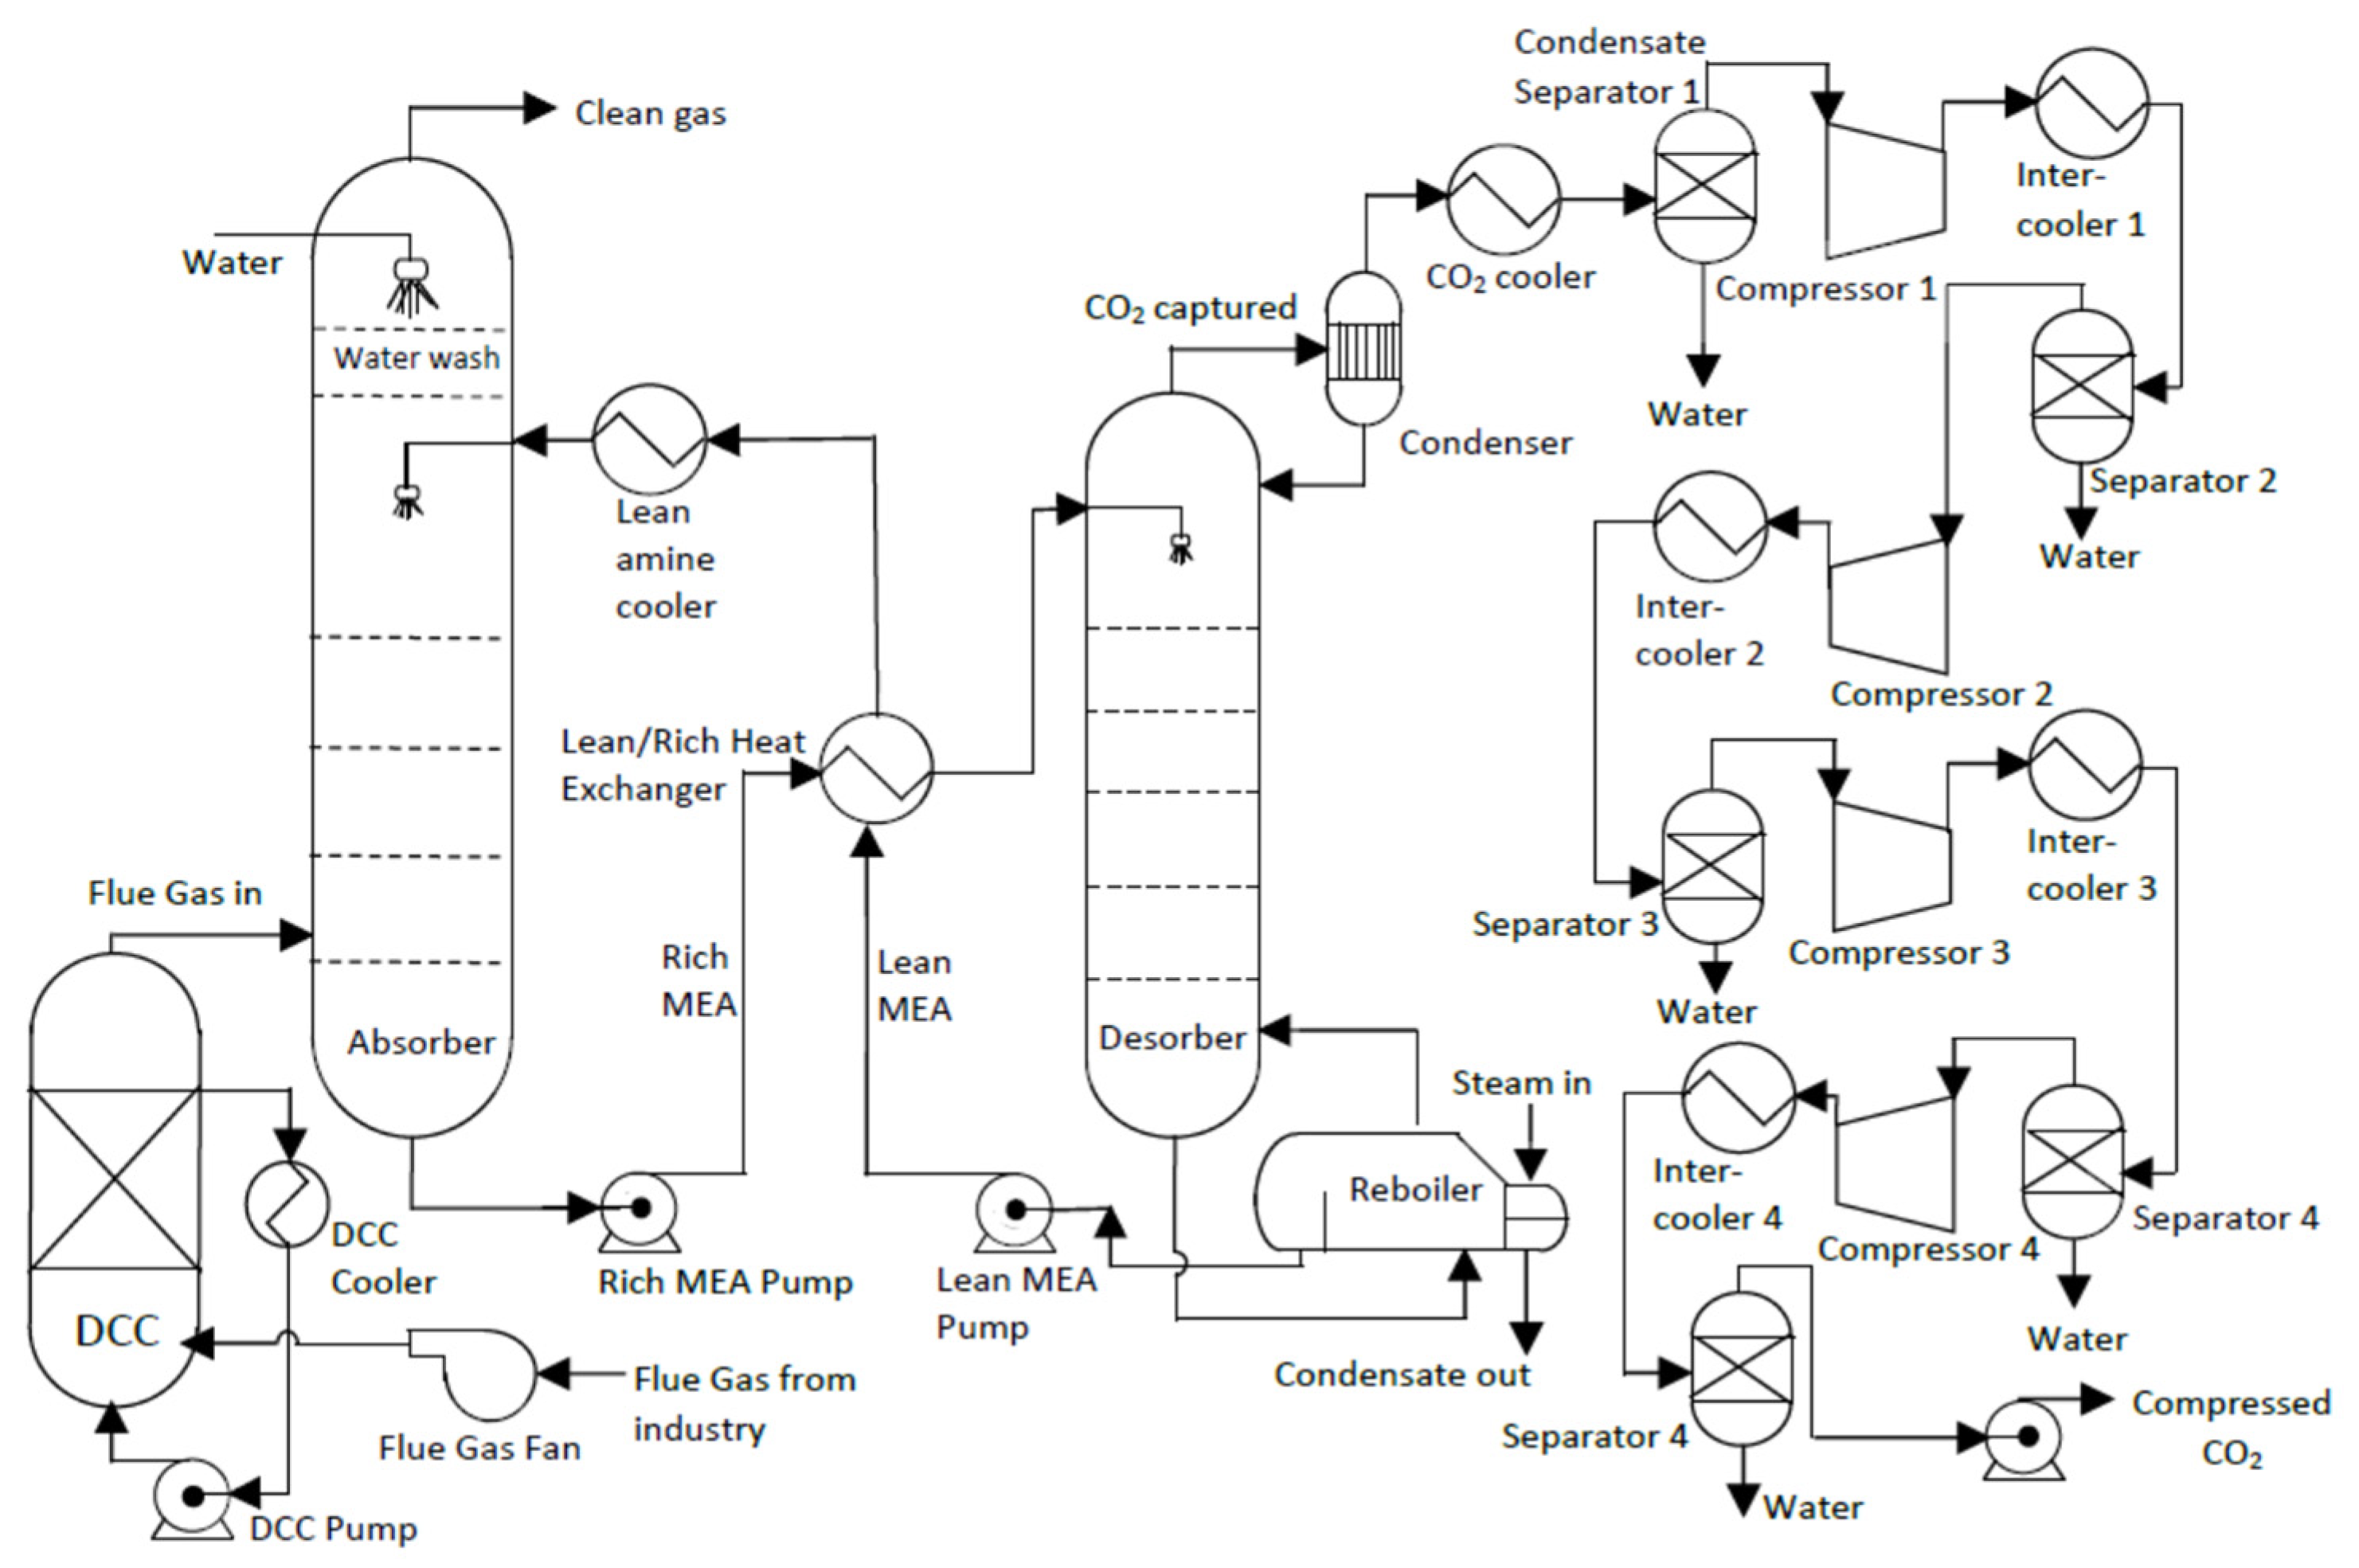
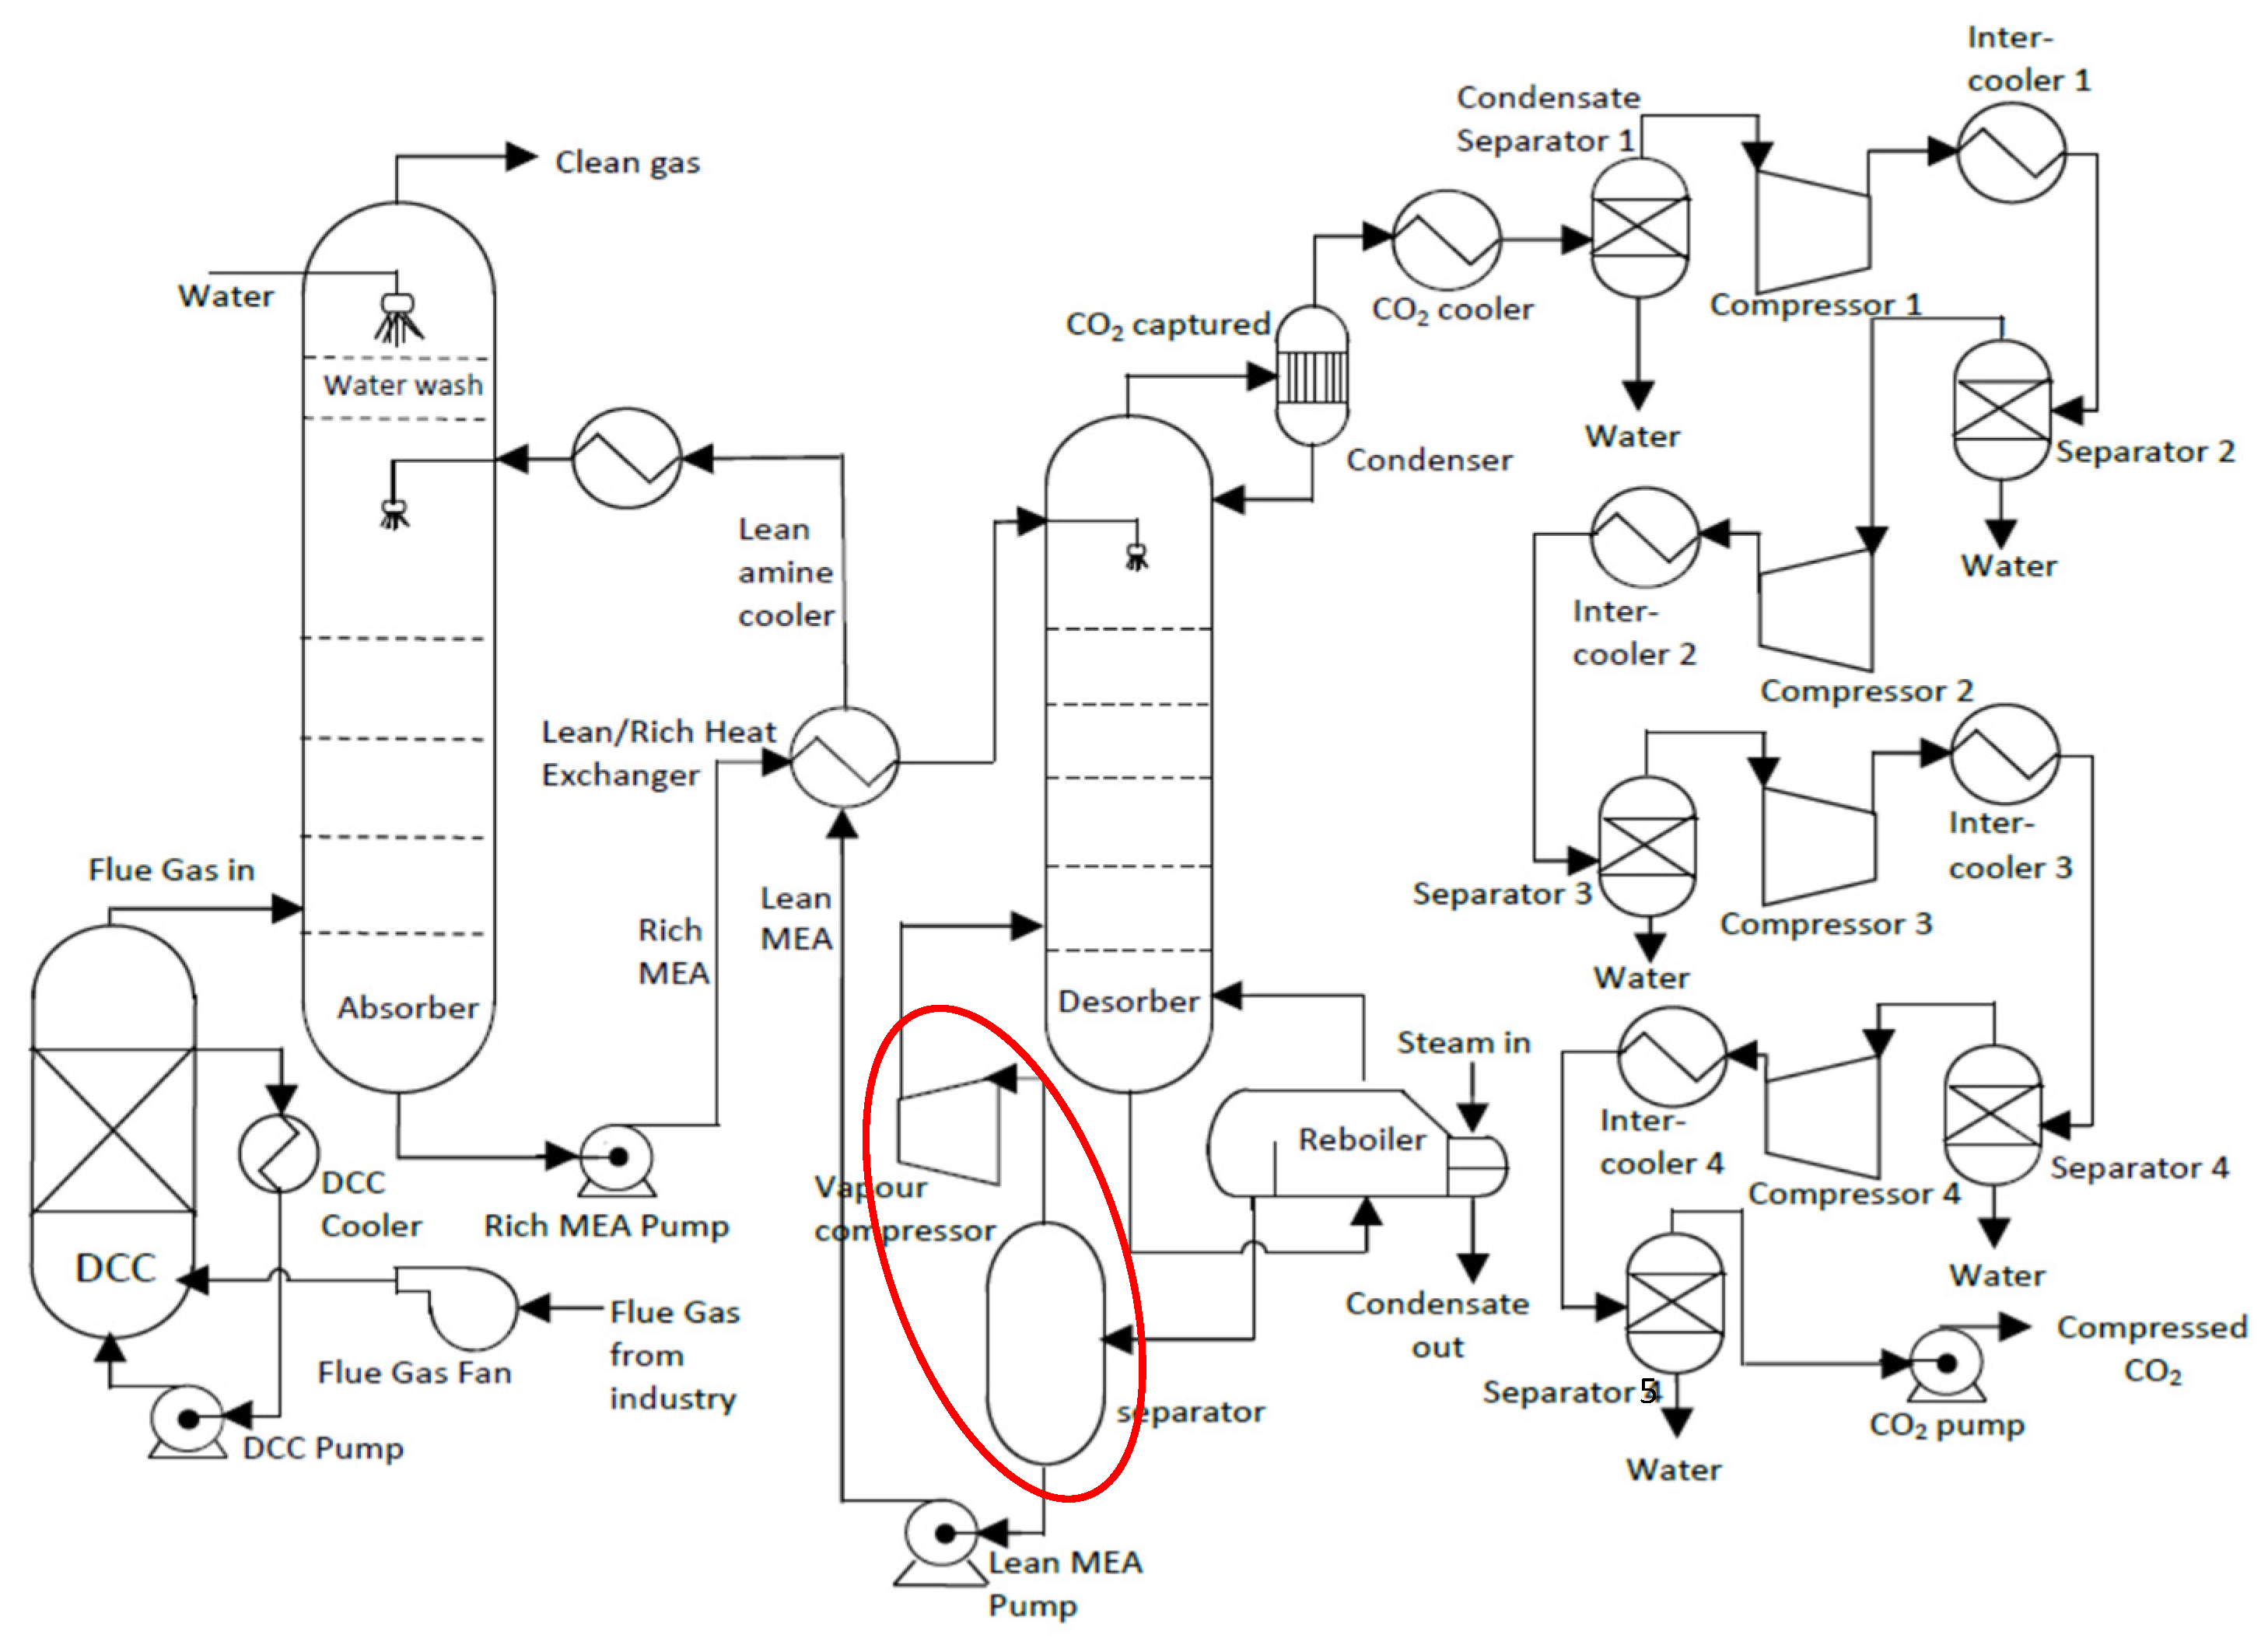
Two process configurations were also studied: the standard and the lean vapour compression (LVC) CO
2 absorption and desorption models. The schematic descriptions of the two processes are presented in
Figure 1 and
Figure 2. How they were implemented in the simulation, that is, the process flow diagrams (PFDs), are attached in
Appendix A as
Figure A1,
Figure A2,
Figure A3 and
Figure A4. The process only includes the flue gas fan and the direct contact cooler (DCC) precooling section, the absorption–desorption process and the CO
2 compression section. For simplicity, the water wash section shown in
Figure 1 is not included. The compression section was modelled as was shown in [
39]. The compression was carried out in four stages with intercoolers and separators. A CO
2 pump was used to pump the supercritical CO
2 from the final pressure of 76 bar to 110 bar. CO
2 transport and storage were not necessary in this work. CO
2 transport and storage estimates are available in [
40,
41,
42]. Location factor was assumed as 1 since it was not important in this study.
2.2. Process Simulations
A 30 wt% monoethanolamine (MEA) process simulation for 90% CO2 capture from the two flue gases was performed in Aspen HYSYS Version 12. The lean amine stream entered the top of the absorber at 40 °C and at 1.013 bar. The reflux ratio in the desorber was 0.3. The first process for CO2 capture concerned exhaust gas from a natural gas combined-cycle (NGCC) power plant in Mongstad, close to Bergen in Norway. The second capture process concerned flue gas from Norcem Cement plant in Brevik in Norway.
The NGCC power plant exhaust gas and the cement plant’s flue gas specifications are given in
Table 1 and
Table 2, respectively. The simulation strategy was the same as in our previous works [
34,
35,
37]. The absorber in the NGCC case was simulated with 17 packing stages (1 m per packing stage) with Murphree efficiencies of 11–21% from the bottom to top, as was carried out in [
31,
35]. The cement plant’s case absorption column was simulated with 29 packing stages (0.6 m per packing stage) with a constant Murphree efficiency of 15% based on [
24]. Thus, the cement plant’s case absorption total packing height was 17.4 m. In both cases, the desorption column was simulated with 10 packing stages (1 m per packing stage) each and a constant Murphree efficiency of 50%. The desorber was maintained at 2 bar, and the reboiler temperature was specified as 120 °C. The minimum temperature approach of the lean/rich heat exchanger was 10 °C in the base case.
The DCC section and compression section of both processes were modelled in the same way. The flue gas fan raised the flue gas pressure from 1.01 bar to 1.21 bar to cover for the pressure drop in the absorber. Each of the compression stages had a pressure ratio of 2.8. The inlet pressure of the first stage was at 1.5 bar, and the final compression pressure was 75.9 bar. With the aid of the intercoolers, the temperature of the CO
2 stream was maintained at the supercritical temperature of 31 °C. The CO
2 streams, each having a purity of 99.74%, were then pressurised to 110 bar, as carried out by [
39].
2.3. Equipment Dimensioning and Assumptions
The equipment sizing was based on the mass and energy balances from the process simulations. The approach was the same as that used in [
3,
20,
36,
43].
The absorption and desorption columns were dimensioned based on superficial gas velocity using the Souders–Brown equation with a k-factor of 0.15 m/s [
44]. Structured packing was selected as advocated by [
22] to reduce operating cost by reducing the pressure drop. A shell tangent-to-tangent height (TT) of 40 m was specified for both systems’ absorption columns to account for the water wash section, even though its details were not included in the study. The desorption columns’ shell tangent-to-tangent heights were also specified as 25 m.
The flue gas fans, pumps and compressors in both processes were sized based on their duties in kW and flow rates in m3/h, except the pumps in l/s. The values were obtained directly from the simulation.
The separators were dimensioned as vertical vessels; the vessel diameter was calculated using the Souders–Brown equation with a k-factor of 0.101 m/s [
44,
45]. A corrosion allowance of 0.001 m, joint efficiency of 80%, stress of 2.15 × 10
8 Pa, and a tangent-to-tangent to diameter ration of 3, i.e., TT = 3Do [
35,
45] were specified. The direct contact cooler (DCC) unit was dimensioned in similar manner, with the shell tangent-to-tangent height specified to be 15 m and a 4 m packing height.
The reboiler, coolers and condenser were sized based on the required heat exchange area, as carried out for the main heat exchangers in the next section. All the cooling water inlet and outlet temperatures were specified to 15 °C and 25 °C, respectively, and were controlled using adjust functions. The overall heat transfer coefficients of 1200 W/m
2·K and 1000 W/m
2·K [
35] were specified for the U-tube kettle-type reboiler and condenser (UT-STHX)m respectively. Meanwhile, 800 W/m
2·K [
35] and 1600 W/m
2·K were used for the coolers with STHXs and PHE, respectively. The conditions of steam supplied to the reboiler were 145 °C and 4 bar, while it exited at 130 °C and 3.92 bar.
2.4. Basis for Heat Exchange Equipment Sizing and Assumptions
Initial cost estimation of heat exchangers is mainly based on the required heat exchange area. This is the surface area needed to effectively recover a reasonable amount of heat from the returning lean amine stream from the desorber to heat up the rich amine stream. The estimation of the required heat exchange area is relatively simple compared to columns and vessels during initial cost estimation. This is simply completed using Equation (1):
where
is the thermal load, and
U is the overall heat transfer coefficient. “A” refers to the required heat exchange area, and
is the log mean temperature difference (LMTD). Subscript “STHX” stands for shell and tube heat exchanger type, while subscript “PHE” represents the plate heat exchanger. Since the LMTD is only slightly higher than the minimum temperature approach (
), some studies simply assume LMTD
[
14,
23]. In this study, LMTD is calculated as shown in Equation (3).
where
and
are the temperature of the returning lean amine stream at the hot side and cold side, respectively. The temperature of the cold stream, rich amine at the cold side and hot side are represented with
and
, respectively.
In the literature, constant overall heat transfer coefficients are typically used in techno-economic studies (initial cost estimates) of carbon capture processes [
46]. The following values can be found for the overall heat transfer coefficients,
U for the lean/rich heat exchanger in an MEA CO
2 capture process with a shell and tube heat exchanger (STHX): 500 W/m
2·K [
24], 550 W/m
2·K [
47], 710 W/m
2·K [
48], 732 W/m
2·K [
14] and 760.8 W/m
2·K [
4]. The
U-value in [
14] is used this work. If we assume LMTD
, as done in [
14,
23], Equation (1) becomes:
or
The overall heat transfer coefficient of the plate heat exchanger is much higher than that of the shell and tube heat exchangers. Thus, they exhibit an order of magnitude higher surface area per unit volume in comparison with the STHXs. The overall heat transfer coefficient for the PHE is 2–4 times of the STHXs [
32,
49,
50]. Based on that, a conservative overall heat transfer coefficient of 1500 W/m
2·K was assumed in this work. Therefore, Equations (4) and (5) for the PHE become:
or
Equations (5) and (7) simply indicate that the required heat transfer surface area is directly proportional to the thermal load and inversely proportional to the minimum temperature approach . The inverse relationship between the required heat exchange area and the minimum temperature approach () shows that decreasing implies increasing the required heat exchange surface area, and thus, an increase in capital cost. On the other hand, the lower the , the higher the . An increase in implies a decrease in the reboiler heat demand for desorption, which in turn means lower energy costs.
2.5. Capital Cost Estimation Method and Assumptions
The capital cost (CAPEX) in this work was estimated with the Enhanced Detailed Factor (EDF) method, which follows a bottom-up approach. The comprehensive details can be found in [
31,
35]. Here, the CAPEX is the total plant cost (TPC), which is the sum of all equipment installed costs. Since the work involved iterative simulations and cost estimation, it was implemented according to the Iterative Detailed Factor (IDF) Scheme as documented in [
36]. It falls under Class 4 of the AACE International (Association for the Advancement of Cost Engineering) for concept screening and feasibility studies. Therefore, the accuracy of the TPC is expected to be ±30.
Equipment cost data were obtained from the most recent Aspen In-Plant Cost Estimator, i.e., Version 12, with a cost period of the first quarter of 2019. The capital cost year was 2020; thus, the cost estimates were escalated to 2020 using the Norwegian Statistisk Sentralbyrå (SSB) [
51] industrial construction price index. Stainless steel was specified for almost all the main plant equipment because of corrosion. The flue gas fan and casing of the compressor were assumed to be constructed from carbon steel. The main assumptions for the estimation of the capital cost are summarised in
Table 3.
2.6. Annual Operating and Maintenance Costs Estimation and Assumptions
The operating and maintenance costs in this work were divided into variable operating costs (VOCs) and fixed operating costs (FOCs). The economic assumptions utilised for the VOCs and FOCs are tabulated in
Table 4.
2.7. CO2 Capture Cost and CO2 Avoided Cost Estimation
The main cost metrics in this work were CO
2 capture cost and CO
2 avoided cost. Levelised cost or levelised cost of electricity (LCOE) for power plants’ cost estimates is another important cost metric, but it was not used in this work. The estimation of CO
2 avoided cost was only performed for the CO
2 capture process for the cement flue gas. This accounts for CO
2 emissions during the production of the electricity and steam needed for desorption. According to the U.S. Energy Information Administration [
33], for each kWh of steam produced from natural gas, 0.18 kg of CO
2 is emitted. That means, for every kWh of electricity consumed, 0.64 kg of CO
2 is emitted. This is the basis for CO
2 avoided cost estimation in this work, to account for the actual CO
2 emissions reduction. The annualised capital cost, annualised factor, total annual cost (TAC) and CO
2 capture cost were estimated using Equations (8)–(11), respectively. Symbol
n is the number of operational years, and
r is the discount rate. The CO
2 avoided cost in this work was estimated with Equation (12), which is equivalent to (13), as was also carried out in several studies in the literature [
29,
52,
54,
55]. The cost of transport and storage were not included. This is because transport and storage costs depend on the mode of transport, distance and specific characteristics of the storage site. When the transport and storage costs are included to account for the entire CCS chain, Equation (14) is used.
Equation (8) is applied to compute the
annualised factor.
3. Results and Discussion
3.1. Base Case Simulation Results and Discussion
The results obtained in the base case process simulations of this work are compared with those found in the literature in
Table 5 and
Table 6. The references in
Table 5 and
Table 6 are simulations of CO
2 capture processes from an NGCC power plant and a cement plant’s flue gases, respectively. In addition, they are all 30% MEA solvent CO
2 capture processes. The CO
2 concentrations in the flue gases are provided.
In the NGCC power plant’s case, the rich loading in this work is only about 0.02–0.03 more than the references [
28,
30,
56]. The lean loading of the references is not available to ascertain their cyclic capacity. The reboiler specific heat consumption calculated in this work is 4.8% less than the results published in [
30,
56]. The absorber packing heights have great influence on the reboiler heat requirement, and they vary from one study to another, as can be seen in
Table 5. The result calculated in this work is almost the same as the simulation result of [
28]. The
are, however, different; reference [
28] used 8.5 °C, while 10 °C was specified in this work. Reboiler specific heat requirements of 3.66 GJ/tCO
2 and 3.70 GJ/tCO
2 were calculated for
of 8 °C and 9 °C, respectively, in this work. The agreement of the results of this work with the references is good.
In the cement plant flue gas CO
2 capture process, the specific reboiler heat consumption calculated is 0.7% to 3.4% higher than the references [
14,
57]. The agreement in the cement process is also good.
3.2. Base Case Capital Cost Analysis
The estimates of total plant cost (TPC) of the different plant scenarios are presented and compared in
Table 7. These results are only for the base cases with
of 10 °C. Here and in all other parts of this paper, the FTS-STHX case with
of 10 °C is the reference case. The heat exchanger areas used for the heat exchanger purchase costs in this work were estimated based on Equations (1)–(7). In each case, the same type of heat exchanger was specified for the lean/rich heat exchanger, lean MEA cooler and DCC cooler functions, while the UT-STHX was specified for the condenser and condensate cooler.
The estimates of the standard CO
2 capture processes for the cases of the STHXs systems are close to results in the literature. Manzolini et al. [
58] estimated a TPC of an MEA-based standard CO
2 capture plant from an NGCC power plant to be EUR 163.2 million in 2015. Li et al. [
59] estimated a TPC of USD 132.6 million (2013) for an MEA-based post-combustion CO
2 capture from a 650 MW
e advanced pulverised coal (APC) power plant. The cost is expected to be lower due to the higher partial pressure of CO
2 in an APC power plant exhaust gas. This is in addition to the fact that even the estimated TPCs of similar plants are expected to differ due to the different capital cost estimation methods and underlying assumptions, as well as different plant-specific characteristics [
35]. They also used a
of 15 °C, which will cause a significant reduction in the capital cost due to a reduction in the cost of the cross-exchanger. It is challenging to make a direct comparison of cost estimates from different studies [
35,
41,
52].
A TPC of EUR 76 million (cost year of 2014) was estimated by [
52] for a representative size of a European cement plant with a clinker annual production capacity of 1 metric ton. This study used the Norcem As cement plant in Brevik as a case study, which has an annual cement production of around 1.2 million tons [
60].
The results in
Table 7 indicate that 14% and 17% can be saved if PHE is specified for the cross-exchanger, lean MEA cooler and DCC cooler functions in the NGCC power plant and cement plant standard CO
2 capture processes, respectively. If the lean vapour compression (LVC) configuration is implemented, in both industrial processes, a 10% cost reduction in TPC will be achieved if the PHE is used instead of the FTS-STHX.
3.3. Capital Cost Distribution
It is important to establish the capital cost contributions of the different functional operational units, to show why attention needs to be given to the cost reduction of lean/rich heat exchangers. This is a common practice when the EDF method is employed for the capital cost estimation of a process plant [
35]. It helps during the process development because the process engineer can see the effect of their choices very quickly. In addition, it becomes easier to communicate between the cost estimator and the process developer on which equipment needs to be cost optimised [
35].
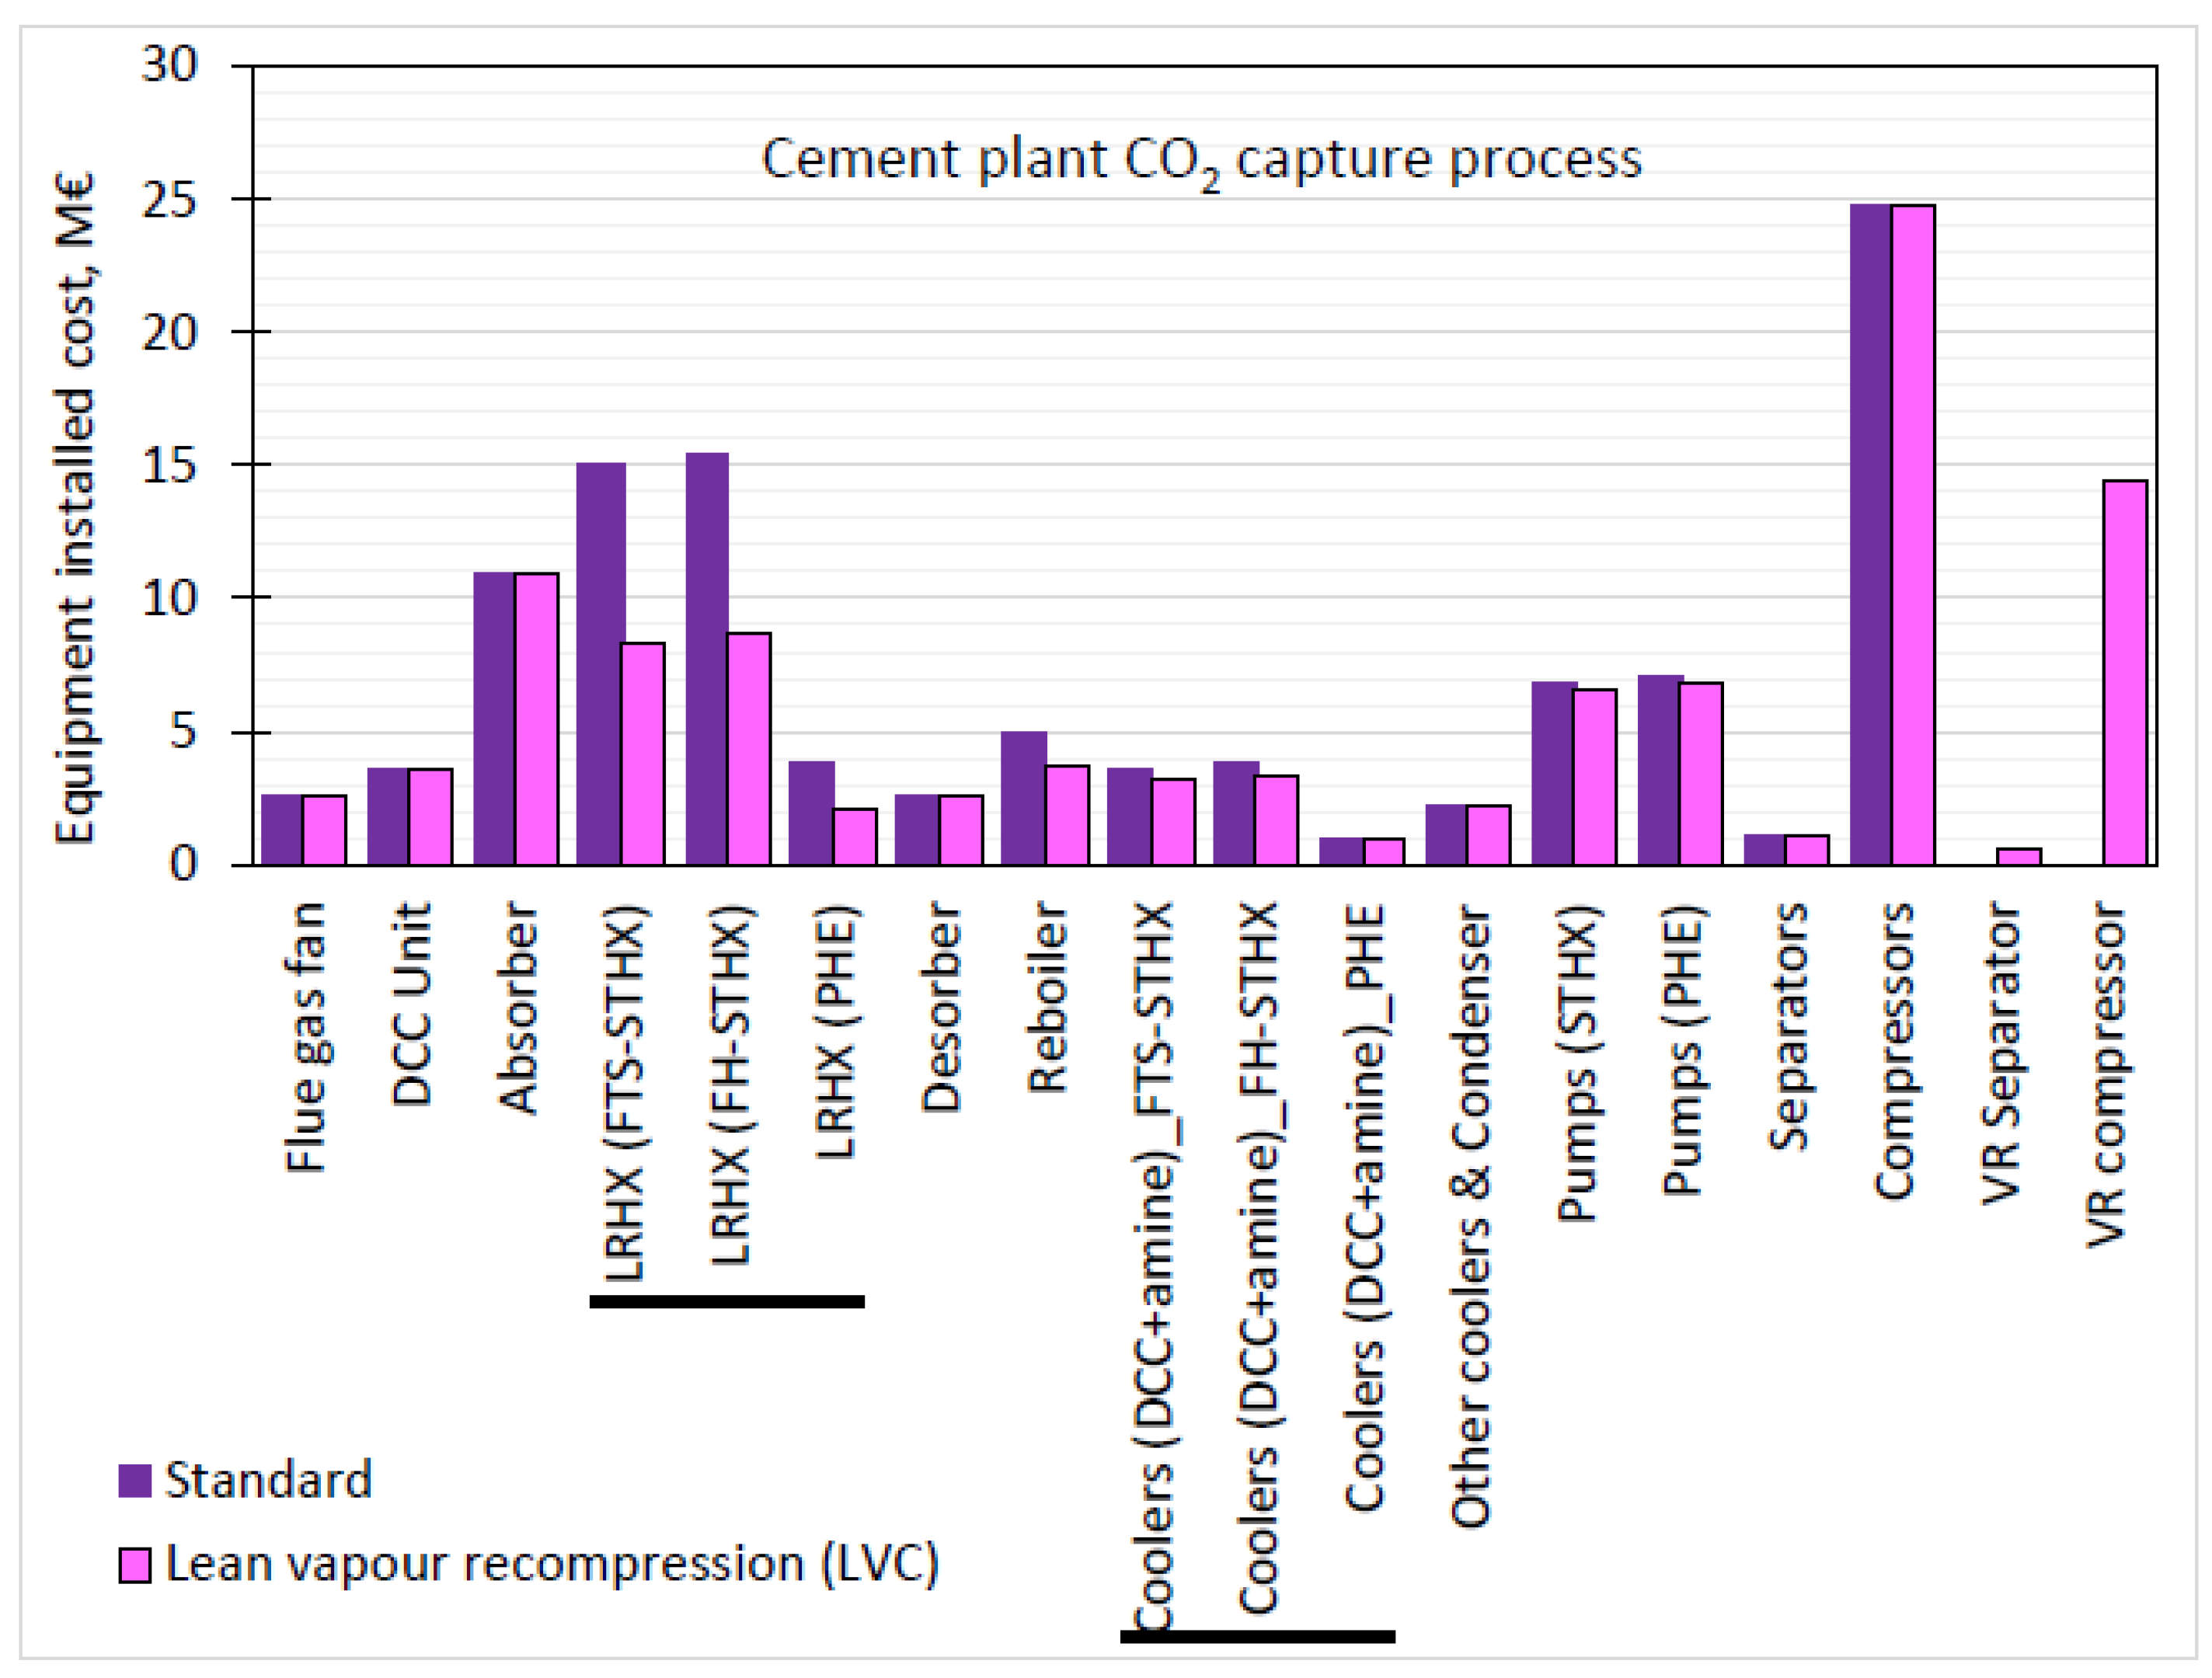
Figure 3 and
Figure 4 present the capital cost distribution of the CO
2 capture plant for the NGCC power plant’s exhaust gas and the cement plant’s flue gas, respectively. If any of the three shell and tube heat exchanger types are employed as the lean/rich heat exchanger, then the lean/rich heat exchanger becomes the second- and third-highest contributing equipment to the total plant cost in the standard cases of the cement plant and NGCC power plant capture processes, respectively. The cross-exchanger contributes 16% or 17% if FTS-STHX or FH-STHX, respectively, is selected for its function in the two standard CO
2 capture and compression processes. Nwaoha et al. [
14] showed that broadly specified STHX calculated the cross-exchanger contribution in an MEA capture process from a cement plant flue gas to be 17%, which is the same value estimated for the FH-STHX case in this study. This study applied the same overall heat transfer coefficient as [
14]. The lean vapour compression configuration reduced the lean/rich heat exchanger’s contribution to 10% in both FTS-STHX and FH-STHX cases and in both the NGCC power plant and the cement flue gas treatment processes. This is because of a reduction in steam requirement by the reboiler due to the extra stripping vapour supplied to the desorber in this case. If PHE is used instead of any of the STHXs, the cross-exchanger will only contribute 5% and 3% to the TPC in both standard and lean vapour compression CO
2 capture plant configurations, respectively, in two different industrial processes.
Since the same type of heat exchanger was specified for the cross-exchanger, lean MEA cooler and DCC cooler functions, in the NGCC power plant’s case, the total plant cost will decline by 14% and 9% for the standard configuration and the lean vapour compression configuration, respectively, in comparison with the reference case (FTS-STHX). In the cement plant’s case, the reduction in TPC is 17% and 10%, respectively. These results for the base cases show a significant cost reduction in the TPC.
In the NGCC power plant cases, the absorber contributes the highest amount to the TPC. That is, 42–44% and 31–34% in the standard model and the lean vapour compression configuration, respectively. Meanwhile, in the cement plant’s cases, the contributions are 14–17% and 13–14% in the standard model and the lean vapour compression configuration, respectively. This is low due to the relatively lower volume flow of flue gas and higher CO
2 partial pressure due to the higher CO
2 concentration in this case compared to the power plant’s case. The absorber dimensioning results for both systems are presented in
Table 8. In the case of the NGCC power plant, the absorber was split up into three units since for diameters greater than 10 m, concrete columns are a better choice, and stainless steel was specified in this study [
46].
3.4. Impact of Minimum Temperature Approach on Heat Recovery and on the Required Heat Exchanger Surface Area
The minimum temperature approach of the lean/rich heat exchanger of a solvent-based CO
2 absorption and desorption process determines how much heat can be recovered by the rich stream from the lean stream flowing from the desorber. This is shown in
Table 9, where the heat recoveries at the
of 5 °C, 15 °C and 20 °C are compared with the heat recovery of the base case
of 10 °C. The results obtained are compared with the results also calculated for a 400 MW NGCC power plant exhaust gas in the book of Dag Eimer [
23]. Negative values represent relative less heat recovery, while positive values show how much more heat is recovered compared to
of 10 °C.
Even though the estimated amount of heat recovery in the base case
in [
23] is 6% less than the result in this work, both works calculated 7% more heat recovery at
of 5 °C compared to the reference process at
of 10 °C for the NGCC system. The heat recovery is higher in this work because the cold rich stream enters the cross-heat exchanger at 46 °C, while 50 °C was assumed by [
23]. At
of 15 °C, 8% less heat recovery was obtained in this work in the CO
2 capture from the NGCC power plant’s exhaust gas, while [
23] also calculated this value to be 7%. In this work, in the NGCC system, if
of 20 °C is specified, the heat recovery will decrease by 16%.
No work was found to compare the heat recovery results for the cement system. However, the heat recovery at of 5 °C is about 10% higher than at of 10 °C in the CO2 absorption and desorption in the cement plant scenario. At of 15 °C and 20 °C, heat recovery decreases by approximately 9% and 20%, respectively.
The comprehensive results of heat duties of the cross-exchanger, reboiler and lean MEA coolers at the different
are presented in
Table 10,
Table 11,
Table 12 and
Table 13 for the NGCC exhaust gas cleaning process and cement plant flue gas purification systems. These four tables also show the resulting heat exchange surface area required in the lean/rich heat exchanger for a
range of 5–20 °C for the STHXs and a
range of 3–20 °C for the PHE. The relative increase and decrease in the heat transfer area needed in the lean/rich heat exchanger for both the STHXs and PHE are also computed and presented in
Table 9,
Table 10,
Table 11 and
Table 12.
In the NGCC power plant standard CO
2 capture process, if a
of 5 °C is specified in the lean/rich heat exchanger instead of 10 °C, the required heat exchange area becomes 76% larger if any of the STHXs are employed as the lean/rich heat exchanger. If the PHE is used, then the calculated surface area becomes 95% larger at 5 °C instead of 10 °C. According to Karimi et al. [
11] and Eimer [
23], the required heat exchanger area doubles if a
of 5 °C is used instead of 10 °C. The analysis of Eimer [
23] is based on the same 400 MW NGCC process as was completed in this work. The work of [
11] regards a 90% CO
2 absorption and desorption from a 150 MW bituminous coal power plant’s exhaust gas. In the NGCC system, especially for the PHE case, the results of this work are close to two times the heat transfer area required if
of 5 °C is used instead of the reference
of 10 °C. The difference is simply due to the overall heat transfer coefficients used. In this work, an overall coefficient (
U-value) of 732 W/m
2·K [
14] was used to estimate the required heat transfer area for the STHXs. Eimer [
23] used 1250 W/m
2·K, which is considerably higher than the
U-values in CO
2 capture studies such as [
14,
24,
31,
47]. Since the analysis of Karimi et al. [
11] was based on data from [
61,
62], the overall heat transfer coefficient used for the STHX surface calculation should be considerably higher than the
U-value in this work and in [
14,
24,
31,
47].
In the cement plant standard CO2 capture process, decreasing the from 10 °C to 5 °C resulted in a 97% and 100% increase in the heat exchanger area needed for the cases of STHXs and PHE, respectively.
In the lean vapour compression cases, using of 5 °C instead of 10 °C caused the heat exchanger area to increase by 128% for both the STHXs and PHE in the NGCC power plant CO2 capture process. Meanwhile, in the case of the cement plant, the increase is 138% and 139% for the STHXs and PHE, respectively.
The number of heat exchanger units required are significantly fewer if the PHE is selected for the CO
2 capture operations instead of the STHX. These also lead to a lower area or volume requirement as well as less capital cost, as also shown in
Figure 2 and
Figure 3. The reboiler duty increases by 1–2 MW with an increase of 1 °C of
of the lean/rich heat exchanger. The duty of the lean MEA cooler also increases at approximately 2–3 MW for every 1 °C increase in the
of the lean/rich heat exchanger. The specific heat demand by the reboiler increases mainly between 0.03–0.04 GJ/tCO
2 with each 1 °C increase in the
of the lean/rich heat exchanger.
Table 14 provides a summary of comparison between the standard and the lean vapour compression configuration CO
2 capture processes.
The results in this section show that the
of the lean/rich heat exchanger has significant influence on important economic variables in a CO
2 absorption and desorption process. An increase in the reboiler duty implies an increase in the amount of steam needed. The amount of cooling water needed also increases with increase in the lean amine duty. As the reboiler and lean MEA cooler duties increases with an increase in the
of the lean/rich heat exchanger, the corresponding required heat transfer area also increases; therefore, to arrive at the minimum cost of the process, a trade-off analysis is required using Equations (8)–(11) and (13), as also stated by [
11]. In this work, Equation (10) is mostly used for the trade-off analysis, which also depends on Equations (8) and (9).
3.5. Base Case Variable Operating Cost (VOC)
The varying heat duties in the reboiler and in the lean MEA cooler with varying
of the lean/rich heat exchanger in
Table 10,
Table 11,
Table 12 and
Table 13 have variable operating cost implications. An increase in reboiler heat consumption implies an increase in energy (steam) cost. Meanwhile, changes in the duty of the lean MEA cooler mean changes in both the amount of cooling water needed and electrical energy consumption for pumping of water, as the situation demands.
Figure 4 shows that these variables which are influenced by the
of the lean/rich heat exchanger are the most important variable cost drivers in both the NGCC power plant and cement plant flue gas CO
2 capture systems. At a
of 10 °C, they account for 82% and 84% of the variable costs in the NGCC standard and lean vapour compression processes, respectively. Meanwhile, the energy cost accounts for 82% and 81% of the variable cost in the standard configuration and the lean vapour compression process, respectively, in the cement plant systems.
Since the PHEs have small channels, the pressure drop is higher than for the STHXs. Higher pumping duties by the rich pump and lean pump are incurred by the PHE system [
3]. The allowable pressure drops in the tubes of the STHXs is between 0.5 and 0.7 bar [
62]. According to [
63,
64], the allowable pressure drop is 1 bar. To account for the higher pumping pressure in the PHE system, the outlet pressure of the rich pump and lean pump were made 1 bar higher than when any STHX was selected for the lean/rich heat exchanger function.
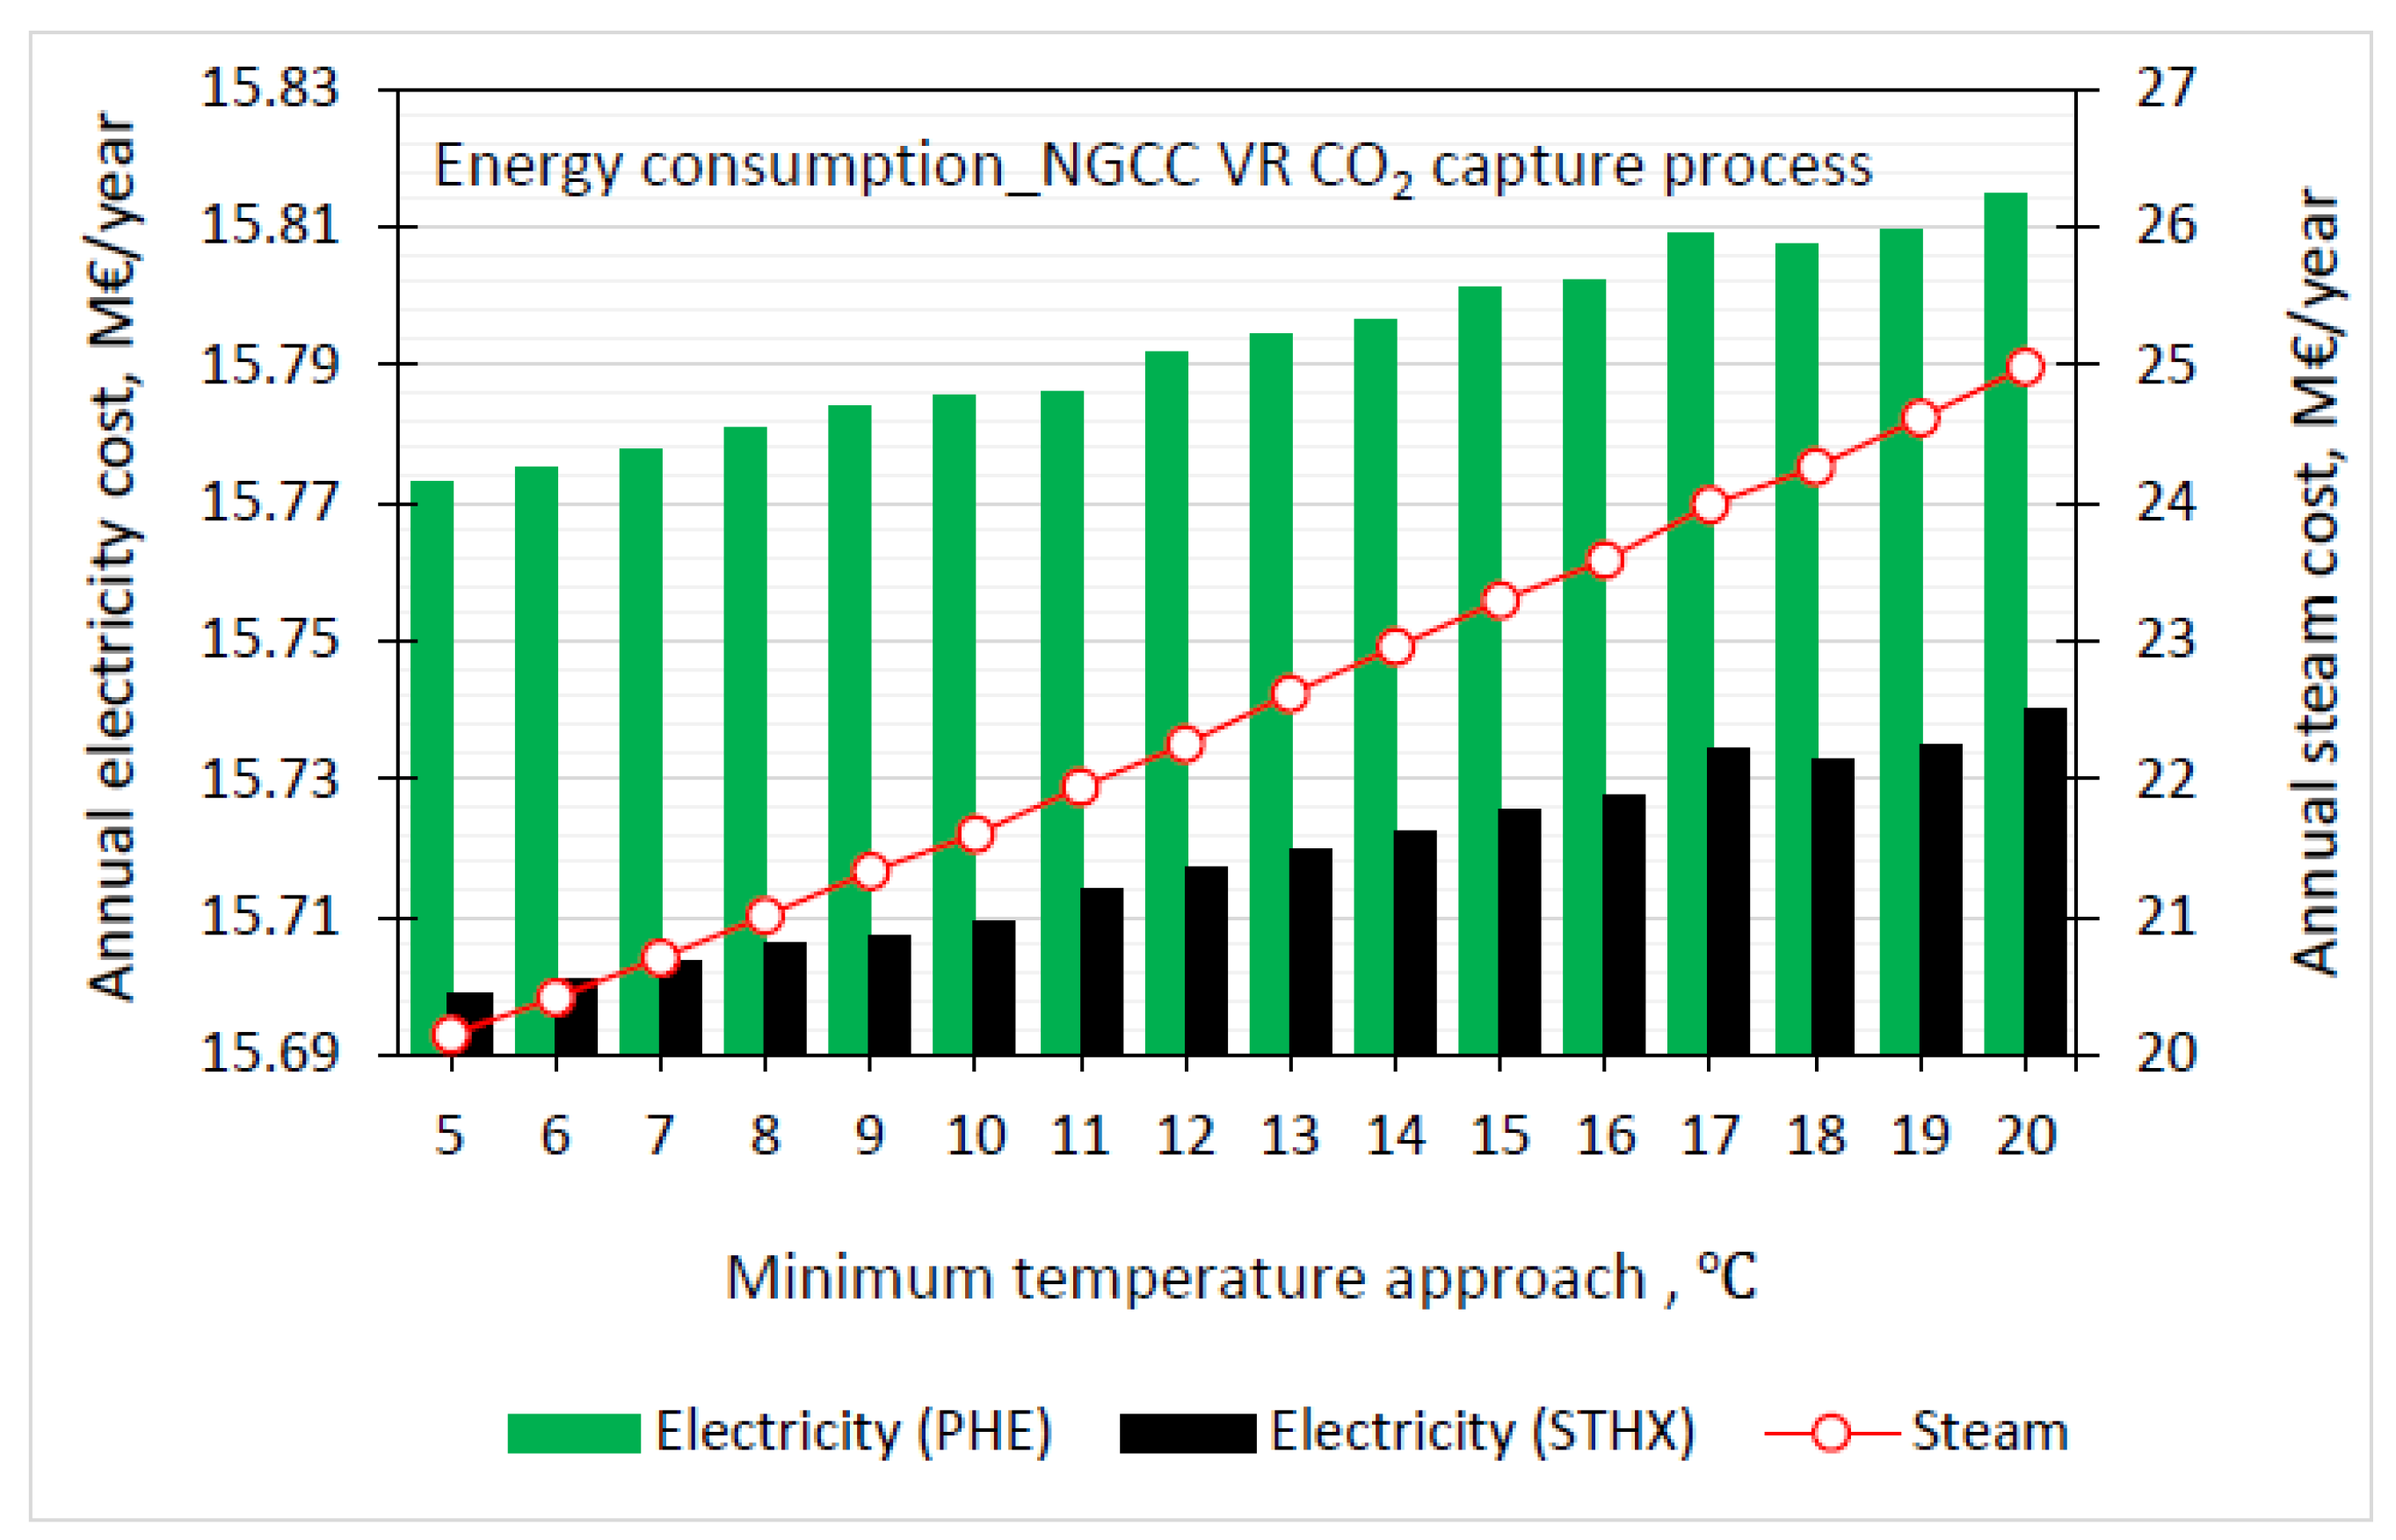
Figure 5 shows the electricity consumption cost in both the STHX and the PHE systems for the NGCC power plant lean vapour compression.
Figure 5 also shows that the two energy (steam and electricity) consumption costs slightly increase with an increase in the
of the lean/rich heat exchanger. The cost of electricity consumption of the PHE system is about EUR 70,000 more than those of the processes with STHXs as the lean/rich heat exchanger.
3.6. Base Case CO2 Capture Cost
Estimates of CO
2 capture cost for all the base cases in this study are presented in
Table 15. These values are in line with the literature results. According to reference [
31], CO
2 capture costs for post-combustion CO
2 capture processes are in the range of EUR 50/tCO
2 to EUR 128/tCO
2. A decade ago, reference [
65] reported a range of EUR 60/tCO
2 to EUR 90/tCO
2 for the power industry. Meanwhile, a range of USD 48/tCO
2 to USD 111/tCO
2 (i.e., EUR 41/tCO
2 to EUR 95/tCO
2) was reported by [
35] specifically for post-combustion CO
2 capture from NGCC power plant’s exhaust gas.
In their study, Roussanaly et al. [
66] estimated a CO
2 capture cost of EUR 63.2/tCO
2 (cost year of 2014) for a solvent-based CO
2 capture from a cement plant’s flue gas. For the cost year of 2016, Ali et al. [
31] estimated the capture cost for a similar cement flue gas CO
2 capture system to be EUR 62.5/tCO
2. These literature capture costs are close to the capture cost in this work for the STHXs systems, though the cost years are different.
These results revealed that using the PHE in a standard post-combustion CO2 capture process will lead to 4.4% reduction in carbon capture cost. A CO2 capture cost reduction of approximately 3% will be achieved if the lean vapour compression is implemented instead. These are significant cost reductions, since over 1 million tons of CO2 and over 630,000 CO2 are captured in the NGCC system and the cement system, respectively.
The costs based on actual CO
2 emissions reduction (CO
2 avoided cost) from the cement plant were also estimated for the FTS-STHX, FH-STHX and PHE capture scenarios. They are EUR 87.5/tCO
2, EUR 87.7/tCO
2 and EUR 73.7/tCO
2, respectively, for the cement flue gas’ standard of CO
2 capture process. For the lean vapour recompression cement flue gas process, the costs are EUR 77.4/tCO
2, EUR 77.6/tCO
2 and EUR 75.2/tCO
2 for the FTS-STHX, FH-STHX and PHE capture systems, respectively. The CO
2 avoided cost values reported in the literature for the MEA capture systems ranges widely from EUR 75/tCO
2 to EUR 170/tCO
2. A CO
2 avoided cost of EUR 95.2/tCO
2 was estimated by [
67], while reference [
68] estimated EUR 81.9/tCO
2. Li et al. [
29] reported an avoided cost of EUR 86.4/tCO
2. A CO
2 avoided cost of EUR 83/tCO
2 was estimated by [
66]. For a closely related system, EUR 80/tCO
2 was recently estimated by [
52].
The analysis of CO
2 actual emissions reduction is given in
Figure 6. Steam and electricity are assumed to be generated from natural gas with CO
2 emissions of 0.18 kg of CO
2 emitted per kWh (thermal). The lean vapour compression (LVC) has better CO
2 emissions reduction performance due to the reduction in reboiler heat consumption from 3.89 GJ/tCO
2 to equivalent heat (reboiler heat and compressor work) of 3.28 GJ/tCO
2 (see
Table 11 and
Table 13).
3.7. Cost Optimum Temperature Approach—CO2 Capture Cost Analysis
The results of the trade-off analysis between energy cost and capital cost at different
based on CO
2 capture cost are presented in
Figure 7,
Figure 8,
Figure 9 and
Figure 10. This is to investigate cost reduction potential and assess if significant cost reduction can be achieved through energy cost and heat exchanger cost trade-off analysis. To make the result comprehensive, the analysis was performed for two different flue gasses of two different industrial processes with different flue gas flow rates and different CO
2 compositions, as stated earlier. Two different CO
2 capture configurations, the conventional or standard process and the lean vapour recompression configurations were also used for this study. In the four figures, the left vertical axis represents the values of the STHXs, while the right vertical axis is for the PHE.
In the CO2 absorption from the NGCC power plant flue gas cases, the cost optimum a of 12 °C was estimated for both the FTS-STHX and UT-STHX processes in the standard process. The cost optimum for the FH-STHX and PHE are 14 °C and 6 °C, respectively. In the lean vapour compression configuration, all the STHXs have the same cost optimum of 9 °C, while the PHE optimum is 5 °C.
These results revealed the significance of both the lean/rich heat exchanger function and the specific type of heat exchanger selected for the lean/rich heat exchanger on the cost of the capture process. The more expensive a specific heat exchanger type is, the higher the that will achieve the cost optimum capture cost. Additionally, the less expensive the heat exchanger is, the lower the that will give the cost optimum CO2 capture cost. While the cost savings at the optimum is marginal in terms of CO2 capture cost in this work, the absolute value is significant, especially in the NGCC power plant capture system where over one million tons of CO2 is captured annually. In the standard process for the NGCC power plant capture system, an annual total cost saving of EUR 165,000/year to EUR 311,000/year was estimated depending on the specific heat exchanger type. Meanwhile, in the lean vapour compression process, the FTS-STHX and FH-STHX could only achieve EUR 97,000 and EUR 74,000, respectively, in CO2 capture cost at the optimum . This is because all the STHXs cases’ optimum was only one degree (1 °C) from the base case . The UT-STHX case which also had its optimum at 9 °C achieved a cost saving of EUR 171,510. However, the lean vapour compression process with PHE achieved a cost reduction of EUR 819,530 at the cost optimum .
In the cement plant standard capture processes, the cost optimum trade-off of both the FTS-STHX and the UT-STHX was 13 °C, while it was 7 °C for the PHE. In the lean vapour compression capture process, 10 °C, which is the base case , remained the cost optimum for the two STHXs. The cost optimum for the PHE system of lean vapour compression was 5 °C. The cost reduction in the two STHX processes based on standard capture configuration was marginal. However, the capture cost optimum achieved EUR 253,570 and EUR 483,700 in the standard and lean vapour compression CO2 capture processes, respectively.
A general observation is that as the decreases from 10 °C to 5 °C, the resulting increase in the heat exchanger area makes the capital cost dominate, causing the capture cost to rise steeply in the cases of all the STHXs in both capture configurations. In the standard process, above a of 14 °C, the capture cost begins to increase steeply, indicating the dominance of steam cost, especially in the cement plant capture system. In the lean vapour compression systems, the impact of moving from one to the next is more significant. The energy cost and heat exchanger cost trade-off trends of the standard CO2 capture system for both the NGCC power plant and cement plant capture systems are similar, likewise in the lean vapour compression configuration capture process for industrial capture processes.
3.8. Analysis of Cost Reduction Based on CO2 Capture Cost
A more appropriate way to present performance may not be in absolute values but in percentages. Therefore, the cost reduction potential of the systems was assessed on percentage basis. However, in comparisons here and in subsequent sections where cost saving potentials are reported, all comparison is made with the reference case. The reference case is the case of using FTS-STHX as the lean/rich heat exchanger with a “
of 10 °C”, and for the lean MEA cooler and DCC cooler. This means all other
trade-off analyses of the FTS-STHX are compared with FTS-STHX of
of 10 °C to show if there is cost reduction potential at other
with the same heat exchanger type. All
trade-off analyses of the other specific types of heat exchanger cases were also all compared with the reference case, FTS-STHX of
of 10 °C. The results are presented in
Figure 11 and
Figure 12 using curves to concisely give overviews of the performance of utilising each specific type of heat exchanger at different
as well as the impact of choosing the lean vapour compression CO
2 capture process.
In the NGCC power plant standard CO2 capture system, despite the significant energy demand reduction in the LVC process, the standard PHE system dominated over the lean vapour compression processes of the FTS-STHX and FH-STHX at of 5 °C and 6 °C. It also competes with the lean vapour compression process of the UT-STHX at 5 °C. The cost optimum (5 °C) of the PHE standard process achieved 4.7% cost reduction, while it was 9.6% for the lean vapour compression PHE process. This implies the lean vapour compression doubles the performance of the cost optimum PHE over the reference case. All the STHXs cases achieved significant cost reduction at all in the lean vapour compression CO2 capture process.
In the cement plant flue gas treatment, the PHE system reached cost savings of 5% and 11.6% in the standard and lean vapour compression CO2 capture configurations, respectively. In both industrial flue gases treatments, the most robust FH-STHX process was not economically viable at all in the standard capture processes. The FTS-STHX process could only realise very marginal cost savings between of 11 °C (0.04%) and 14 °C (0.2%), with a maximum of 0.3% at the optimum of 12 °C, in the NGCC power plant standard capture process. The standard UT-STHX process only achieved a maximum of 1%. The results revealed that while the lean vapour compression process achieves very good cost reduction for all specific types of heat exchanger studied, using the PHE as the lean/rich heat exchanger, lean MEA cooler and as cooler for the DCC circulation water dominates as the best choice for CO2 capture cost reduction, irrespective of its higher pumping cost requirement. With PHE, we can take advantage of the considerable energy reduction at lower . Since steam is usually the major cost driver, operating at lower between 4 °C and 7 °C and using PHE will provide the possibility of significant cost reductions.
3.9. Cost Optimum Temperature Approach—CO2 Avoided Cost Analysis
The previous section only considered economic viability without taking into account climate change implications. The actual CO
2 emission reductions are not considered in CO
2 capture cost estimation. This section deals with the cost of actual CO
2 emissions reduction. It is pertinent to re-emphasise that the CO
2 avoided cost in this study does not include CO
2 transport and storage cost as in [
29,
52,
54,
55].
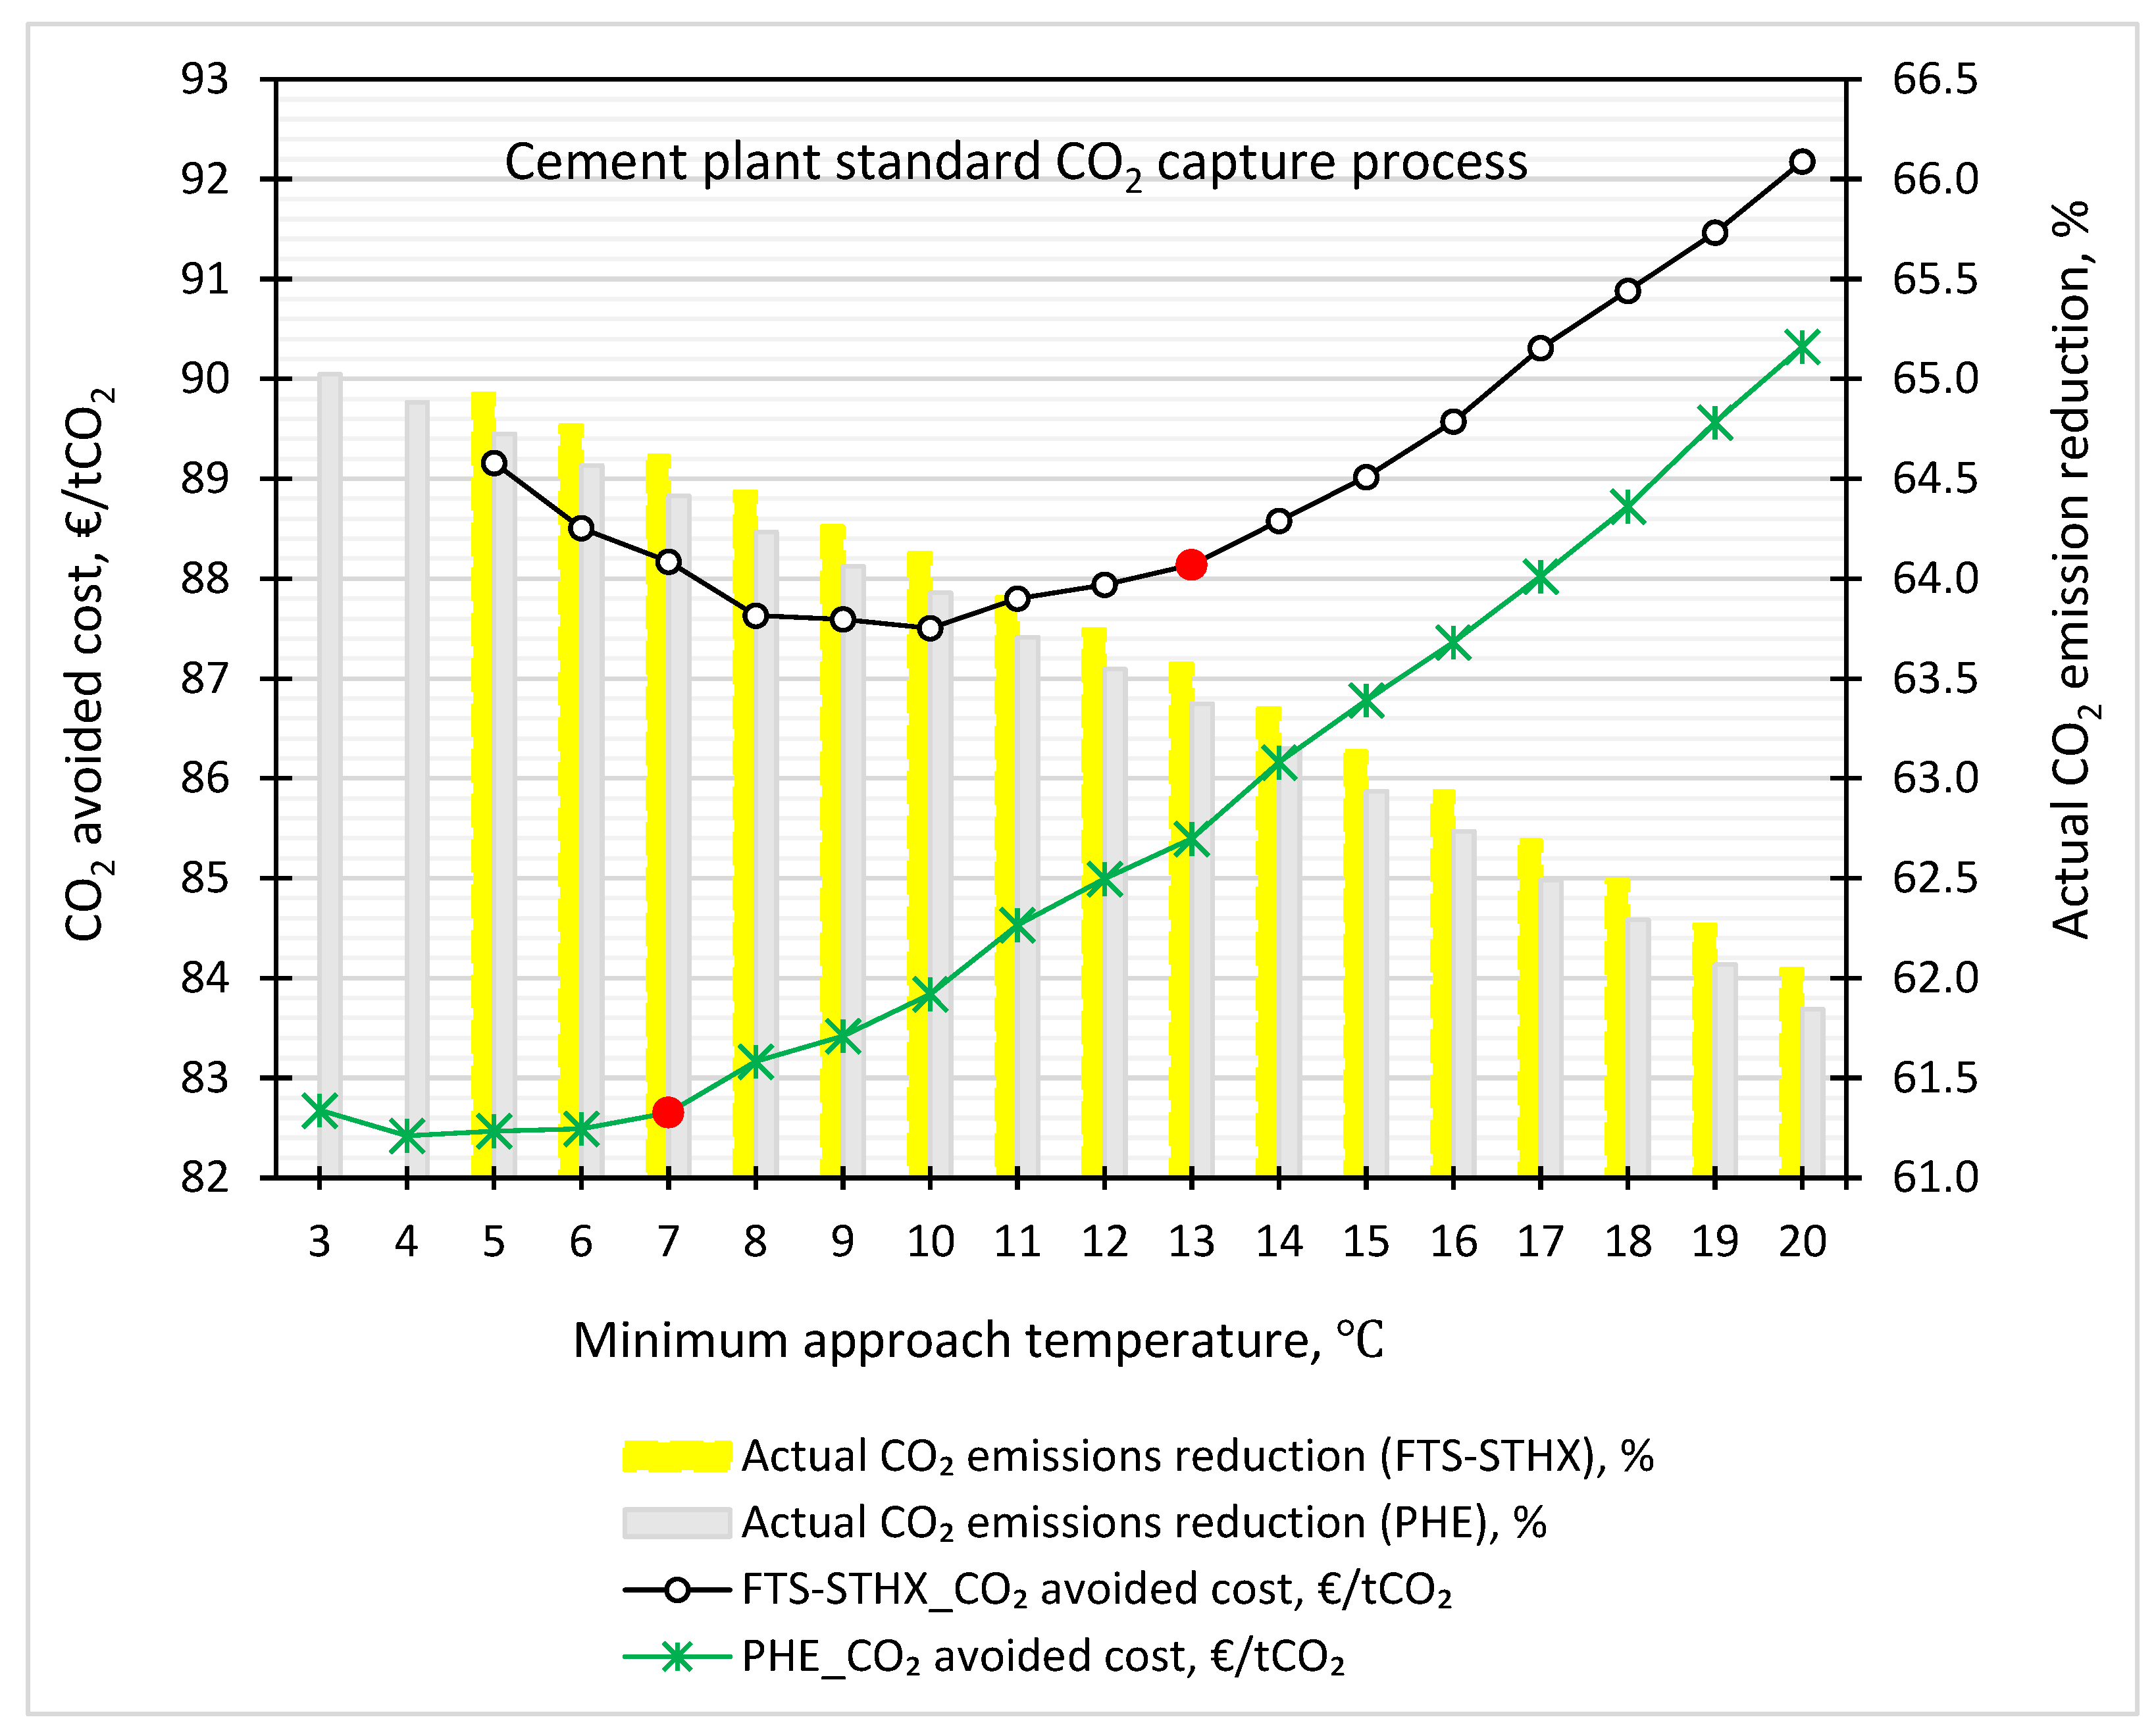
The results of the cost of actual CO
2 emission reductions are presented in
Figure 13 and
Figure 14 for the standard and lean vapour compression CO
2 capture processes from the cement plant’s flue gas, respectively. The red dot represents where the optimum CO
2 capture cost was achieved. It is used to make a comparison with optimum CO
2 capture cost and the optimum CO
2 avoidance cost, that is when the actual CO
2 emissions reduction is considered.
In the standard CO2 capture process, the optimum CO2 avoided cost was evaluated to be at of 10 °C and 4 °C in the FTS-STHX and PHE scenarios, respectively. Meanwhile, in CO2 capture cost estimation, the cost optimum is 13 °C and 7 °C in the cases of the FTS-STHX and PHE, respectively. In the LVC CO2 capture process, a of 4 °C was also estimated as the cost optimum CO2 avoided cost, while it was 7 °C in the case of the FTS-STHX. The CO2 capture cost optimum in the LVC process were 10 °C and 5 °C in the cases of the FTS-STHX and PHE, respectively.
The
in the lean/rich heat exchanger has a significant impact on the steam consumption in the reboiler, as shown in
Table 10,
Table 11,
Table 12 and
Table 13 as well as in
Figure 6. Thus, the higher the
, the higher the steam requirement, which also implies the higher the indirect CO
2 emissions due to production of steam by combustion of natural gas. The actual CO
2 emissions reduction achieved by using an STHX as the lean/rich heat exchanger is a bit higher than if the PHE is applied. This is because of the higher electrical energy consumption in the case of the PHE compared to the STHX. It is due to the higher pumping duties by the rich pump and lean pump to pump the lean and rich amine streams through the small channels of the PHE. However, considering the cost optimum
of 4 °C in the case of using the PHE in both CO
2 capture processes compared to the case of the FTS-STHX, the PHE absolutely dominates in performance economically and in CO
2 emissions reduction efficiency. If the PHE is selected, its cost optimum
or even if 5 °C is specified for the lean/rich heat exchanger, it will achieve about 1.2% and 1.0% more CO
2 emissions reduction more than its counterpart in the standard CO
2 capture process and in the LVC CO
2 capture configuration, respectively.
The optimum CO2 avoided costs of the PHE cases are EUR 82/tCO2 and EUR 73/tCO2 in the cases of the standard and LVC CO2 capture processes, respectively. The actual CO2 emissions estimated are approximately 65% and 68%, respectively. For the FTS-STHX cases, the estimated optimum CO2 avoided costs are EUR 88/tCO2 and EUR 77/tCO2 in the standard and LVC capture processes, respectively. The actual CO2 emissions reduced were estimated to be around 64% and 67%, respectively.
The results reveal the significance of performing cost optimisation of the lean/rich heat exchanger based on
trade-off analysis between energy cost and capital cost (especially heat exchanger cost). This work is therefore more complete than our previous work [
3] where the conventional
of 10 °C was specified for all the specific heat exchanger types. It also emphasises the importance of this study.
Another important observation is that even though the electricity consumption of the lean vapour compression CO2 capture process is higher than that of the standard process, the significant reduction in steam consumption meant it achieved better actual CO2 emissions reduction and less CO2 avoided costs. Therefore, the lean vapour compression configuration gives a more economic and a more environmentally friendly outcome.
3.10. Analysis of Cost Savings Based on CO2 Avoided Cost Analysis
In this section, the CO
2 avoided cost at different
of the lean/rich heat exchanger using the PHE and FTS-STHX are compared with that of the reference case (FTS-STHX with
of 10 °C). The results are presented in
Figure 15. Since the cost optimum
of the FTS-STHX case in the standard capture process is 10 °C, no cost reduction is achieved at other
. However, the cost reduction achieved by the two PHE cases and the lean vapour compression capture process with FTS-STHX is higher here (CO
2 avoided cost) compared to the CO
2 capture cost estimates. The optimum CO
2 avoided cost in the PHE cases achieved about 6% and 16.2% cost reduction in the standard and lean vapour compression CO
2 capture processes, respectively. The lean vapour compression case with FTS-STHX CO
2 avoided cost optimum achieved 12% cost reduction, compared to a 7.7% reduction in ordinary capture cost. This is due to the reduction in the amount of steam consumption when emissions reduction is considered. These cost reductions also indicate that the
of the lean/rich heat exchanger is an important process parameter to optimise [
11].
3.11. Cost Optimum Minimum Temperature Approach—Excess (or Waste) Heat Implication
The available waste or excess heat at the Norcem AS cement plant in Brevik can cover for the production of steam for 50% CO
2 capture. How this advantage affects the cost optimum
, emissions reduction and cost reduction potential was studied. The results are presented in
Figure 16,
Figure 17 and
Figure 18. The PHE avoided cost optimum
in both the standard and lean vapour compression CO
2 capture processes are 7 °C and 5 °C, respectively. The CO
2 avoided costs at these optimum
are EUR 60/tCO
2 and EUR 58/tCO
2, respectively. Meanwhile, for the FTS-STHX cases, this is 13 °C and 10 °C in the standard and lean vapour compressions CO
2 capture processes. The optimum CO
2 capture cost of the PHE case in the standard capture process coincides with the avoided cost. This also occurred for the FTS-STHX case in the lean vapour compression capture process. The cost reduction performances of the two heat exchanger types in both the standard and lean vapour compression CO
2 capture systems are presented in
Figure 18. Even though the lean vapour compression is very effective in the reduction in energy consumption, the cost reduction in steam supply from waste heat to cover 50% CO
2 capture in a 90% capture process shows the standard capture process with PHE as the lean/rich heat exchanger performing better than the lean vapour compression capture process with FTS-STHX at
less than 10 °C. The lean vapour compression process with FTS-STHX only outperformed the standard process with PHE with an average of 0.5% between 14 °C and 18 °C. These results, like the previous ones, also highlight that the PHE is a better choice economically and in emission reduction compared to the STHXs. This is because at their individual best costs (optimal cost), the PHE case achieved the least cost and a higher CO
2 emissions reduction.
The cost reduction impact of having steam supply that is sufficient for up to 50% CO
2 capture and its impact on the actual CO
2 emissions reduction compared with a reference case (the original base case) of a standard CO
2 capture having FTS-STHX with
of 10 °C are presented in
Table 16.
Table 16 is a summary of all the 90% CO
2 capture from the cement plant’s flue gas based on CO
2 avoided cost. The results indicate that if the lean vapour compression configuration is implemented with PHE as the lean MEA cooler, DCC circulation water cooler and as the lean/rich heat exchanger with a
of 5 °C, and steam can be successfully provided for up to 50% capture, then 10.4% more CO
2 emissions reduction can be achieved compared to the reference case (base case). It is important to remember here that the base case is a standard CO
2 capture process which has FTS-STHX as the lean MEA cooler, DCC circulation water cooler and as the lean/rich heat exchanger with a
of 10 °C, with steam supply only from natural gas combustion. When the available excess heat which can provide steam for up to 50% CO
2 capture at Brevik was considered, the optimum PHE case of the lean vapour compression CO
2 capture system achieved a 34% reduction in CO
2 avoidance cost. It is important to note that this is in comparison with the base case without considering steam supply from excess heat. However, without excess heat, the lean vapour compression process with the optimised minimum temperature approach still achieved a 16.4% saving in CO
2 avoided cost compared to the reference case.
In this study, steam supply has the greatest impact on cost reduction followed by the implementation of lean vapour compression process configuration. However, if the steam from the excess heat for 50% CO2 capture is available, then the cost reduction impact of selecting the PHE even in the standard capture process is greater than that of using FTS-STHX in the lean vapour compression process for a less than 10 °C. If we must take advantage of less steam consumption and less indirect CO2 emissions which a lower of 4–7 °C offers, then PHE is the best choice.
3.12. Sensitivity Analysis
This study is about the trade-off between energy and capital costs. Therefore, a sensitivity analysis of these two cost parameters on the overall capture cost and the CO
2 avoided cost was conducted. Since the unit prices of energy can fluctuate widely, a probable range of ±50% was assumed for the steam cost [
3,
31]. The capital cost estimates in this work study fall under the “study estimate” (factored estimate). Thus, the probable accuracy is ±30%. However, a probable range of +30%/−15% was assumed, as was assumed in [
52]. The NGCC power plant standard CO
2 capture process and the cement plant LVC CO
2 capture system were selected for the sensitivity analysis. The analysis is based on CO
2 capture cost and CO
2 avoided cost in the cases of the NGCC power plant and cement plant CO
2 capture processes, respectively.
The results of the sensitivity analysis were estimated by comparing the performance of different processes, with each having a specific heat exchanger type at different with the corresponding result of the FTS-STHX case with a of 10 °C. This means, for example, in the case of a 50% increase in steam cost, the resulting estimates of both the PHE and FTS-STHX at the different from the 50% increased steam cost are compared with a reference case, which is FTS-STHX, having a of 10 °C with a 50% increase in steam cost. Therefore, the performance of the corresponding reference case, that is, a of 10 °C will be zero (0) in all cases, makes for better comparison between the PHE case and FTS-STHX case when costs increase or decrease. This gives a better answer to the question, of “how better would the performance be if instead of having the reference case when changes occur in the cost of steam or capital cost”, the system has any other or PHE is used. Then, what is the performance of the PHE system at different . compared to the reference?
The results of the sensitivity analysis for ±50% changes in steam cost are presented in
Figure 19 and
Figure 20 for the NGCC power plant and the cement plant’s CO
2 capture processes, respectively. In the NGCC power plant CO
2 capture process, if there is an increase of 50% in steam cost, the performance of the FTS-STHX will be from 0 to −2.6%. That implies that more cost will be incurred if the design is for FTS-STHX with a
other than 10 °C. The PHE system performed better than the FTS-STHX with its cost optimum at a
of 6 °C (4.3%). However, the cost reduction achieved is lower than the in the original case. It continues to decline as the
increases until reaching 19 °C, where no savings can be made, but more cost would be incurred. Meanwhile, a 50% decline in steam cost resulted in cost savings for the FTS-STHX with the optimum at 17 °C, which achieved merely 1.6% cost reduction. The PHE system achieved a higher cost reduction compared to the original PHE case with the optimum at 8 °C (5.3%).
In the CO2 avoided cost estimates for the cement plant’s CO2 capture plant, a 50% rise in the steam cost resulted in a higher cost reduction in the FTS-STHX between 5 and 9 °C compared to the original case. More costs will be incurred at all greater than 10 °C, and at all (except 10 °C—reference case) if the steam cost reduces by 50%. In the PHE case, a 50% increase in steam cost will only make the PHE perform better between 3 and 6 °C, after which its performance becomes lesser than the original PHE case. The cost reduction ends at 12 °C, but at 16 °C if there is a 50% decline in the cost of steam. The performance of the PHE case with a 50% reduction in the cost of steam becomes better than the original PHE case and the case of +50% at 8 °C. The performance also increases with an increase in the of the lean/rich heat exchanger.
The results of the sensitivity analysis of the capital cost are presented in
Figure 21 and
Figure 22 for both the NGCC power plant and the cement plant’s CO
2 capture processes, respectively. The results are opposite to those of changes in the cost of steam in the NGCC power plant CO
2 capture cost. The optimum
moved from 6 to 8 °C (5.4%) and from 6 to 5 °C (4.4%) in the cases of a +30% increase and −15% decrease, respectively, in the PHE cases. In the FTS-STHX cases, the optimum
moved from 12 to 14 °C (0.6%) and it remained 12 °C (0.2%) if the capital cost rose by +30% and declined by −15%, respectively. In the cement plant’s case, a ±30% change in the capital cost achieved their optimum at the same 4 °C as the original case for the PHE. The performance of the 30% increase scenario is slightly higher than the original PHE case at 4 °C (5.5%). This performance continued to slightly increase as the
of the lean/rich heat exchanger increased. The case of a −15% decrease in capital cost displayed a similar trend but in the opposite fashion. The performance is slightly lower than the original PHE case. The results for the FTS-STHX follow almost the same trend in the opposite way to the case of changes in steam cost. In the case of −15%, 7 °C is the optimum with 0.8% cost reduction.
3.13. Comparison of Optimum Results with Literature
A lot of literature may not be available on an extensive trade-off analysis between energy cost and capital cost at different
in a post-combustion CO
2 capture process. However, a review of some of the literature is given here. The work of Tobiesen et al. [
25] indicated that reducing the
does not have a significant effect on the steam consumption in the reboiler. This is not the case in our work and some other works reviewed here. They stated that 15 °C may be a reasonable
for a CO
2 capture plant based on new technology. Their final proposition is that the ratio between the cost of energy consumption and capital cost is anticipated to increase; hence, a
of 10 °C or less is conceivably reasonable.
In a CCP project, Choi et al. [
22] specified 11 °C for their lean/rich heat exchanger
and claimed that this is close to the cost optimum value. They also suggested that to reduce cost, the PHE should replace the STHX, and that it could probably result in a lower cost optimum
. The results from this study affirm the latter. Besides reduction in the capital cost, which is achieved by the PHE, the cost optimum
based on both CO
2 capture cost and CO
2 avoided cost is also reduced to between 4 and 7 °C, instead of the higher
obtained as cost optimum in the cases of the STHXs.
Li et al. [
59] investigated an 85% CO
2 capture from the exhaust gas from a 650 MW coal-fired power plant. They estimated an optimum CO
2 avoided cost for a standard MEA capture process to be 5–7 °C. The exact type of heat exchanger was not mentioned. It is important to state the specific type of heat exchanger to ensure a proper and transparent comparison with other studies [
3]. The benefit from reduction in energy consumption at the lower
was more significant compared to the increase in capital cost due to the high increase in the heat exchanger area. They concluded that due to the difficulty of manufacturing the heat exchanger to meet the requirement of such large area, the
range of 5–10 °C will achieve the optimum process in avoided cost. In this study, the optimum CO
2 avoided costs estimated for the cement flue gas CO
2 capture plant was within 4–7 °C for the PHE capture scenarios and 7–10 °C in the FTS-STHX capture scenarios.
For a 90% MEA-based standard CO
2 capture process, Schach et al. [
55] conducted a trade-off analysis based on an LMTD and on a standardise CO
2 avoided cost. Their cost optimum was an LMTD of 7.5 °C. They proposed an advanced MEA-based CO
2 capture configuration which include inter-cooling of the absorber, a conventional rich-split process and desorber inter-heating. For this process, they estimated an optimum LMTD of 8 °C. The type of heat exchanger was also not stated.
Karimi et al. [
11] investigated seven different configurations for 90% CO
2 capture from the flue gas of a 150 MW bituminous coal power plant. They were evaluated for a
of 5 °C and 10 °C using CO
2 capture cost and CO
2 avoided cost metrics. In all the configurations, a
of 10 °C achieved the lesser CO
2 capture cost and CO
2 avoided cost, except in the multi-pressure configuration where 5 °C achieved a marginal reduction of USD 0.01/tCO
2 in CO
2 avoided cost with a
of 5 °C.
Some other studies of an MEA-based post-combustion CO
2 capture system can be found in [
20,
35,
36,
43,
69]. These studies were all carried out using the U-tube and the fixed tube sheet shell and tube heat exchangers in an 85% MEA-based CO
2 capture from the NGCC power plant exhaust gas. Kallevik [
36] estimated the cost optimum for the UT-STHX to be 10–14 °C in a standard CO
2 capture process. In a lean vapour compression CO
2 capture process, Øi et al. [
69] estimated the cost optimum to be 12 °C. Meanwhile, Aromada and Øi [
43] estimated a
of 13 °C as the cost optimum in an LVC process. These studies made several simplification assumptions that excluded some important parameters, and the process scope did not include CO
2 compression. In a study conducted for 5 °C, 10 °C, 15 °C and 20 °C where FTS-STHX was used as the lean/rich heat exchanger in CO
2 capture from NGCC power plant flue gas, Aromada et al. [
35] estimated the cost optimum
with different capital cost estimation methods to be 15 °C. Preliminary results of this work for different heat exchangers used as the lean/rich heat exchanger for CO
2 capture from a cement plant flue gas without the compression section also estimated the cost optimum
for the UT-STHX, FTS-STHX and FH-STHX to be 15 °C [
20]. The cost optimum
. if PHE is selected was evaluated to be 5 °C. The investigation was also carried out for for 5 °C, 10 °C, 15 °C and 20 °C only. Ali et al. [
31] estimated 10 °C as a cost optimum using the UT-STHX as the lean/rich heat exchanger in a standard CO
2 capture process from cement plant flue gas.
In the NGCC power plant CO2 capture process in this work, the optimum CO2 capture costs were achieved at a of 12 °C in the cases of FTS-STHX and UT-STHX. For the FH-STHX and PHE, this was 14 °C and 6 °C, respectively. Meanwhile, 9 °C and 5 °C were the optimum CO2 capture costs for all the STHXs and the PHE, respectively, in the lean vapour compression process configuration.
In the cement plant capture system, FTS-STHX and UT-STHX cases achieved their capture cost optimum at a of 13 °C and 10 °C in the standard and lean vapour compression processes, respectively. Meanwhile, this was 7 °C and 5 °C, respectively, in the PHE case.
In avoided cost estimates for the cement plant capture process, a of 4 °C was estimated as cost optimum in both the standard and lean vapour compression capture processes. Meanwhile, the two STHX achieved their optimum CO2 avoided costs at 10 °C and 7 °C in the standard and lean vapour compression CO2 capture processes, respectively.
To select PHE instead of the STHXs will result in capital cost reduction, lower energy cost and higher emissions reduction, since a lower results in lower steam consumption. It is therefore desirable to operate at a lower . Larger capital costs at lower a cancel out the OPEX advantage in the cases of the more expensive heat exchangers (STHXs). Higher-cost optimum implies that the capital cost dominates the system, and a lower-cost optimum indicates that energy cost dominates. While the results agree with some of the studies reviewed, to only consider energy reduction of a process only can cause a conclusion which would not evince the best possible solution to be made. Therefore, it is imperative to perform a trade-off analysis between energy cost and capital cost at different for every innovative solvent-based capture system if the best possible CO2 capture process economically and in respect of emissions reduction is to be achieved.
3.14. Uncertainties
Since the has significant impact on the size of the heat exchanger used as a lean/rich heat exchanger, more energy will be required for pumping both the lean and rich streams through the lean/rich heat exchanger as the reduces. This was not accounted for in this study, and it may have some impact, but the effect may be negligible on the outcomes. The mass of CO2 emitted annually from the Norcem AS cement plant in Brevik is estimated to be about 800,000 tons/year. In this study, the emissions based on the data used for the simulations is of 708,142 tons/year.


