Communication

Optimal Design of a BLDC Motor Considering Three-Dimensional Structures Using the Response Surface Methodology

Department of Electrical Engineering, Chungnam National University, Daejeon 305-764, Korea
*
Author to whom correspondence should be addressed.
Energies 2022, 15(2), 461; https://doi.org/10.3390/en15020461
Submission received: 4 December 2021 / Revised: 6 January 2022 / Accepted: 6 January 2022 / Published: 10 January 2022

Abstract

:
In this paper, the optimal design of a brushless direct current motor with a three-dimensional (3D) structure using the response surface methodology (RSM) is presented. There were two optimization goals: reduction of the cogging torque and maintenance of the back electromotive force to prevent performance degradation. For motors with a 3D structure, a 3D finite element method analysis is essential, though it requires considerable computation time. Therefore, to reduce the optimal design time, the 3D structure was placed on the 2D plane. Thereafter, a 2D corrected model was applied to the RSM. For the validity of the technique, the analysis results of the initial 3D model, 2D model, and 2D corrected model were compared, and the results of the optimal design 3D model, 2D corrected model, and experiment were compared.

1. Introduction

With the development of technology, the mechanical commutation device of a DC motor was changed to an electrical commutation device, and a brushless DC (BLDC) motor was developed. In a DC motor, permanent magnets (PMs) are present in the external stator. However, PMs in BLDC motors are in the rotor. They are divided into outer and inner rotor types [1]. The outer-rotor-type BLDC motor has a large PM; therefore, it can increase the torque, and its inertia is large, which is advantageous for constant-speed operation [2,3]. Because of these characteristics, the outer-rotor-type BLDC motors are typically used in fan and pump applications [4,5,6]. Meanwhile, the noise and vibration of a BLDC motor affect the life of the device and cause inconvenience to users. Electromagnetic vibration sources that affect noise and vibration include cogging torque, torque ripple, back electromotive force (EMF), and total harmonic distortion (THD). Recently, studies on noise and vibration optimization through the reduction of cogging torque have been actively conducted [7,8]. In this study, the optimal design of cogging torque reduction, which is one of the electromagnetic vibration sources, was carried out.
Three-dimensional structures, such as the magnet overhang and housing-integrated rotor, are used to increase the power density. When a housing-integrated rotor is applied, the magnetic flux path is secured, and the radial thickness of the yoke can be reduced. When a magnet overhang is applied, the air gap flux density can be increased [9,10].
In general, the electromagnetic analysis of motors is performed using finite element method (FEM) analysis. However, motors with three-dimensional (3D) structures, such as magnet overhang and housing-integrated rotors, are difficult to analyze accurately with two-dimensional (2D) FEM analysis. Therefore, motors with 3D structures require 3D FEM analysis, which is unsuitable for optimal designs that require a lot of analysis and long computation times. To this end, a method of interpreting a 3D structure’s 2D equivalent has been previously studied [11,12]. In the case of the magnet overhang, the magnetic energy decreases as the volume of the PM decreases when converting from 3D to 2D. Therefore, to maintain the magnetic energy equally, properties, such as coercive force and remanence, are adjusted [13,14]. When an equivalent housing-integrated rotor is used, flux saturation due to flux path reduction should be considered. The volume in the 3D structure is equivalent to increasing the radial direction thickness of the yoke in a 2D structure.
In general, motors have a trade-off relationship. When one characteristic is improved according to the control of a variable, the other characteristics deteriorate. Therefore, several characteristics must be satisfied simultaneously. Multi-objective optimization allows a user to select the optimal point through a family of variables [15,16,17]. For example, electromagnetic characteristics, such as cogging torque, torque ripple, torque average value, back EMF, and efficiency, may be classified and optimized so that they are minimized and maximized, respectively.
The response surface methodology (RSM) is a type of multi-objective optimization that creates a surrogate model by defining the relationship between variables and response values based on response values derived from multiple analysis points. The RSM selects an analysis point within a set variable range, predicts a surrogate model, and derives the desired optimal point by applying the goal and desirability function of each response value [18,19,20,21,22]. Unlike the global optimization technique that directly analyzes all points to derive the optimal point, the result of the point selected through the surrogate model has an error relative to the actual analysis result. As the number of objective functions increases, the accuracy of the response surface decreases; therefore, two to four objective functions are usually applied to the RSM [21,23,24].
In this study, a BLDC motor with a 3D structure was optimally designed based on the RSM. The purpose of the optimal design was to reduce the cogging torque and maintain the back EMF to sustain the electromagnetic characteristics of the motor [25,26]. During optimization, winding specifications and things that are not factors were not changed. Inductance is the ratio of flux linkage per current, and the no-load back EMF is proportional to the time-varying magnetic flux linkage. Therefore, maintaining the no-load back EMF means maintaining the inductance and flux linkage. Additionally, because things that are not factors and no-load back EMF were not changed, efficiency and losses are similar to the initial model. Therefore, they were not included in the objective function. The RSM with a 3D structure requires considerable computation time; the optimal design time can be shortened by proceeding with a 2D equivalent of the 3D structure during the optimal design process. For the validity of the technique in this study, the 3D and 2D FEM analysis results of the initial design were compared. Moreover, the 3D and 2D FEM analyses and experimental results of the optimal design were compared.

2. The 3D Structure and Its 2D Equivalent

2.1. Analysis Model

Figure 1 shows the analysis model used in this study. It was an 8-pole, 12-slot BLDC motor and had two 3D structures with a magnet overhang and a housing-integrated rotor.

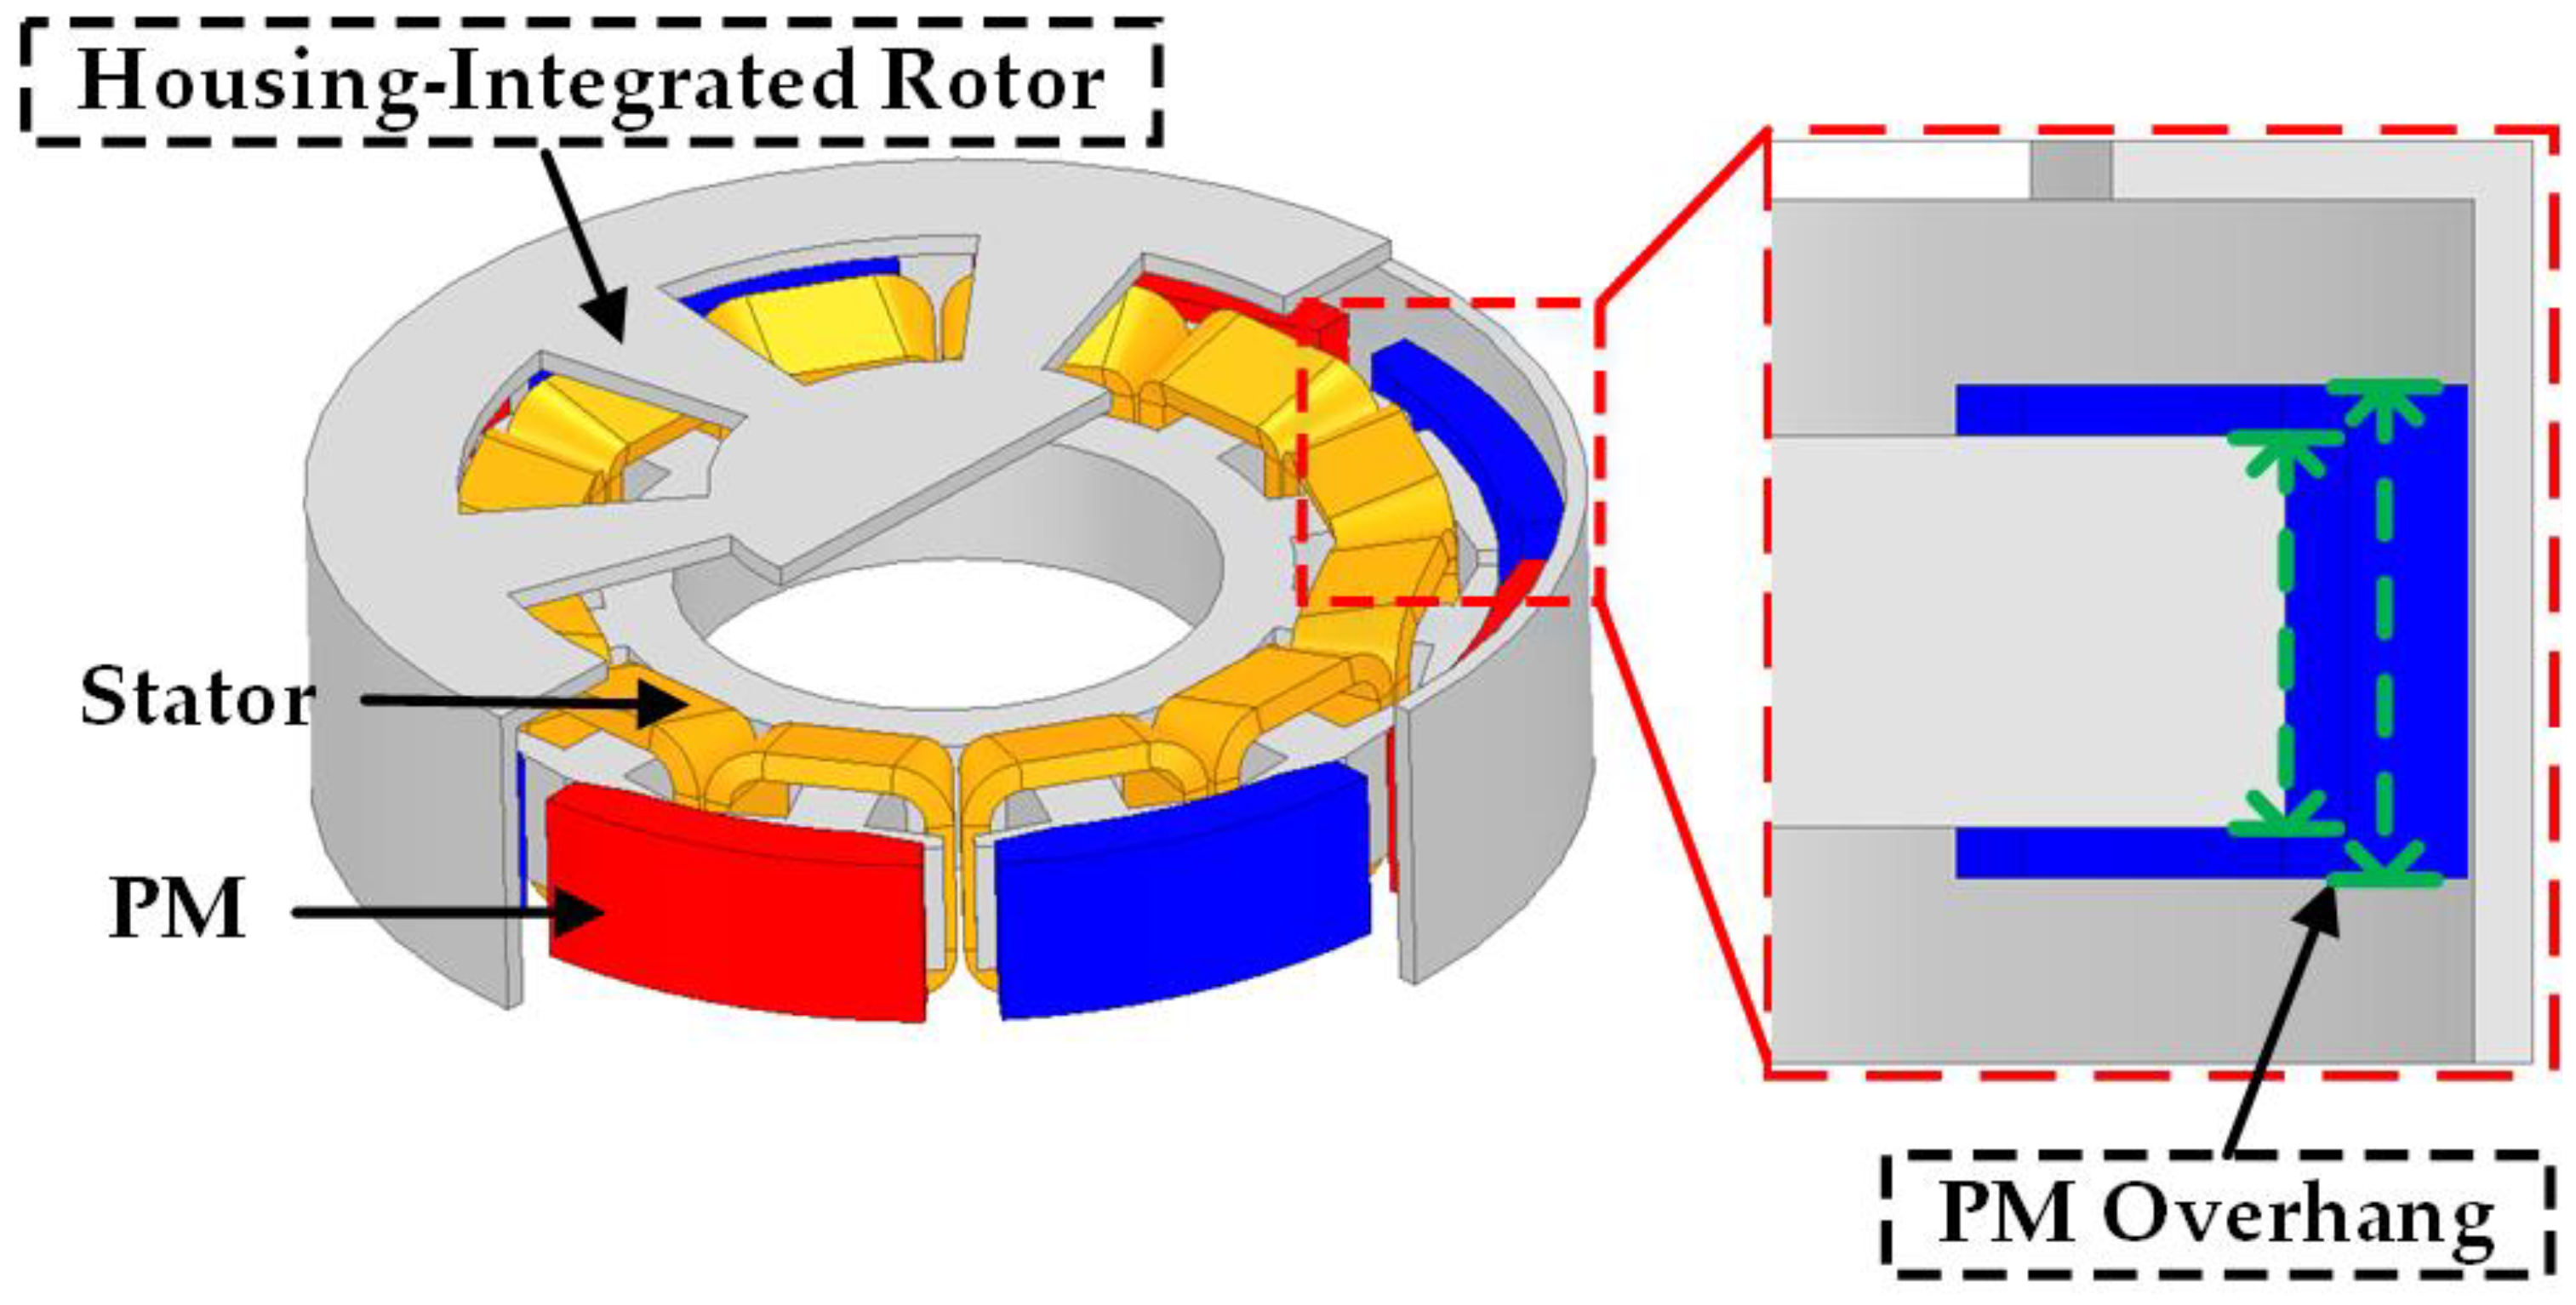
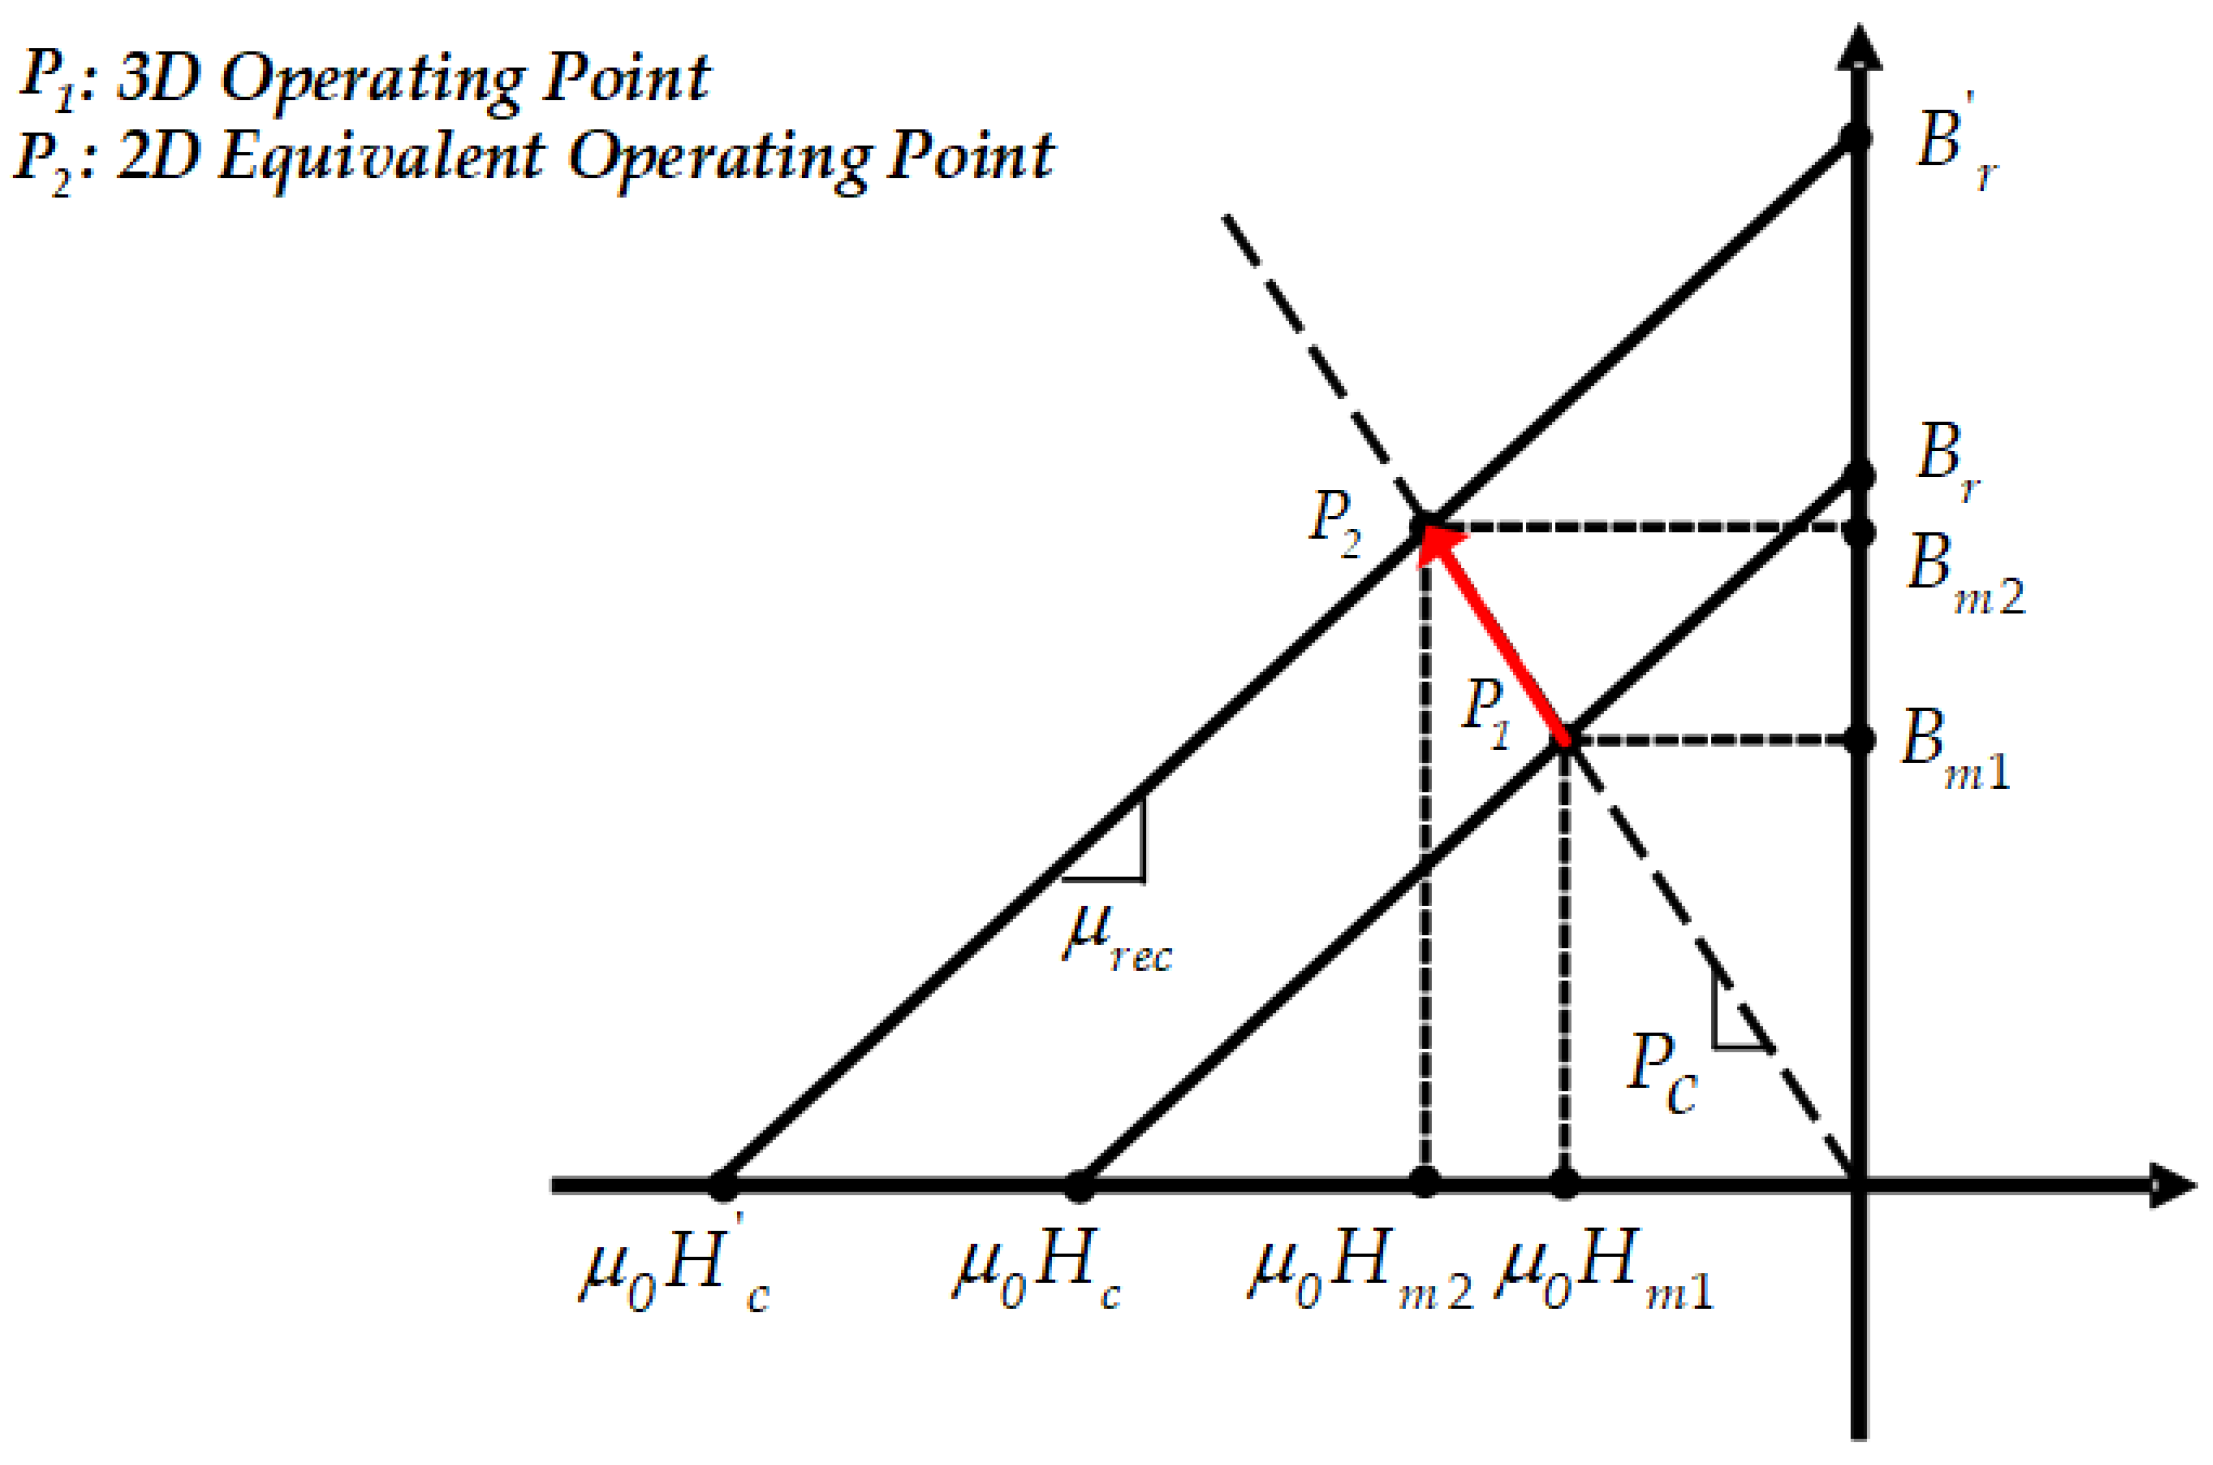
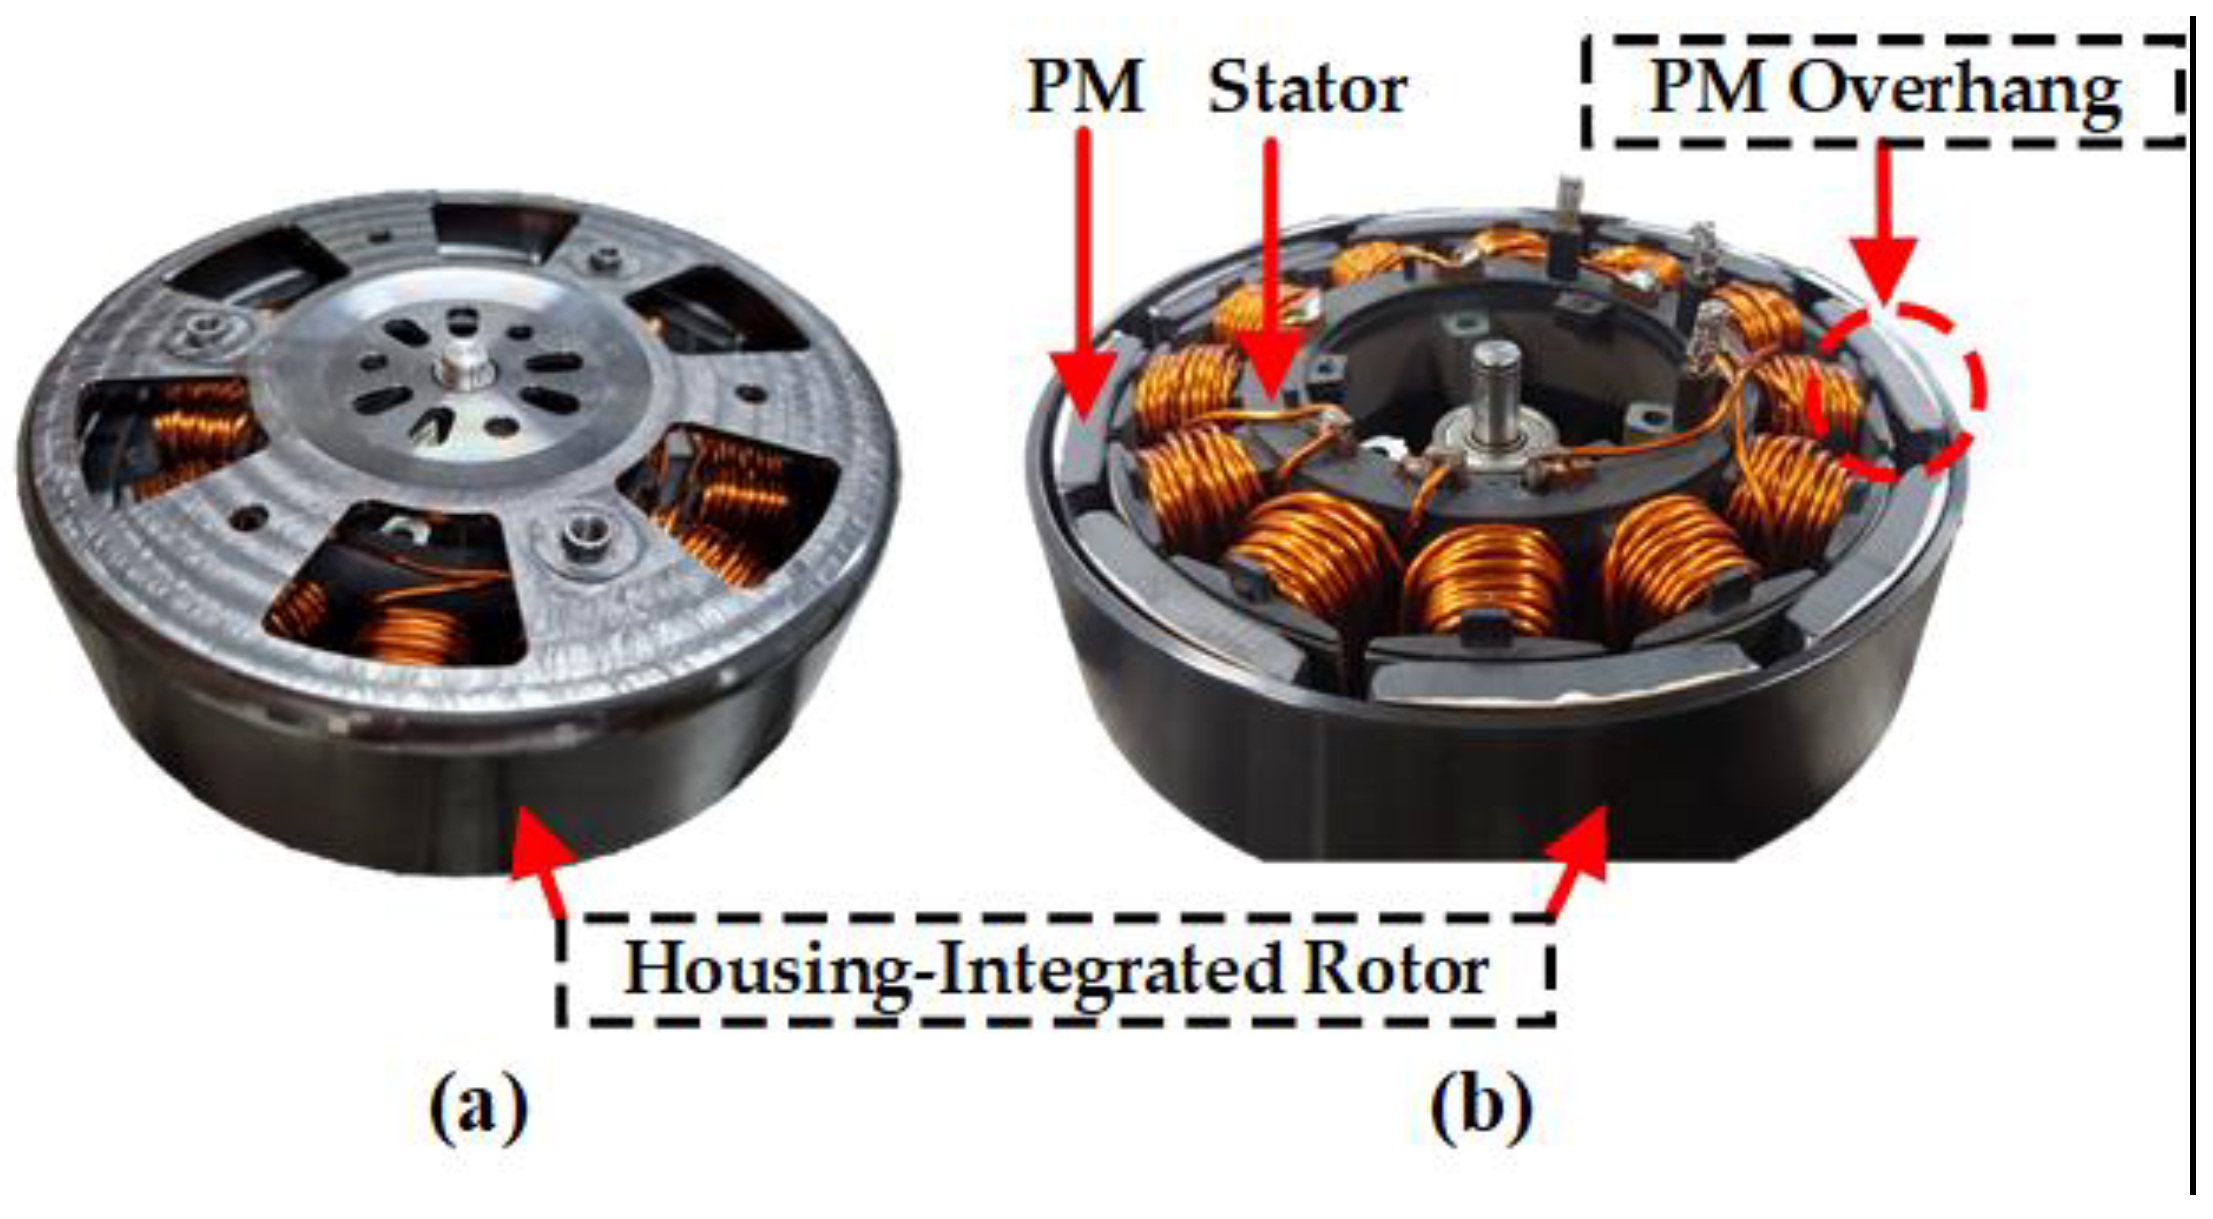
2.2. Magnet Overhang

Because ferrite magnets have weaker magnetism than rare earth magnets, a larger magnet volume is required to increase the output. The magnet overhang is a structure that increases the axial length of the PM, reducing the magnetic flux leakage and increasing the air gap magnetic flux density. The model to which the magnet overhang is applied is not a plane structure. Therefore, it is indispensable to analyze the model as a 3D FEM. However, because 3D FEM analysis requires considerable analysis time, it is efficient to analyze models using a 2D equivalent for optimal design.
Through the following equation, it is possible to derive a condition that allows the magnet overhang to have the same magnetic energy, even though the volume decreases when represented in 2D.
W H = 1 2 B m 1 H m 1 V 1 = 1 2 B m 2 H m 2 V 2
Equation (1) is about the magnetic energy of a PM W H as a function of magnetic flux density, magnetic field strength, and volume. In Equation (1), B m 1 , H m 1 , and V 1 are the magnetic flux density, magnetic field strength, and volume at the operating point of the PM in the existing model, respectively. B m 2 , H m 2 , and V 2 are the magnetic flux density, magnetic field strength, and volume at the operating point of the PM in the 2D corrected model, respectively. B m 1 , H m 1 , and V 1 are specified values in the 3D model, and when converted to 2D, V 1 decreases to become V 2 ; therefore, B m 2 and H m 2 should increase. To equalize the degree of energy flow when adjusting the operating point, the operating point P 1 ( B m 1 , H m 1 ) of the 3D model’s PM should be the operating point P 2 ( B m 2 , H m 2 ) of the P c , which is the permeance coefficient, in the load line, as shown in Figure 2 [13,14,27].
P c = B m μ 0 | H m | = μ r e c B m B r B m = 1 f l e a k a g e × L m L g × A g A m
B m 1 = B r + μ 0 μ r e c H m 1
Equation (2) is about the permeance coefficient as a function of B m and H m . In Equation (2), f l e a k a g e is a leakage coefficient with a value usually between 0.85 and 0.95; in this study, it was set to 0.9. μ r e c is the relative permeability, B r is the remanence, L m is the magnet axial length, L g is the air gap length, A g is the area of the air gap, and A m is the area of the magnet. Equation (3) represents the demagnetization curve in Figure 2.
Equation (4) represents the operating point P 1 , which can be derived from Equations (2) and (3).
B m 1 = P c P c + μ r e c B r ,   H m 1 = B m 1 B r μ o μ r e c
The operating point P 2 ( B m 2 , H m 2 ) can be derived through Equations (1) and (2) and the driving point P 1 ( B m 1 , H m 1 ) .
B m 2 = B m 1 H m 1 V 1 V 2 μ o P c ,   H m 2 = B m 2 μ 0 P c

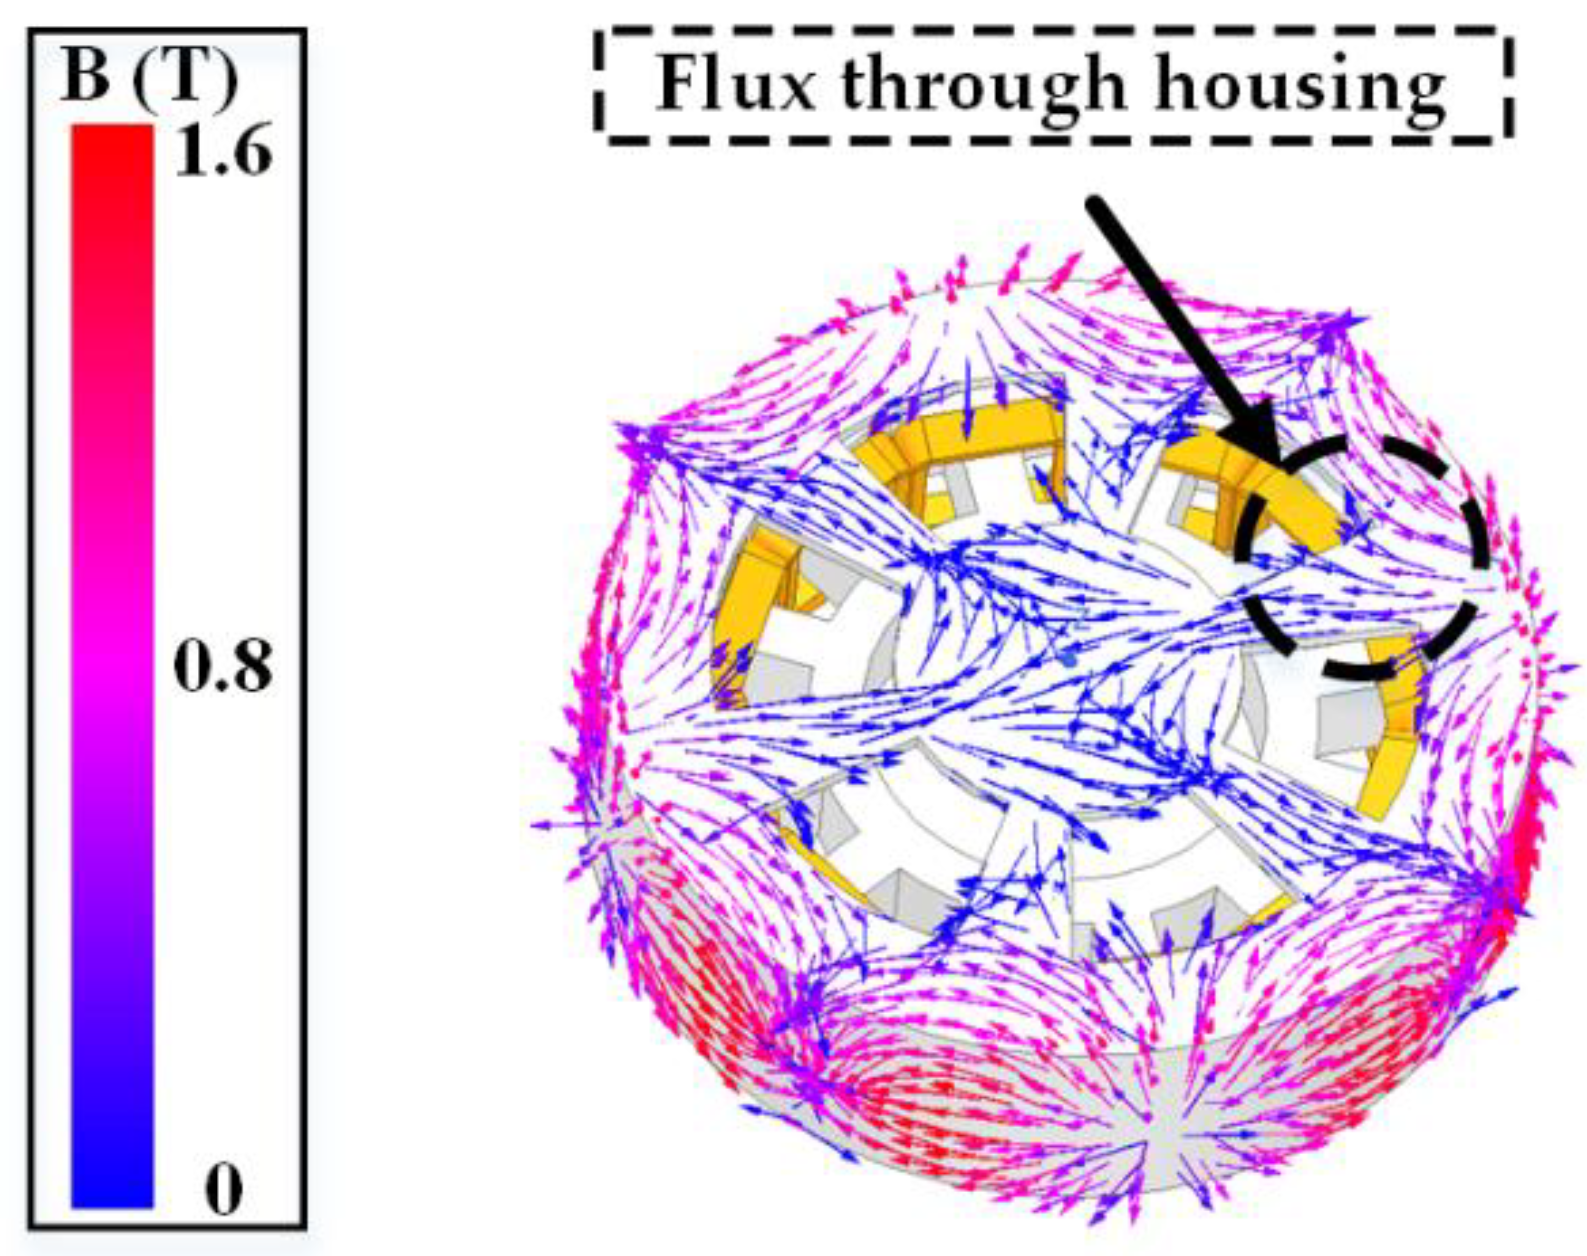
2.3. Housing-Integrated Rotor

The housing-integrated rotor is a 3D structure that is applied to secure the magnetic flux path and reduce the size of the device. As shown in Figure 3, when analyzing the 3D FEM, the magnetic flux flows not only in the yoke but also in the housing part. It is impossible to consider the housing part of the housing-integrated rotor in 2D when performing a 2D FEM analysis. When only the 3D yoke part is expressed in 2D, the rotor is significantly saturated.
The required values can be derived when the housing-integrated rotor is converted to 2D through the following equation:
V h o u s i n g + V y o k e = ( r r o 2 r r i 2 ) π l s
In Equation (6), V h o u s i n g is the volume of the housing part; V y o k e is the volume of the yoke part; r r o and r r i are the outer and inner diameters of the rotor in 2D, respectively; and l s is the axial length of the stator.
The rotor volume in the 3D model and the rotor volume in the 2D corrected model were equated by extending the radial direction of the rotor in the 2D corrected model.

3. Design of Experiments (DOE)

The cogging torque, the optimization object of this study, is affected by the shape of the motor, including the stator, rotor, and magnet. If there are many variables that can be adjusted, unnecessary analysis points are created and the optimization period is increased. Therefore, it is necessary to select and proceed with the most influential variables when producing an optimal design.
DOE is a technique for finding the optimal point with a small number of experiments for the optimization target model. Because DOE derives a local solution within the range of the desired solution, the DOE can select the optimal point relatively quickly within the constraints. If DOE is applied, the influence of each factor on the model can be identified and an optimization point can be determined by defining the relationship with the objective function.
In general, factors that are significant in the objective function are selected through factorial design, and the optimal point is determined by applying the selected factors to the RSM.

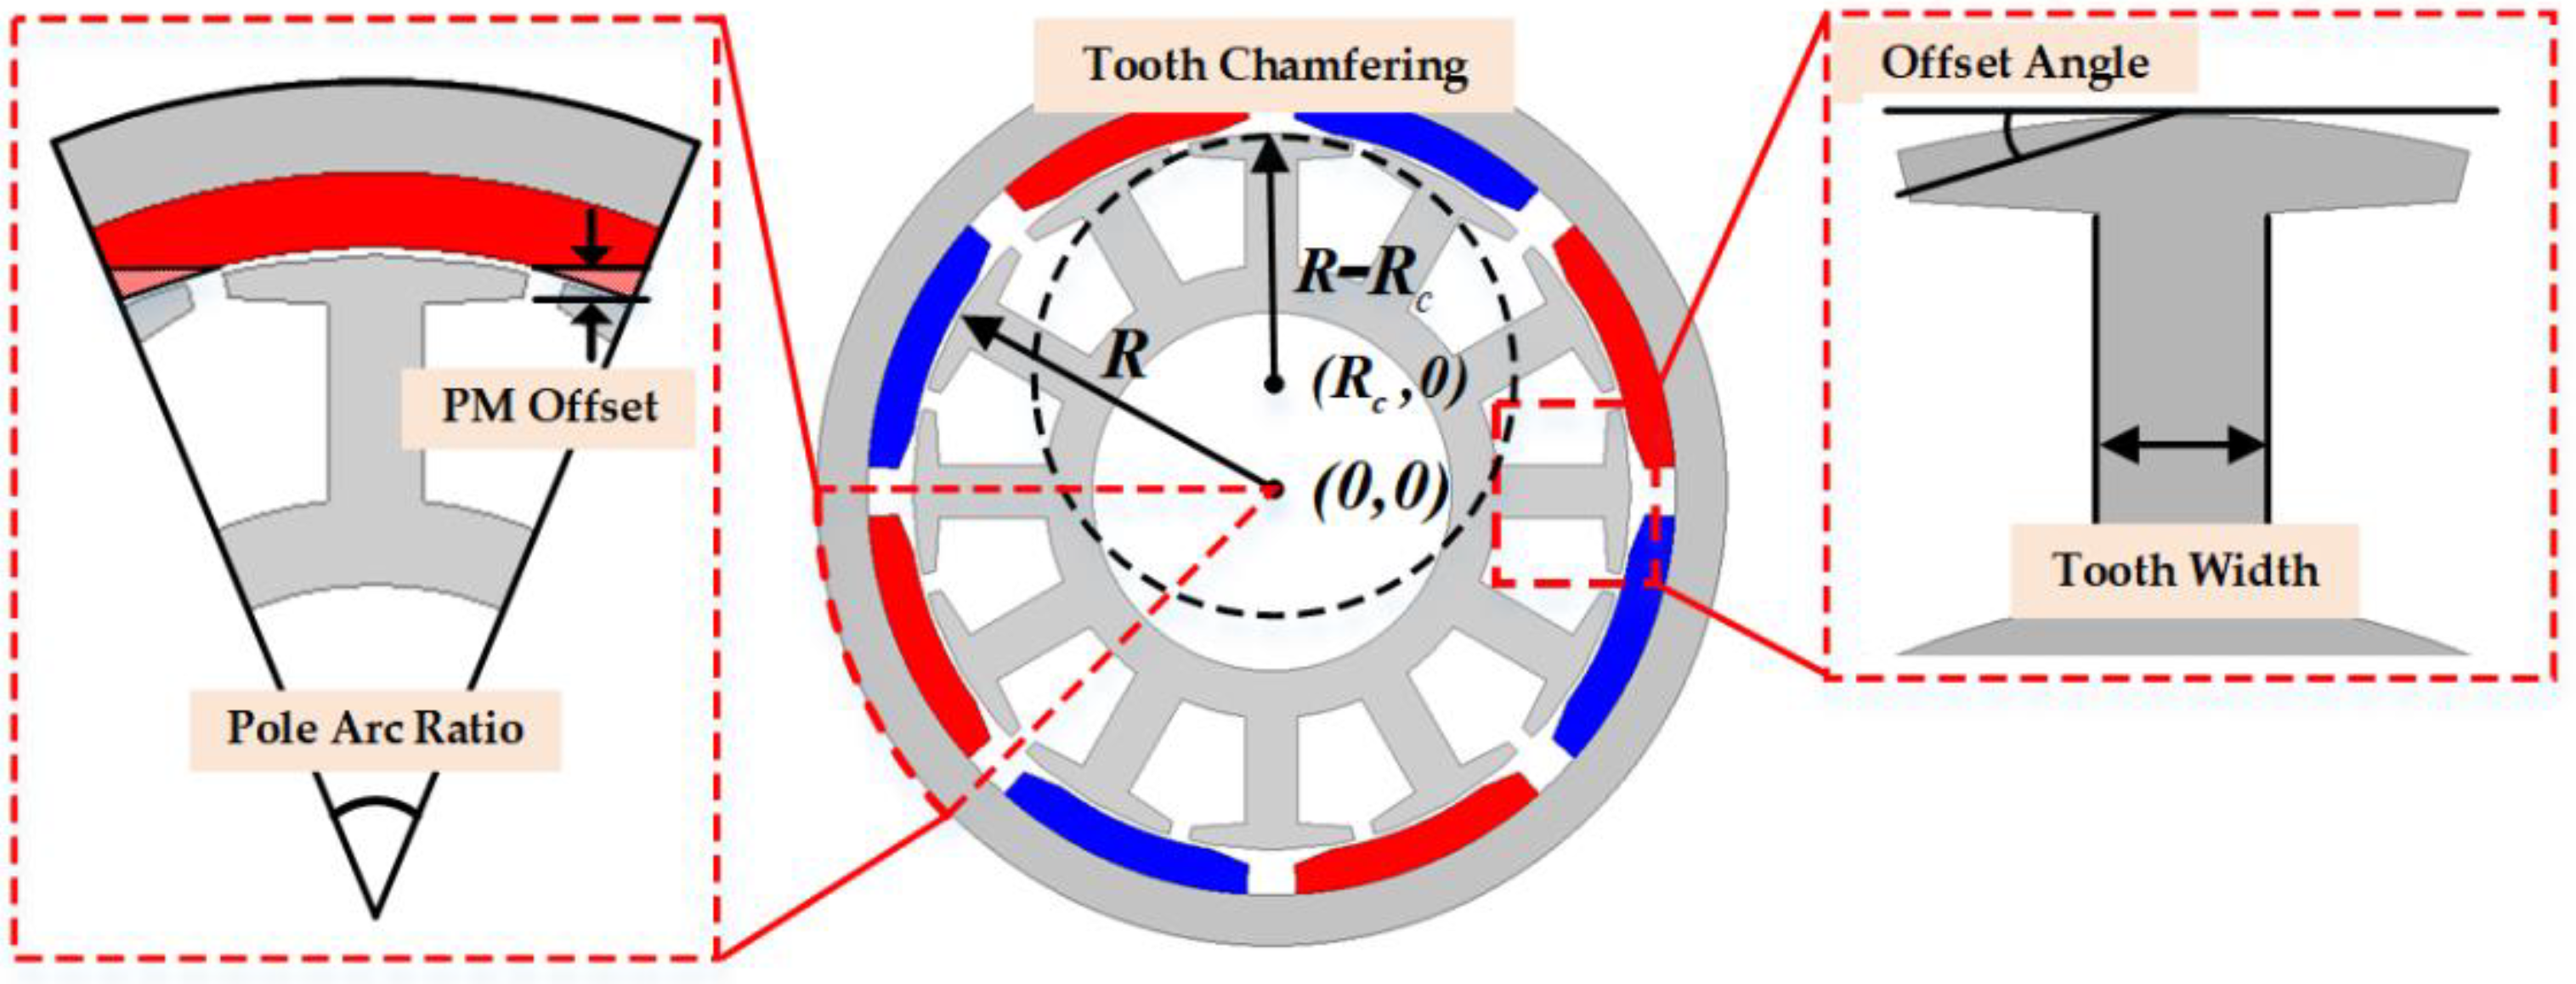
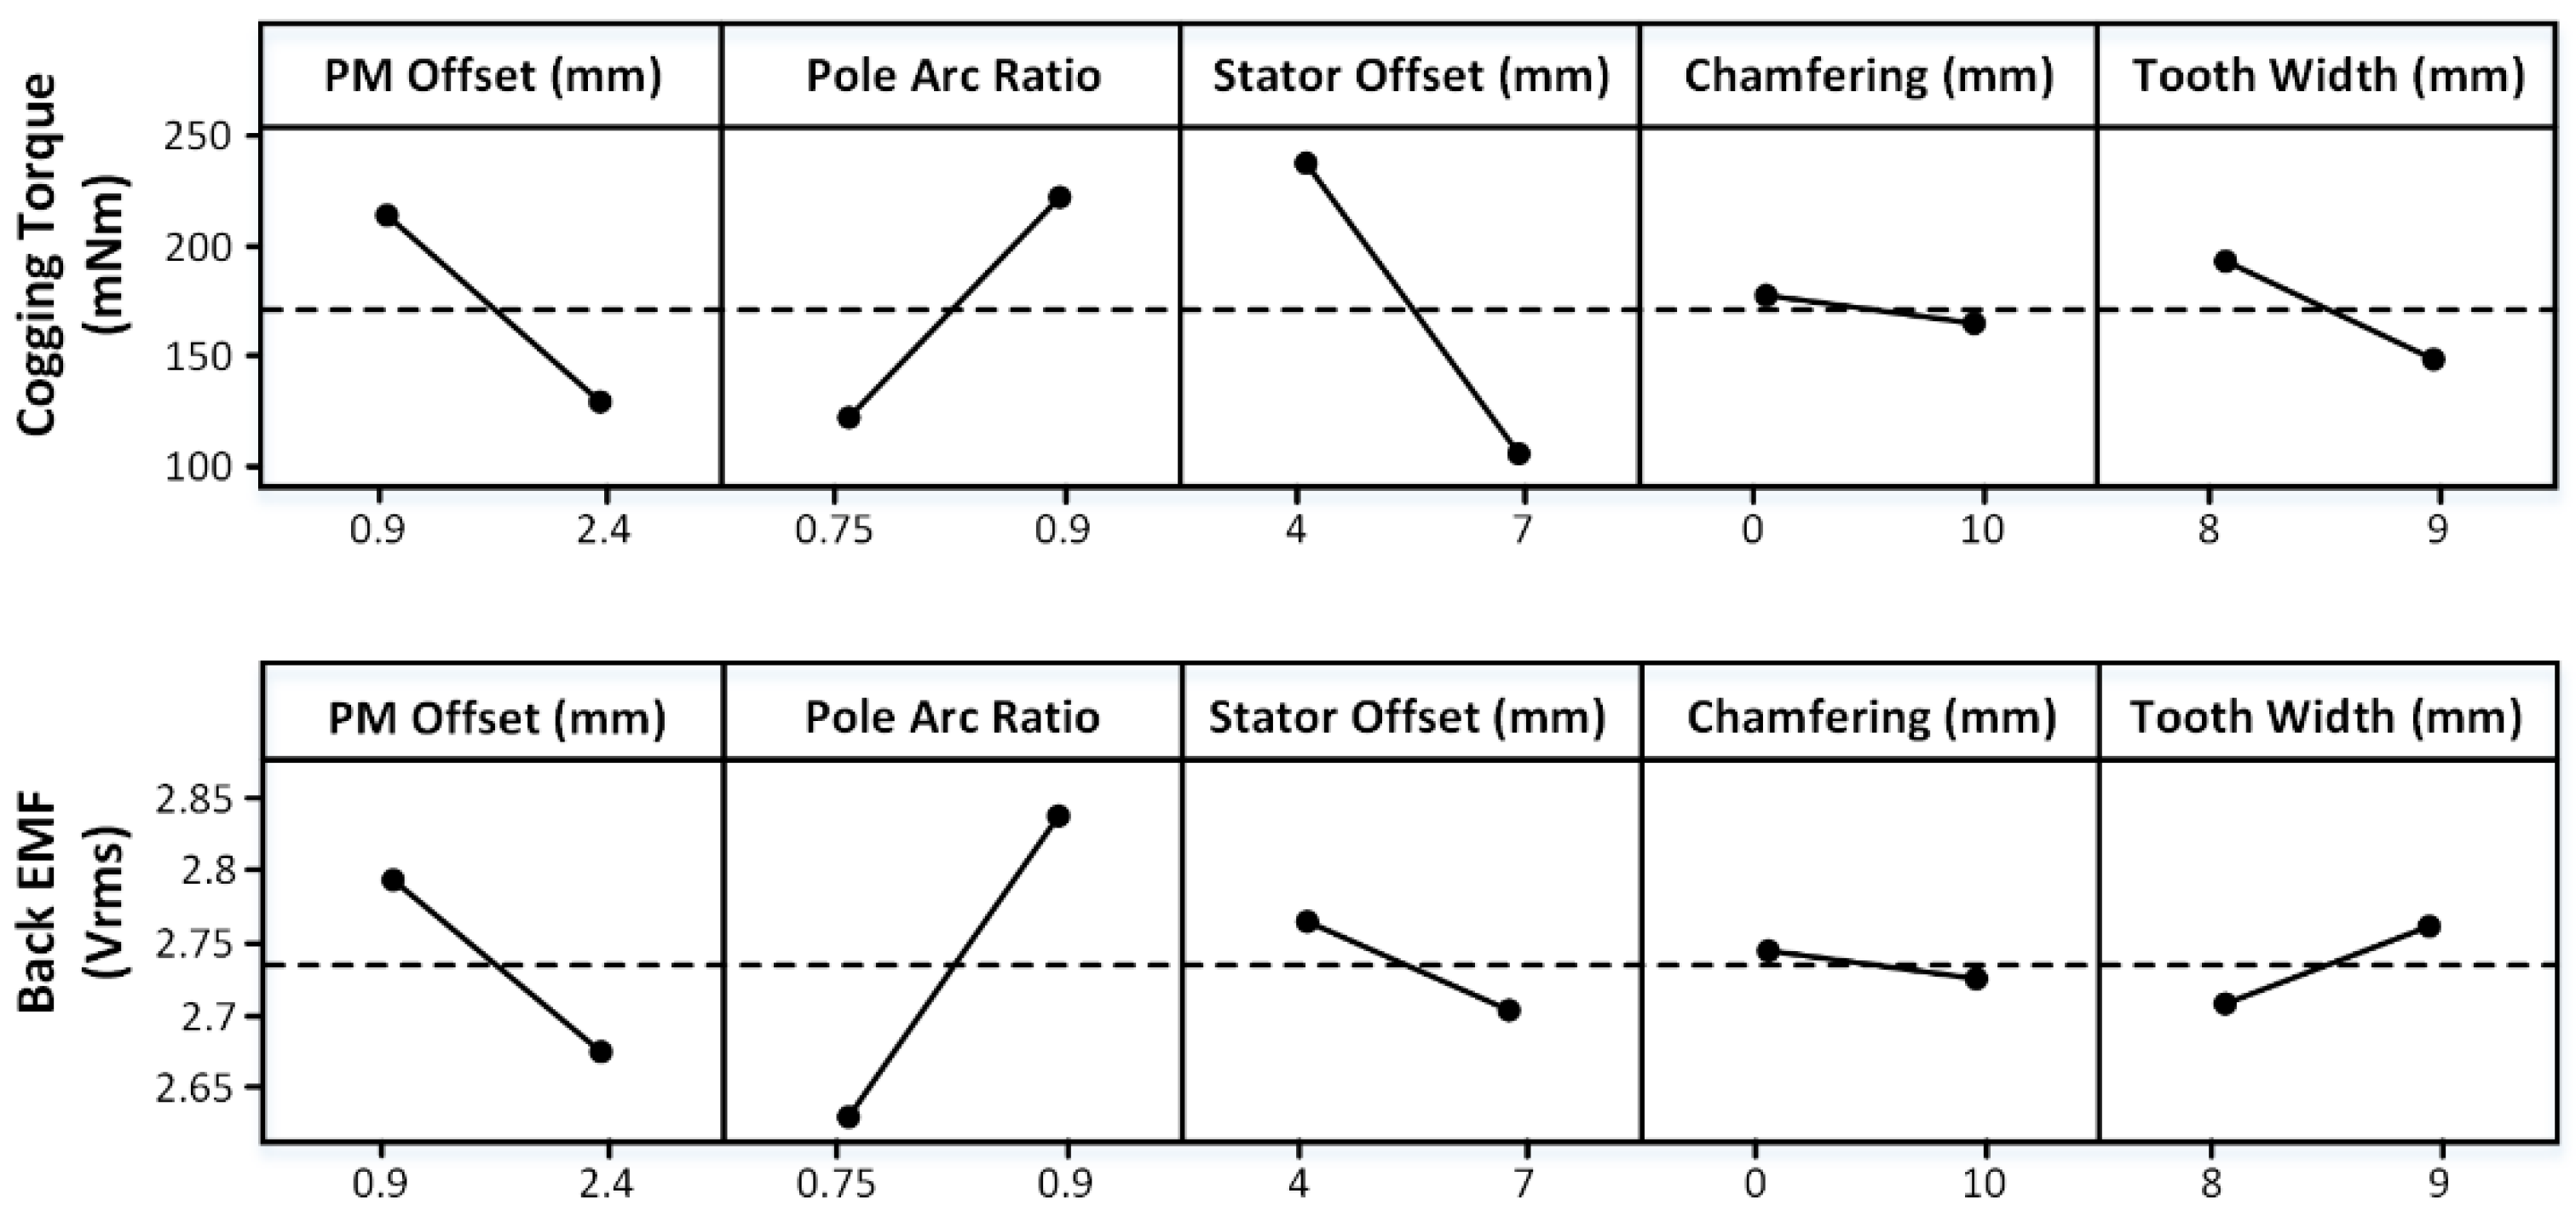
3.1. Design Variables Affecting Cogging Torque

Cogging torque is a pulsation torque caused by a tendency to align the reluctance to a minimum in a magnetic circuit composed of a stator, rotor, PM, and air gap of a model. The cogging torque affects the torque ripple and adversely affects the performance of the motor; therefore, it should be considered in an optimal design. The cogging torque can be estimated using the following equation:
C T = P · Q L C M ( P , Q )
In Equation (7), C T is the goodness factor, P is the number of poles, Q is the number of slots, and L C M ( P , Q ) is the least common multiple of P and Q . The goodness factor is a measure for estimating the size of the cogging torque and is inversely proportional to L C M ( P , Q ) . The model in this study was an 8-pole, 12-slot model, and the cogging torque was large because the least common multiple was small [6,28,29]. To reduce the cogging torque, variables related to the shape of the rotor, stator, and magnet should be applied. As shown in Figure 4, the factors to be applied to the DOE in this study were three variables for the stator and two variables for the PM.

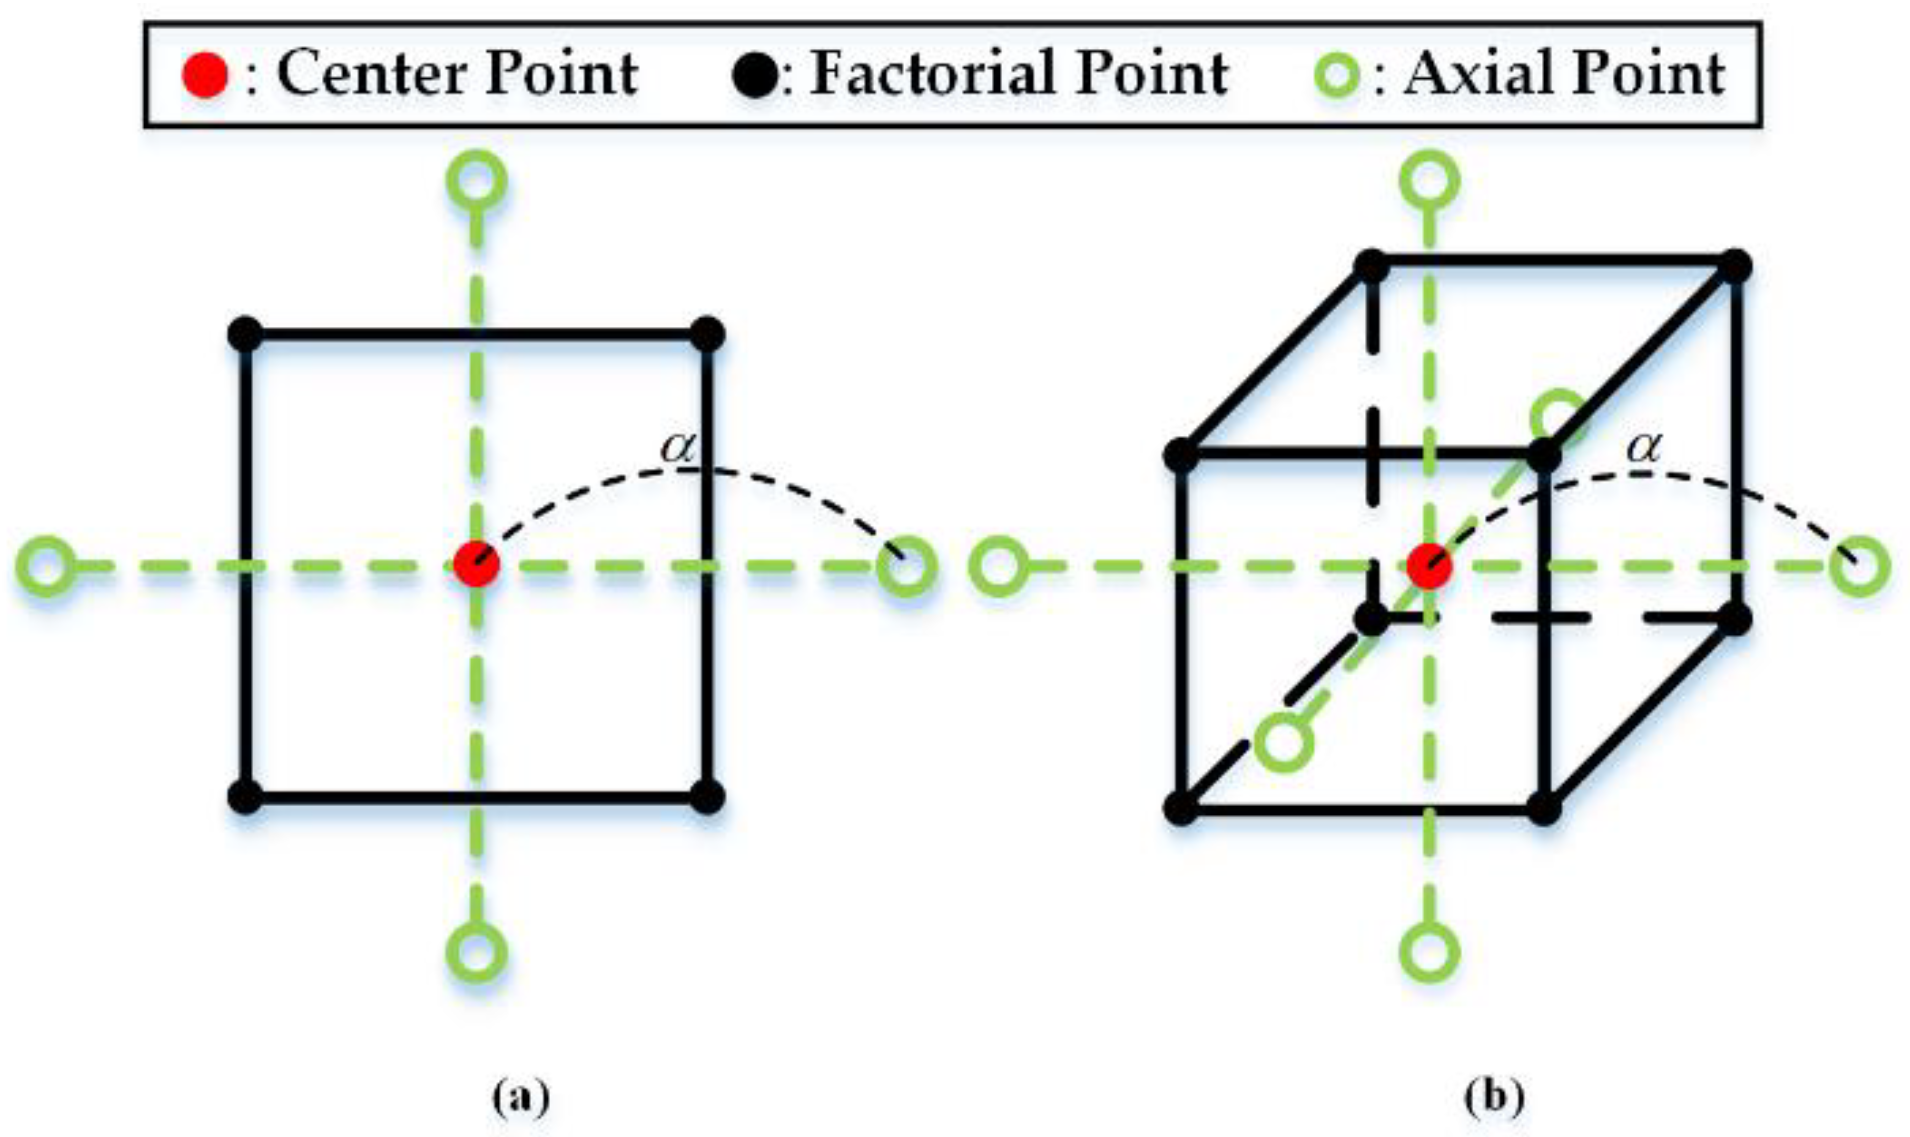
3.2. Factorial Design

Before proceeding with the RSM by applying the presented factors, meaningful factors should be selected through factorial design. Applying the factorial design can select factors that significantly affect the objective function and shorten the unnecessary optimization time. In particular, in the multi-objective optimization method, the effect on each objective function can be analyzed and selected according to the purpose. In this study, the 2 k factorial design is used; the coefficient represents the number of levels and the exponent represents the number of factors. In the two-level factorial design, the level of all factors was two, and the relational expression between factors and response values can be expressed simply and efficiently. Figure 5 shows the relationship between the cogging torque and back EMF, which were the objective functions of this study, and the variables. As the goal of this study was to reduce the cogging torque while maintaining the back EMF, variables that had a small influence on the back EMF and had a large influence on the cogging torque were advantageous. As shown in Figure 5, the PM offset, stator offset, and tooth width were selected because the pole arc ratio has a significant influence on the back EMF, and chamfering has little effect on either objective function.

3.3. Factorial Design with Center Point

The RSM proceeds when the analysis result in the factorial design is near the optimal point. The optimal point exists where there is a curvature on the response surface, where it is located by adding a center point to the factorial design as a method to search for the curvature. The evidence of curvature exists when the response values at the center point are not included in the response surface in the factorial design.

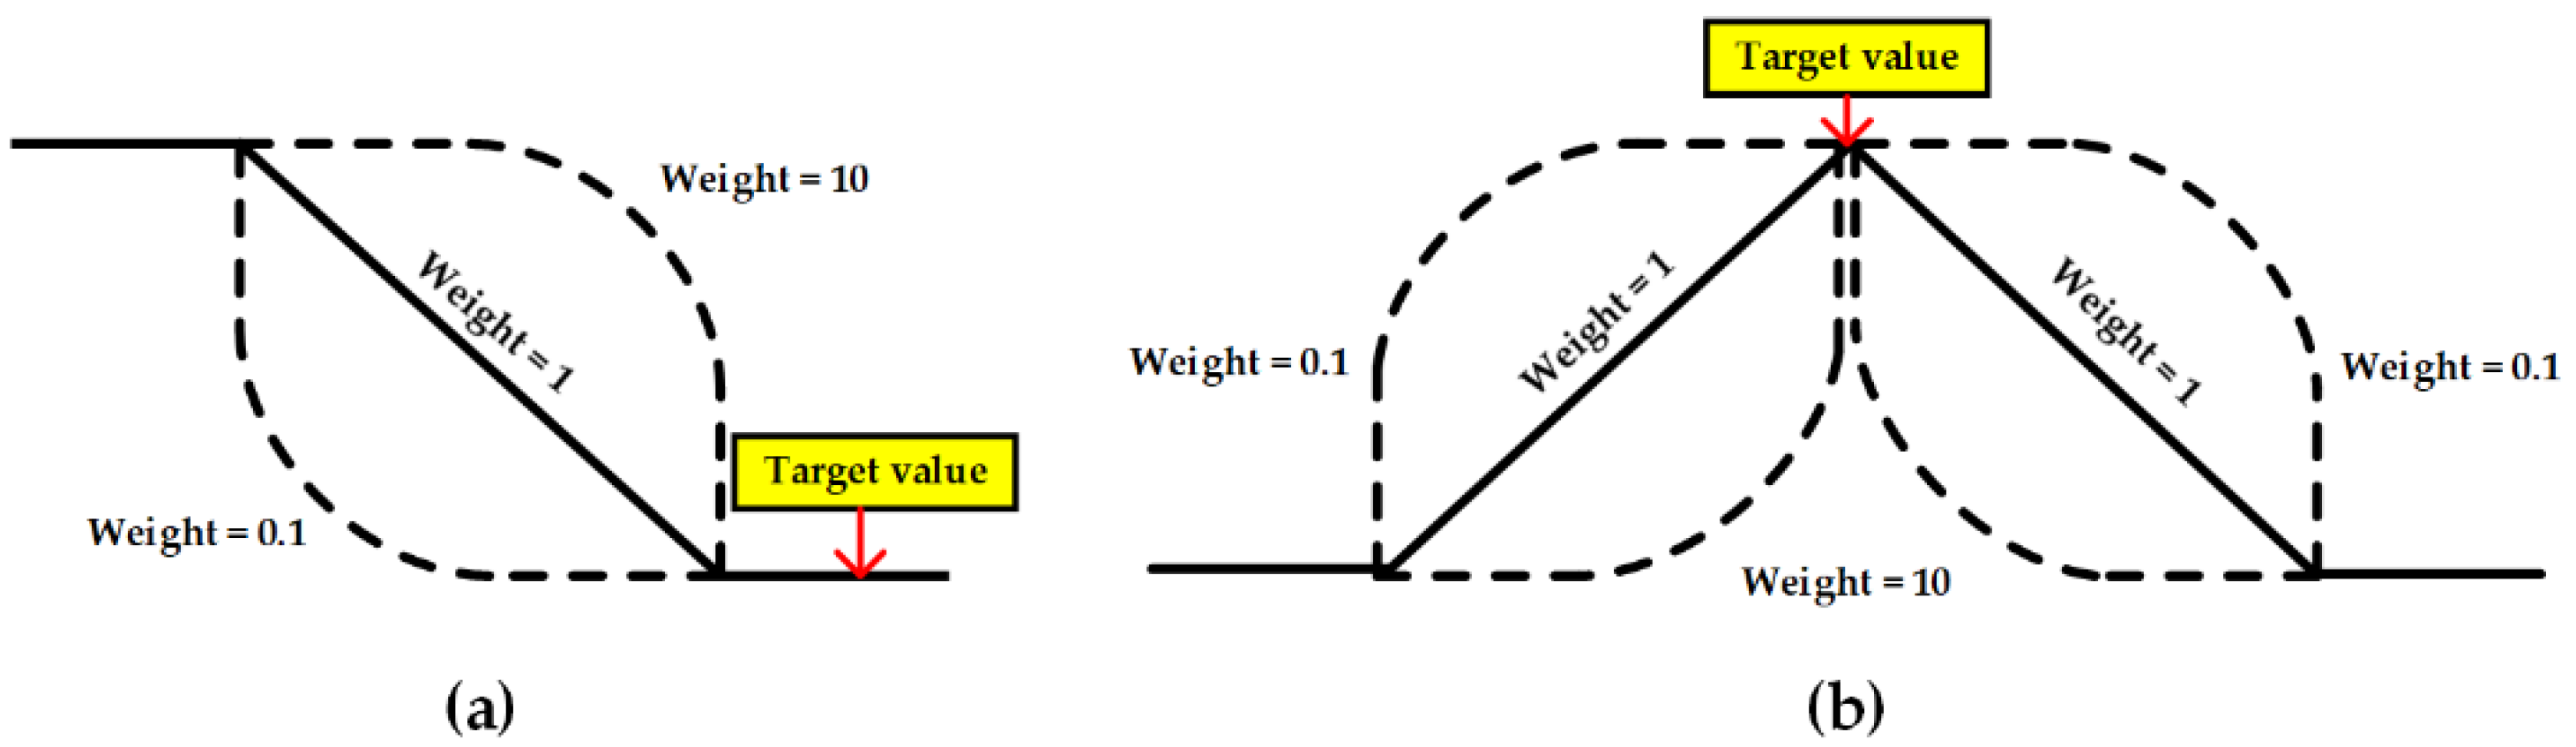
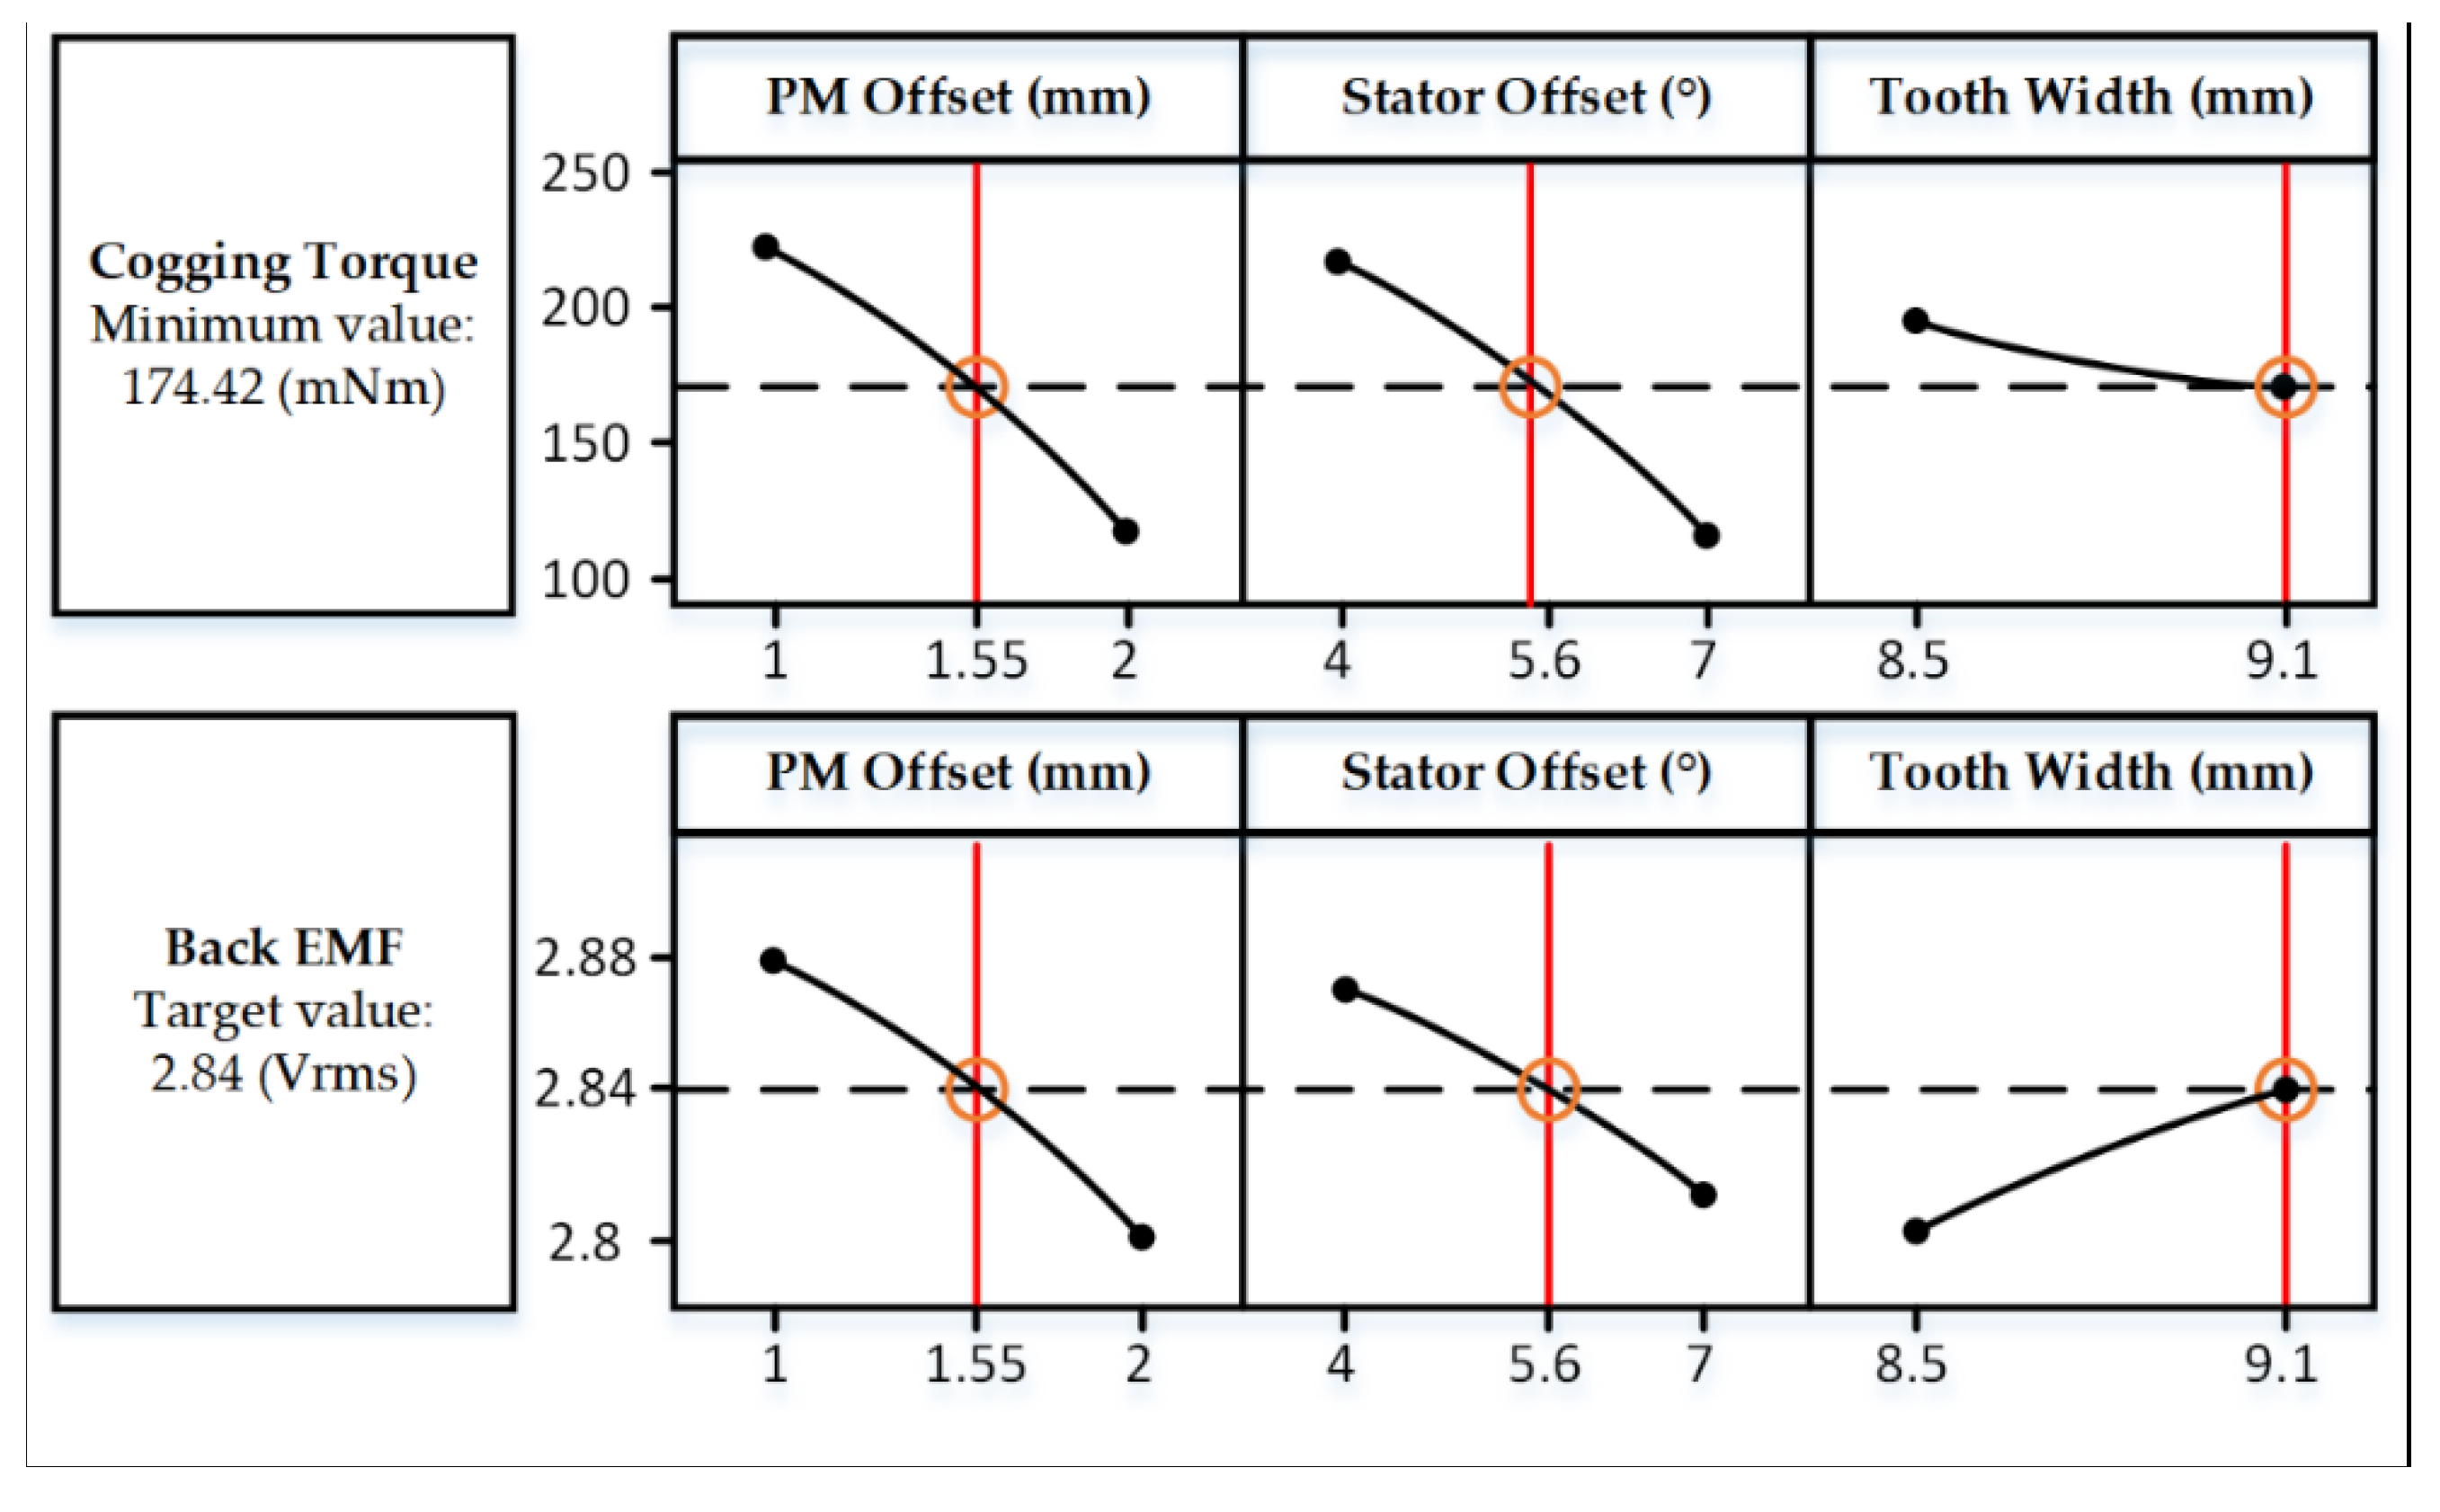
3.4. Response Surface Method

When evidence of curvature is found in the factorial design with the center point, the RSM is performed to determine the optimal point. In this study, the central composite design (CCD), which is generally used among RSMs, was applied. Figure 6a,b shows the CCD when two and three factors are applied, respectively. As shown in Figure 6, the CCD considers the response value at the center and axial points, unlike the factorial design. Because the response values of the central and axial points exist, the curvature at the response surface and the quadratic terms of the response function can be estimated.
f ( x ) = a 0 + a 1 x 1 + a 2 x 2 + a 3 x 1 x 2 + a 4 x 1 2 + a 5 x 2 2
Equation (8) is the response function of the two-factor RSM. f ( x ) is a response function, a is an estimation coefficient, and x 1 and x 2 are the factor values of each variable. α , shown in Figure 6, represents the distance from the central point to the axial point. If the axial point and factorial point are designed to exist at an equal distance from the center point, the analysis model has rotationality, resulting in equal variance and improved algorithm stability. The position of the axial point is generally determined by α = n f 4 , where n f is the number of factorial points.
Table 1 lists the optimization ranges of each factor. Each point is the position of the axial point, and the value of α is 1.681 [30].
Table 2 shows the analysis points at the center, factorial, and axial points of the RSM. The response values at each analysis point are shown, and the 1st to 8th analysis points represent the axial points, the 9th to 14th analysis points represent the factorial points, and the 15th analysis point represents the center point.
y 1 = 4907.97 + 544.668 * x 1 + 44.7990 * x 2 1052.21 * x 3 58.5907 * x 1 2 15.0979 * x 2 2 + 59.6963 * x 3 2 58.5878 * x 1 * x 2 + 4.80467 * x 2 * x 3
y 2 = 0.500444 + 0.0524745 * x 1 + 0.0536581 * x 2 + 0.465951 * x 3 0.0266451 * x 1 2 0.00396127 * x 2 2 0.0217918 * x 3 2 0.00424264 * x 1 * x 2 0.00377124 * x 2 * x 3
Equations (9) and (10) are the response functions estimated through the RSM. y 1 and y 2 are the cogging torque and back EMF, respectively; x 1 , x 2 , and x 3 are the PM offset, stator offset, and tooth width, respectively. The tendency of the response value according to the change in the factor value is determined by the linear, quadratic, and alternating terms of each factor.
Figure 7 shows the contour plot of the response value according to the changes in the factors. All the response surfaces have a curvature. As shown in Equations (9) and (10) and Figure 7, when the PM offset and stator offset increased, the cogging torque and back EMF decreased, and when the tooth width increased, the cogging torque decreased and the back EMF increased.
When using the response surface, the optimal point is selected using the goal and desirability function of each response value. The goal was to maintain 2.84 V r m s , which was the back EMF of the initial model, and to minimize the cogging torque. The desirability function can assign importance to each target value by selecting a weight between 0.1 and 10, as shown in Figure 8. When the weight is close to 0.1, high satisfaction is derived even if the response value is far from the target value, and when the weight is close to 10, high satisfaction is derived near the target value. In this study, since the reduction in the cogging torque and the maintenance of the back EMF are equally important values, the weights of the two response values were set to 1. Figure 9 shows the result of selecting the optimal point based on the relationship between each variable and the response values. Table 3 shows the inductances and the flux linkages in each analysis model, and the inductances and flux linkages of the two models were similar.

4. Results

Figure 10 shows the manufactured optimization model, housing-integrated rotor, and magnet overhang.
Figure 11a,b shows the cogging torque and back EMF results when the 3D structure was converted to 2D, respectively, and the results of the 3D initial and 2D initial models are also included; “2DC” in Figure 11 and Figure 12 means 2D corrected. The values of the cogging torque and back EMF in the 2D initial model were smaller than the values of the 3D initial model. This was because the volume of the magnet decreased and the energy decreased; the volume of the yoke decreased so that the magnetic flux path could not be secured. By deriving the operating point of the magnet according to Equations (1)–(5) and adjusting the B–H curve, the energy held by the PM was the same. In addition, the thickness was increased so that the yoke was not saturated. Figure 11 shows that the analysis results of the 2D corrected model were close to those of the 3D initial model.
Figure 12a,b shows the cogging torque and back EMF of the 2D corrected model, respectively, when multi-objective optimization of the motor was performed by applying the RSM, and the results of the 3D optimization model and the manufactured model are shown. Figure 12a shows that the cogging torques of the experiment, optimized 3D model, and 2D corrected model were approximate. Figure 12b shows that the back EMFs of the experiment, optimized 3D model, and 2D corrected model are approximate.
Table 4 shows the analysis results of the 2D corrected model under different load conditions, when calculating the efficiency, the mechanical loss was set to 3%. Table 5 shows the experimental results under different load conditions of the manufactured model.
Table 6 shows the analysis time of the 2D corrected model and the 3D model. It can be seen that the times for the no-load and load analyses of the 2D corrected model were significantly shorter than the analysis time for the 3D model. The specifications of the CPU, RAM, cores, and mesh, which is the total number of elements, are shown for the validity of the analysis results.

5. Conclusions

In this paper, the optimal design of a BLDC motor with a 3D structure through RSM is presented. To improve the performance of the motor, reducing the cogging torque and maintaining the back EMF were selected as the objective functions. Because it is difficult to perform 2D FEM on models with 3D structures and 3D FEM analysis takes considerable time, 3D structures were analyzed by using an equivalent 2D structure. The magnet overhang was equated by adjusting the B–H curve to have the same magnetic energy when the volume of the magnet changed. The housing-integrated rotor increased the thickness of the yoke in the 2D model to maintain the total volume in the 3D structure by considering flux saturation. When comparing the cogging torque and back EMF of the initial 2D model, initial 2D corrected model, and initial 3D model, the results of the initial 2D corrected model were close to those of the initial 3D model.
The RSM was applied as the model optimization technique, and a two-level five-factorial design was used to select the variables to be applied to the RSM. The PM offset, stator offset, and tooth width were selected as factors because out of the two objective functions since they affect the cogging torque more. Before advancing with the RSM, a factorial design with a center point was performed to check whether the factors were suitable for proceeding with the RSM, and a curvature appeared on the response surface of the cogging torque and back EMF. Therefore, a CCD was performed using three selected factors as variables. The response surface was derived according to the values of each variable through linear, quadratic, and alternating terms estimated through the CCD. After that, by selecting the optimal point, the 2D corrected model was inversely equivalent to the 3D structure model, and it was confirmed that the electromagnetic characteristics were similar. Because the electromagnetic characteristics were maintained after optimization, the validity of the optimal design technique of this study was verified. Therefore, the time to optimize the BLDC with 3D structures was shortened by using a 2D corrected model. By using the 2D equivalent technique of this study, it will be possible to reduce the load analysis time of the BLDC of the 3D structure, which consumes considerable computation time. In addition, because the RSM requires few analysis points, it will be possible to optimize the electromagnetic characteristics under load faster than other techniques.

Author Contributions

J.-Y.C.: conceptualization and review and editing; S.-T.J.: original draft preparation and analysis; H.-S.S.: experiment and co-simulation; Y.-G.L.: co-simulation; J.-H.L.: co-simulation. All authors have read and agreed to the published version of the manuscript.

Funding

This research was supported by the “Basic Science Research Program through the National Research Foundation of Korea” (NRF-2020R1A4A2002021); this research was supported by the National Research Foundation of Korea (NRF) grant funded by the Korean government (MSIT). (No. 2020R1A2C1007353).

Institutional Review Board Statement

Not applicable.

Informed Consent Statement

Not applicable.

Data Availability Statement

Not applicable.

Conflicts of Interest

The authors declare no conflict of interest.

References

  1. Kim, S.H. Motor Control-DC, AC, BLDC; D.B.Info.: Seoul, Korea, 2017. [Google Scholar]
  2. Kai, Y.; Yaojing, F. Design of Novel Spiral Magnetic Poles and Axial-Cooling Structure of Outer-Rotor PM Torque Motor. IEEE Trans. Appl. Supercond. 2010, 20, 838–841. [Google Scholar] [CrossRef]
  3. Wang, Y.; Chau, K.T.; Chan, C.C.; Jiang, J.Z. Transient analysis of a new outer-rotor permanent-magnet brushless DC drive using circuit-field-torque coupled time-stepping finite-element method. IEEE Trans. Magn. 2002, 38, 1297–1300. [Google Scholar] [CrossRef] [Green Version]
  4. Tang, Z.-H.; Chen, Y.-T.; Liou, Y.-K.; Liang, R.-H. Axial Magnetic Force Analysis and Optimized Design for Single-Phase BLDC Slim Fan Motors. IEEE Trans. Ind. Electron. 2021, 68, 6840–6848. [Google Scholar] [CrossRef]
  5. Youssef, M.Z. Design and Performance of a Cost-Effective BLDC Drive for Water Pump Application. IEEE Trans. Ind. Electron. 2014, 62, 3277–3284. [Google Scholar] [CrossRef]
  6. Leitner, S.; Gruebler, H.; Muetze, A. Innovative Low-Cost Sub-Fractional HP BLDC Claw-Pole Machine Design for Fan Applications. IEEE Trans. Ind. Appl. 2019, 55, 2558–2568. [Google Scholar] [CrossRef]
  7. Lee, C.-M.; Seol, H.-S.; Lee, J.Y.; Lee, S.H.; Kang, D.-W. Optimization of Vibration and Noise Characteristics of Skewed Permanent Brushless Direct Current Motor. IEEE Trans. Magn. 2017, 53, 1–5. [Google Scholar] [CrossRef]
  8. Park, Y.-U.; Cho, J.-H.; Kim, D.-K.; Young-Un, P. Cogging Torque Reduction of Single-Phase Brushless DC Motor with a Tapered Air-Gap Using Optimizing Notch Size and Position. IEEE Trans. Ind. Appl. 2015, 51, 4455–4463. [Google Scholar] [CrossRef]
  9. Lee, T.-Y.; Seo, M.-K.; Kim, Y.-J.; Jung, S.-Y. Motor Design and Characteristics Comparison of Outer-Rotor-Type BLDC Motor and BLAC Motor Based on Numerical Analysis. IEEE Trans. Appl. Supercond. 2016, 26, 1–6. [Google Scholar] [CrossRef]
  10. Chun, Y.-D.; Lee, J.; Wakao, S. Overhang effect analysis of brushless DC motor by 3-D equivalent magnetic circuit network method. IEEE Trans. Magn. 2003, 39, 1610–1613. [Google Scholar] [CrossRef]
  11. Shin, H.-S.; Shin, K.-H.; Jang, G.-H.; Cho, S.-K.; Jung, K.-H.; Choi, J.-Y. Experimental Verification and 2D Equivalent Analysis Techniques of BLDC Motor with Permanent Magnet Overhang and Housing-Integrated Rotor Core. IEEE Trans. Appl. Supercond. 2020, 30, 1–5. [Google Scholar] [CrossRef]
  12. Chun, Y.; Wakao, S.; Kim, T.; Jang, K.; Lee, J. Multiobjective Design Optimization of Brushless Permanent Magnet Motor Using 3D Equivalent Magnetic Circuit Network Method. IEEE Trans. Appl. Supercond. 2004, 14, 1910–1913. [Google Scholar] [CrossRef]
  13. Kim, K.-C.; Lee, J. The dynamic analysis of a spoke-type permanent magnet generator with large overhang. IEEE Trans. Magn. 2005, 41, 3805–3807. [Google Scholar] [CrossRef]
  14. Kim, K.-C.; Koo, D.-H.; Lee, J. The Study on the Overhang Coefficient for Permanent Magnet Machine by Experimental Design Method. IEEE Trans. Magn. 2007, 43, 2483–2485. [Google Scholar] [CrossRef]
  15. Jolly, L.; Jabbar, M.; Qinghua, L. Design optimization of permanent magnet motors using response surface methodology and genetic algorithms. IEEE Trans. Magn. 2005, 41, 3928–3930. [Google Scholar] [CrossRef]
  16. Rao, K.S.R.; Bin Othman, A.H. Design optimization of a BLDC motor by Genetic Algorithm and Simulated Annealing. In Proceedings of the 2007 International Conference on Intelligent and Advanced Systems, Kuala Lumpur, Malaysia, 25–28 November 2007; pp. 854–858. [Google Scholar] [CrossRef]
  17. Han, K.J.; Cho, H.-S.; Cho, D.-H.; Jung, H.-K. Optimal core shape design for cogging torque reduction of brushless DC motor using genetic algorithm. IEEE Trans. Magn. 2000, 36, 1927–1931. [Google Scholar] [CrossRef]
  18. Li, J.; Liu, Z.; Jabbar, M.; Gao, X. Design Optimization for Cogging Torque Minimization Using Response Surface Methodology. IEEE Trans. Magn. 2004, 40, 1176–1179. [Google Scholar] [CrossRef]
  19. Park, J.; Kim, S.; Hong, J.; Lee, J. Rotor Design on Torque Ripple Reduction for a Synchronous Reluctance Motor with Concentrated Winding Using Response Surface Methodology. IEEE Trans. Magn. 2006, 42, 3479–3481. [Google Scholar] [CrossRef]
  20. Fang, L.; Jung, J.-W.; Hong, J.-P.; Lee, J.-H. Study on High-Efficiency Performance in Interior Permanent-Magnet Synchronous Motor with Double-Layer PM Design. IEEE Trans. Magn. 2008, 44, 4393–4396. [Google Scholar] [CrossRef]
  21. Si, J.; Zhao, S.; Feng, H.; Cao, R.; Hu, Y. Multi-objective optimization of surface-mounted and interior permanent magnet synchronous motor based on Taguchi method and response surface method. Chin. J. Electr. Eng. 2018, 4, 67–73. [Google Scholar] [CrossRef]
  22. Im, Y.-H.; Hwang, S.-I.; Choi, J.-Y.; Jang, S.-M.; Choi, J.-H. Analysis of Torque Pulsation Considering Interior Permanent Magnet Rotor Rib Shape Using Response Surface Methodology. IEEE Trans. Magn. 2012, 48, 979–982. [Google Scholar] [CrossRef]
  23. Kim, S.-I.; Hong, J.-P.; Kim, Y.-K.; Nam, H.; Cho, H.-I. Optimal design of slotless-type PMLSM considering multiple responses by response surface methodology. IEEE Trans. Magn. 2006, 42, 1219–1222. [Google Scholar] [CrossRef]
  24. Lee, B.-H.; Hong, J.-P.; Lee, J.-H. Optimum Design Criteria for Maximum Torque and Efficiency of a Line-Start Permanent-Magnet Motor Using Response Surface Methodology and Finite Element Method. IEEE Trans. Magn. 2012, 48, 863–866. [Google Scholar] [CrossRef]
  25. Koh, C.S.; Yoon, H.S.; Nam, K.W.; Choi, H.S. Magnetic pole shape optimization of permanent magnet motor for reduction of cogging torque. IEEE Trans. Magn. 1997, 33, 1822–1827. [Google Scholar] [CrossRef]
  26. Islam, M.; Mir, S.; Sebastian, T. Issues in Reducing the Cogging Torque of Mass-Produced Permanent-Magnet Brushless DC Motor. IEEE Trans. Ind. Appl. 2004, 40, 813–820. [Google Scholar] [CrossRef]
  27. Hendershot, J.R.; Miller, T.J.E. Design of Brushless Permanent Magnet Machines; Motor Design Books: Venice, FL, USA, 2010. [Google Scholar]
  28. Hwang, S.-M.; Eom, J.-B.; Hwang, G.-B.; Jeong, W.-B.; Jung, Y.-H. Cogging torque and acoustic noise reduction in permanent magnet motors by teeth pairing. IEEE Trans. Magn. 2000, 36, 3144–3146. [Google Scholar] [CrossRef]
  29. Zhu, Z.Q.; Howe, D. Influence of design parameters on cogging torque in permanent magnet machines. IEEE Trans. Energy Convers. 2000, 15, 407–412. [Google Scholar] [CrossRef] [Green Version]
  30. Garroi, J.-J.; Goos, P.; Sörensen, K. A variable-neighbourhood search algorithm for finding optimal run orders in the presence of serial correlation. J. Stat. Plan. Inference 2009, 139, 30–44. [Google Scholar] [CrossRef]
Figure 1. The 3D structures of the analysis model.
Energies 15 00461 g001
Figure 2. Demagnetization curve of a PM.
Energies 15 00461 g002
Figure 3. Magnetic flux density through the housing part.
Energies 15 00461 g003
Figure 4. Design variables.
Energies 15 00461 g004
Figure 5. Effect of variables on the cogging torque and back EMF.
Energies 15 00461 g005
Figure 6. Central composite design with (a) two variables and (b) three variables.
Energies 15 00461 g006
Figure 7. Contour plot of the cogging torque with (a) tooth width and stator offset, (b) tooth chamfering and stator offset, (c) tooth chamfering and tooth width, and BEMF with (d) tooth width and stator offset, (e) tooth chamfering and stator offset, and (f) tooth width and stator offset.
Energies 15 00461 g007
Figure 8. Desirability function for (a) smaller the better characteristics and (b) nominal is the best characteristics.
Energies 15 00461 g008
Figure 9. Set optimal point based on the initial parameter.
Energies 15 00461 g009
Figure 10. Manufactured analysis model (a) upper view and (b) lower view.
Energies 15 00461 g010
Figure 11. The 2D corrected model analysis results for the (a) cogging torque and (b) back EMF.
Energies 15 00461 g011
Figure 12. RSM results for the (a) cogging torque and (b) back EMF.
Energies 15 00461 g012
Table 1. Range of variables.
VariablesLower LimitUpper Limit
PM Offset1 mm2 mm
Stator Offset4.5 mm6.5 mm
Tooth Width8.5 mm9.1 mm
Table 2. Design variables and responses of the RSM.
RunPM Offset (mm)Stator Offset
(°)
Tooth Width (mm)Cogging Torque (mNm)Back EMF (Vrms)
11.202704.905408.62162297.9042.8869
21.797304.905408.62162210.6772.8488
31.202706.094608.62162205.0062.8602
41.797306.094608.62162123.9462.8224
51.202704.905408.97838280.7992.9078
61.797304.905408.97838181.9242.8687
71.202706.094608.97838190.7202.8794
81.797306.094608.9783896.4522.8408
915.58.8258.1512.8946
1025.58.8118.9492.8295
111.54.58.8273.2212.8880
121.56.58.812.9802.8415
131.55.58.5228.1512.8500
141.55.59.1188.9902.8835
151.55.58.8206.2252.8688
Table 3. Inductance and flux linkage of each analysis model.
Analysis ModelInitial Corrected ModelOptimal 2D Corrected Model
Phase Inductance 86.07   μ H 87.28   μ H
Flux Linkage 0.0096   Wb 0.0097   Wb
Table 4. Analysis results of the 2D corrected model.
Load Torque (Nm)Output Power (W)Core Loss (W)Copper Loss (W)Efficiency (%)
0.5139.111.743.4687.44
1274.213.3112.3288.71
1.5408.914.6425.8888.25
2548.016.1044.6087.33
2.42669.717.6564.5986.39
Table 5. Experiment results of the manufactured model.
Load Torque (Nm)Output Power (W)Core + Mechanical Loss (W)Copper Loss (W)Efficiency (%)
0.513725.43.9182.76
127427.312.3488.05
1.541133.726.1888.28
254844.145.9287.17
2.3865154.264.8187.58
Table 6. Analysis time.
2D Corrected Model3D Model
No-load analysis (s)7139,381
Load analysis (s)5891142,958
Mesh10,253809,367
CPUIntel Core i9-11900K @3.50 GHz
RAM128 GB
Cores4 of 8
Publisher’s Note: MDPI stays neutral with regard to jurisdictional claims in published maps and institutional affiliations.

