Abstract
Multiple techniques continue to be simultaneously utilized in the condition monitoring and fault detection of electric machines, as there is still no single technique that provides an all-round solution to fault finding in these machines. Having various machine fault-detection techniques is useful in allowing the ability to combine two or more in a manner that will provide a more comprehensive application-dependent condition-monitoring solution; especially, given the increasing role these machines are expected to play in man’s transition to a more sustainable environment, where many more electric machines will be required. This paper presents a novel non-invasive optical fiber using a stray flux technique for the condition monitoring and fault detection of induction machines. A giant magnetostrictive transducer, made of terfenol-D, was bonded onto a fiber Bragg grating, to form a composite FBG-T sensor, which utilizes the machines’ stray flux to determine the internal condition of the machine. Three machine conditions were investigated: healthy, broken rotor, and short circuit inter-turn fault. A tri-axial auto-data-logging flux meter was used to obtain stray magnetic flux measurements, and the numerical results obtained with LabView were analyzed in MATLAB. The optimal positioning and sensitivity of the FBG-T sensor were found to be transverse and 19.3810 pm/μT, respectively. The experimental results showed that the FBG-T sensor accurately distinguished each of the three machine conditions using a different order of magnitude of Bragg wavelength shifts, with the most severe fault reaching wavelength shifts of hundreds of picometres (pm) compared to the healthy and broken rotor conditions, which were in the low-to-mid-hundred and high-hundred picometre (pm) range, respectively. A fast Fourier transform (FFT) analysis, performed on the measured stray flux, revealed that the spectral content of the stray flux affected the magnetostrictive behavior of the magnetic dipoles of the terfenol-D transducer, which translated into strain on the fiber gratings.
Keywords:
FBG-T sensing; fault severity; non-invasive; magnetostrictive; terfenol-D; stray flux; Bragg shift 1. Introduction
The world is now more alert to the damage being done by carbon emissions, and as a result, mankind will spend the following decades trying to reduce and, where possible, completely undo the damage already caused by industrialization, within a carbon footprint perspective. One clear path to achieving net zero that has been globally accepted is the transition to electric alternatives where possible, such as electric vehicles (EV), electric trains (ET), and, soon, electric airplanes (EA). The nexus that brings these systems together is the electric machine and its drives, whether in EVs, ETs, or EA; or even in renewable power generation, such as wind and solar. This is in addition to the already existing over-reliance of man on these electric machines in all works of life. Real-time online condition monitoring of these machines is, therefore, crucial, now more than ever, as the reliability of these machines is a sine qua non for boosting end user confidence in transiting to the ideal world of net zero carbon emissions. Induction machines for example, are currently one of the most widely used electric machines globally, because of their numerous advantages, including ruggedness, minimal maintenance, compactness, and efficiency. Although there are various techniques, with each having its own merits and limitations [1], given the great usage of these machines globally, there will never be a superfluous number of condition monitoring and fault detection techniques. Rather, a blend of techniques that are application dependent is being realized. Optical fiber sensors offer high reliability, low cost, and zero electromagnetic interference, in addition to various other advantages; hence, it is no surprise that they continue to find applications in various fields. Fiber Bragg gratings (FBG) appear to be the most commonly used optical fiber sensor in recent times. The use of FBG for condition monitoring and sensing has found far reaching research applications, especially recently in the current post-pandemic period. Some of the most recent applications of FBG sensing published include:
- Engineering: condition monitoring of thermoelectric engines [2], anaerobic bio digester for biomass plants [3], and nuclear fuel cycle facilities [4]; deformation monitoring of subway floating slab [5]
- Biomedical engineering: development of a surgical robotic system for less-invasive treatment of osteolysis [6]; force sensor with an ortho-planar spring-based flexure for surgical needle insertion [7,8]; robot-assisted eye surgery [9], and temperature monitoring during thermal ablation procedure [10]
- Electrical engineering: temperature monitoring of the lithium-ion batteries crucial for large scale deployment of electric vehicles and their second life power grid support application [11,12]; galloping monitoring of power transmission lines [13]; condition monitoring of an oil-immersed commercial distribution power transformer [14]
- Even machine learning has been recently used to make FBG sensors more reliable [12,15], as well as for potential uses in both space applications [16] and cryogenics [17].
Hitherto, applications of FBG sensing for electric machine condition monitoring have been invasive in nature; mostly installed within stator slots or circumferentially around stator windings. Given the challenges with the brittleness of the fiber and difficulty in sensor replacement should it fail, there is no known FBG sensor that measures magnetic field in a non-intrusive manner, utilizing external stray flux to determine electric machine condition, as well as detecting faults. While the external stray flux is attenuated by the machine yoke, it is generally sufficient to be detected by optics, given the order of magnitude of the broadband laser used for such sensors, typically in the nanometer (nm) range. FBG, on its own, is immune to electromagnetic fields; hence, it requires a transducer to convert the stray magnetic field into strain before it can be detected. Terfenol-D, a magnetostrictive alloy, was used for this purpose, where the FBG was bonded onto the alloy with the use of a cyanoacrylate adhesive to transfer the strain movement from the alloy to the FBG, which was then observed as a wavelength shift known as Bragg shift.
Basic FBG Sensing Principle
Light is known to travel in a straight line in air at an approximately constant speed, c = 3 × 10⁸ metre per second. However, when it travels through a medium it bends due to refraction, because air has a different refractive index from the medium through which the light travels. Although the frequency of the light wave does not change, its wavelength changes [18], and the relationships between its speed in air (c), its speed in a different medium (v), the refractive index of the medium (n), its wavelength (λ), and its frequency (f) can be given by:
Snell’s law relates the angle of incidence θ1, the angle of refraction θ2, the refractive indices of the two mediums involved during the light travel n1 and n2, respectively; and the light’s wavelength in both mediums λ1 and λ2 as:
In order for light to be reflected (bounced back, away from the new medium), the angle of incidence must equal the angle of refraction, i.e., θ1 = θ2. The reflection of light at the interface between two different media is commonly known as Fresnel’s reflection effect. According to [18], the refracted angle tends to get smaller than the incident angle, when light is travelling from a fast medium to a slow one (for example, from air to water); whereas, for the converse light movement (water to air), the incident angle tends to get larger, but it cannot exceed 90° while remaining in the new medium. Hence, this incident angle constraint suggests that the largest incident angle for refraction occurs when n2 < n1. However, beyond a certain incident angle, known as the critical angle, θc, there will be no refraction at all, and the light wave will be totally reflected away from the new medium through which the light had been intended to travel, provided n2 < n1 still exists. This is called total internal reflection, and this is the principle utilized by optical fibers [18]. In a typical optical fiber silica cable, the core with a higher refractive index, n1, is surrounded by a cladding whose refractive index, n2, is only about 1% lower than that of the core, in order to satisfy the condition for total internal reflection [18]. For example, the core could have n1 ≈ 1.4475 and the cladding n2 = 1.444, and provided the fiber cable is not excessively bent, the light will just bounce around in the cable, with minimal loss [18]. To obtain a Gaussian spectrum with a center wavelength for the grating, a high-powered laser is used to uniformly vary the refractive index of the core using a phase mask, on which the specific pattern is imprinted. As the light travels through the core, it comes into contact with the gratings, which in turn reflect the light, producing a transmitted spectrum and a reflected spectrum, as shown in Figure 1. The reflected spectrum is eventually used as the FBG sensor reference spectrum, with its center wavelength pre-determined during the phase mask fabrication process. By imposing an external force or disturbance on the FBG, a wavelength shift, proportional to the perturbation applied, is observed [19], as shown in Figure 1. This wavelength shift is called the Bragg shift, and this is the fundamental principle of FBG sensing. Measurands that act as perturbations in FBG sensing include temperature, vibration, pressure, and displacement. However, if FBG are to be used for sensing a magnetic field, they will require a transducer to convert the magnetic flux into one of the aforementioned measurands, in order to be able to cause Bragg shifts. This is mainly because optical fibers are inherently immune to electromagnetic fields; hence the use of terfenol-D in this research, as shown in Figure 2. Prior to carrying out experiments, the effect of the number of bonding points on the metal surface-mounted FBG sensors was investigated and reported in [20], which took account of the impact of the adhesive used.
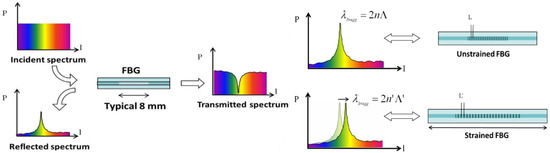
Figure 1.
(a) Light spectrum: incident, transmitted, and reflected; (b) Bragg shift concept [21].
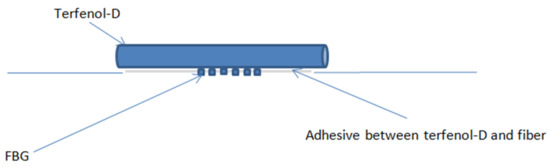
Figure 2.
FBG-T sensor bonding arrangement.
2. Methods
A typical experimental test rig for FBG sensing is shown in Figure 3, whilst the set up used for this work is shown in Figure 4. The FBG-T test rig was set up for both healthy and broken rotors. Each of the motors was used to drive a DC motor as the load, with the FBG-T transversely positioned at the drive end of the induction motor, using the rotor shaft center as a reference. Stray magnetic flux was also measured using an auto datalogging flux meter (HHG1394) manufactured by Omega Engineering UK, in order to acquire numerical data of the flux. The HHG1394 comes with proprietary software and a tri-axial sensing functionality, which makes if suitable for low- and extremely-low-frequency magnetic fields, independent of the measurement angle. The sensor was then connected to the bi-functional broadband light source and optical spectrum analyzer (OSA), which were serially connected to a PC via a National Instrument GPIB cable. This was to allow the use of LabView software (manufactured by National Instruments, TX, USA) to collect and store the numerical spectral data, which could then be retrieved and analyzed in MATLAB. The motor was driven by a variable frequency drive (VFD).
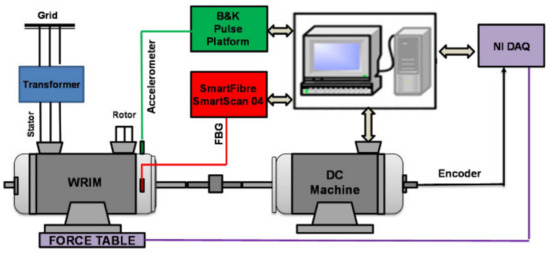
Figure 3.
Typical FBG sensing test rig setup [22].
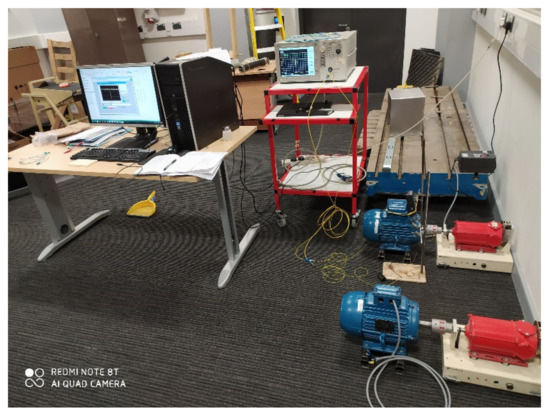
Figure 4.
Actual FBG-T sensing test rig setup.
The step by step procedure of the test rig setup was as summarized in Table 1 below.

Table 1.
Step-by-step procedure for setting up the FBG-T experimental test rig.
Each machine was run at a similar frequency range, between 5 and 30 Hz, with 5 Hz intervals, for more than four hours, after which the motor was then turned off. Prior to running the healthy motor, it was disassembled and observed, to confirm its healthy state, before reassembly. For the broken rotor and short circuit inter-turn conditions, holes were bored to emulate the former, while copper windings were used to bridge turns within the motor to emulate the latter condition, as shown in Figure 5.
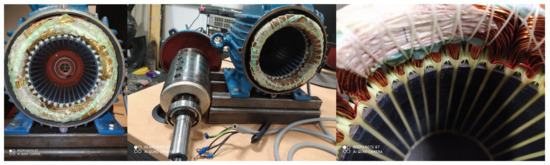
Figure 5.
Healthy, broken rotor, and inter-turn machine conditions respectively prior to assembly.
3. Results and Discussion
Prior to carrying out the experiments, it was imperative to determine where to position the sensor, as well as to calibrate the sensor to determine its sensitivity. Following these two steps, the experiments were performed, running the induction motor at various frequencies under the three main conditions: healthy (normal), damaged broken rotor, and short circuit inter-turn.
3.1. Positioning FBG-T Sensor
Two major factors were taken into consideration in positioning the FBG-T: proximity to the main air gap flux, and the sensor surface area exposed to the external flux. The closest part of the machine to the main air gap flux was the flange coupling at the drive end (DE) of the machine. Hence, this was one of the positions considered. The three possible axes to position the sensor at the DE were: transverse (perpendicular to the rotor shaft), inclined (intermediate between parallel and perpendicular to the rotor shaft), or axial or longitudinal (parallel to the rotor shaft). The second option was very quickly discarded, because magnetic fields are known to be either at their maximum field strength or zero, depending on whether the flux lines are cutting across a surface either perpendicularly or parallel to the surface, respectively. Transverse and longitudinal positions were later empirically tested to identify the optimal sensor position, as shown in Figure 6. The induction machine was run at different frequencies, with the results summarized in Table 2 and Table 3.
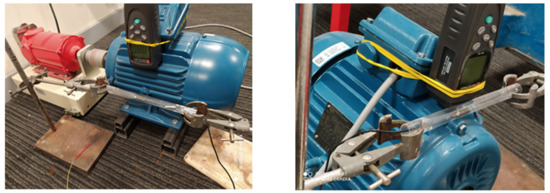
Figure 6.
Longitudinal (left) and transverse (right)-locating optimal positioning of FBG-T sensor for stray magnetic flux monitoring.
Table 2.
Data summary for axial positioning of the FBG-T sensor.
Table 3.
Data summary for transverse positioning of FBG-T sensor.
Given the results of the analyses from both sensor positions, it was apparent that the transverse position offers more consistency in sensor behavior, which is in line with the expectations in the presence and lack of a magnetic field (Figure 7). The axial positioning of the FBG-T was erratic, and given the already inherent hysteresis property of the terfenol-d alloy, the introduction of additional unpredictability would put in doubt the realization of a reliable condition monitoring sensor for machines. It is noteworthy that the transverse sensor positioning needs some resetting each time the sensor is to be re-used, as it may or may not return to the exact initial wavelength. The variation of observable stray flux with frequency for both transverse and axial sensor positions showed that more flux will cut across the sensor when placed in the transverse position at the drive end of the machine compared to the axial position (Figure 7). Although this was attributed to the reduced surface area of the flux-attenuating and corrugated yoke, one could argue that the transverse position is closer to the source of the magnetic flux, which is in the air gap within the machine; since the air gap is between the rotor and the stator, whose windings are wrapped internally close to the flanges of the machine. Given that the stray flux is already mitigated, a reasonable amount is required to cause magnetostriction in the FBG-T sensor. Based on only the optical spectral response (Figure 8), there was no observable difference in terms of sensor position; instead there was evidence that the FBG-T sensor was, indeed, sensing the stray magnetic flux present. From both a behavioral characteristic and observable magnetic flux density viewpoint, the transverse position became the experimental choice and, thus, was utilized throughout the rest of the investigation.
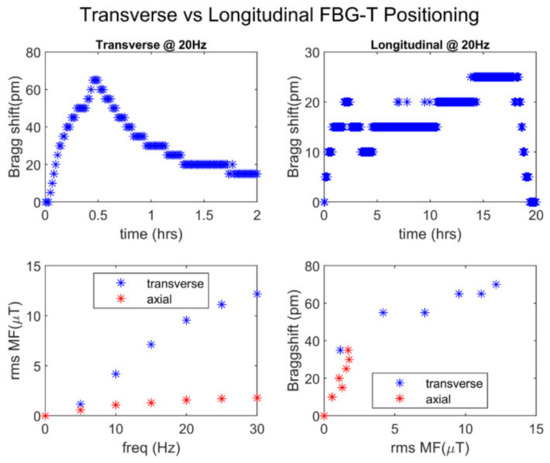
Figure 7.
Comparison between FBG-T sensed parameters when in transverse and axial sensor positions.
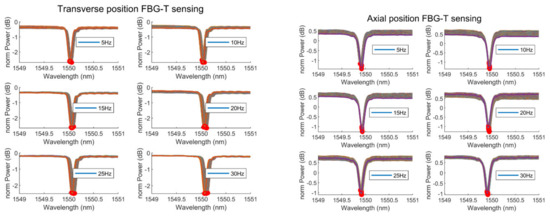
Figure 8.
Comparison between FBG-T sensed parameters when in transverse and axial sensor positions.
3.2. FBG-T Magnetic Flux Calibration
To calibrate the FBG-T sensor, a magnetic field source and a magnetic field sensor were needed. In order to create different magnetic field strengths, a DC power supply unit was used to inject different amounts of current, to excite the windings of an openly-wound 4V DC motor. A tri-axial auto data logger magnetic flux meter was used to measure and record the stray magnetic flux density for each current applied. The complete setup was as shown in Figure 9, where different amounts of current were applied to generate magnetic fields of different strength, measured by the auto-data-logging flux meter. Plots showing the optical spectra and time variation of the Bragg shift for each test current and corresponding magnetic flux density in Figure 10a−c show the directly proportional relationship between the current and the magnetic flux and, as a result, the Bragg shift observed. The optical spectra visibly indicated the increase in the Bragg shift with current, given that the magnetic flux in this case was DC in nature. The unipolar nature of terfenol-D magnetostriction was evident in the time-varying plots of Bragg shift, where there was a steady increase in the Bragg shift with time, until the maximum Bragg shift was attained. The rate at which the Bragg shift occurred for each current value appeared to be faster than the rate observed for earlier tests performed with stray flux, which is sinusoidal in nature. Figure 10d confirms the sensitivity of the FBG-T sensor, which was 19.3810 pm/μT. Temperature was measured to confirm the minimal change in ambience, with a maximum change of about 0.13 °C.
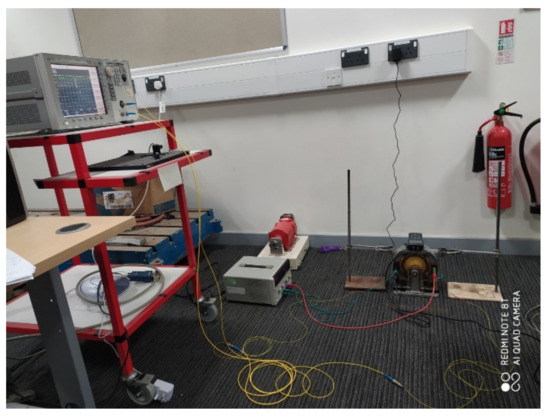
Figure 9.
Magnetic flux FBG-T sensor calibration setup, with an electromagnet, DC power supply unit, and an optical spectrum analyzer.
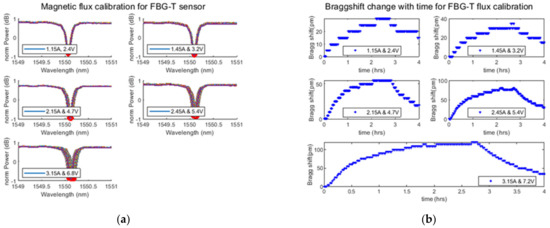
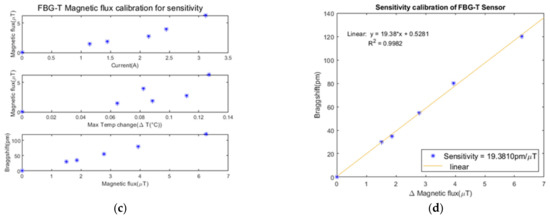
Figure 10.
Magnetic flux FBG-T sensor calibration setup, with an electromagnet, DC power supply unit, and an optical spectrum analyzer. (a) Optical spectral response, (b) Bragg shift variation with time at various currents, (c) Variation in magnetic flux with current, Bragg shift, and temperature, (d) Sensitivity of the FBG-T sensor.
3.3. FBG-T Fault Severity Discrimination
Based on the spectral response alone, only the short circuit inter-turn fault condition showed obvious and excessive Bragg shifts, as shown in Figure 11. The healthy and broken rotor conditions showed Bragg shifts, but it was not possible to precisely distinguish between the two conditions, hence a further analysis of the numerical results obtained was necessary.
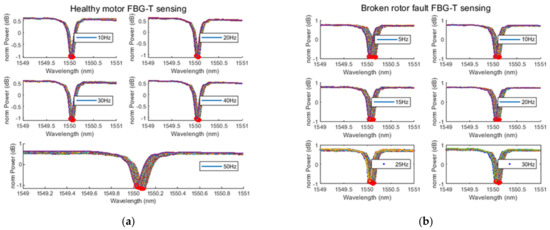

Figure 11.
Optical spectral response of FBG-T sensor, corroborating the significantly large Bragg shifts under the short circuit fault condition (a) compared to the healthy (b) and broken rotor (c) conditions.
In order to analyze the FBG-T performance, and discriminate the fault and identify the fault severity level, Table 4 combines the results from each test condition, while Figure 12 pictorially analyses the results in the table. The FBG-T sensor reliably and accurately detected the different faults, despite the erratic nature of the magnetostrictive element of the sensor. The order of magnitude for each machine condition was different and consistent. The healthy machine and broken rotor conditions both had Bragg shifts in the tens of picometre range; however, the latter had consistently higher values, closer to the hundred mark, compared to the healthy rotor, which has consistently in the mid-hundred range. A slight, but consistent, increase in Bragg shift for the broken rotor compared to the healthy condition was observed across each individual motor frequency. The more severe inter-turn faults had Bragg shifts in a different and higher order of magnitude than both broken rotor and healthy conditions, and could reliably serve as a crucial fault indicator for the operation and maintenance of electric machines. With respect to the magnetic flux densities, there was a general increase in magnitude, with the increase in the effective number of turns contributing to the generation of flux inside the machine. This was in line with theory, as an increase in the number of turns leads to an increase in the generated magnetic flux. Thus, the broken rotor condition was observed to have the lowest magnitudes, since it had the least number of turns compared to the healthy state; whilst the inter-turn condition had more turns than the healthy state, and hence higher magnitudes of stray magnetic flux. The temperature within any machine will also increase with an increase in the number of turns due to I2R losses. As expected, across the different motor frequency ranges, the broken rotor condition, having the lowest number of turns, experienced the least temperature change, with a maximum of just over 0.5 °C, compared to healthy state, which had a maximum temperature change of less than 1.7 °C. The short circuit condition experienced the highest temperature change of just below 7 °C, as expected; however, when compared to the higher temperature values obtained during temperature calibration of the sensor reported in a separate work, this begs the questions: could there be a different factor responsible for such large Bragg shifts, other than temperature? Since the stray magnetic field and temperature were the two dominant factors that could be responsible for Bragg shifts in this experiment, and as their magnitudes have been observed, perhaps then a third factor that remains to be considered is the nature of the magnetic field itself, i.e., its spectral content. The impact of the temperature of the motor on the FBG-T sensor performance reported in a separate work confirmed that, provided the ambient temperature does not change significantly, it should not affect the sensor’s ability to detect various machine conditions.
Table 4.
Comparison of Bragg shift changes with temperature and magnetic flux density at different frequencies.
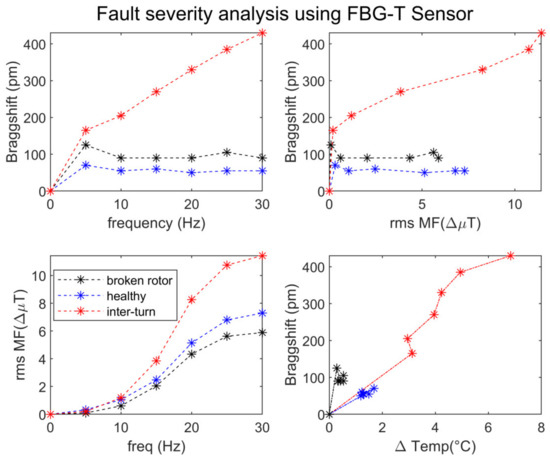
Figure 12.
Variation of magnetic flux, frequency, and maximum temperature with Bragg shifts for fault severity detection (5 Hz interval), with a smaller number of short circuited turns and an operating time of 4 h.
During magnetic flux calibration, it was observed that the FBG-T response to DC magnetic field was straightforward, in that it did not exhibit any further Bragg shift once the field was removed, and it returned to its initial wavelength within minutes. This difference in sensor response was clearly due to the nature of the magnetic flux in this case (AC or DC); therefore, it was justifiable to consider analyzing the frequency content of the AC stray flux, as this was the remaining factor yet to be analyzed, and which could confirm the significant difference in response for the inter-turn fault compared to the broken rotor and healthy conditions. Figure 13 shows the spectral content of the stray magnetic flux at each motor frequency, under healthy, broken rotor, and short circuit conditions.
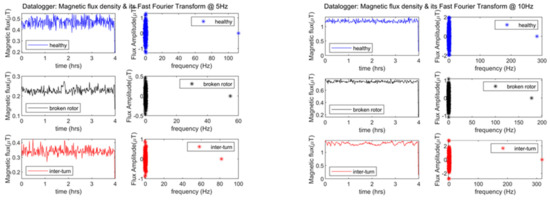
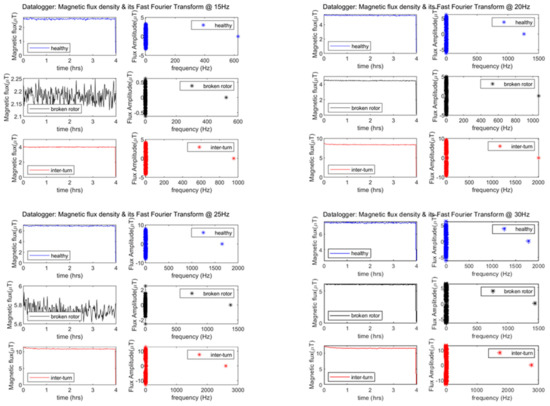
Figure 13.
FFT Spectral analyses of the stray magnetic field at each motor frequency, under various machine conditions.
The FFT on the stray flux revealed a significant difference in spectral content, but also a consistency in these differences. For instance, when the motor was run at odd frequencies (5, 15, and 25 Hz), the stray flux under the broken rotor condition consistently showed a significant variation in its time varying amplitude, compared to the variations observed when the motor was run at even frequencies (10, 20, and 30 Hz). This behavior may have been due to the forced vibration characteristics of the motor at odd frequencies compared to even frequencies, which would require vibration analysis, which is beyond the scope of this work. Despite this observation, there is no evidence that this time varying amplitude characteristic influenced the FBG-T sensor’s capability to distinguish between the machine conditions. The harmonic spectrum of the stray magnetic flux further revealed that, as the motor was run at a higher frequency, the bandwidth of its frequency spectrum increased. For each motor frequency, there appeared to be a specific harmonic component that was unique compared to the other harmonic components, and this unique frequency was different for each motor condition, even at the same operating frequency. For instance, at 20 Hz the unique harmonic component for the healthy condition was 1300 Hz, whereas for the broken rotor and inter-turn conditions, the unique harmonic components were 1050 Hz and 2000 Hz, respectively. At 30 Hz, the unique harmonic component for the healthy, broken rotor, and inter-turn conditions were 1800 Hz, 1450 Hz, and 2700 Hz, respectively. Although the unique harmonic component varied under the different machine conditions, there was consistency in the pattern of such variations across each of the overall motor operating frequency ranges. It was observed that the unique harmonic components for the healthy condition were always higher than the corresponding values for the broken rotor condition, while the highest values of harmonic components were consistently observed to be under the inter-turn short circuit condition. The only exception to this observation was at 5 Hz, where the unique harmonic component was highest for the healthy condition, followed by the inter-turn and then the broken rotor conditions.
This is particularly significant, as it helps to explain the unusually high Bragg shift observed at 5 Hz, despite the magnetic flux density amplitude and maximum temperature change still being within the expected ranges of 0.468905 μT and 0.5340 °C, respectively. For the healthy motor condition with such values, the expected Bragg shift based on the other observed responses should be in the mid-50s or lower, but unusually, a 70 pm Bragg shift was observed, without any corresponding increase in the magnetic flux amplitude or temperature change. There is clear evidence that the unique harmonic component plays a role, in addition to amplitude of the stray magnetic flux, in explaining the magnetostrictive behavior of the terfenol-D, which, thus, explains the very large Bragg shifts for the inter-turn fault condition, in addition to the effects of the higher amplitude of magnetic flux and temperature changes.
Across all three machine conditions, the FBG-T consistently exhibited reversible magnetization, where in the presence of the stray magnetic flux, the sensor continued to increase in Bragg shift, until it attained the maximum Bragg shift for each frequency. This was the new state of equilibrium of the magnetic dipoles of the terfenol-D. Once the motor was turned off, and the stray flux was no longer present, the magnetic dipoles lost their magnetism, because the weak nature of the stray flux was not sufficient to cause a permanent remanence. As a result, the terfenol-D appeared to be returning back to its original length, which was translated into the FBG-T return path, towards it initial wavelength. However, due to the hysteresis nature of terfenol-D, it did not return to exactly its original length, but assumed a new wavelength close to its original wavelength, as shown in Figure 14.
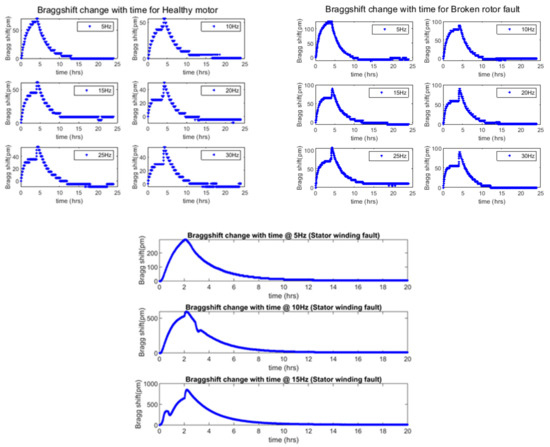
Figure 14.
Time varying Bragg shift response of FBG-T sensor under healthy, broken rotor, and inter-turn fault conditions, at different individual frequencies, with 5-Hz step interval.
4. Conclusions
This research investigated a novel proof-of-concept of the use of stray flux and FBG-T to non-intrusively monitor and detect various machine conditions. FBG alone, as well as FBG-T, are increasingly being researched for use in the field of electrical machines, for real-time condition monitoring; however, hitherto, this has been invasive, requiring the machine to be shut down and disassembled, in order to insert the FBG sensors or replace them. Given the very brittle nature of optical fibers, although nascent, the practice of intrusive condition monitoring appears to be non-optimal; especially when looking ahead to the reliance of mankind on these electric machines as an alternative to fossil fuels. The repeated and reproduced results provide sufficient evidence that the FBG-T sensor responds to the presence of stray flux and, despite its micro-tesla range, the optical fiber utilized its wavelength (nm) range to reliably detect micro-strains during magnetostriction. Different machine conditions were investigated: healthy (reference), less severely broken rotor, more severely broken rotor, and stator winding inter-turn short circuit conditions. The FBG-T sensor was successful for detecting the broken rotor and short circuit fault conditions, with the latter showing extreme reliability and accuracy compared to the former, both spectrally prior to analyses, and post-signal processing. It is important to mention that there was no degradation of the sensor characteristics during the two years of installation, and testing was repeatedly carried out. The results show that the amplitude of the stray flux did not directly translate into the Bragg shift observed, as expected in theory, but the spectral nature or harmonic content of the stray flux impacted on the magnetostrictive behavior of the magnetic dipoles within the terfenol-D, which caused them to micro-strain to a certain length for an equivalent optical wavelength shift. The FFT performed on the stray flux obtained using an auto-data-logger corroborated this observation. A difficulty with this work was the unavailability of finite element models (FEM) for the FBG-T sensor, as there has been very little work done in this area, and only experimental research has been carried out, even for intrusive monitoring.
Author Contributions
Conceptualization, B.P.A., B.J. and W.C.; methodology, B.P.A., B.J. and W.C.; software, B.P.A.; validation, B.P.A., B.J. and W.C.; formal analysis, B.P.A., B.J. and W.C.; investigation, B.P.A., B.J. and W.C.; resources, B.P.A., B.J. and W.C.; data curation, B.P.A. and B.J. Writing—original draft preparation, B.P.A.; writing—review and editing, B.P.A., B.J. and W.C.; visualization, B.P.A., B.J. and W.C.; supervision, B.J. and W.C.; project administration, B.P.A., B.J. and W.C.; funding acquisition, B.J. and W.C. All authors have read and agreed to the published version of the manuscript.
Funding
This research received no external funding.
Institutional Review Board Statement
Not applicable.
Informed Consent Statement
Not applicable.
Data Availability Statement
The data presented in this study are available on request from the corresponding author.
Conflicts of Interest
The authors declare no conflict of interest.
References
- Zamudio-Ramirez, I.; Osornio-Rios, R.A.A.; Antonino-Daviu, J.A.; Razik, H.; Romero-Troncoso, R.D.J. Magnetic Flux Analysis for the Condition Monitoring of Electric Machines: A Review. IEEE Trans. Ind. Inform. 2021, 1. [Google Scholar] [CrossRef]
- Rosolem, J.B.; Penze, R.S.; Floridia, C.; Bassan, F.R.; Peres, R.; da Costa, E.F.; Silva, A.D.A.; Coral, A.D.; Junior, J.R.N.; Vasconcelos, D.; et al. Dynamic Effects of Temperature on FBG Pressure Sensors Used in Combustion Engines. IEEE Sens. J. 2020, 21, 3020–3027. [Google Scholar] [CrossRef]
- Rente, B.; Fabian, M.; Vidakovic, M.; Sunarho, J.; Bustamante, H.; Sun, T.; Grattan, K.T.V. A Fiber Bragg Grating (FBG)-Based Sensor System for Anaerobic Biodigester Humidity Monitoring. IEEE Sens. J. 2021, 21, 1540–1547. [Google Scholar] [CrossRef]
- Kumar, J.; Singh, G.; Saxena, M.K.; Prakash, O.; Dixit, S.K.; Nakhe, S.V. Development and Studies on FBG Temperature Sensor for Applications in Nuclear Fuel Cycle Facilities. IEEE Sens. J. 2021, 21, 7613–7619. [Google Scholar] [CrossRef]
- Li, H.; Xu, G.; Gui, X.; Liang, L.; Li, Z. An FBG Displacement Sensor in Deformation Monitoring of Subway Floating Slab. IEEE Sens. J. 2020, 21, 2963–2971. [Google Scholar] [CrossRef]
- Sefati, S.; Hegeman, R.; Alambeigi, F.; Iordachita, I.; Kazanzides, P.; Khanuja, H.; Taylor, R.H.; Armand, M. A Surgical Robotic System for Treatment of Pelvic Osteolysis Using an FBG-Equipped Continuum Manipulator and Flexible Instruments. IEEE/ASME Trans. Mechatron. 2021, 26, 369–380. [Google Scholar] [CrossRef] [PubMed]
- Shi, C.; Tang, Z.; Wang, S. Design and Experimental Validation of a Fiber Bragg Grating-Enabled Force Sensor with an Ortho-Planar Spring-Based Flexure for Surgical Needle Insertion. IEEE Trans. Med. Robot. Bionics 2021, 3, 362–371. [Google Scholar] [CrossRef]
- Zhang, T.; Chen, B.; Zuo, S. A Novel 3-DOF Force Sensing Microneedle with Integrated Fiber Bragg Grating for Microsurgery. IEEE Trans. Ind. Electron. 2021, 69, 940–949. [Google Scholar] [CrossRef]
- Ebrahimi, A.; Urias, M.G.; Patel, N.; Taylor, R.H.; Gehlbach, P.; Iordachita, I. Adaptive Control Improves Sclera Force Safety in Robot-Assisted Eye Surgery: A Clinical Study. IEEE Trans. Biomed. Eng. 2021, 68, 3356–3365. [Google Scholar] [CrossRef] [PubMed]
- De Tommasi, F.; Massaroni, C.; Carnevale, A.; Presti, D.L.; De Vita, E.; Iadicicco, A.; Faiella, E.; Grasso, R.F.; Longo, U.G.; Campopiano, S.; et al. Fiber Bragg Grating Sensors for Temperature Monitoring During Thermal Ablation Procedure: Experimental Assessment of Artefact Caused by Respiratory Movements. IEEE Sens. J. 2021, 21, 13342–13349. [Google Scholar] [CrossRef]
- Peng, J.; Jia, S.; Yu, H.; Kang, X.; Yang, S.; Xu, S. Design and Experiment of FBG Sensors for Temperature Monitoring on External Electrode of Lithium-Ion Batteries. IEEE Sens. J. 2021, 21, 4628–4634. [Google Scholar] [CrossRef]
- Rente, B.; Fabian, M.; Vidakovic, M.; Liu, X.; Li, X.; Li, K.; Sun, T.; Grattan, K.T.V. Lithium-Ion Battery State-of-Charge Estimator Based on FBG-Based Strain Sensor and Employing Machine Learning. IEEE Sens. J. 2021, 21, 1453–1460. [Google Scholar] [CrossRef]
- Zou, H.; Lu, M. Developing High-Frequency Fiber Bragg Grating Acceleration Sensors to Monitor Transmission Line Galloping. IEEE Access 2021, 9, 30893–30897. [Google Scholar] [CrossRef]
- Badar, M.; Lu, P.; Wang, Q.; Boyer, T.; Chen, K.P.; Ohodnicki, P.R. Real-Time Optical Fiber-Based Distributed Temperature Monitoring of Insulation Oil-Immersed Commercial Distribution Power Transformer. IEEE Sens. J. 2021, 21, 3013–3019. [Google Scholar] [CrossRef]
- Sarkar, S.; Inupakutika, D.; Banerjee, M.; Tarhani, M.; Shadaram, M. Machine Learning Methods for Discriminating Strain and Temperature Effects on FBG-Based Sensors. IEEE Photon. Technol. Lett. 2021, 33, 876–879. [Google Scholar] [CrossRef]
- Perikala, M.; Pathi, V.V.L.; Rajan, L.S.; Pandey, P.C. Cantilever Supported Fiber Bragg Grating Flow Sensor for Space Applications. IEEE Sens. J. 2021, 21, 2651–2657. [Google Scholar] [CrossRef]
- Wang, Y.-L.; Tu, Y.; Tu, S.-T. Development of Highly-Sensitive and Reliable Fiber Bragg Grating Temperature Sensors With Gradient Metallic Coatings for Cryogenic Temperature Applications. IEEE Sens. J. 2021, 21, 4652–4663. [Google Scholar] [CrossRef]
- Schwartz, M. Refraction and Reflection, Lecture Note. Available online: https://scholar.harvard.edu/files/schwartz/files/lecture15-refraction.pdf (accessed on 10 October 2021).
- Marcelo, M.; Regina, C.S.B.; Allil, B.A.; de Nazar, F.V.B. A Guide to Fiber Bragg Grating Sensors. In Current Trends in Short- and Long-period Fiber Gratings; InTech: London, UK, 2013. [Google Scholar]
- Alalibo, B.P.; Cao, W.-P.; Gbadebo, A.; Aarniovuori, L.; Cai, K. Investigation of the effect of bonding points on metal surface-mounted FBG sensors for electric machines. Prog. Electromagn. Res. C 2019, 97, 255–265. [Google Scholar] [CrossRef][Green Version]
- FBGS Technologies. FBG Principle. Available online: http://www.fbgs.com/technology/fbg-principle/ (accessed on 28 November 2017).
- Mohammed, A.; Sarma, N.; Djurovic, S. Fibre optic monitoring of induction machine frame strain as a diagnostic tool. IEEE IEMDC 2017, 1–7. [Google Scholar] [CrossRef]


Publisher’s Note: MDPI stays neutral with regard to jurisdictional claims in published maps and institutional affiliations. |
© 2022 by the authors. Licensee MDPI, Basel, Switzerland. This article is an open access article distributed under the terms and conditions of the Creative Commons Attribution (CC BY) license (https://creativecommons.org/licenses/by/4.0/).