


Estimates of the Decarbonization Potential of Alternative Fuels for Shipping as a Function of Vessel Type, Cargo, and Voyage


Abstract
:
1. Introduction
2. Methods
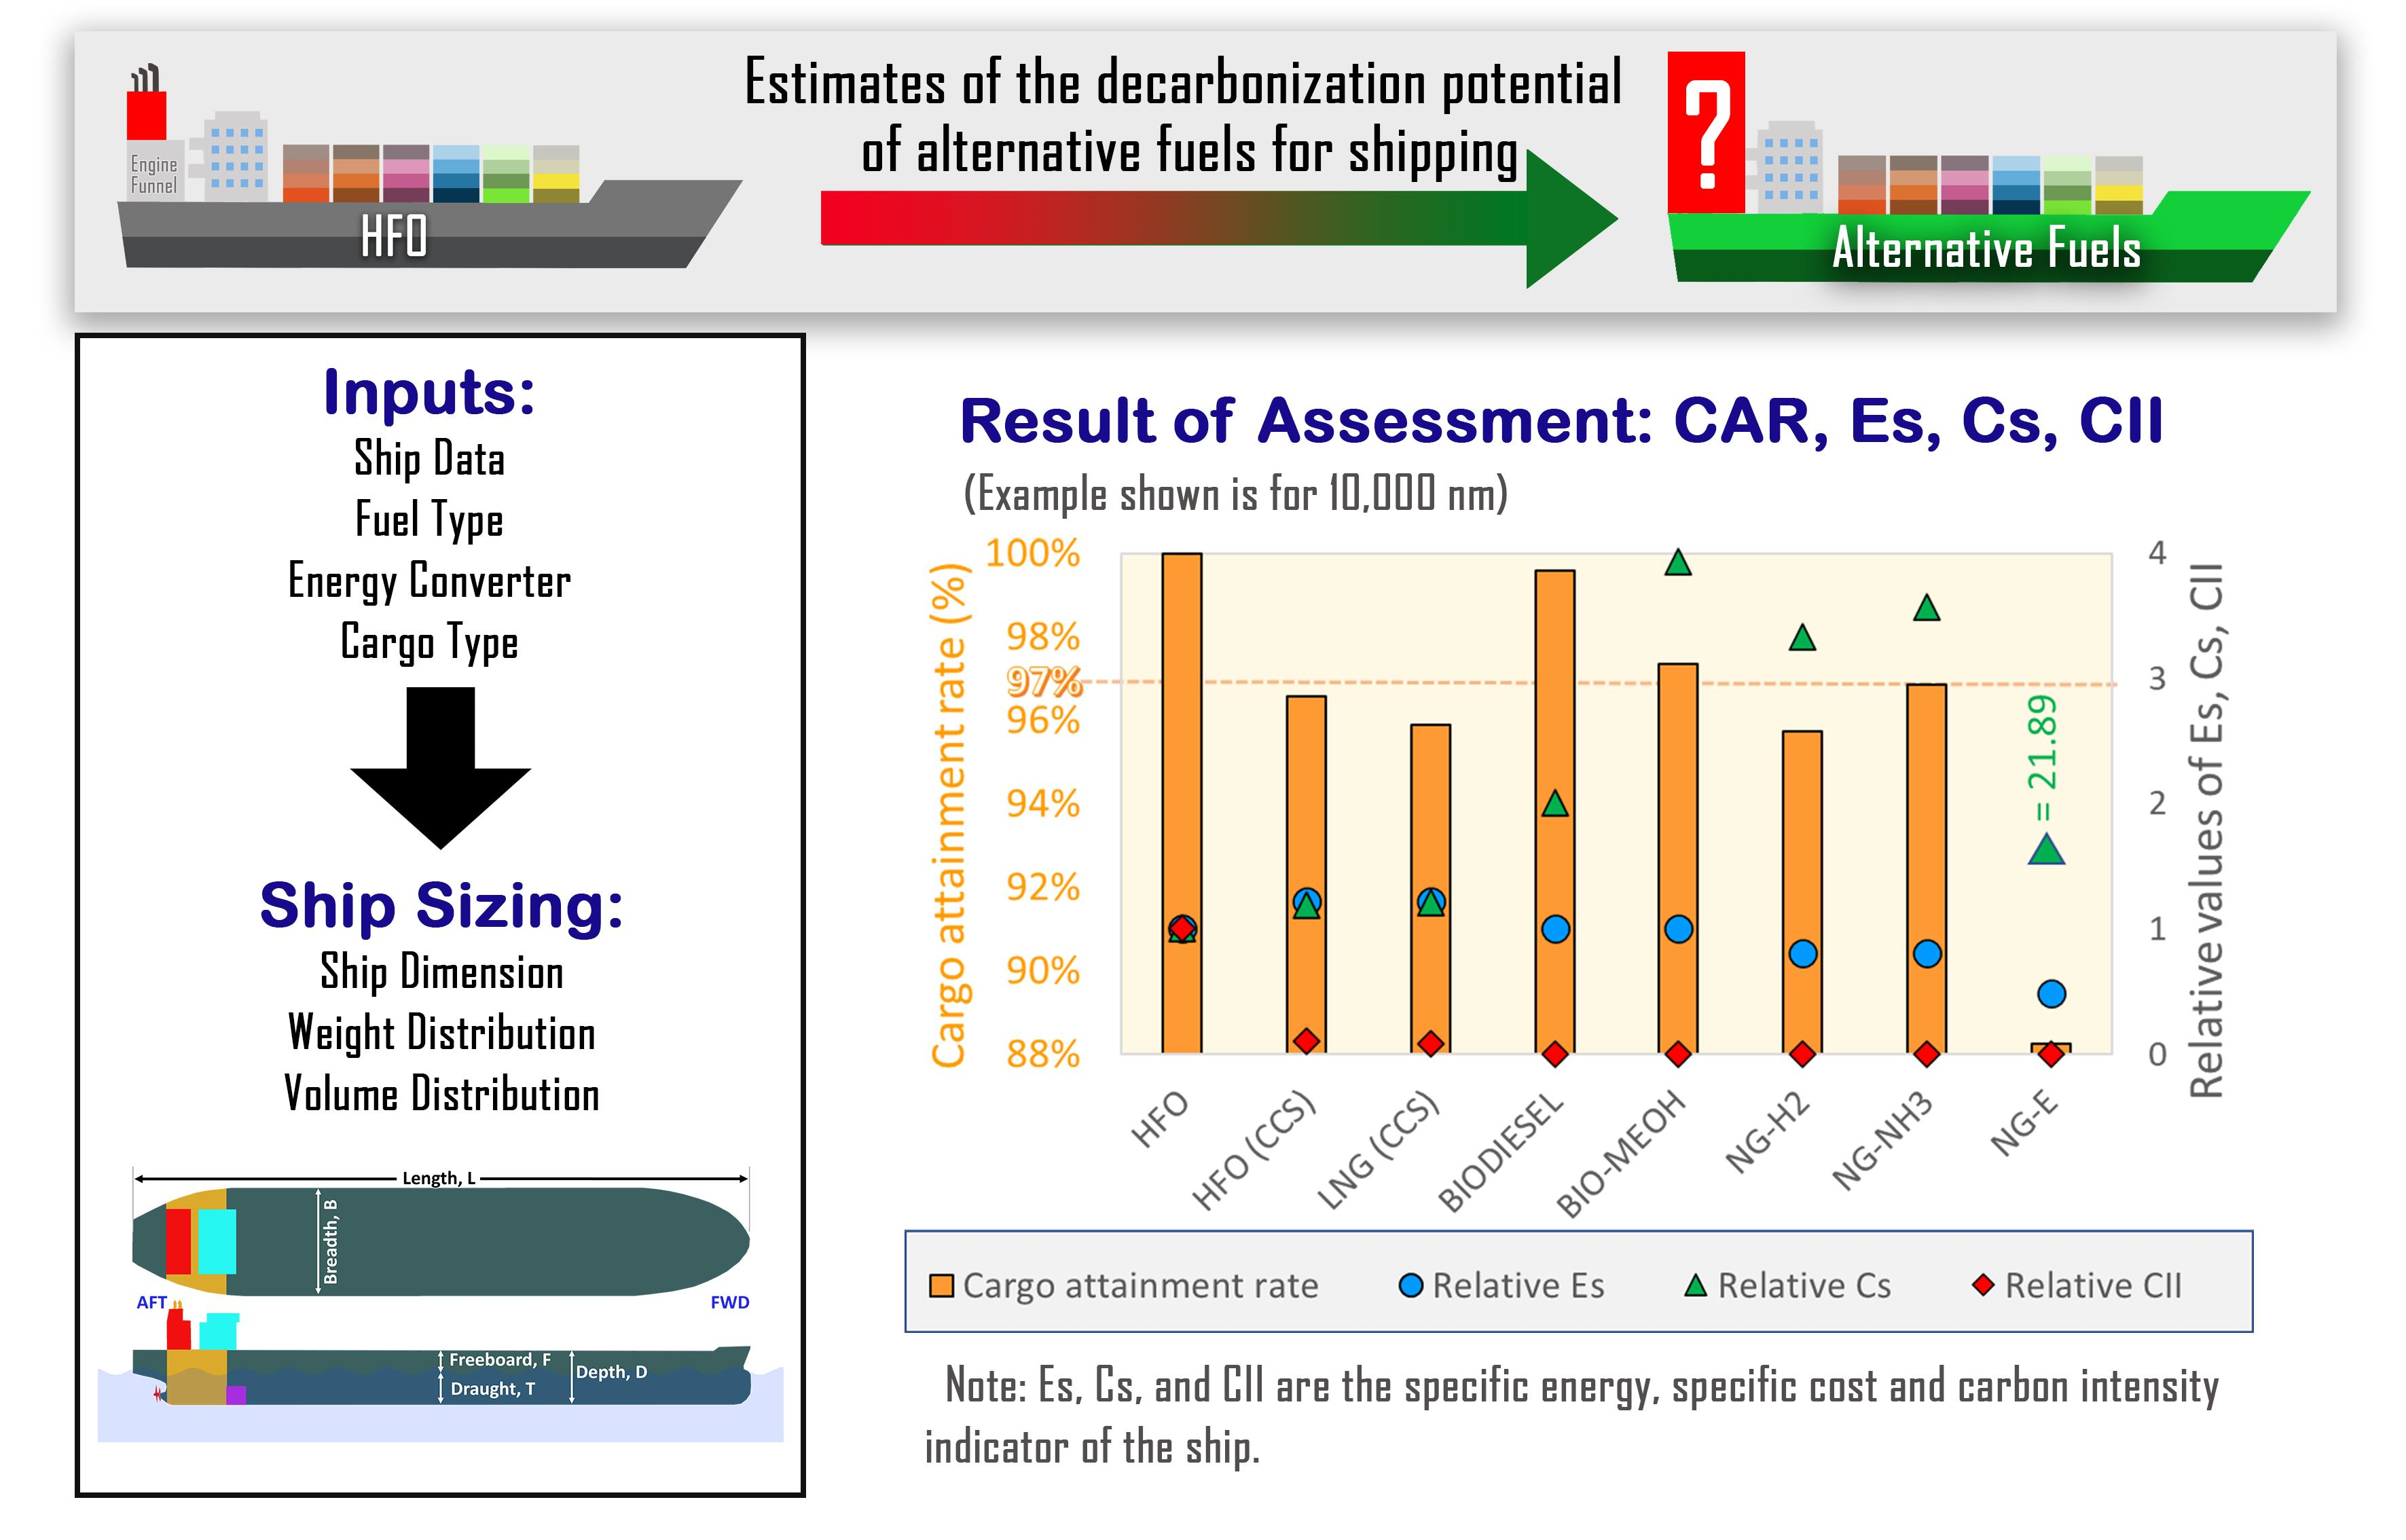
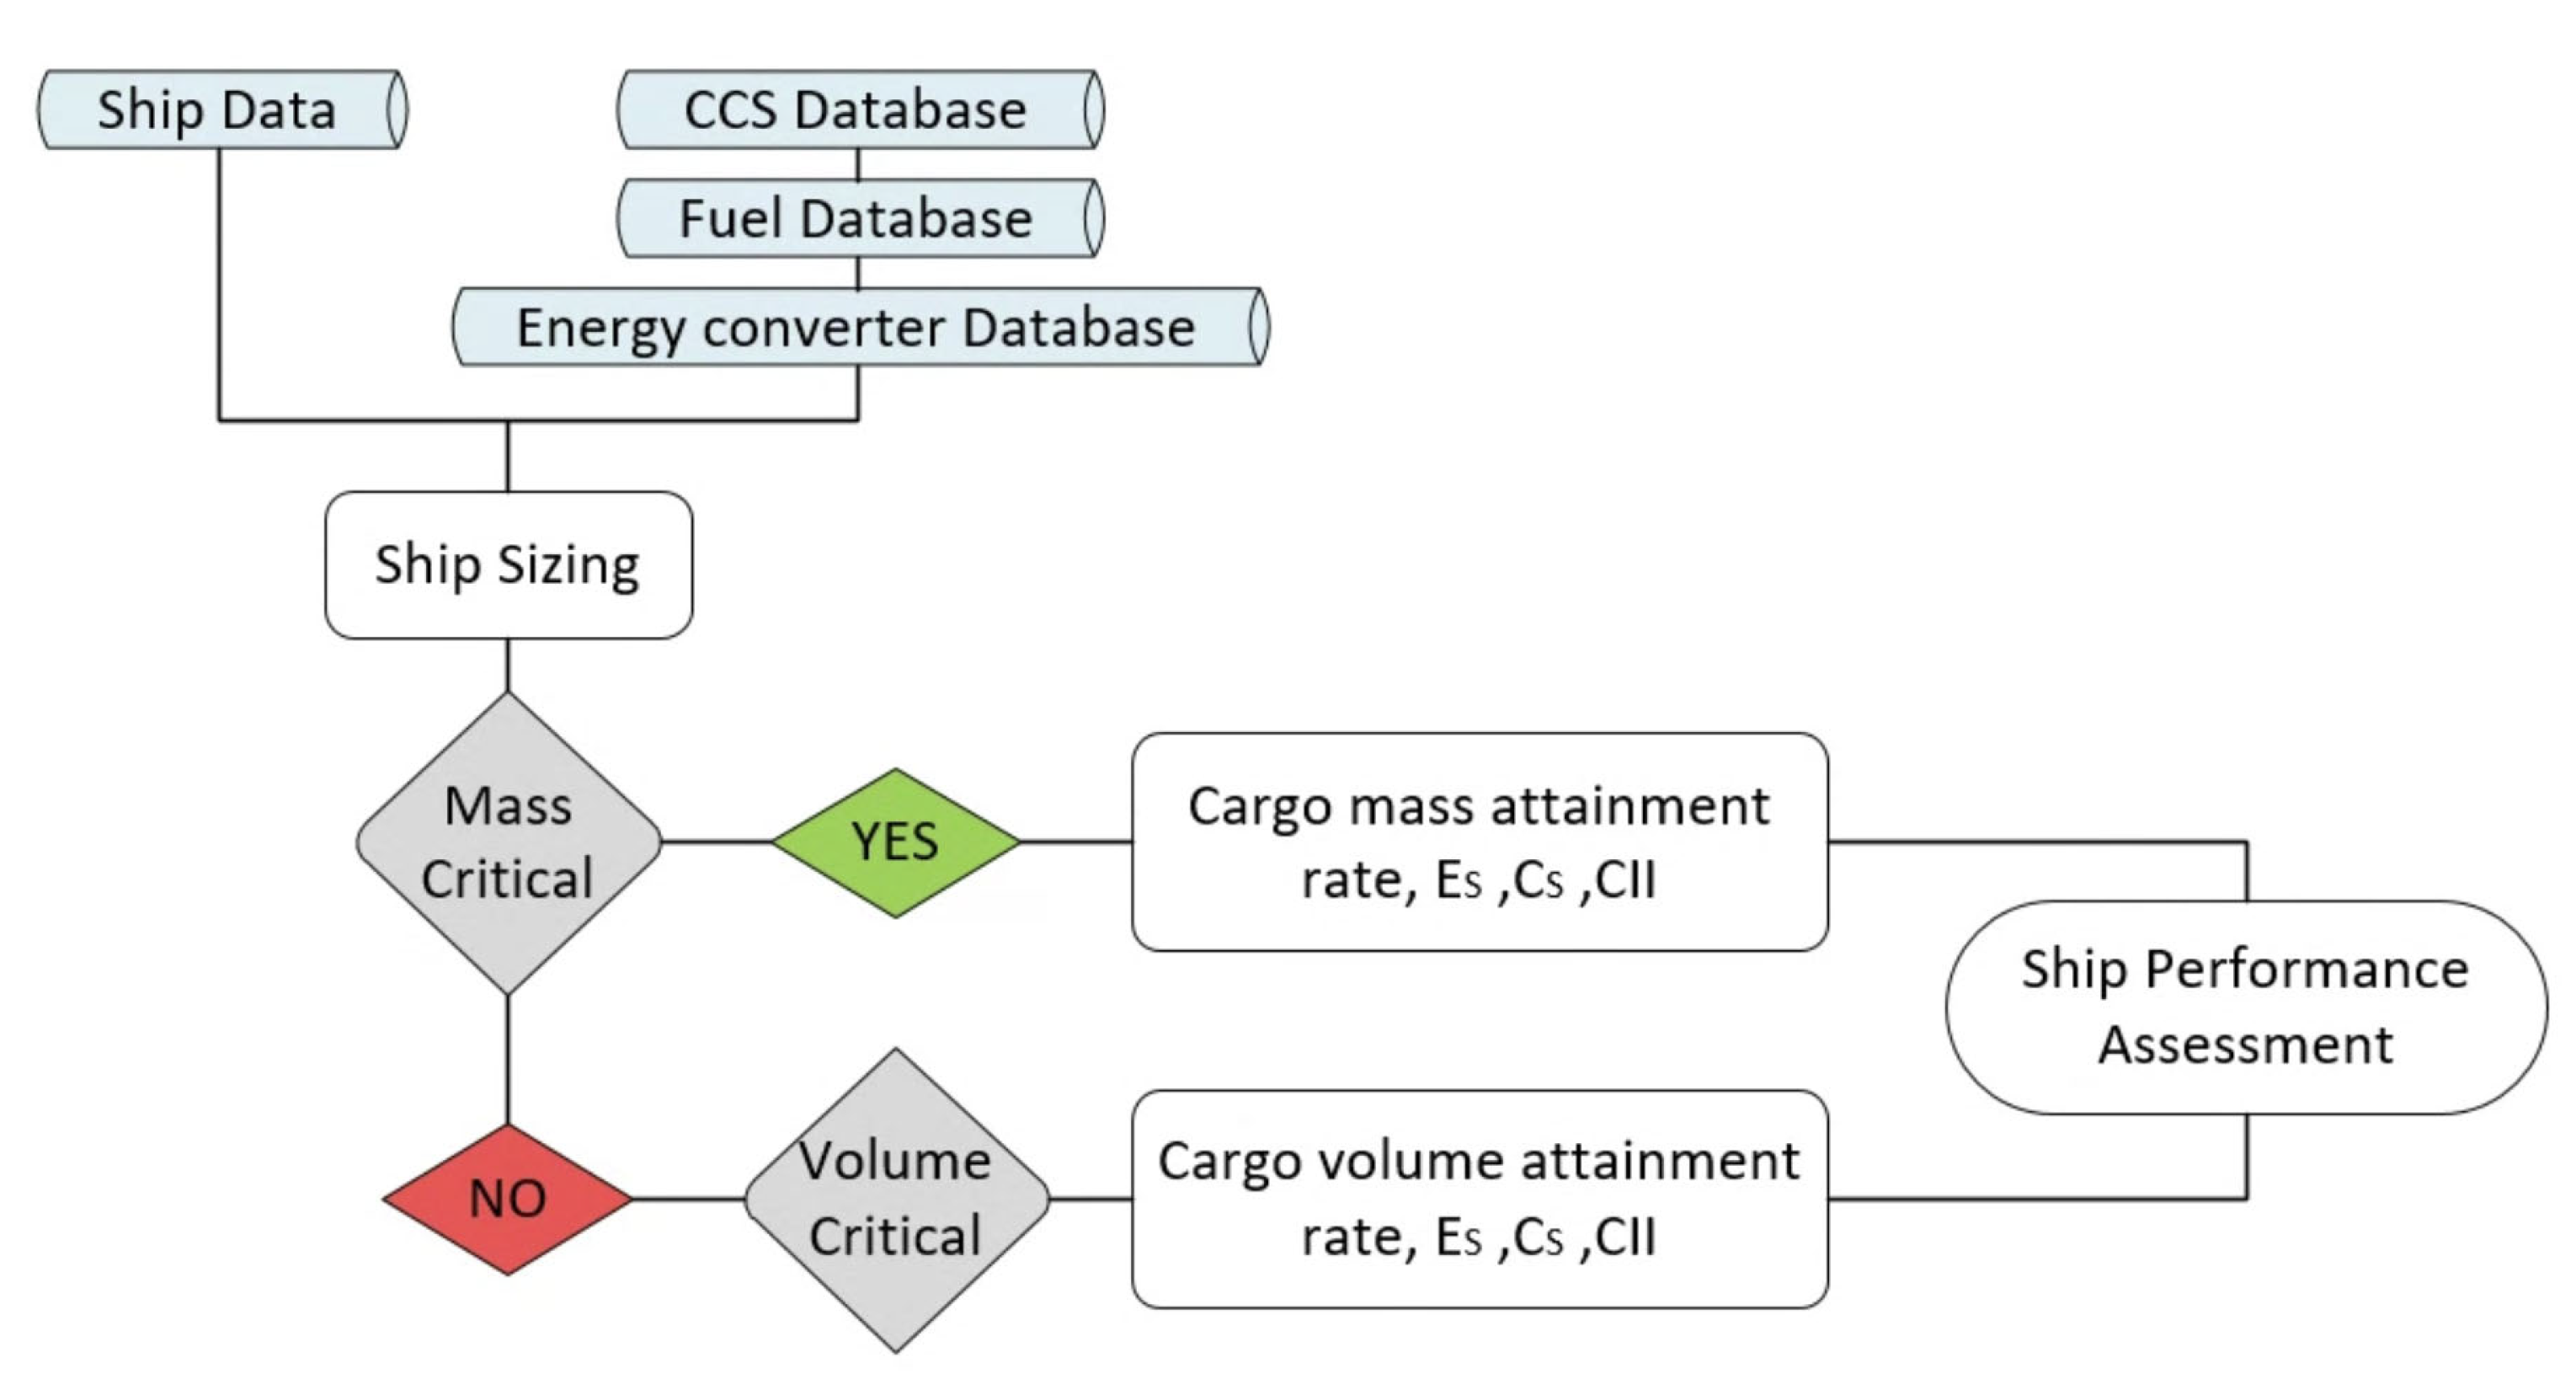
2.1. Reference Ship and Performance Indices
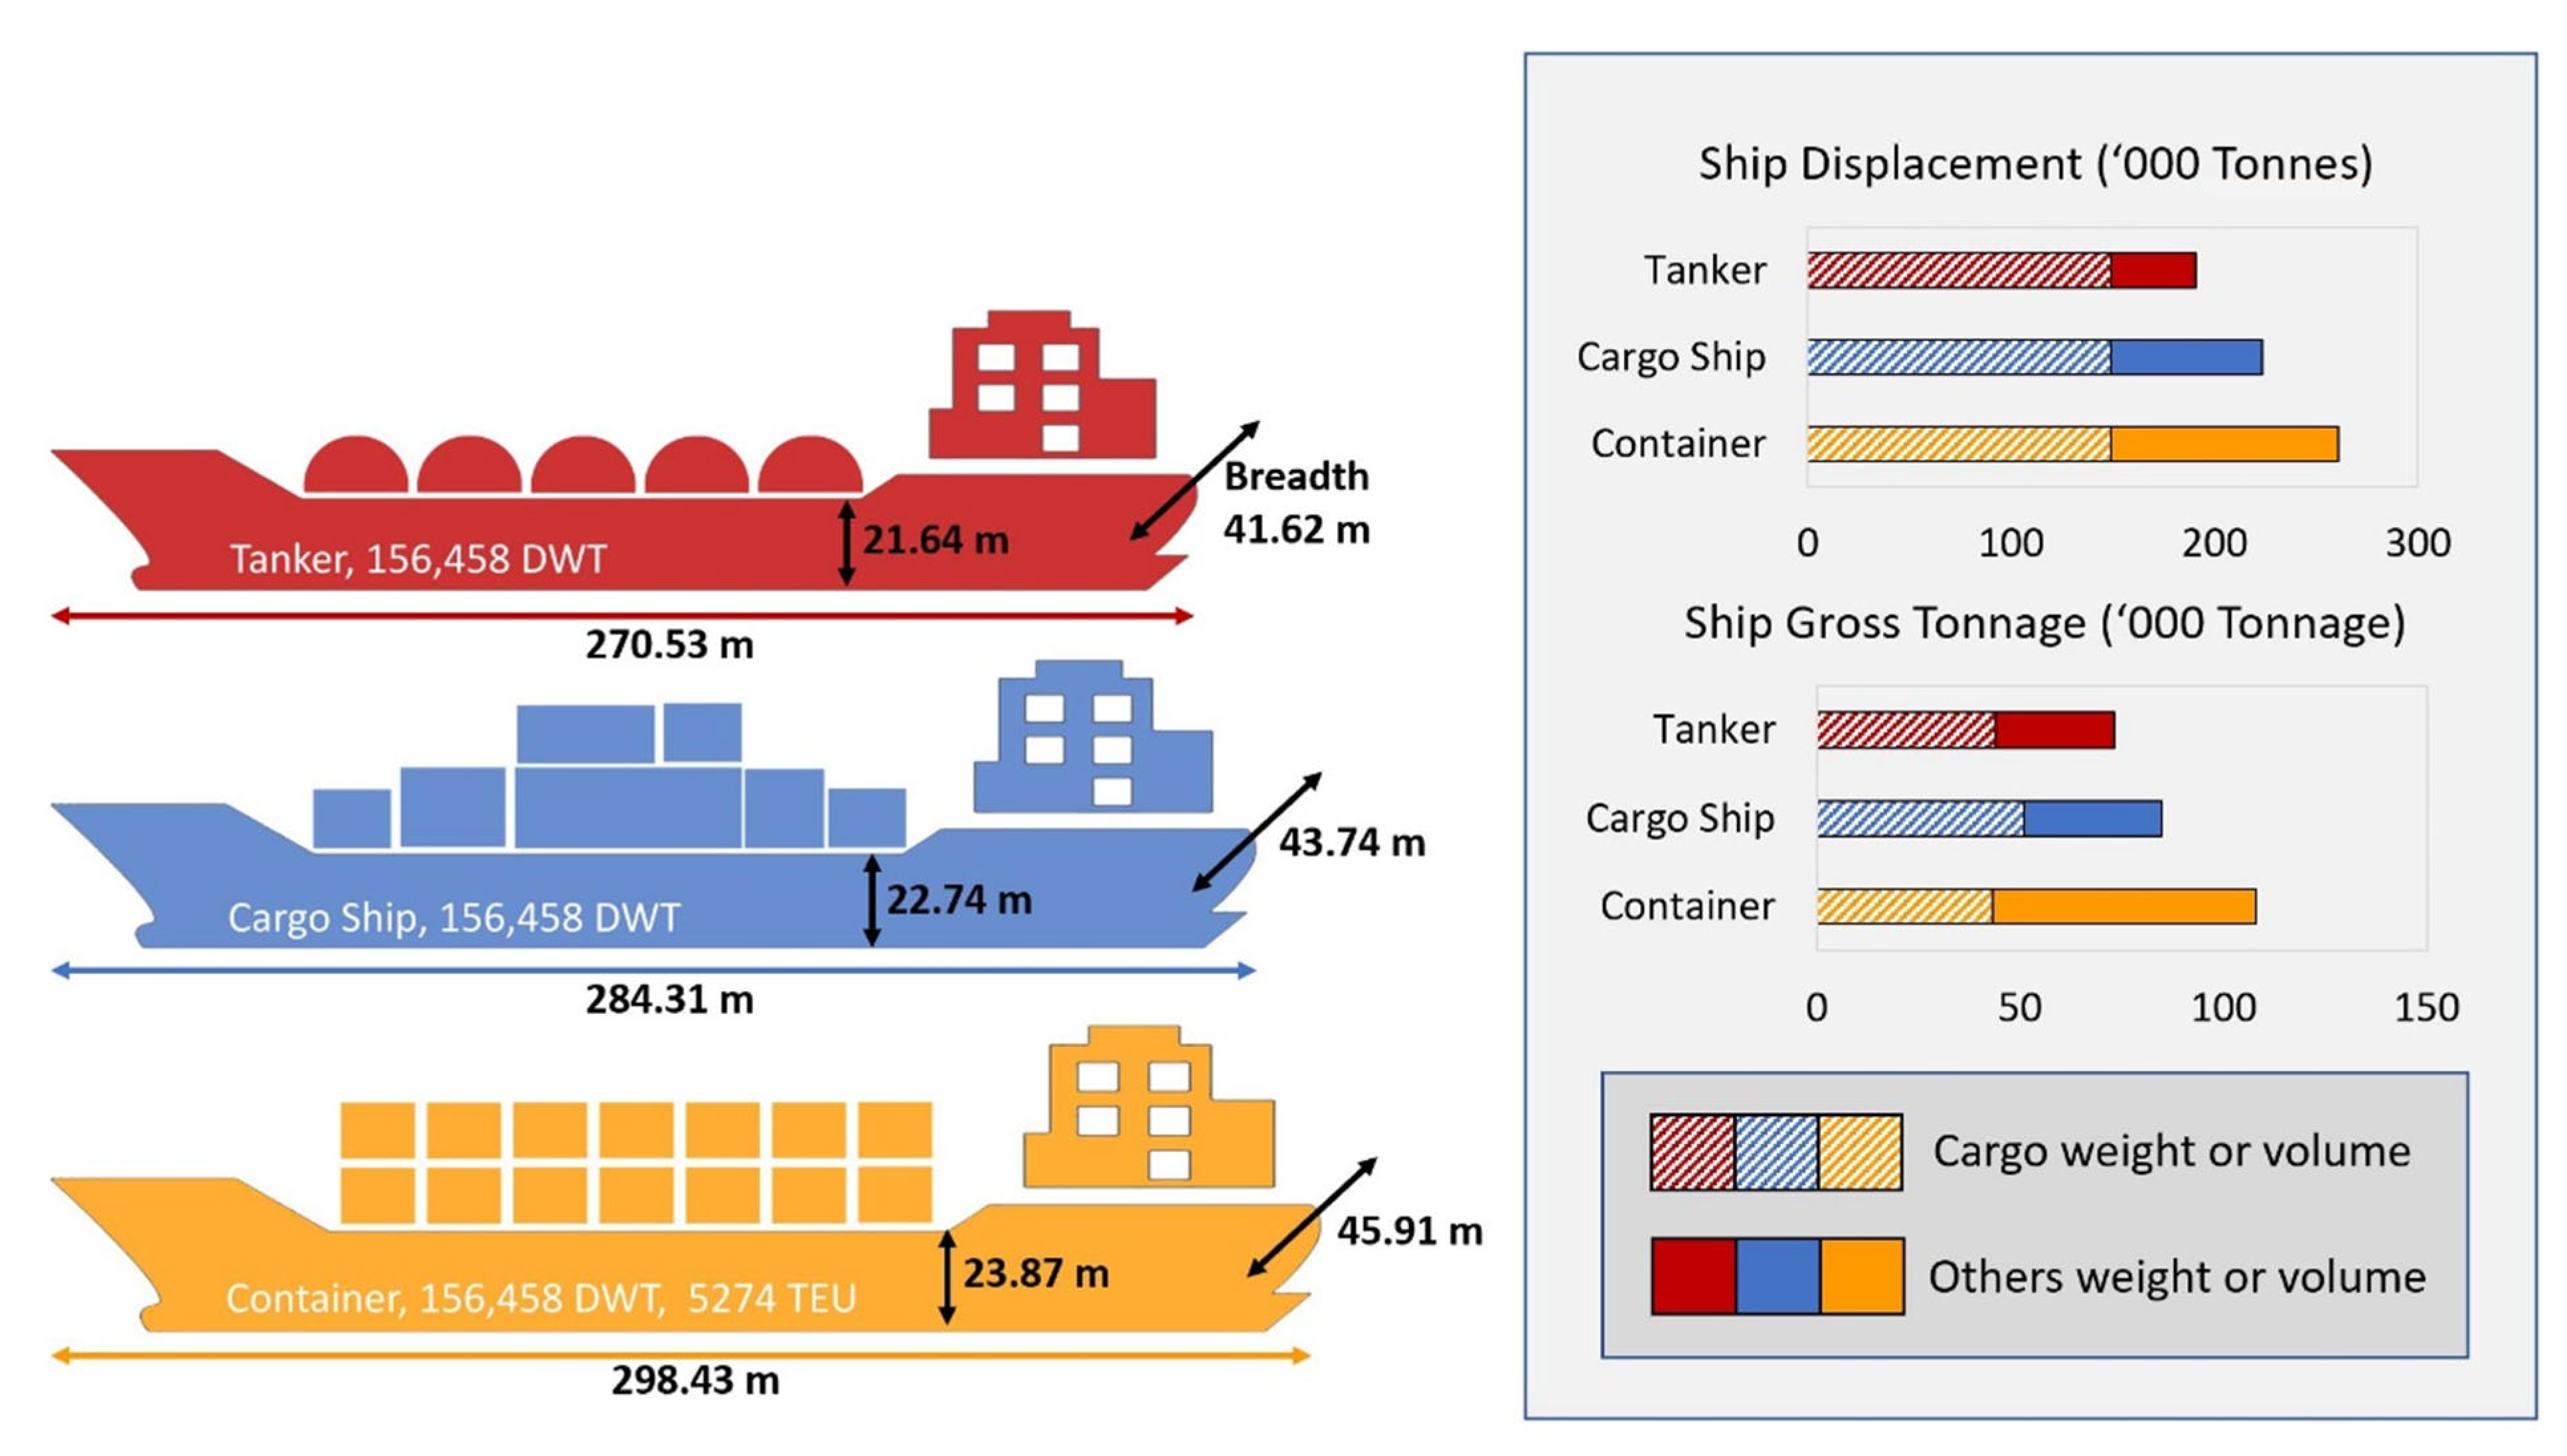
2.2. Ship Type
2.3. Fuel Type
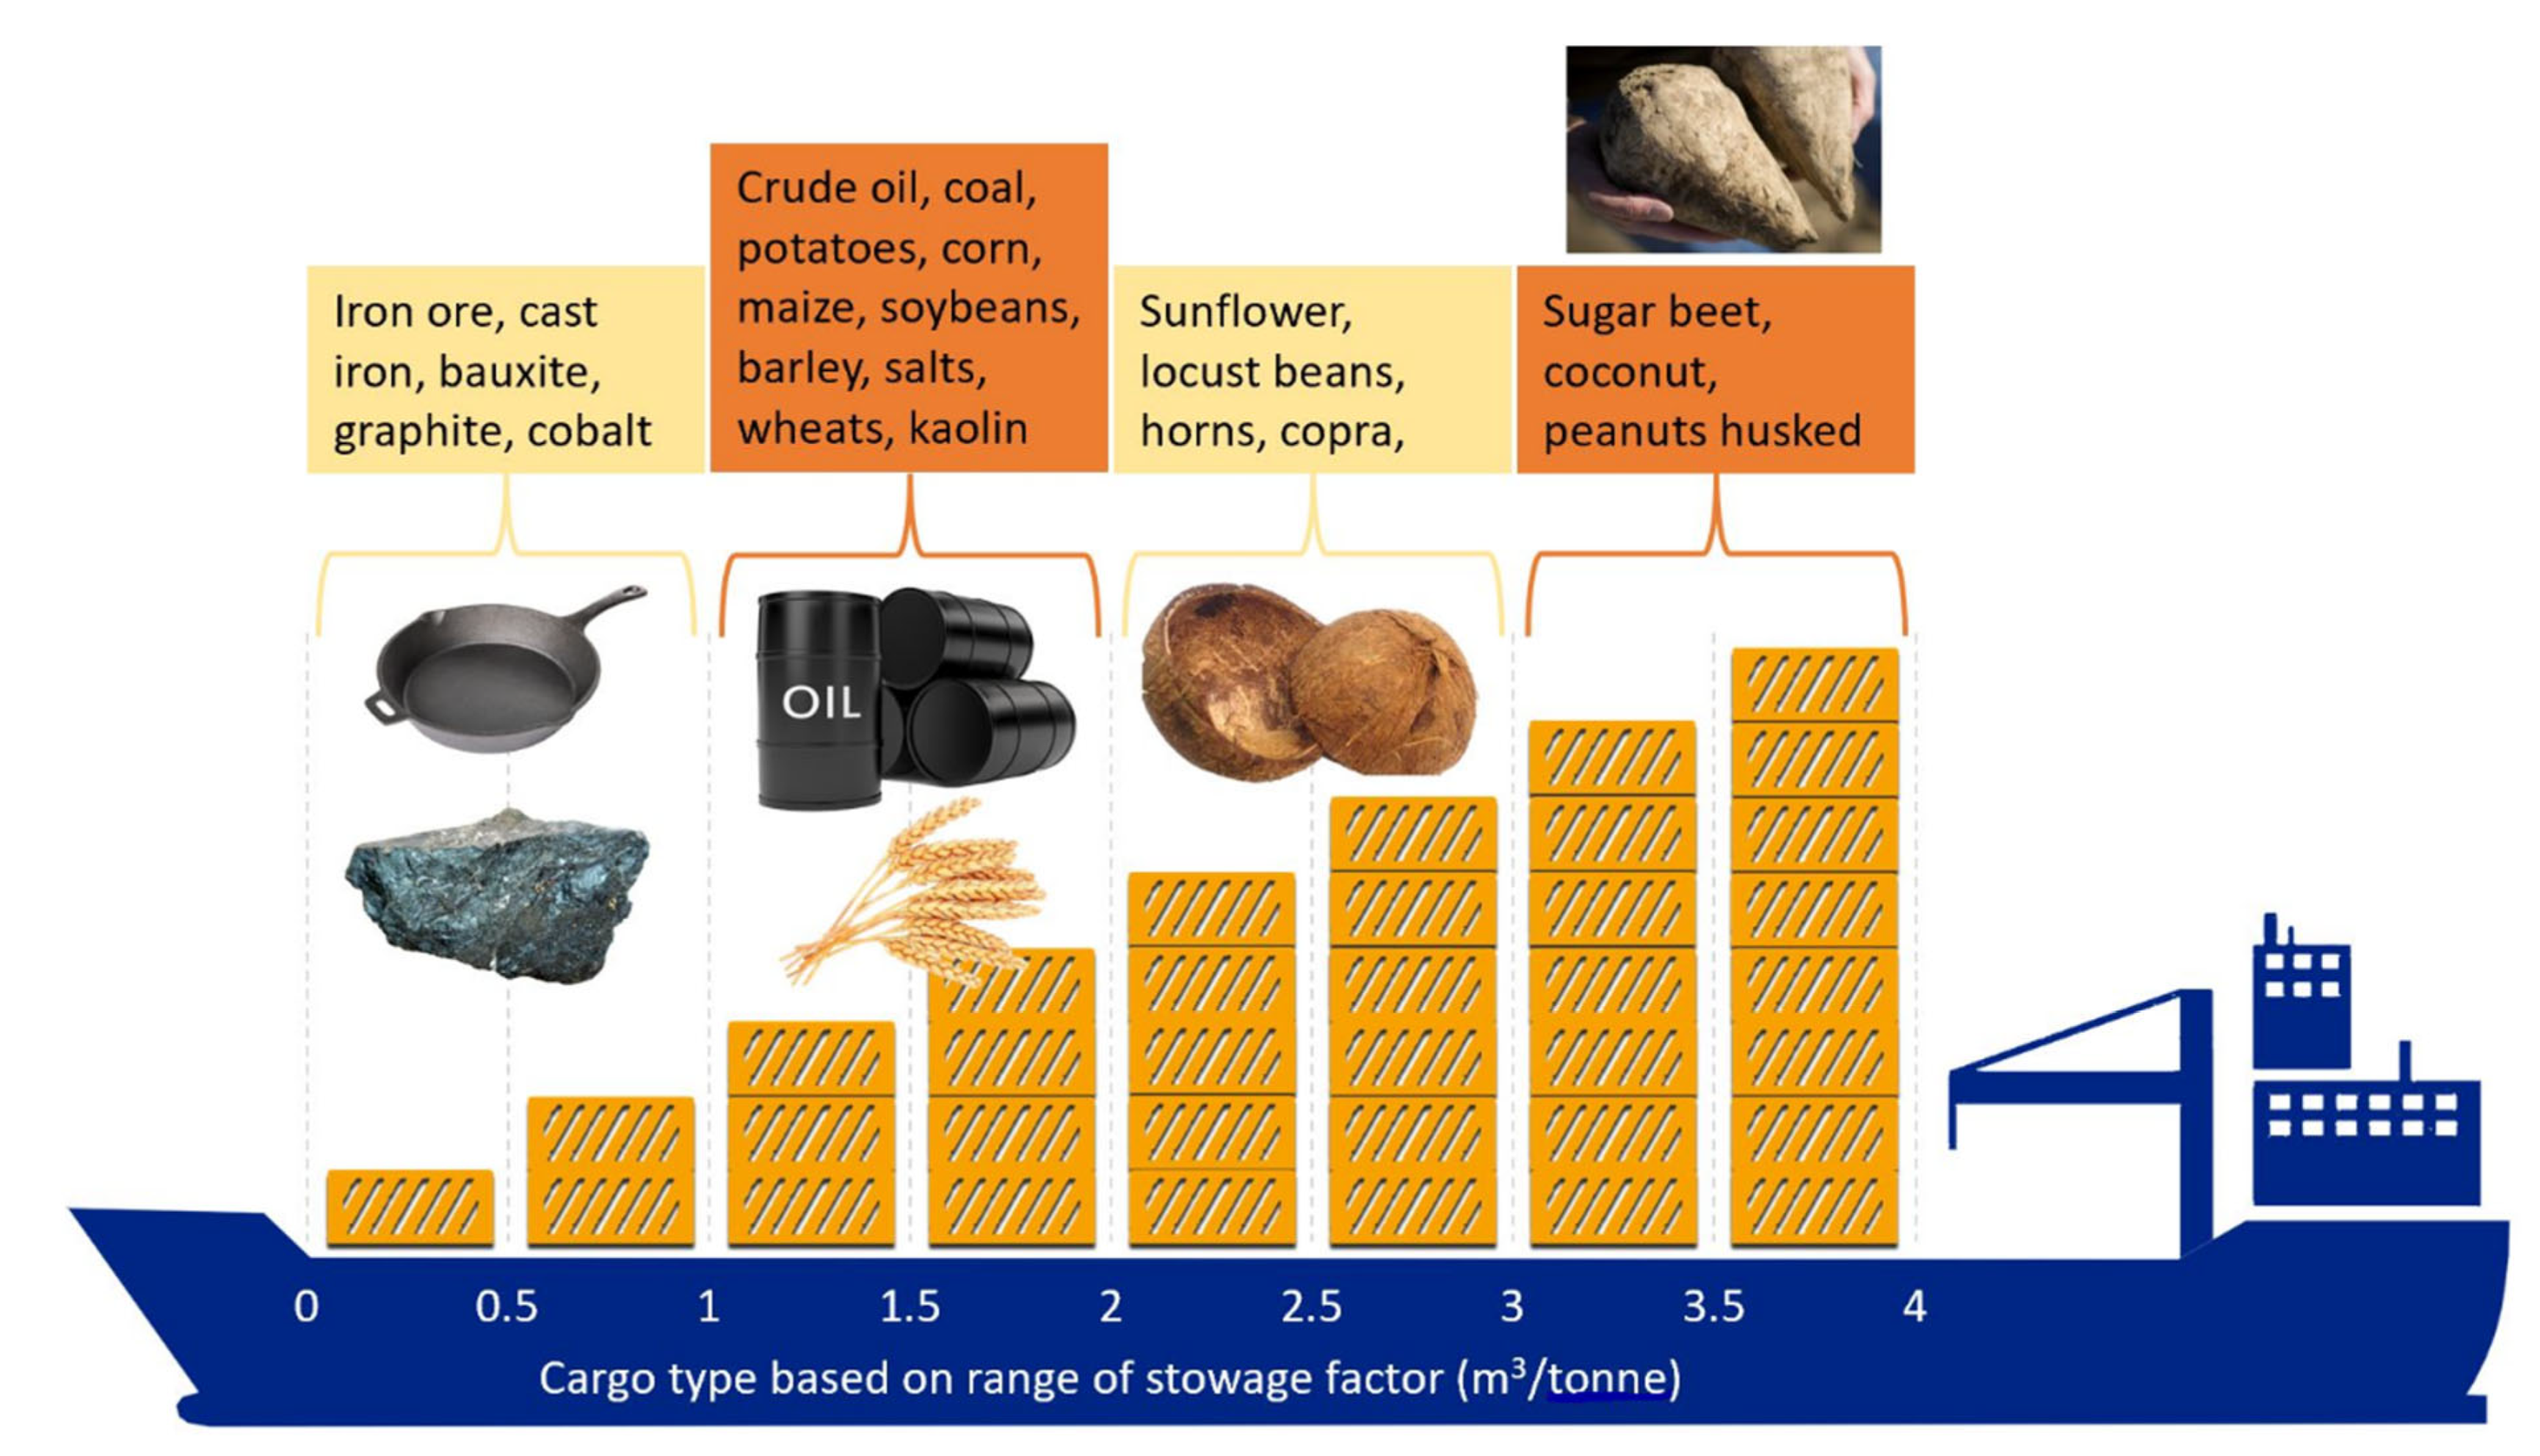
2.4. Cargo Type
2.5. Voyage Distance
2.6. Ship Performance Assessment—Case Studies
3. Results
3.1. Quantitative Assessment
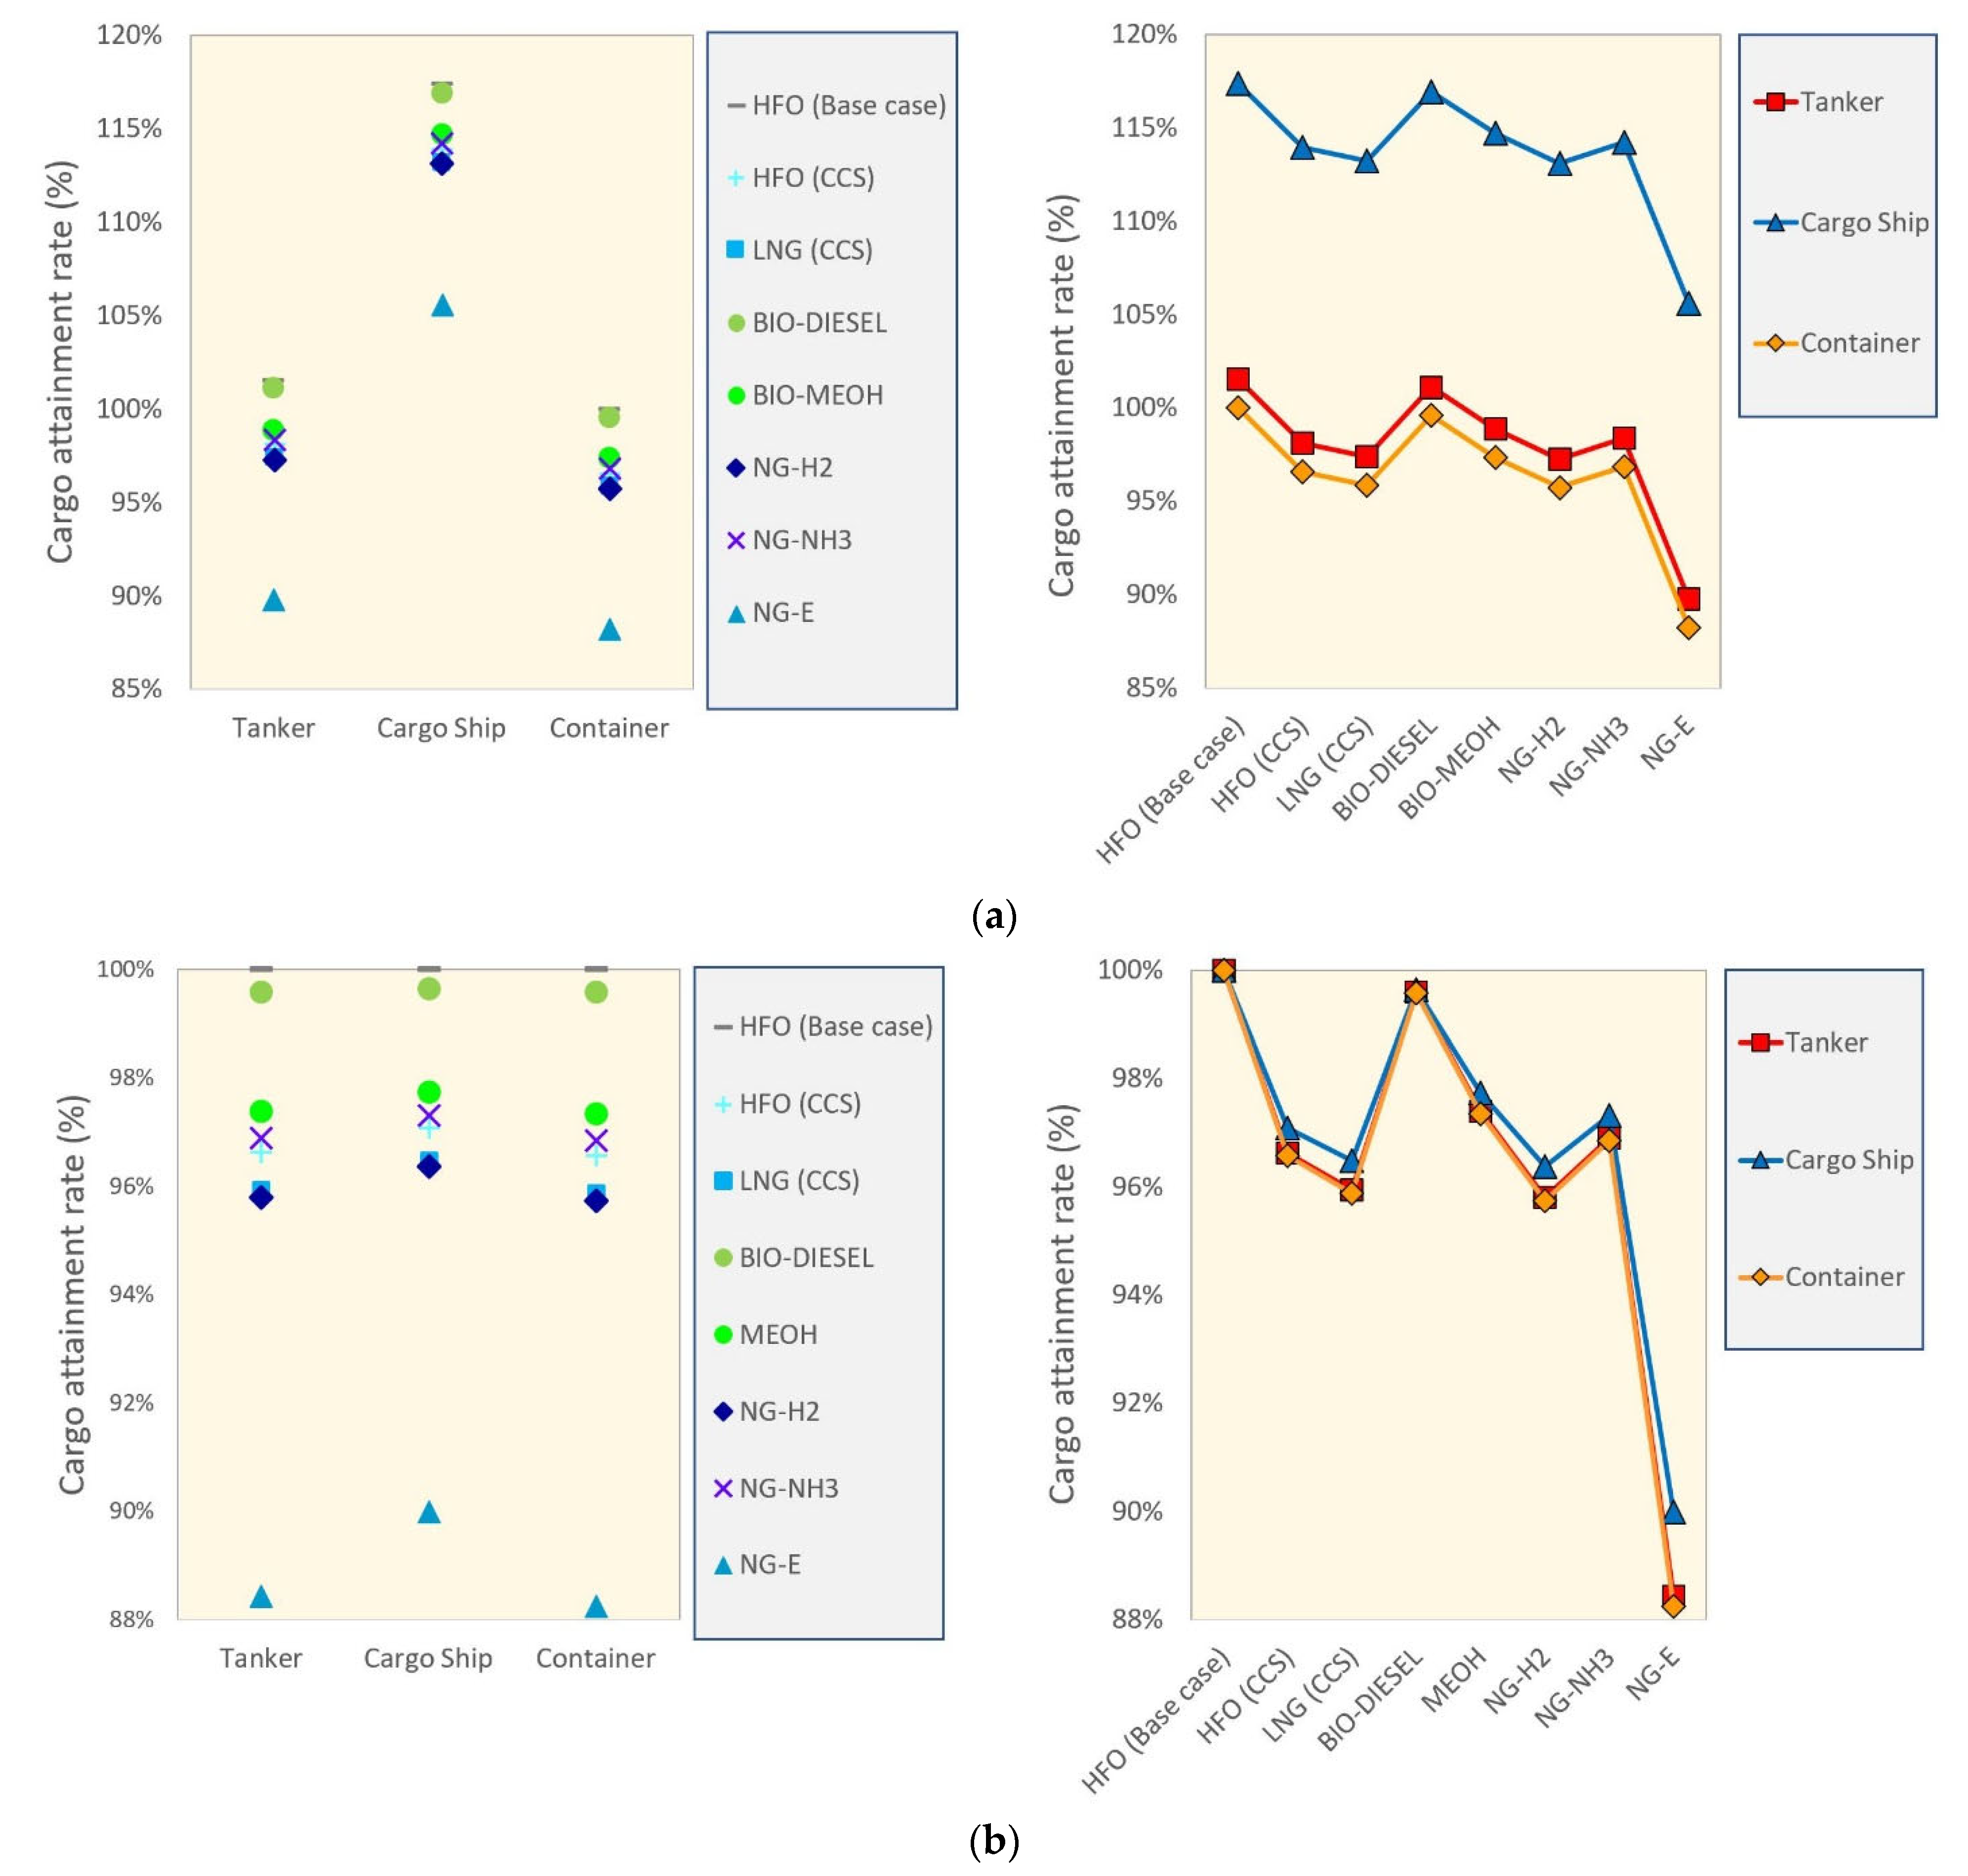
3.1.1. Ship Type
3.1.2. Fuel Type
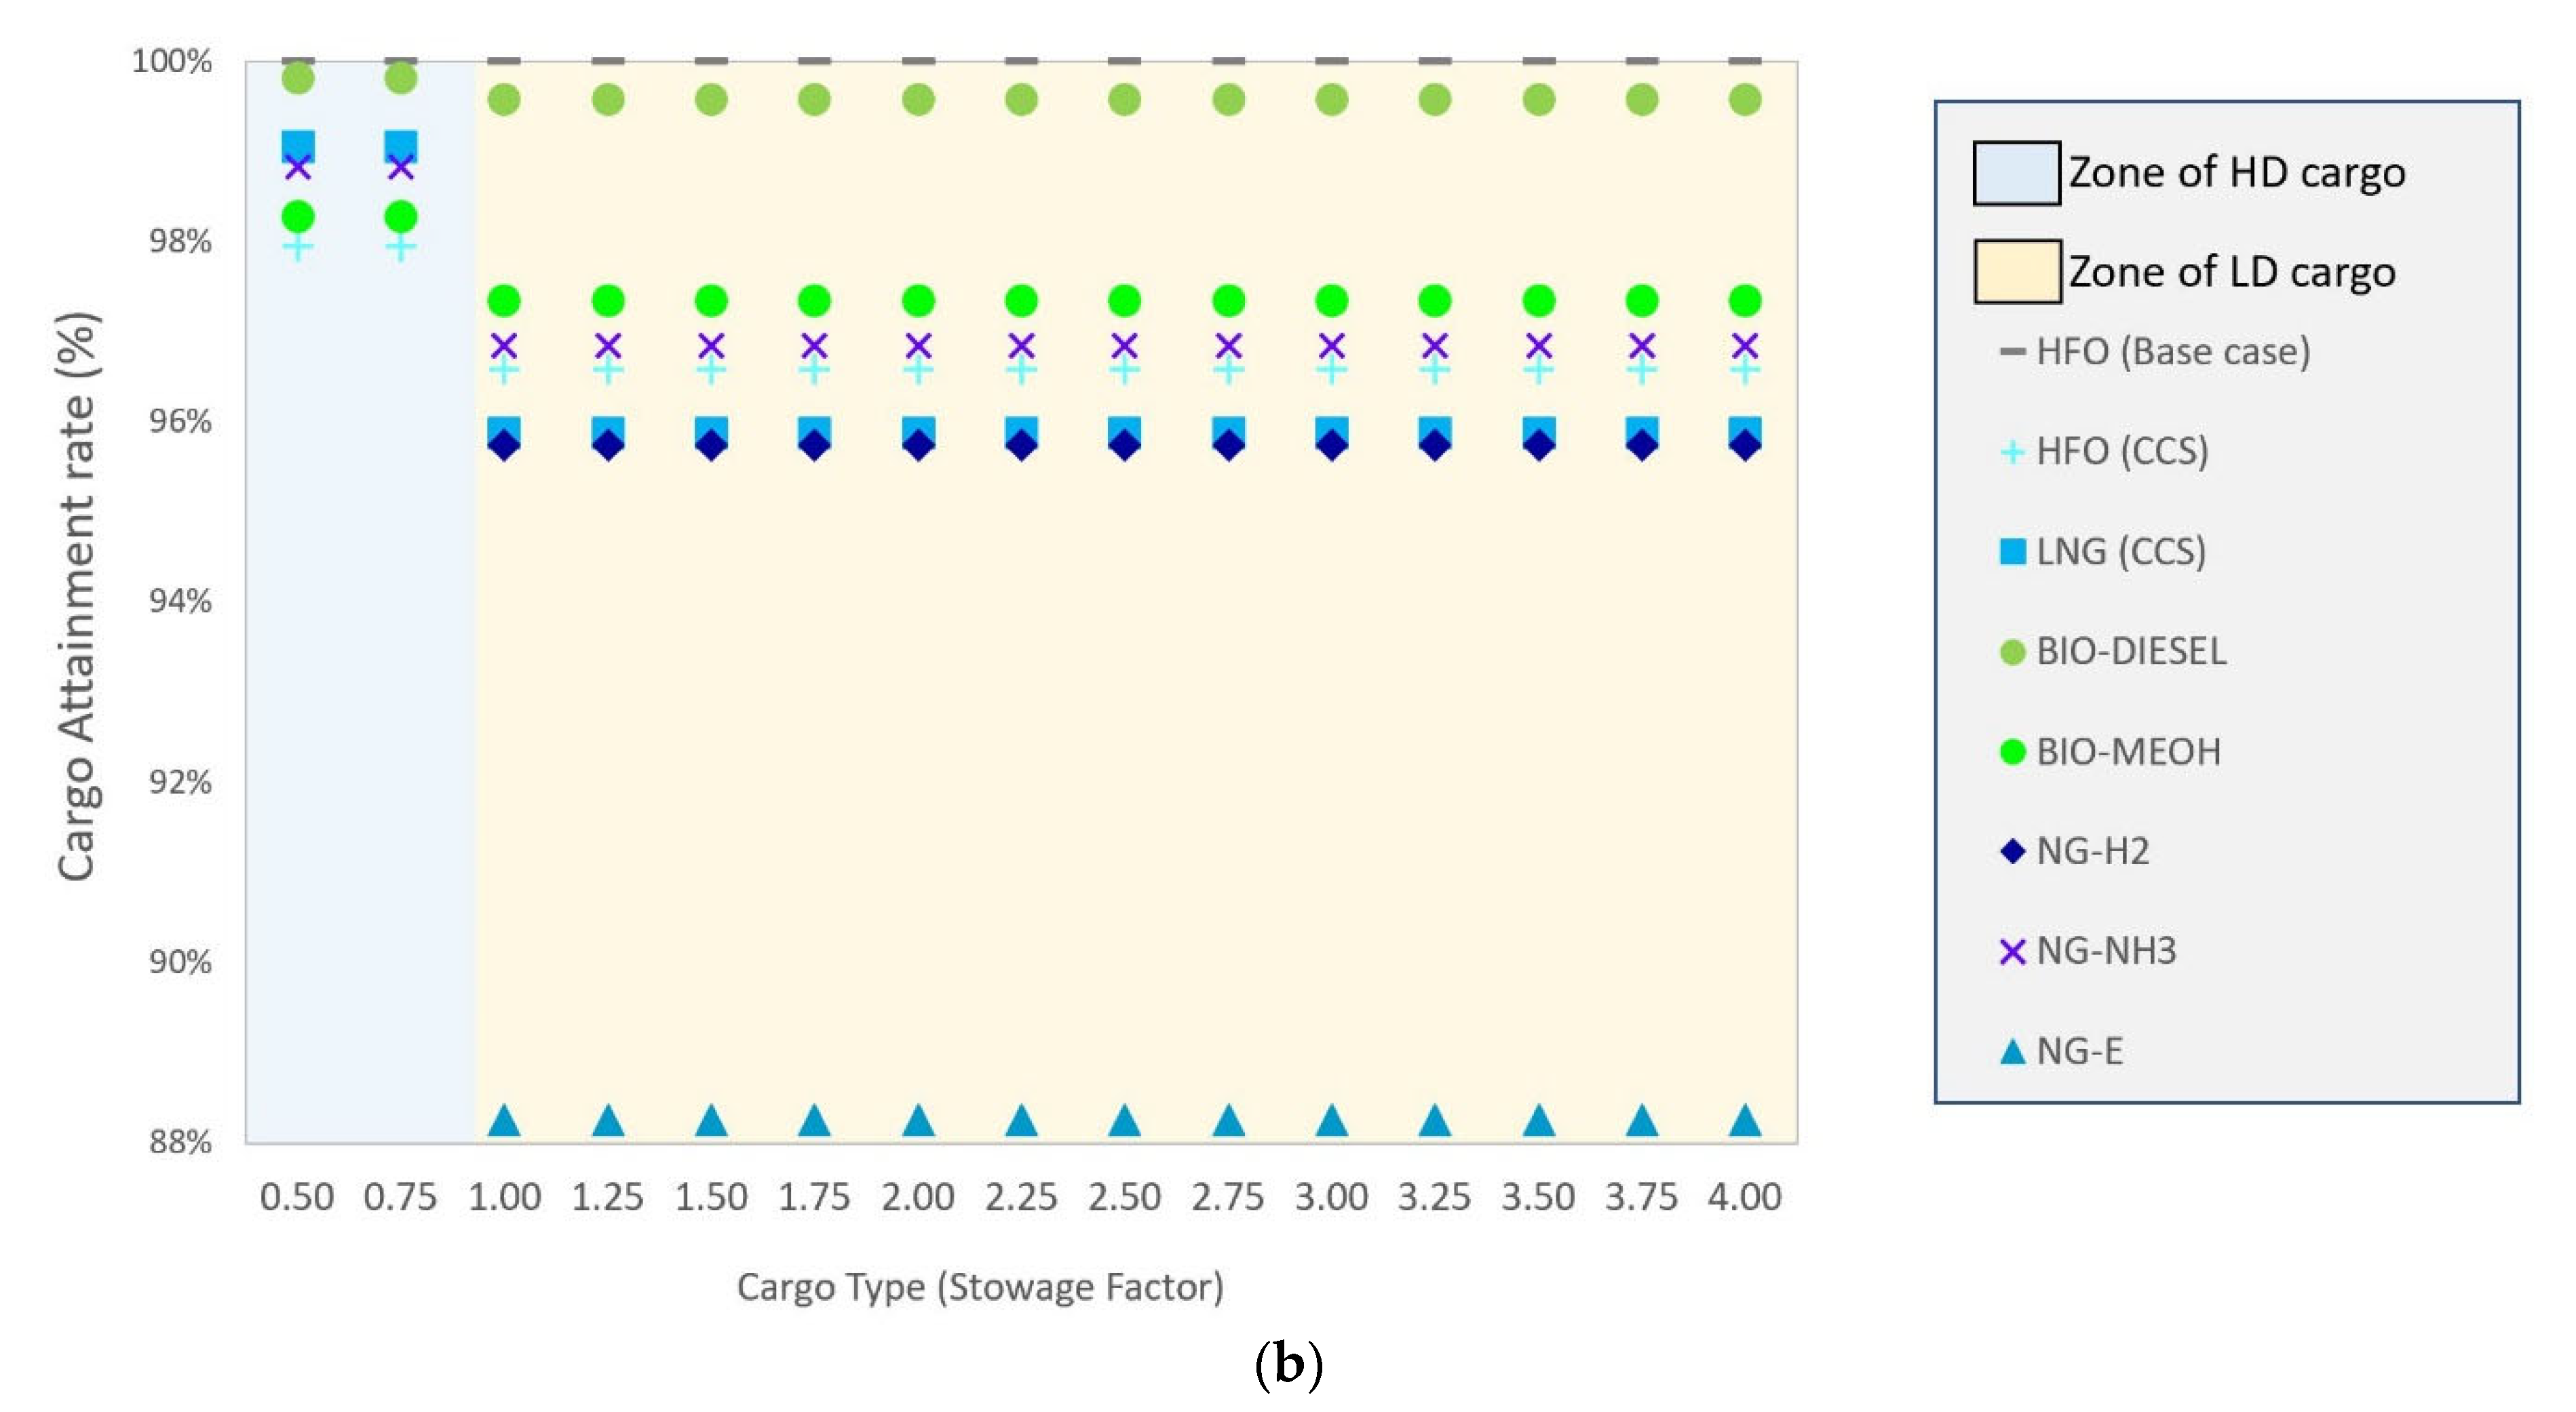
3.1.3. Cargo Type
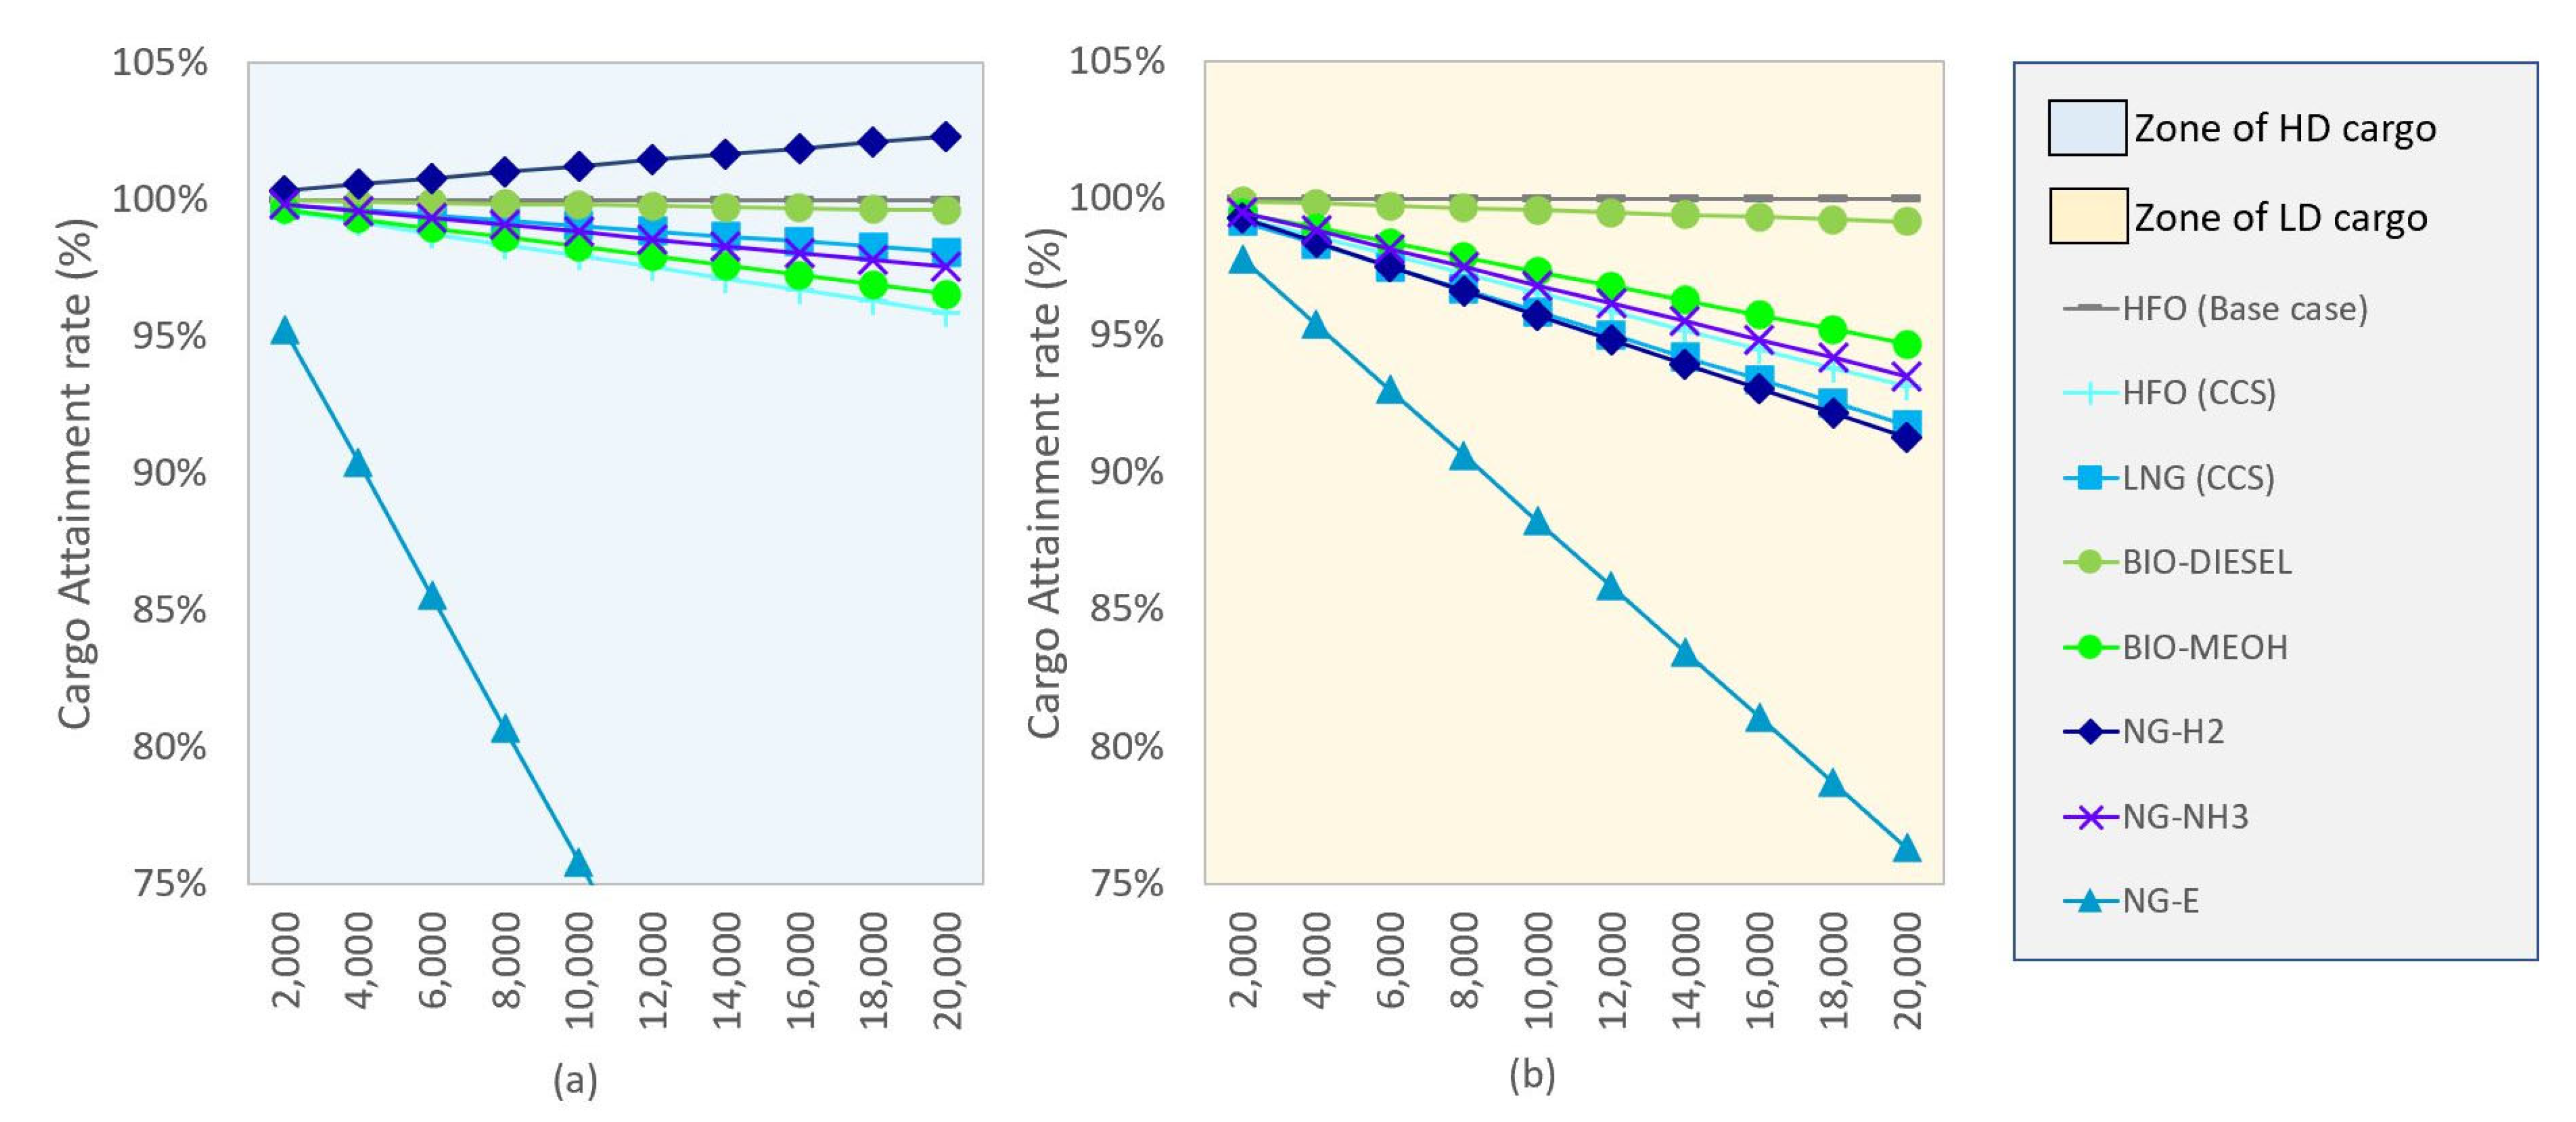
3.1.4. Voyage Distance
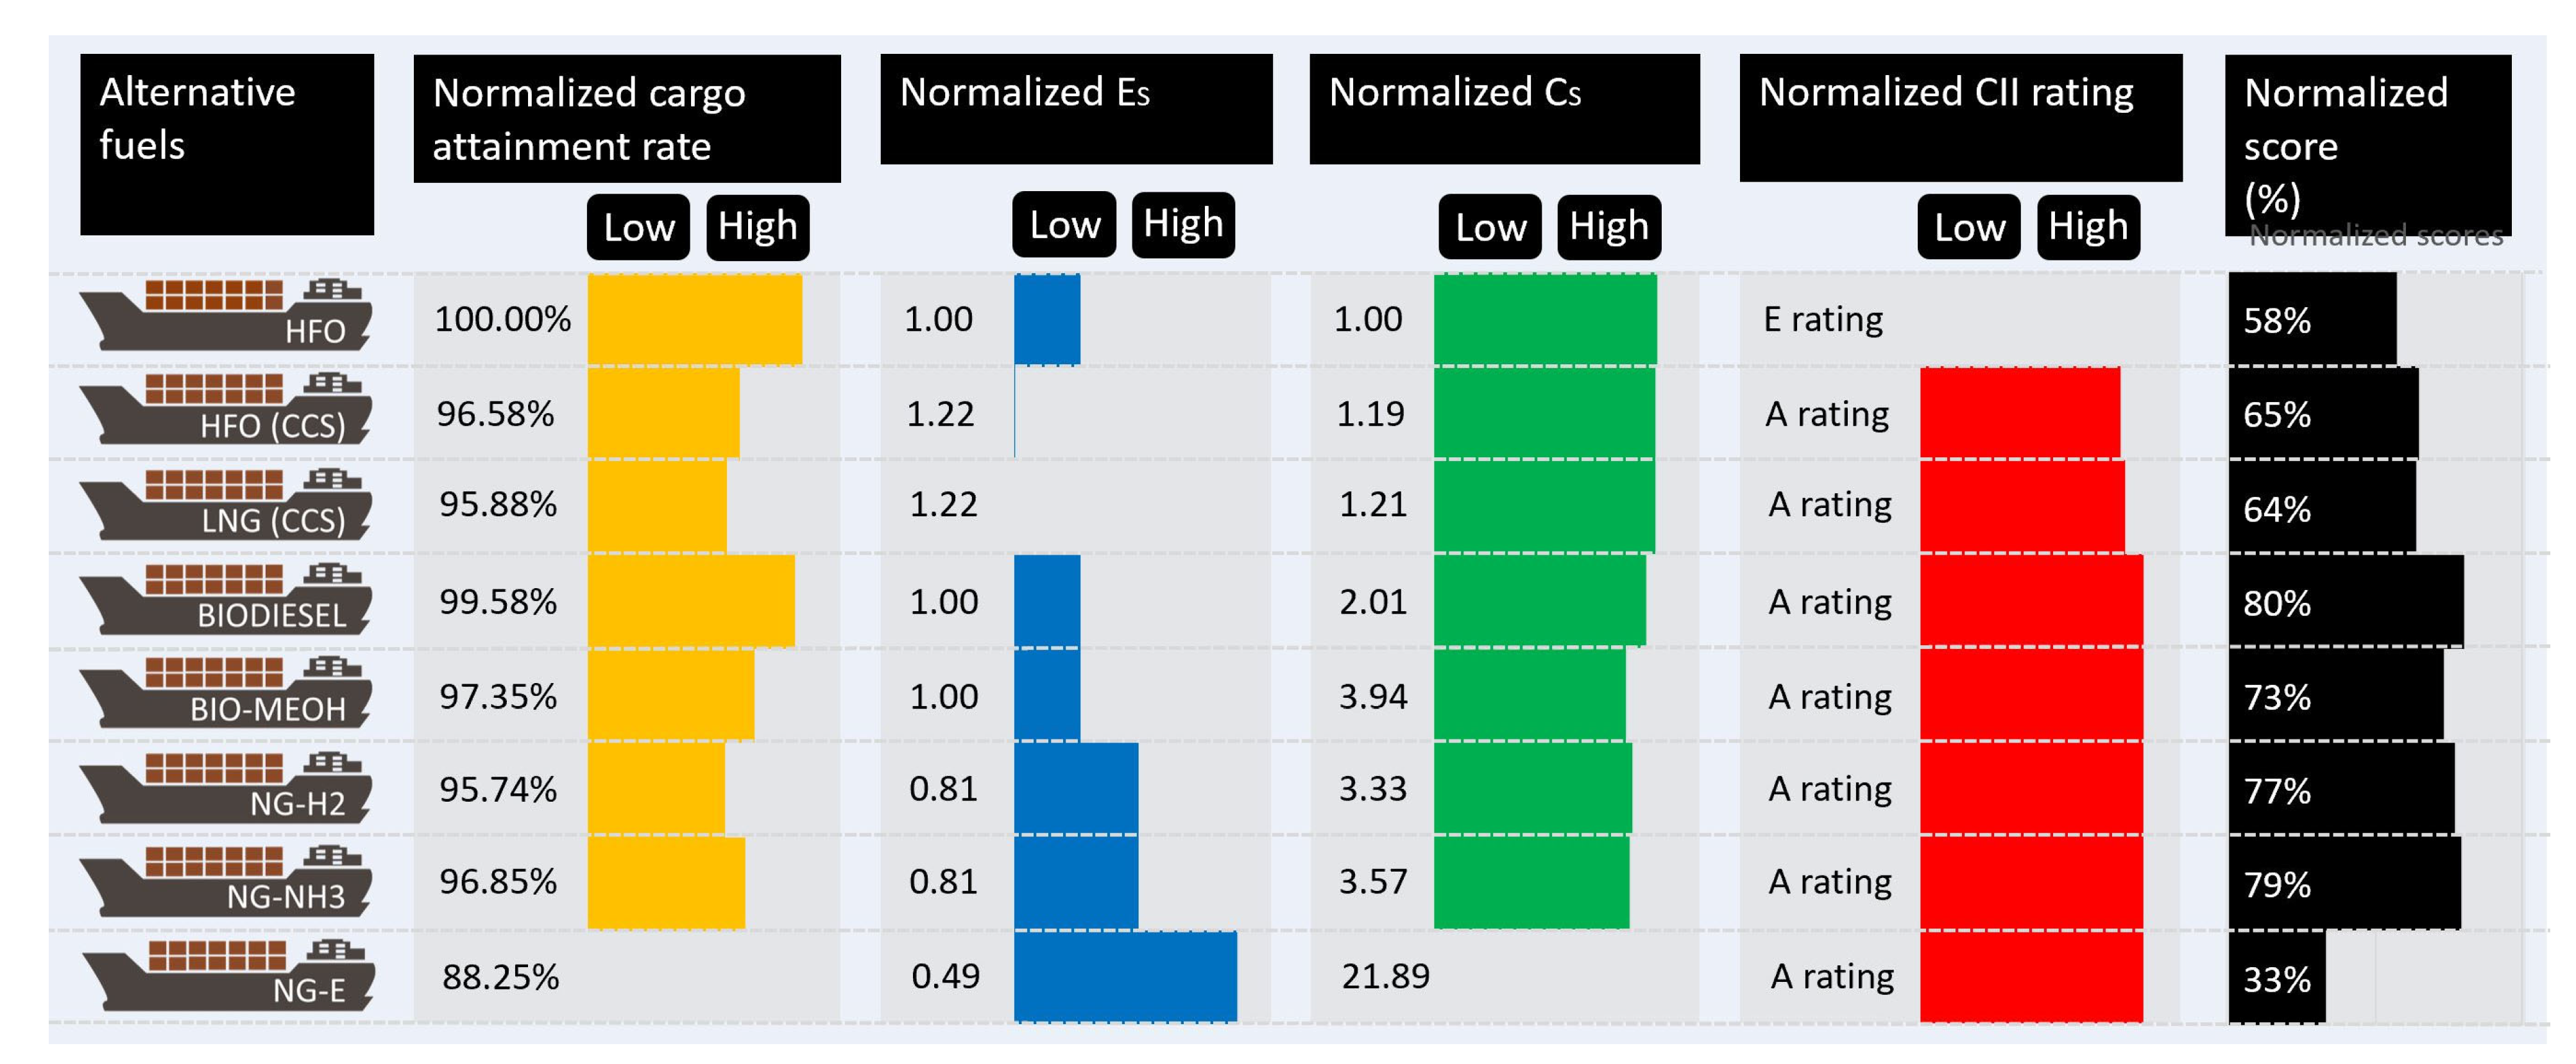
3.1.5. Summary
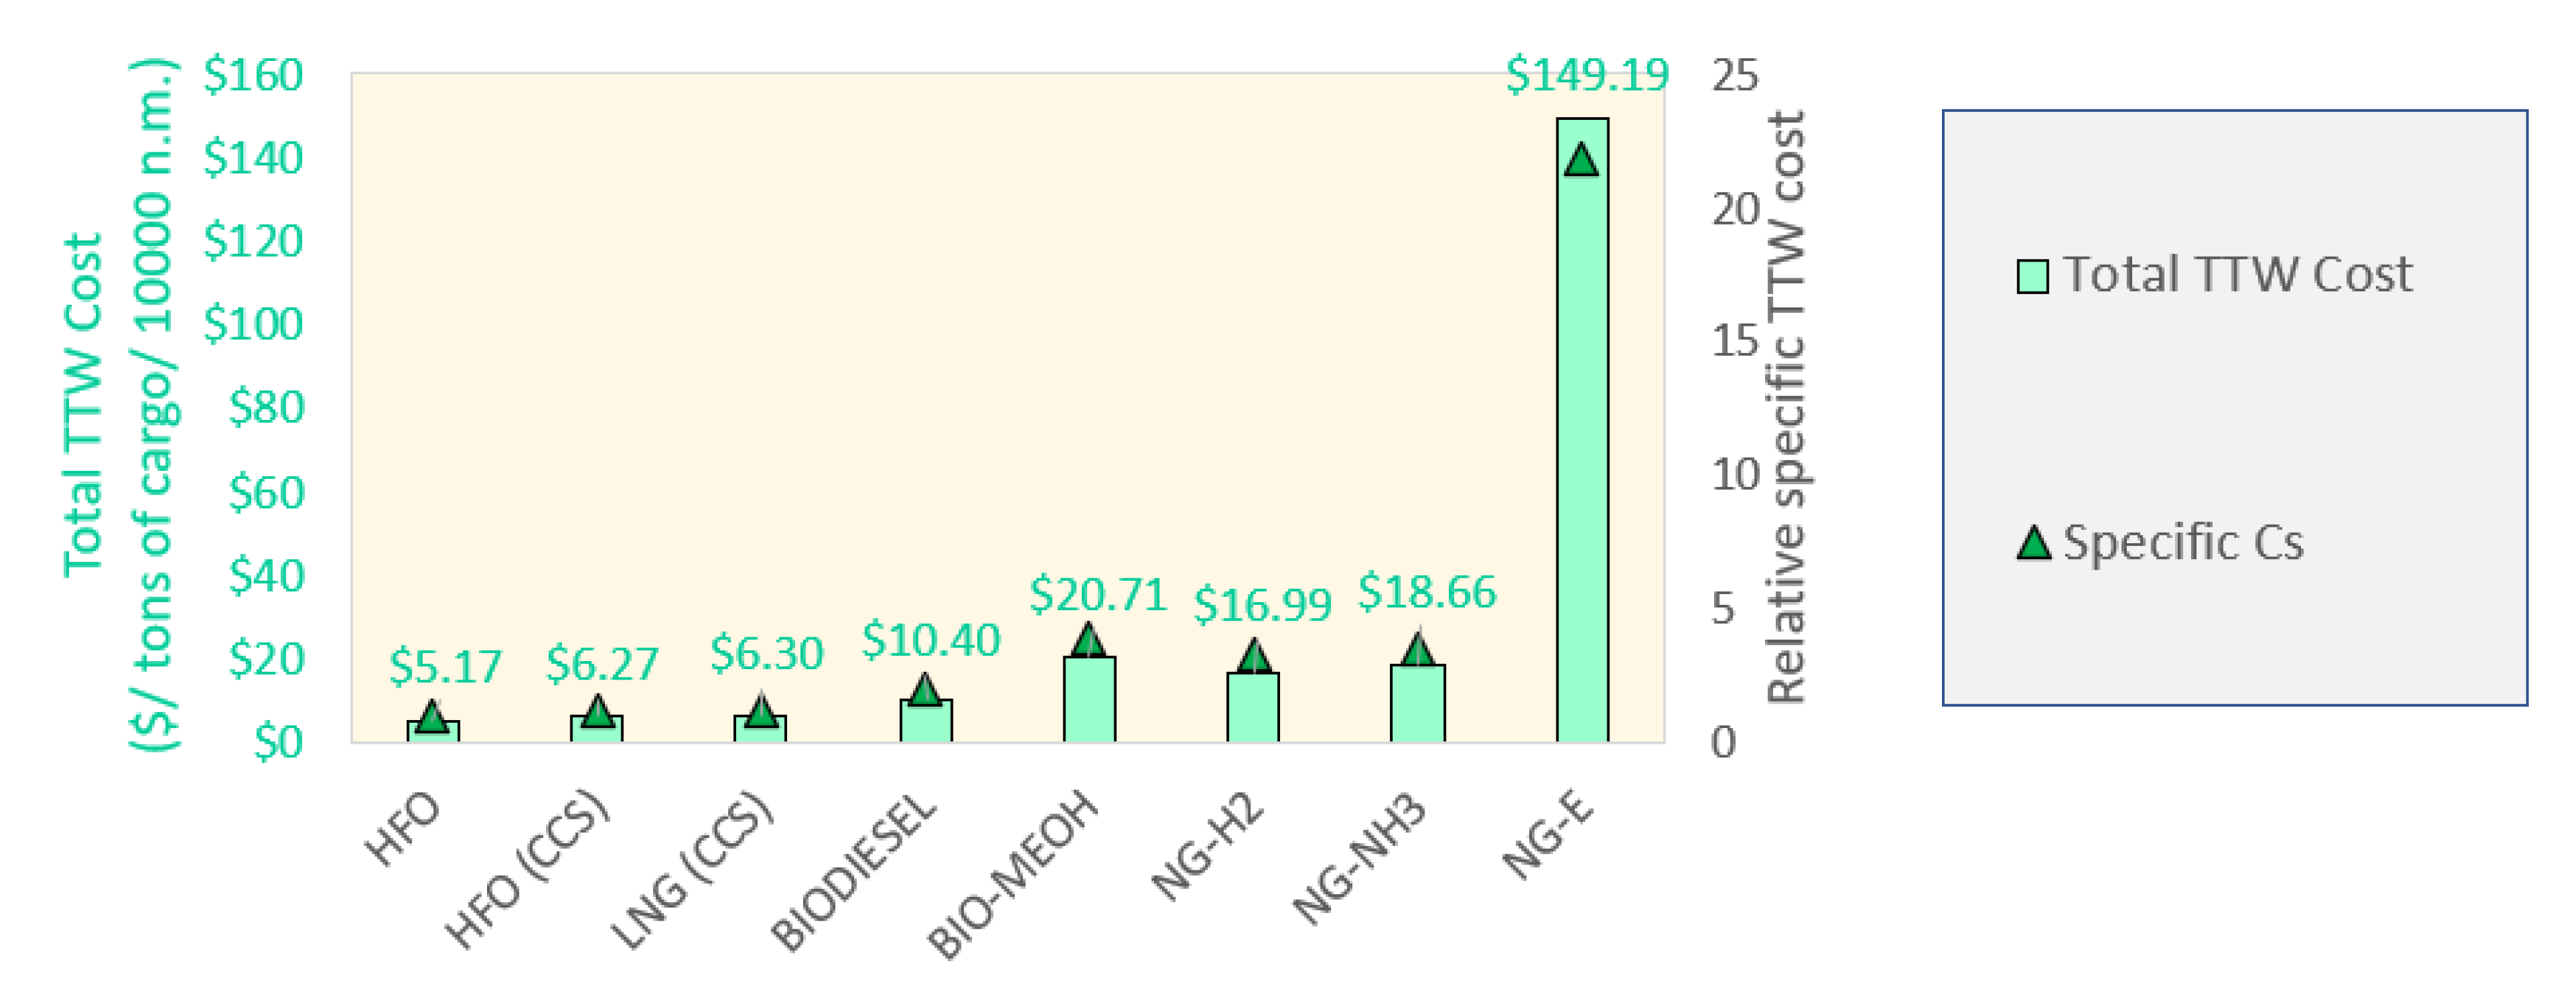
3.2. Case Study 1: Economic Cost and Carbon Indices for a Given Cargo and Voyage Length
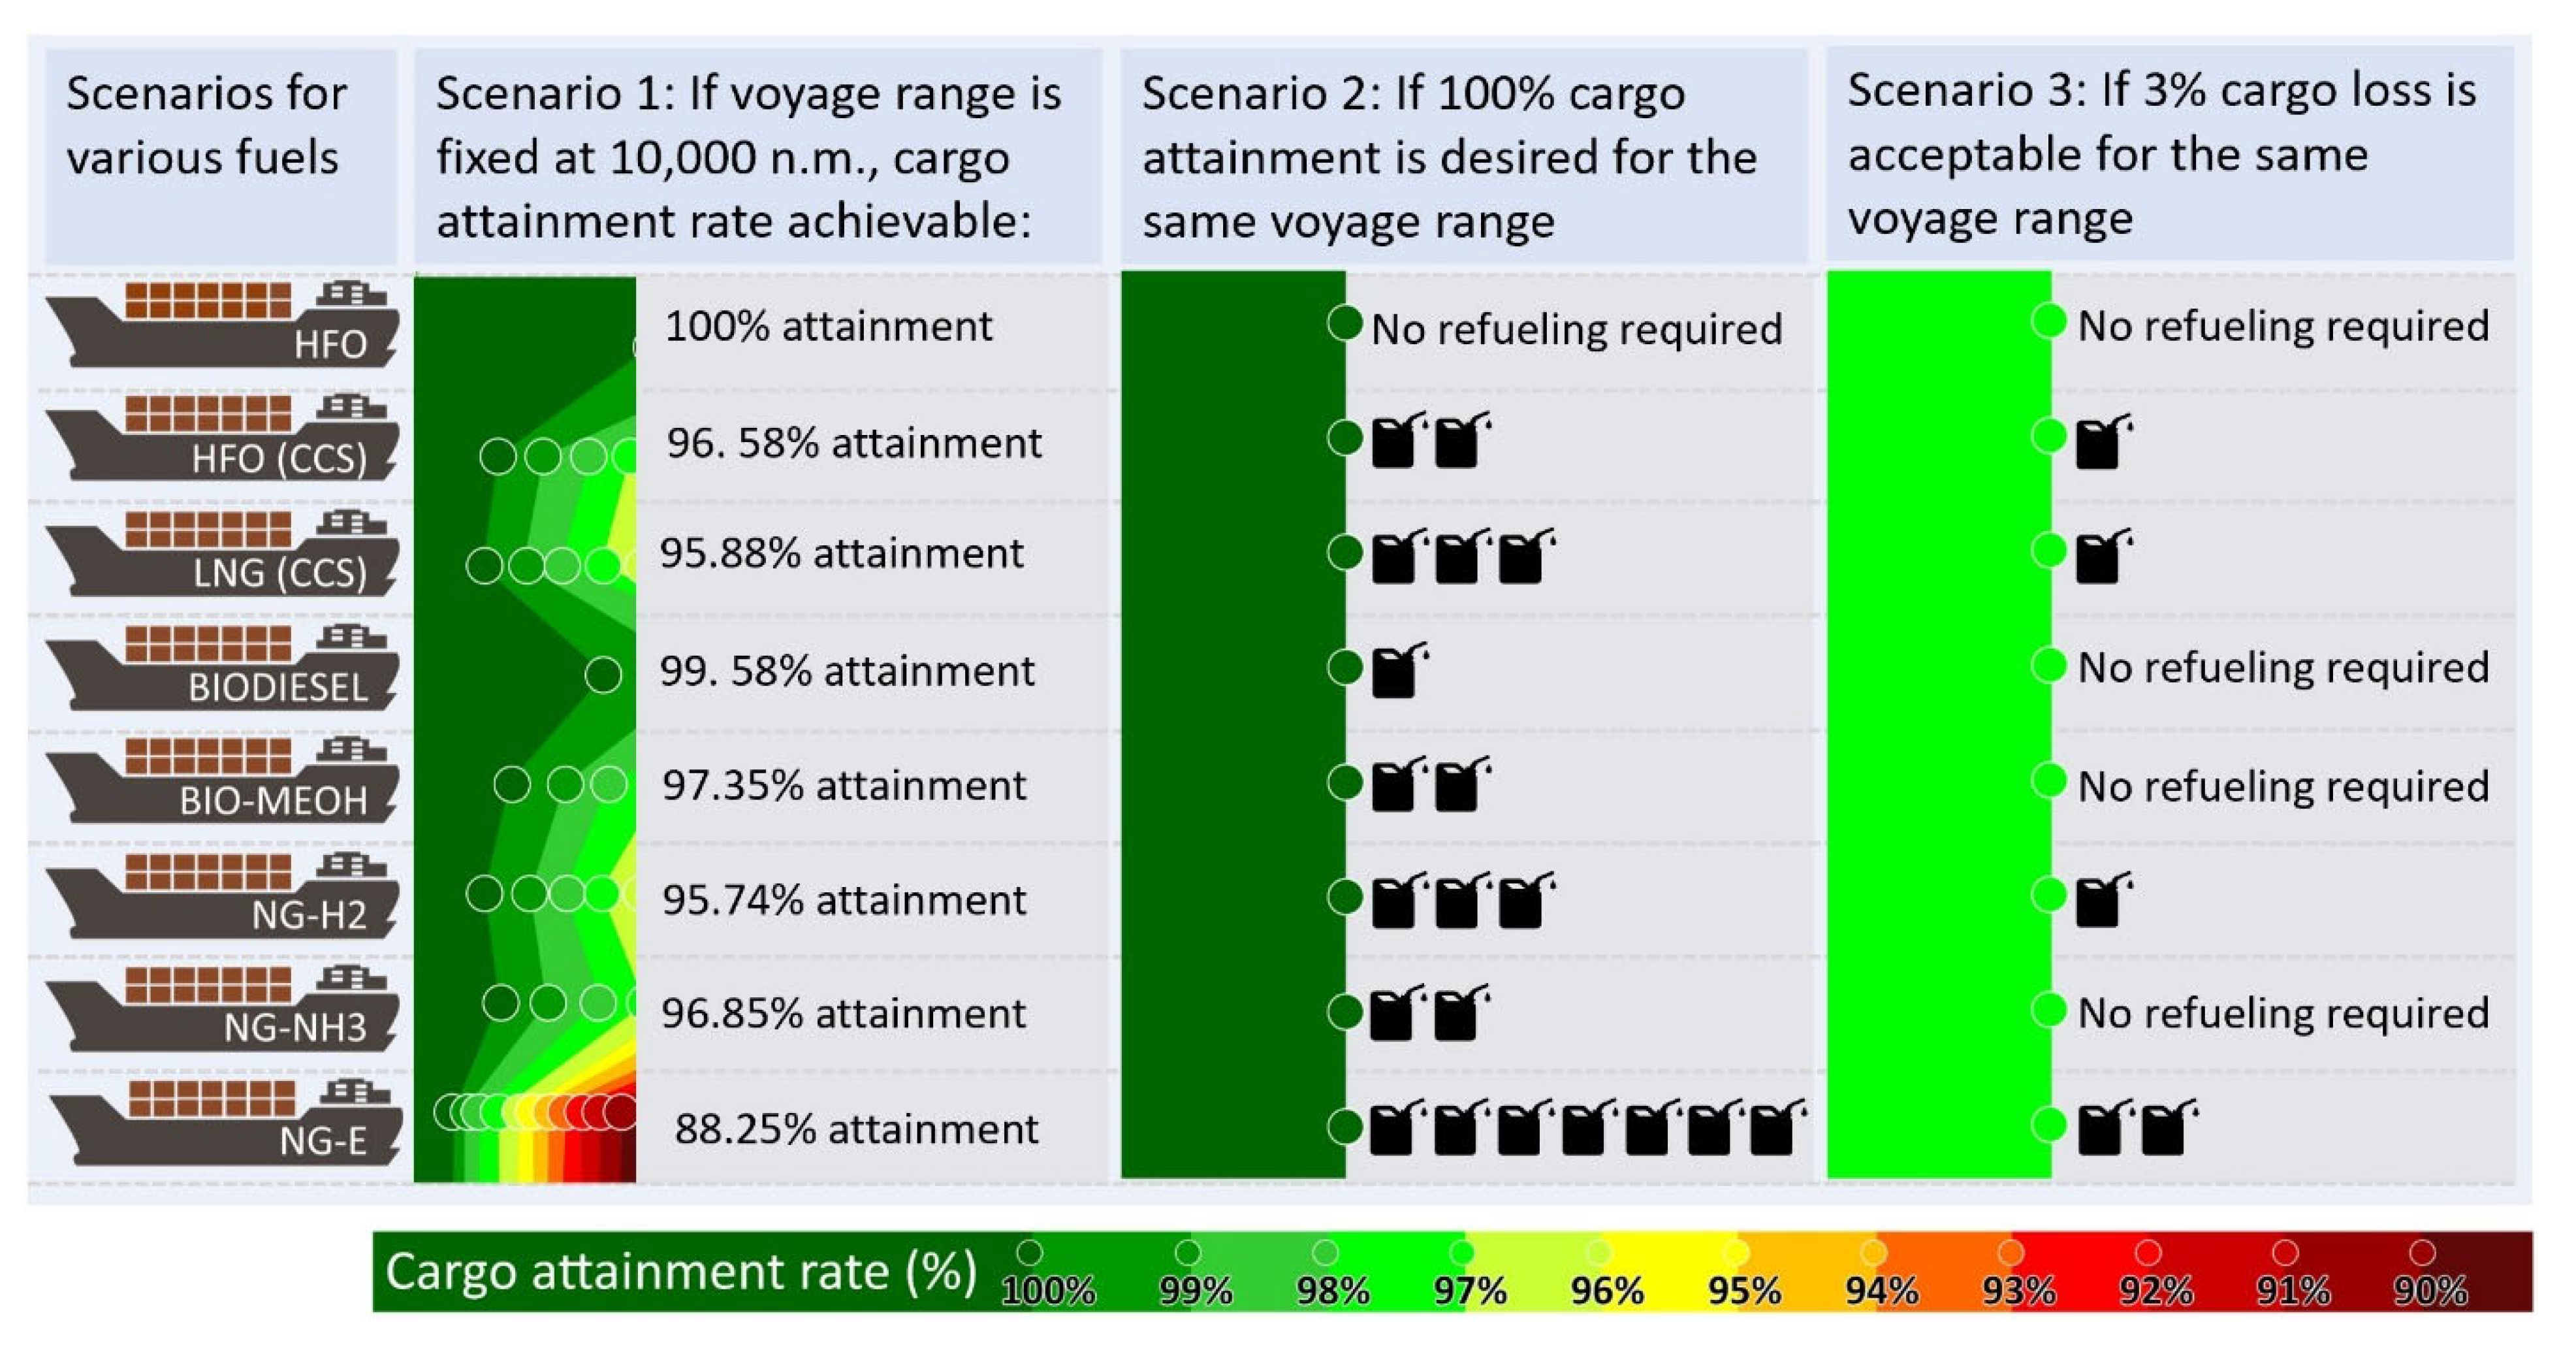
3.3. Case Study 2: Performance of Alternative Fuels as a Function of Voyage Length
4. Discussion
5. Conclusions
Author Contributions
Funding
Conflicts of Interest
Nomenclature
| AF | Alternative fuel |
| B | Ship breadth |
| CAR | Cargo attainment rate |
| CCS | Carbon capture and storage |
| CII | Carbon intensity indicator (gCO2/dwt.nm) |
| CO2e | Carbon dioxide equivalent |
| CS | Specific TTW cost, ($/dwt.nm) |
| Δ | Ship displacement |
| DW | Deadweight |
| DWC | Cargo deadweight |
| DWNC | Non-cargo deadweight |
| DWT | Deadweight tonnage |
| ES | Specific TTW energy, (kJ/dwt.nm) |
| EM | Electrical motor |
| FC | Fuel cell |
| GHG | Greenhouse gases |
| GT | Gross tonnage |
| H2 | Hydrogen |
| HD | High density zone |
| HFO | Heavy fuel oil |
| ICE | Internal combustion engine |
| IMO | International Maritime Organization |
| L | Ship length |
| LD | Low-density zone |
| LNG | Liquefied natural gas |
| LPG | Liquefied petroleum gas |
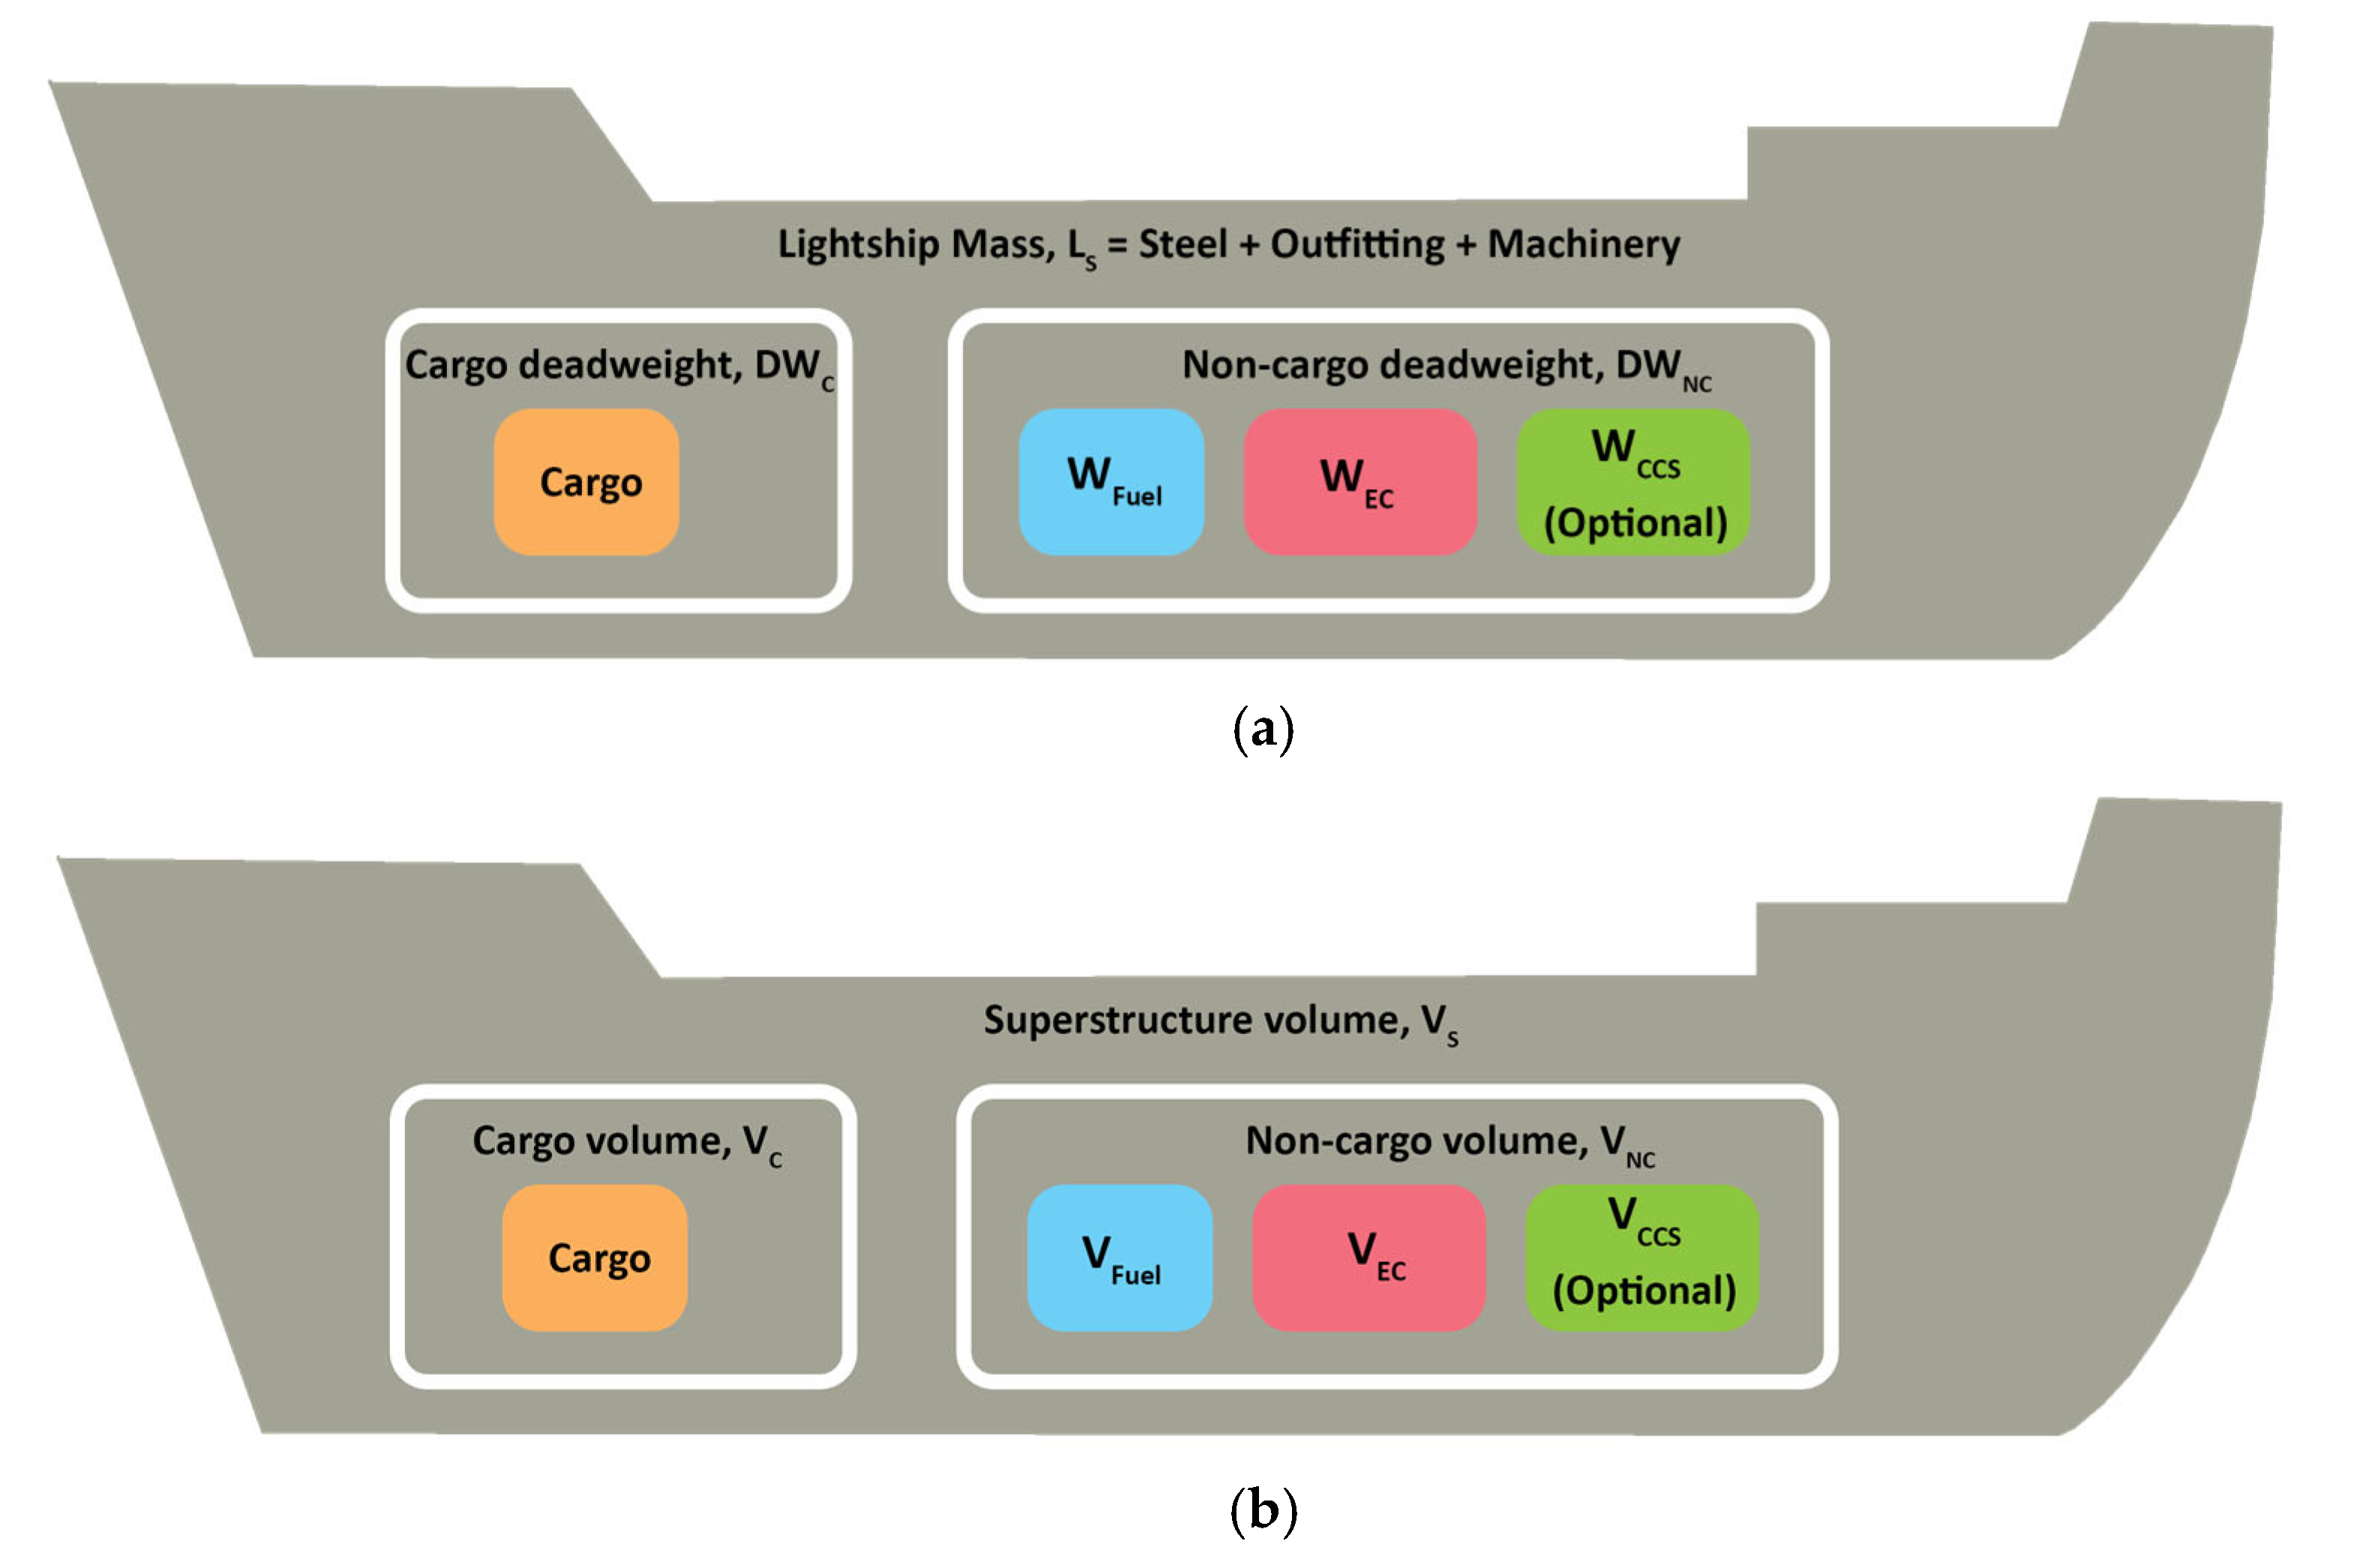
| LS | Lightship mass |
| MEOH | Methanol |
| NH3 | Ammonia |
| NT | Net tonnage |
| PEM | Proton Exchange Membrane |
| RF | Reference fuel |
| SF | Stowage factor |
| T | Ship draught |
| TTW | Tank-to-wake |
| VC | Cargo volume |
| VCCS | CCS volume |
| VEC | Energy converter volume |
| VFuel | Fuel volume |
| VNC | Non-cargo volume |
| VS | Superstructure volume |
| WCCS | CCS weight |
| WEC | Energy converter weight |
| WFuel | Fuel weight |
Appendix A. Ship Model
| Ship Type | Cargo Ship | Tanker | Containership |
| Deadweight coefficient, CD | 0.7 | 0.82 | 0.6 |
Appendix B. Weight Distribution Onboard of Ship

| Energy Converter Models | Energy Output (kW) | Speed (RPM) | Efficiency (%) | Weights (tons) a | Volume (m3) b |
|---|---|---|---|---|---|
| DF Engine W 6L46DF [39] | 6870 | N.A. | 45.0% | 112.20 | 146.95 |
| DF Engine W 7L46DF [39] | 8015 | N.A. | 45.0% | 129.80 | 160.41 |
| DF Engine W 8L46DF [39] | 9160 | N.A. | 45.0% | 143.00 | 180.92 |
| DF Engine W 9L46DF [39] | 10,305 | N.A. | 45.0% | 160.60 | 190.10 |
| DF Engine W 12L46DF [39] | 13,740 | N.A. | 45.0% | 202.40 | 275.00 |
| DF Engine W 14L46DF [39] | 16,030 | N.A. | 45.0% | 245.30 | 302.83 |
| DF Engine W 16L46DF [39] | 18,320 | N.A. | 45.0% | 258.50 | 395.69 |
| EM Engine LPMR850 [40] | 850 | 3000 | 92.5% | 1.90 | 1.37 |
| EM 710K-04-MEBSSWW | 8000 | 872 | 92.5% | 19.03 | 16.43 |
| EM 710H-04-MEBSSWW | 9000 | 980 | 92.5% | 20.24 | 17.56 |
| 2X100% EM 710K-04-MEBSSWW | 16,000 | 872 | 92.5% | 38.06 | 32.85 |
| 2X100% EM 710H-04-MEBSSWW | 18,000 | 980 | 92.5% | 40.48 | 35.12 |
| PEMFC & EM Engine LPMR850 b | 850 | 3000 | 55.5% | 2.89 | 1.96 |
| PEMFC & EM 710K-04-MEBSSWW b | 8000 | 872 | 55.5% | 28.39 | 21.93 |
| PEMFC & EM 710H-04-MEBSSWW b | 9000 | 980 | 55.5% | 30.77 | 23.75 |
| PEMFC & 2X100% EM 710K-04-MEBSSWW b | 16,000 | 872 | 55.5% | 75.51 | 54.85 |
| PEMFC & 2X100% EM 710H-04-MEBSSWW b | 18,000 | 980 | 55.5% | 82.61 | 59.87 |
Appendix C. Volume Distribution Onboard of Ship
| Ship Type | Cargo Ship | Tanker | Containership |
| k1 | 0.30 | 0.30 | 0.33 |
| k2 | 0.60 | 0.60 | 0.40 |
Appendix D. Weight- or Volume-Critical Ship
References
- International Maritime Organization. Fourth IMO Greenhouse Gas Study; International Maritime Organization: London, UK, 2020. [Google Scholar]
- Maritime Knowledge Centre; TNO; TU Delft. Final Report—Framework CO2 Reduction in Shipping; TU Delft: Delft, Netherlands, 2017. [Google Scholar]
- Adland, R.; Cariou, P.; Wolff, F.-C. Optimal ship speed and the cubic law revisited: Empirical evidence from an oiltanker fleet. Transp. Res. Part E 2020, 140, 101972. [Google Scholar] [CrossRef]
- Berthelsen, F.H.; Nielsen, U.D. Predictions of ships’ speed-power relationship at speed intervals below the design speed. Transp. Res. Part D 2021, 99, 102996. [Google Scholar] [CrossRef]
- Singh, B. Liquified Natural Gas (LNG) as Fuel for The Shipping Industry. Marine Insight, 8 January 2021. Available online: https://www.marineinsight.com/green-shipping/liquified-natural-gas-lng-as-fuel-for-the-shipping-industry/(accessed on 26 March 2022).
- Frangoul, A. Maersk Spends $1.4 Billion on Ships That Can Run on ‘Carbon Neutral’ Methanol. CNBC, 24 August 2021. Available online: https://www.cnbc.com/2021/08/24/maersk-spends-1point4-billion-on-ships-that-can-run-on-methanol.html(accessed on 26 March 2022).
- DNV.GL; ZEM. Grenland Energy. In DNV GL Handbook for Maritime and Offshore Battery Systems; DNV.GL: Oslo, Norway, 2016. [Google Scholar]
- Biogradlija, A. HySeas III Project to Build Hydrogen-Powered Ferry. Energy News, 7 June 2021. Available online: https://energynews.biz/hyseas-iii-project-to-build-hydrogen-powered-ferry/(accessed on 15 April 2022).
- Sakharkar, A. Energy Observer is Equipped with a New Fuel Cell Developed by Toyota. Tech Explorist, 6 February 2020. Available online: https://www.techexplorist.com/energy-observer-equipped-fuel-cell-toyota/29871/(accessed on 15 April 2022).
- Shell. Shell to Trial First Hydrogen Fuel Cell for Ships in Singapore. Shell, 21 April 2021. Available online: https://www.shell.com.sg/media/2021-media-releases/shell-to-trial-first-Hydrogen-fuel-cell-for-ships-in-singapore.html(accessed on 15 April 2022).
- Marine, S. Towards a Decarbonised Future: Sembcorp Marine, Shell and Penguin International Sign MoU for Hydrogen-powered Vessel. Sembcorp Marine, 21 April 2021. Available online: https://www.sembmarine.com/2021/04/21/towards-a-decarbonised-future-sembcorp-marine-shell-and-penguin-international-sign-mou-for-hydrogen-powered-vessel(accessed on 15 April 2022).
- Prevljak, N.H. Value Maritime to Install World’s 1st Onboard CCS Unit on Ship in Operation. Offshore Energy, 10 September 2021. Available online: https://www.offshore-energy.biz/value-maritime-to-install-worlds-1st-onboard-ccs-unit-on-ship-in-operation/(accessed on 24 June 2022).
- Deniz, C.; Zincir, B. Environmental and economical assessment of alternative marine fuels. J. Clean. Prod. 2016, 113, 438–449. [Google Scholar] [CrossRef]
- Hansson, J.; Månsson, S.; Brynolf, S.; Grahn, M. Alternative marine fuels: Prospects based on multi-criteria decision analysis. Biomass-Bioenergy 2019, 126, 159–173. [Google Scholar] [CrossRef]
- DNV.GL. Alternative Fuels: The Options. DNV, 9 October 2018. Available online: https://www.dnv.com/expert-story/maritime-impact/alternative-fuels.html(accessed on 26 March 2022).
- DNV.GL. Assessment of Selected Alternative Fuels and Technologies; DNV.GL: Hovik, Norway, 2019. [Google Scholar]
- DNVGL. Alternative Fuels for Containerships; DNVGL: Hovik, Norway, 2021. [Google Scholar]
- Law, L.C.; Foscoli, B.; Mastorakos, E.; Evans, S. A Comparison of Alternative Fuels for Shipping in Terms of Lifecycle Energy and Cost. Energies 2021, 14, 8502. [Google Scholar] [CrossRef]
- Lloyd’s Register and UMAS. Techno-Economic Assessment of Zero-Carbon Fuels; Lloyd’s Register and UMAS: London, UK, 2020. [Google Scholar]
- Horvath, S.; Fasihi, M.; Breyer, C. Techno-economic analysis of a decarbonized shipping sector: Technology suggestions for a fleet in 2030 and 2040. Energy Convers. Manag. 2018, 164, 230–241. [Google Scholar] [CrossRef]
- Mao, X.; Rutherford, D.; Osipova, L.; Comer, B. Refueling Assessment of a Zero-Emission Container Corridor between China and the United States: Could Hydrogen Replace Fossil Fuels? International Council on Clean Transportation: Washington, DC, USA, 2020. [Google Scholar]
- Imhoff, T.B.; Gkantonas, S.; Mastorakos, E. Analysing the Performance of Ammonia Powertrains in the Marine Environment. Energies 2021, 14, 7447. [Google Scholar] [CrossRef]
- Smith, J.R.; Gkantonas, S.; Mastorakos, E. Modelling of boil-off and sloshing relevant to future liquid hydrogen carriers. Energies 2022, 15, 2046. [Google Scholar] [CrossRef]
- Kim, K.; Roh, G.; Kim, W.; Chun, K. A Preliminary Study on an Alternative Ship Propulsion System Fueled by Ammonia: Environmental and Economic Assessments. J. Mar. Sci. Eng. 2020, 8, 183. [Google Scholar] [CrossRef] [Green Version]
- Korberg, A.; Brynolf, S.; Grahn, M.; Skov, I.R. Techno-economic assessment of advanced fuels and propulsion systems in future fossil-free ships. Renew. Sustain. Energy Rev. 2021, 142, 110861. [Google Scholar] [CrossRef]
- ONZE. Stowage Factor. ONZE. Available online: https://www.onze.lt/en/cargo-transport-by-sea/stowage-factor/#:~:text=The%20stowage%20factor%20is%20calculated%3A%20one%20large%20ton,load%20one%20long%20tonne%20of%20a%20given%20load (accessed on 10 March 2022).
- Stolz, B.; Held, M.; Georges, G.; Boulouchos, K. Techno-economic analysis of renewable fuels for ships carrying bulk cargo in Europe. Nat. Energy 2022, 7, 203–212. [Google Scholar] [CrossRef]
- Lloyd’s Register. Carbon Intensity Indicator. Lloyd’s Register, LR. Available online: https://www.lr.org/en/carbon-intensity-indicator/#:~:text=The%20Carbon%20Intensity%20Indicator%20%28CII%29%20is%20a%20rating,above%205%2C000%20gross%20tonnage%20%28GT%29%20and%20trading%20internationally (accessed on 30 May 2022).
- DNV. CII—Carbon Intensity Indicator. DNV. Available online: https://www.dnv.com/maritime/insights/topics/CII-carbon-intensity-indicator/index.html (accessed on 24 June 2022).
- Marine Optima. Maean Helen. Marine Optima. Available online: https://app.maritimeoptima.com/vesselcenter/vessels/9779381?tab=public-description (accessed on 1 January 2022).
- VesselFinder. MARAN HELEN Crude Oil Tanker, IMO 9779381. Available online: https://www.vesselfinder.com/vessels/MARAN-HELEN-IMO-9779381-MMSI-241491000 (accessed on 1 January 2022).
- Watson, D. Practical Ship Design; Elsevier Ocean Engineering Book Series; Elsevier: Amsterdam, The Netherlands; London/Oxford, UK; New York, NY, USA; Shannon, Ireland; Paris, France; Tokyo, Japan, 1998; p. 531. [Google Scholar]
- Ventura, M. Estimation Methods for Basic Ship Design. Available online: http://www.mar.ist.utl.pt/mventura/Projecto-Navios-I/EN/SD-1.3.1-Estimation%20Methods.pdf (accessed on 5 April 2022).
- Gilbert, P.; Walsh, C.; Traut, M.; Kesieme, U.; Pazouki, K.; Murphy, A. Assessment of full life-cycle air emissions of alternative shipping fuels. J. Clean. Prod. 2018, 172, 855–866. [Google Scholar] [CrossRef]
- Wua, P.; Bucknalla, R. Marine propulsion using battery power. In Proceedings of the Shipping in Changing Climates Conference 2016, London, UK, 10–11 November 2016. [Google Scholar]
- DNV. The Carbon Intensity Indicator (CII)—A Closer Look; DNV: Høvik, Norway, 2021. [Google Scholar]
- Molland, A.F. The Maritime Engineering Reference Book—A Guide to Ship Design; Elsevier: Alpharetta, GA, USA, 2008. [Google Scholar]
- Law, L.C.; Azudin, N.Y.; Shukor, S.R.A. Optimisation of Operational Parameter and Economic Analysis of Amine Based Acid Gas Capture Unit. Chem. Eng. Trans. 2017, 56, 73–78. [Google Scholar] [CrossRef]
- Wärtsilä. Wärtsilä 46D Product Guide; Wärtsilä Finland: Helsinki, Finland, 2019. [Google Scholar]
- Virtualexpo Group. All Tema D.O.O. Products. Available online: https://www.nauticexpo.com/prod/tema-doo-39710.html (accessed on 6 April 2022).


| Category | Specification |
|---|---|
| Ship type | Containership |
| Fuel type | HFO (no CCS) |
| Cargo type (stowage factor in m3/ton) | General cargo (1.25) |
| Cargo density (kg/m3) | 800 |
| Voyage distance (n.m.) | 10,000 |
| Voyage speed (knots) | 14 |
| Deadweight capacity (DWT) | 156,458 |
| Crew (persons) | 25 |
| Engine power (kW) | 15,310 |
| Design Factors | Variation Range | Range of Cargo Attainment Rate (min/max) |
|---|---|---|
| Ship type | Three ship types: tanker, cargo ship, containership | 0%/1.74% |
| Fuel type | Eight fuel types: HFO (no CCS), HFO (CCS), LNG (CCS), bio-diesel, bio-MeOH, H2, NH3, electricity | 0%/−11.75% |
| Cargo type: stowage factor (m3/ton) | 0.5 m3/ton–4 m3/ton | 25.00%/−72.42% |
| Voyage distance (n.m.) | 2,000 n.m.–20,000 n.m. | 2.33%/−48.51% |
Publisher’s Note: MDPI stays neutral with regard to jurisdictional claims in published maps and institutional affiliations. |
© 2022 by the authors. Licensee MDPI, Basel, Switzerland. This article is an open access article distributed under the terms and conditions of the Creative Commons Attribution (CC BY) license (https://creativecommons.org/licenses/by/4.0/).
Share and Cite
Law, L.C.; Mastorakos, E.; Evans, S. Estimates of the Decarbonization Potential of Alternative Fuels for Shipping as a Function of Vessel Type, Cargo, and Voyage. Energies 2022, 15, 7468. https://doi.org/10.3390/en15207468
Law LC, Mastorakos E, Evans S. Estimates of the Decarbonization Potential of Alternative Fuels for Shipping as a Function of Vessel Type, Cargo, and Voyage. Energies. 2022; 15(20):7468. https://doi.org/10.3390/en15207468
Chicago/Turabian StyleLaw, Li Chin, Epaminondas Mastorakos, and Stephen Evans. 2022. "Estimates of the Decarbonization Potential of Alternative Fuels for Shipping as a Function of Vessel Type, Cargo, and Voyage" Energies 15, no. 20: 7468. https://doi.org/10.3390/en15207468
APA StyleLaw, L. C., Mastorakos, E., & Evans, S. (2022). Estimates of the Decarbonization Potential of Alternative Fuels for Shipping as a Function of Vessel Type, Cargo, and Voyage. Energies, 15(20), 7468. https://doi.org/10.3390/en15207468