Abstract
This work presents the study of the compaction and unloading process wood post-production waste, i.e., oak sawdust. The sawdust was compacted employing the forces F = 5000, 10,000, 20,000, 30,000, 40,000 and 50,000 N. Each compacted sample was compressed so as to determine the force value Fc required for the destruction of the sample. For each compaction force, the coefficient of the friction value µ1 was determined for the sawdust–steel material pair, which was used in the construction of the sleeve and stamp compacting system employed in the study. The determined parameters of the compressive force Fc and the coefficient of friction µ1 as a function of the compaction force F enabled to determine the optimal process parameters. A proposed construction of the compacting unit with an electrical drive is provided in the following part of the work comprising a motor, gear wheels, cam and a compacting piston. The selection of the parameters for the compaction process and the drive is of key importance from the standpoint of its energy consumption, influencing the energy balance, i.e., the ratio of input process energy and the energy obtained from the manufactured briquette. For the purpose of selecting the drive system, a mathematical model was developed utilizing earlier results of experimental studies. This model enabled to determine the maximum torque value Ms necessary to drive the proposed compacting unit. As a result of the carried-out work, it was determined that the maximum compaction force F is not ideal, considering other process parameters and their influence on its performance, allowing to lower the maximum torque and power of the proposed compacting unit.
1. Introduction
Biomass is presently considered to be an alternative source of energy; after the necessary processing to achieve specific physical and mechanical properties, it is possible for the material to replace fossil fuels to a significant degree. Therefore, it is a strategic goal of the European Union member states to systematically increase the utilization of wood biomass for the purpose of power generation [1,2,3].
Different types of waste products from the agricultural industry, as well as the food industry and forestry, are used as solid, liquid or gas fuels. Waste products of the agricultural industry, such as straw and sawdust, can be used directly as fuel or processed into briquette or pellet, which can be used further for generating thermal or electrical energy.
Ben-Iwo and Manovic carried out an evaluation of the biomass resources (agricultural, forestry, urban waste, etc.) available in Nigeria, as well as the potential for biofuel production. The authors reviewed the scope of the biofuel conversion technology tested in that country, as well as the reports on their respective levels of technological readiness [4]. The work by Foust et al. analyzed the conversion process for the lignocellulose biomass conversion to ethanol fuel. The authors concluded that the biochemical and thermochemical conversion processes differ slightly in regard to their environmental impacts [5]. Kathuria et al. presented a study of the compaction process of rice husks, coffee husks, sawdust, ground nut shells and cotton stems. The above biomass materials were compacted under high temperature and pressure utilizing different methods [6]. Gebresas et al. presented a study of the compaction of sesame stem biomass for the purpose of the downstream fabrication of charcoal from the obtained briquette. The study showed that the compaction of sesame stems with an additive of clay allows to obtain charcoal with a good calorific value [7]. Kyauta et al. carried out a comparative study of pellet compaction processes used with corn cobs and peanut shells. The examination results for the process of burning demonstrated a higher calorific value of the peanut shell briquette [8]. A study of the palletization process for biomass materials such as miombo, peanut shells, pigeon peas and sickle bush was carried out by Henriksson et al. with the idea of developing an alternative to charcoal and fuelwood in Zambia. Studies have shown that both pigeon peas and sickle bush are characterized by a similar briquetting profile, and the resulting briquette material exhibits low moisture absorption [9]. Chevanan et al. carried out an examination of the compaction process, depending on the bulk density of biomass materials such as switchgrass, wheat straw and corn stover [10]. Obidziński carried out tests of compacting potato pulp. Studies have indicated that the solid fuel obtained from the pulp may be suitable for energy generation in large industrial facilities [11]. Stefan Frodeson et al. examined the effect of the moisture content in the compacted sawdust material obtained from pine, spruce and beech on the energy consumption of the compaction process. It was determined that, during compression with a low force value of 5000 N, the moisture content in the material does not affect the energy requirement to carry out the compaction process. The same is not true if a higher force value is used in the compaction process. Furthermore, the researchers concluded that the moisture content has a major effect on biomass containing polysaccharides, which is reflected in the compaction process [12]. Dan Bergström et al. carried out studies of pine sawdust compaction. The obtained results demonstrated that the distribution of particle sizes had an insignificant effect on the power consumption and the compression strength of the obtained pellets [13].
Briquettes and pellets are obtained, among others, in the process of piston compaction. This process is commonly employed in the metallurgical industry, pharmaceutical industry, automotive industry, etc. [14,15]. The piston compaction process of biomass, including sawdust and straw, has become an object of interest for numerous researchers. Jaya Shankar Tumuluru et al. examined different compaction systems and their suitability, including, among others: pelleting machines, dicers, screw extruders, piston presses, roller presses, tablet presses and agglomerators. Such devices are used worldwide to obtain uniform structural, physical and chemical parameters of briquetted and pelleted biofuels [16]. Wilczyński et al. presented the study of the compaction process in the piston–sleeve system of pine sawdust, at the same time simulating the process in Abaqus software using the Drucker-Prager-Cap model [17]. The work [18] by Wilczyński et al. demonstrated the examination of the piston compaction process of triticale straw in a piston–sleeve system with diameters Ø30–80 mm with a gradation of 10 mm, as well as under various temperature conditions: 25, 50, 100, 150 and 200 °C. Studies have shown that the highest degree of compaction is achieved for the piston and sleeve system diameters of Ø30, Ø40 and Ø50 mm at process temperature 200 °C. The work [19] by Wilczyński et al. studied the piston compaction process of post-fermentation dregs and coconut material as a function of different moisture values of these materials. The study also determined the coefficient of friction values for steel and the above-mentioned materials as a function of temperature. Research has demonstrated a decrease in compaction of these materials as the moisture content increases, as well as a tendency for the coefficient of the friction value to decrease as the compaction process temperature increases. Talaśka et al. presented a study of the compaction process characteristic utilizing the screw press, focusing on the construction parameters of the briquette screw press and presenting their own patented design for the torque meter on the working part of the briquette press [20]. The work [21] by Wilczyński et al. examined the compaction process of pine sawdust with moisture contents of 10% and 20%. Based on the experimental study, the influence of the compaction process parameters on the final briquette density, Youngs modulus, relaxation, energy consumption and force required for compaction were determined; the process parameters included: compressive stress, process temperature and biomass material moisture. In order to determine the above-mentioned characteristics, the sawdust material underwent the compaction and unloading process and tri-axial compression, and the resultant briquette was subject to axial compression and shearing, utilizing patented study instrumentation of the authors’ own design. The performed experimental studies enabled the determination of the best compaction process parameter values considering the best possible briquette characteristics from the standpoint of its storage, transportation and use as a sustainable source of energy. The highest briquette strength was achieved with a compressive stress of 150 MPa, temperature 150 °C and sawdust moisture content of 10%. The carried-out research enabled to develop a digital model of the compaction process based on the Drucker-Prager-Cap model used to simulate the process without the need to carry out experimentation. The digital model further enables to formulate the guidelines for the newly developed designs for the working units of compaction equipment. Tang et al. [22], in their work, presented an examination of the palletization process of poplar material that underwent prior fragmentation. A comparative study was carried out for the mechanical characteristics of the pellet subject to steam treatment and otherwise. A general increase of strength by 50% was observed in the pellet after additional steam treatment. Shang et al. [23] carried out an examination of the pelleting process of pine sawdust with a canola oil additive and otherwise. This process was carried out at temperatures of 250 and 280 °C. The study determined that the calorific value of pellets roasted at higher temperatures is higher. Fasina et al. examined the palletization process for switchgrass. Afterwards, the physical characteristics of the pellets were determined. It was established that the bulk density, particle density, strength and hardness of the pellets were all materially affected by the moisture content [24]. On the other hand, Adapa et al. carried out the examination of piston compression of such biomass materials as barley, canola (oilseed rape), oat and wheat straw. The moisture content of the tested materials was 10%. The compaction was carried out by subjecting the materials to pressure values of 31.6 MPa, 63.2 MPa, 94.7 MPa and 138.9 MPa. The authors ascertained that the total energy characteristic for these materials was similar [25]. The study carried out by Tumuluru [26] utilized a pelleting machine with a flat die, followed by the analysis of the characteristics of the resultant biofuel. This led to the final conclusion that the moisture content of the batch, followed by preheating and the rotational speed of the pellet machine die, constitute the interrelated process variables influencing the moisture content, single unit density and stability of the pellets.
The above-mentioned researchers were devoted to the study of the compaction process, utilizing research stations of their own design that allowed to register a number of the parameters involved. For the compaction process to produce materials with the required physical and chemical characteristics, it is necessary to examine the characteristics of the biomass in order to select the correct method of compaction together with the process parameters (e.g., temperature, compaction force, biomass humidity and degree of fragmentation). The numerous essential aspects of this process have been touched upon in numerous other works. I. Relova et al. analyzed the effect of multiple factors of the compaction process of the biomass in the form of bark. Studies have indicated that the compaction force is the parameter with the highest influence on the characteristics of the produced fuel, immediately followed by the humidity and particle size [27]. Wolfgang Stelte et al. studied the process of compaction of beech, spruce and straw waste. As a result, it was determined that the increase in pellet strength is achieved with the increase in process temperature, and the highest pellet strength is produced from waste wood [28].
Carly Whittaker and Ian Shield examined the influence of humidity and particle size on pellet quality. Based on the results obtained, it was determined that the high lignin content, optimum humidity and high temperature of the pelletizing process have a positive effect on the strength of the obtained biofuel [29]. Similar conclusions were drawn based on their own research carried out by Maria Teresa Carone. The author and coauthors determined that a high process temperature, low humidity content and small particle size allow to obtain good quality pellets [30]. Another study of the palletization process for poplar chippings and pine sawdust, as well as the mixture of these materials, including various additives, was carried out by Esperanza Monedero. The results demonstrated a positive effect on the process and pellet quality achieved via the addition of lignosulfonates [31].
Based on numerous studies by many researchers, one can conclude that the main factors influencing the strength and stability of the agglomerate include: the type of compressed biomass material (materials) and humidity content, as well as the particle size and distribution; process temperature and additional components such as a binder or other additives, as well as compaction process parameters (temperature, size of the compressing die, die transverse speed, etc.) [32,33]. Owing to the fact that the particle size influences the quality of the aggregate, the biomass material fragmentation process and its course are of key importance for the compaction [34,35].
Considering that fossil fuels are still very important in energy generation, the matter is of interest to numerous researchers [36,37].
This work presents the examination of the biomass compaction process for oak wood dust. Laboratory studies have utilized an agglomeration testing station of the authors’ own design used to study the strength of the fabricated briquette, depending on the compaction force F used on the material. Furthermore, the study allowed to determine the values of the coefficient of friction µ for the sawdust–steel material pair as a function of the compressive force F. This enabled to determine the optimal process parameter values in order to achieve the highest possible compressive strength of the obtained briquette, as well as to minimize the value of the coefficient of friction µ for the sawdust–steel material pairing, which has a direct result on the power consumption of the compaction process. Further in this work, the results of the experiment are presented together with the conclusions. Considering the obtained results, a solution was proposed for the kinematic structure of the drive system employed in the compaction device, utilizing driver elements of a similar type as the ones used in the study. Based on the values obtained experimentally and subject to multicriteria analysis, a mathematical model was derived to determine the torque Ms of the electrical drive system for the compacting unit, allowing for an optimal selection thereof. To date, there has been a dearth of research works focusing on the energy consumption aspect of the compacting unit. The energy consumption of the electrical drive of the compacting unit has the most significant influence of the energy balance of the process. On the one hand, we have a loose sawdust biomass, with an electrically driven compacting system on the other. The amount of electrical energy that is used or, strictly speaking, the less energy is consumed, the more sustainable the biofuel resulting from the compaction process. The energy consumption of the compaction process was studied by Bembenek [38], and the author examined the influence of the briquette volume on the process of energy consumption, whereas the work by Janewicz et al. [39] studied the effect of electrical energy consumption as a function of the device rotational speed, as provided in Figure 5 the above-mentioned work. Vaneck Bot et al. [40] examined the compaction process of coconut husks, rattan waste, sugar cane, bagasse and banana peel, focusing on the energy balance of the process for the biomaterials of this type. Among the results, it was noted that rattan waste, coconut husks, bagasse and banana peel briquettes require, respectively, 0.78 kWh/kg, 0.75 kWh/kg, 1.46 kWh/kg and 2.60 kWh/kg of energy. In summary, similar publications are scarce, and the determination of the energy consumption of the compaction process is crucial in regards to the final judgement as to the economic feasibility of biofuel production through compaction.
2. Materials and Methods
2.1. Material Preparation
The material used in the study is oak sawdust obtained in the course of manufacturing parquet boards. The sawdust moisture content was determined using a Mettler Toledo scale dryer, with an average value from ten measurements equal to an average of 9% (Figure 1).
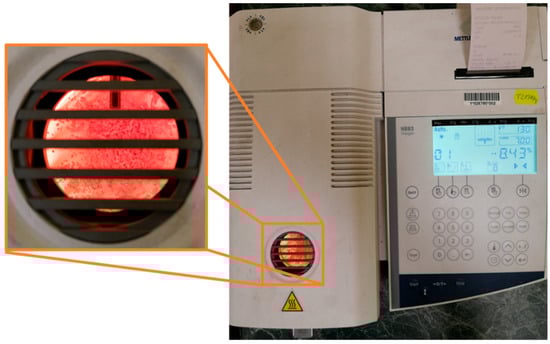
Figure 1.
A study of the moisture content of oak sawdust using a scale dryer.
2.2. Tests
The waste material, i.e., oak sawdust, underwent a series of tests (Figure 2) in order to obtain the correct process parameters for the purpose of optimization in Design-Expert software, followed by the modeling of the compaction system with an electrical drive. The testing was carried out at room temperature T ≅ 25 °C.
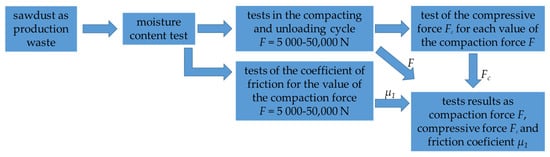
Figure 2.
Flowchart presenting the stages of the experimental studies.
For the experimental study of the compression–unloading cycle of oak sawdust, the MTS Insight material testing system was used. To this end, a stamp installed on the strength machine was used (Figure 2) with a diameter of d = 20 mm, moving inside a sleeve with the same internal diameter. Inside the sleeve, a weighted amount of sawdust was placed so that, for a given maximum (set for each test) compaction force F, the height h of the sample was achieved, as per the dependence h ≥ 1.5 d, which constituted a necessary condition for the correct performance of the compression test of the obtained sample in the compression–unloading cycle prior to the testing. This introduced testing sample was subject to loads of compaction forces F (Figure 2) with the values: 5000 N, 10,000 N, 20,000 N, 30,000 N, 40,000 N and 50,000 N. After achieving the assumed maximum compaction force (compressive stress), an unloading cycle was initiated. For each force value, the test was repeated ten times. This allowed to obtain a characteristic curve (Figure 3) of the variance in the force F under loads and unloaded as a function of the displacement of the strength machine crossbar.
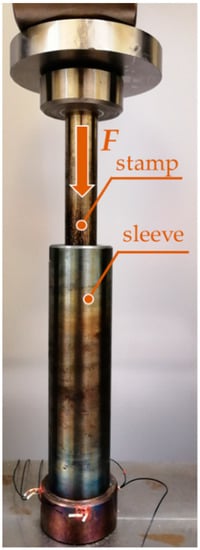
Figure 3.
General view of the testing station used in the examination of the compaction process.
Figure 4 provides an example characteristic curve for the variance of the compaction force F registered during compression with an applied force of F = 20,000 N.
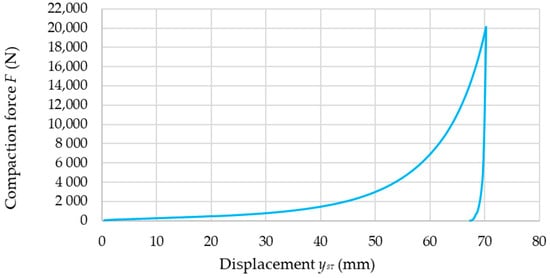
Figure 4.
Characteristic curve of the variance of the compaction force in the process of compaction–unloading of oak sawdust when compressed with a force of F = 20,000 N.
Subsequently, each obtained sample in the form of compacted oak sawdust was subject to axial compression in order to determine the maximum value of the compressive force Fc. This served to determine the group of samples in the form of briquette with the highest strength, which is advantageous from the standpoint of the storage and transportation of this type of biofuel.
A general view of the sample before and immediately after compression is provided in Figure 5.
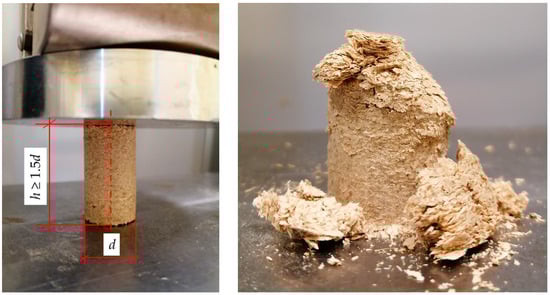
Figure 5.
General view of the compacted sawdust sample to be subject to the axial compression force Fc (on the left), and a view of the destroyed sample (on the right).
Figure 6 provides an example characteristic curve of the variance in the compressive force Fc, on the sample of the already compressed oak sawdust.
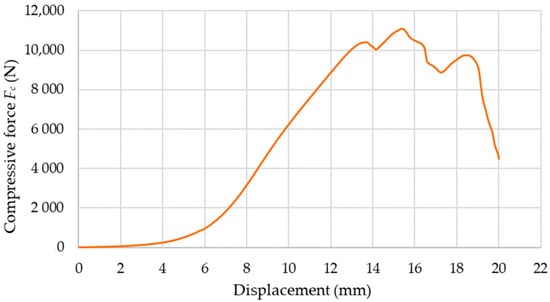
Figure 6.
Characteristic curve of the compressive force Fc variance applied to oak sawdust obtained during compression with a force F = 20,000 N.
In the following stage, the coefficient of friction was examined for the sawdust and the steel plate using a testing station, as provided in Figure 7. This testing station was used to determine the coefficient of friction for the material pair of oak sawdust–steel plate (representing the sleeve material in which the examined biomaterial was tested). In the course of testing, the sawdust was compacted with a hydraulic actuator with a force of F, with a steel plate being moved in the direction of the sample with a second horizontal hydraulic actuator, simultaneously measuring the force necessary to move the steel plate to determine the frictional resistance Ff. These force values were used to establish the value of the coefficient of the friction μ1. For every value of the compressive force F, the test was repeated ten times.
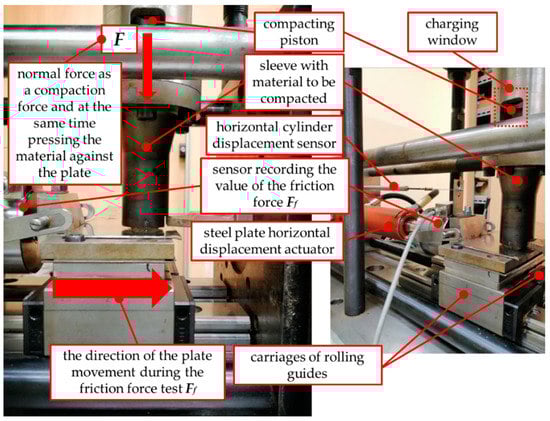
Figure 7.
General view of the testing station for the coefficient of friction µ1 of oak sawdust on a steel plate.
Figure 8 shows an example characteristic curve for the variance of the frictional force Ff.
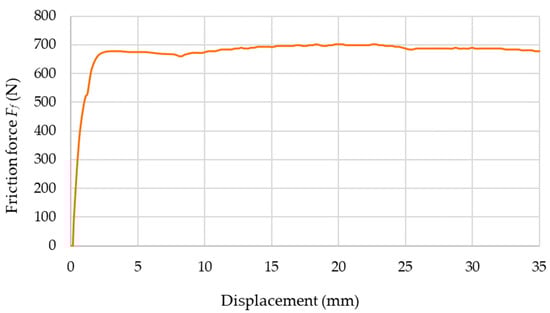
Figure 8.
Example characteristic curve for the variance of the frictional force Ff when compacting the sawdust with a force F = 20,000 N.
The obtained results allow to juxtapose two characteristics. The first one is the characteristics of the variance of the compressive force Fc as a function of the compaction force, and the second is the characteristics of variance of the coefficient of friction µ1 as a function of the compaction force F. Both characteristic curves are provided in Figure 9.
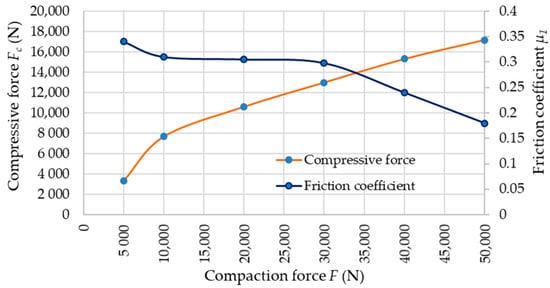
Figure 9.
The characteristics of variance in the compressive force Fc for the oak sawdust sample, and the values of the coefficient of friction μ1 as a function of the compaction force F.
As per Figure 9, the characteristic curve of variance of the coefficient of friction μ1 is a cofunction to the characteristic curve of the variance of the compressive force Fc. This facilitated the determination of the optimal parameters of the compaction process of oak sawdust, considering the criteria as provided in Table 1. To this end, Expert-Design software was used.

Table 1.
Breakdown of the optimization criteria for the compaction process parameters considering the compaction force F, coefficient of friction μ1 and the characteristics of the obtained briquette expressed as the force Fc.
Based on the above, the values of the forces F, Fc and the coefficient of friction μ1 were selected for which the criteria as provided in Table 1 were met. These parameter values were the basis for the suggested design of the electrical drive system for the compacting unit stamp–sleeve assembly, together with its mathematical model, enabling to select the electrical motor based on the torque value Ms derived from the model. The parameter values are as follows: F = 34,000 N, Fc = 13,500 N and the coefficient of friction μ1 = 0.25. For such parameters, the torque Ms of the electrical motor driving the stamp–sleeve compacting unit was determined utilizing Lagrange equations of the second kind.
In order to validate the optimization as provided above, ten test attempts were carried out for sawdust compression–unloading cycles with a force of F = 34,000 N, followed by the compression of the obtained sample for the purpose of determining the force Fc. Example characteristic curves of the change in the compaction force F and compressive force Fc are provided in Figure 10 and Figure 11.
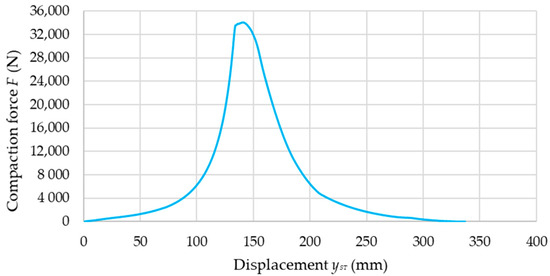
Figure 10.
Characteristic curve of the variance in the compaction force in the course of the compaction–unloading cycle of oak sawdust when compacted with a force F = 34,000 N.
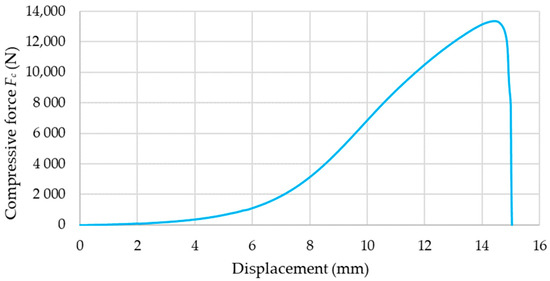
Figure 11.
Characteristic curve of the variance in the compressive force Fc of the oak sawdust sample obtained under compaction with a force F = 34,000 N.
3. Discussion
For the purpose of selecting an optimal electrical motor to drive the compacting unit for the stamp–sleeve assembly, a kinematic diagram for this system was developed as provided in Figure 12.
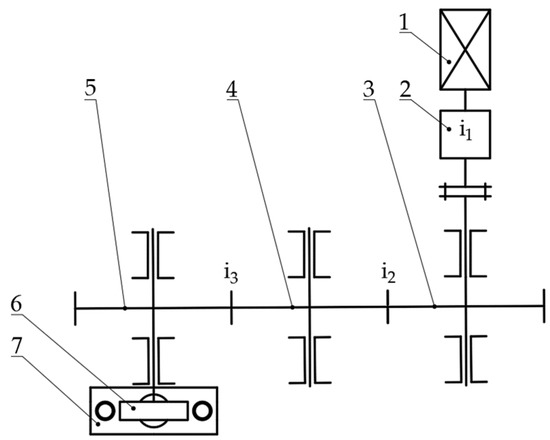
Figure 12.
Kinematic diagram for the drive system of the stamp–sleeve compacting unit assembly, where: 1—electrical motor, 2—reduction gearbox, 3—gear wheel 1, 4—gear wheel 2, 5—gear wheel 3, 6—cam, 7—stamp–sleeve compacting unit with guides and pressure springs and i1—gear ratio of the gearbox connected directly to the motor.
The diagram provided above is for illustrative purposes, indicating the basic members of the drive system of the compacting unit assembly. It comprises electrical motor 1 connected directly to reduction gearbox 2 with a gear ratio of i1, which will be selected based on the solution derived from the Lagrange equations (Figure 12). The output shaft of gearbox 2 is connected to a shaft with gear wheel 3 by a coupling. Gear wheel 3 connects to gear wheel 4 with the same number of teeth. A similar connection is provided for gear wheels 4 and 5. Hence, the gear ratios are i2 = i3 = 1. The shaft with gear wheel 5 also provides the mounting for cam 6, which, on rotation, effects the linear motion of stamp assembly 7 during the compaction of the biomass in the compacting sleeve (Figure 12). Figure 13 provides an illustrative spatial model of compacting unit assembly with an electrical drive.
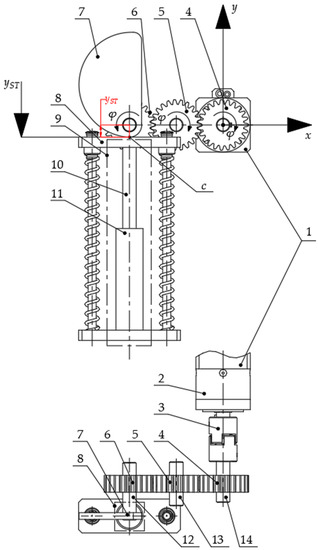
Figure 13.
Kinematic diagram of the drive system for the stamp–sleeve compacting assembly, where: 1—electrical motor; 2—reduction gearbox; 3—coupling; 4—gear wheel 1; 5—gear wheel 2; 6—gear wheel 3; 7—cam; 8—upper plate moving along the guides; 9—stamp–sleeve compacting unit with guides and pressure springs; 10—stamp; 11—sleeve; 12, 13 and 14—shafts for mounting gear wheels 1, 2 and 3; i1—gear ratio of the gearbox directly connected to the motor; i2 = i3 = 1—the gear ratios of paired gear wheels; yST—stamp displacement and φ—cam rotation angle.
The general form of the Lagrange equation is as follows:
where: Qj = Ms − (Ms—the sought reduction gear torque and —moment of the compaction force F in relation to the origin point, Figure 13); Qjp—potential energy derivative along the generalized coordinate φ and QjR—component related to the dissipation of energy, i.e., in the discussed case, it is the moment of friction MT between the surface of the cam and the stamp.
The geometry of cam 7, as in Figure 13, was designed so that the stroke of stamp 10 yST is sufficient to achieve the compaction force value of F = 34,000 N (Table 1, Section 2.2). The value of yST is determined on the basis of experimental studies in which the stamp had to travel a specific path during compaction. In order to achieve the specified (assumed) displacement value for the stamp yST = 120 mm, the cam must perform a rotation with the angle value of φ = 175°, with the rotation starting at the connection point c and ending at the connection point c′ (Figure 14). Therefore, the generalized variable in each term of the Lagrange equations is the cam rotation angle φ, whereas the same rotation angle value shall be applied to gear wheels 6, 5 and 4; shafts 12, 13, 14 and motor reducer 2 (Figure 13). Considering the above, the stroke value for stamp 10 yST was made into a variable as a function of the cam 7 rotation angle φ variance (Figure 13) in the following Equation (2):
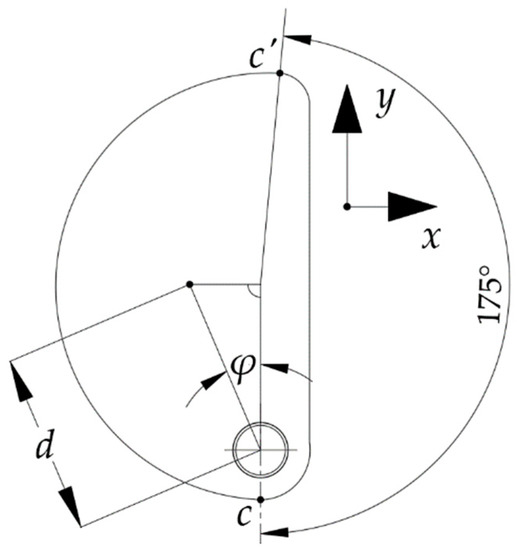
Figure 14.
Illustrated definition of the length d for the purpose of determining the moment of inertia of the cam, as well as two extreme position points of the cam during its rotation c (initial point) and c’ (final point).
Equation (2) is the equation of the regression curve for the characteristic of the stamp displacement variation yST, which is directly caused by the rotation of cam 7 (Figure 13), where the value of yST is equal to the segment comprising the distance between the contact point of the cam c and the press and the axis of the rotation of cam 7 for the given value of the angle of rotation φ for this cam (Figure 13 and Figure 14).
In order to calculate the individual derivatives of the kinetic energy Ek, the following dependence was determined:
where IM = 0.00072 (kg·m2) stands for the moment of inertia of electrical motor 1; IG = 0.000045 (kg·m2) is the moment of inertia of reduction gearbox 2 (Figure 13); ICl1 = ICl2 = 0.057 (kg·m2) is the moment of inertia of each hub of jaw coupling 3 selected for the purpose of transferring the correct torque for the actuation of the compacting unit; ICl3 = 0.00013 (kg·m2) is the moment of inertia of the elastomer insert of jaw coupling 3 (Figure 13); IW1–3 = 0.042 (kg·m2) stand for moments of inertia for gear wheels 4, 5 and 6; IS1–3 = 0.0002681 (kg·m2) are moments of inertia for shafts 12, 13 and 14, on which the gear wheels are installed (Figure 13); ICA = 0.00566 (kg·m2) is the moment of inertia of cam 7 forcing the motion of stamp 10 (Figure 13) and
is the angular velocity expressed in (rad/s). The above values constitute the parameters of components selected from the manufacturer’s catalog (motors and coupling), as well as gathered from the mechanical characteristics of coupling and gear wheel models. All the above-mentioned components were initially selected on the basis of the estimated torque value necessary to initialize the driving system, together with the cam for the purpose of compacting biomass present in the sleeve with a force F = 34,000 N, obtained on the basis of optimization (Table 1). The moment of inertia ICA was determined on the basis of Steiner’s theorem, following the below dependence:
where ICA0 = 0.00186 (kg·m2) is the moment of inertia of cam 7 relative to its center of gravity, mCA = 0.0887 (kg) is the mass of the cam and d = 0.06545 (m) is the distance between the center of gravity of the cam and its axis of rotation, which is determined as a resultant of two lengths measured along axes x and y of the coordinate system (Figure 13 and Figure 14).
Referring to Dependence (3), mpl = 0.653 (kg) is the mass of plate 8 on which stamp 10 is affixed (Figure 12), mST = 0.464 (kg) is the mass of stamp 10 in Figure 13 and V is the velocity of plate 8 and stamp 10, which is a derivative in the function of the stamp stroke time yST expressed in Equation (5):
In the next step, Derivative (6) of the kinetic energy Ek as a function of the cam rotation angle φ was established:
Equation (7) provides the derivative of kinetic energy Ek as a function of the change of the rotation angle in time :
Equation (8) provides the derivative as a function of time, from Derivative (6) of the kinetic energy expressed in Equation (7):
where: —is the angular acceleration, expressed as rad/s2.
In the subsequent step, the dependence on a potential energy value was determined and expressed as follows (9):
where g stands for gravitational acceleration, and d·cos φ is the vertical component of the distance between the center of gravity of cam 7 and its axis of rotation (Figure 14).
Equation (10) is the derivative of potential energy Ep as a function of the angle of rotation φ of cam 7 (Figure 13):
In the next step, the dependence expressing the component associated with energy dissipation QjR, which constitutes the frictional force torque Ff, its vector is tangent to the curvature of the cam and simultaneously perpendicular to the axis of stamp 10 (Figure 13). It can be expressed as in the dependence below (11) (Figure 15):
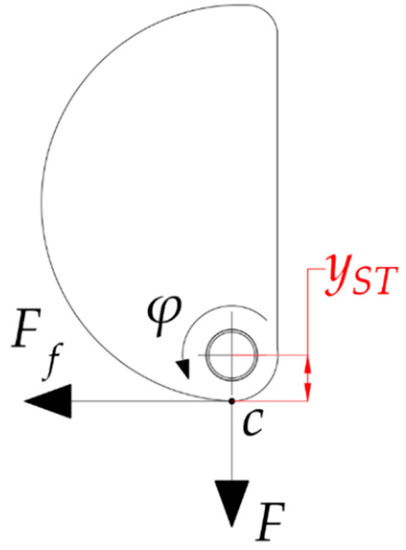
Figure 15.
The distribution diagram of forces on the cam, where compaction force F is the normal of the frictional force Ff on the cam curvature surface and the stamp, whereas the product of the frictional force Ff and the arm yST is equal to the frictional torque MT.
The functions of variance of the compaction force F were determined on the basis of the regression curve equation of the characteristic of the force variance achieved in the experimental study, whereas the variance of this force F was presented as a function of the angle of rotation φ of cam 7 (Figure 13) of the compacting unit.
For the two sections of the curve provided in Figure 16—specifically, the section colored blue and the section colored red—regression curves were established (Figure 17). The separation of the characteristic curve into two sections facilitated an accurate matching of the regression curves for each of them, as evidenced by the relatively high value of the coefficient of determination R2, which, at the same time, facilitated the derivation of the compaction force value F from the developed equations burdened with a low degree of inaccuracy. The equations for these curves were employed to determine the value of the frictional force Ff as a function of the cam rotation, as a component value for the moment of friction MT, Equation (11) (Figure 15).
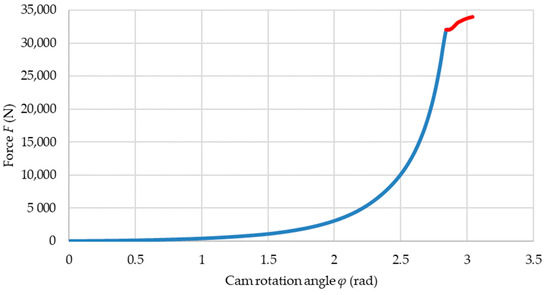
Figure 16.
Characteristic curve for the variance of the compaction force F obtained from experimental studies as a function of the rotation angle of cam 7 (Figure 13).
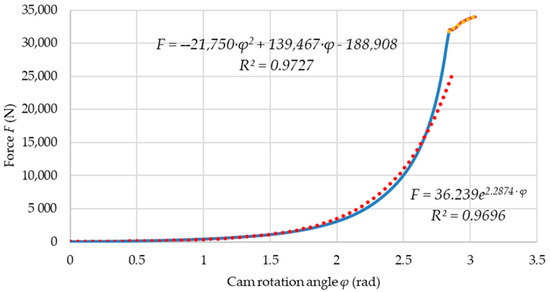
Figure 17.
Regression curves for the two highlighted sections of the characteristic of variance of the compaction force F obtained on the basis of the experimental results as a function of the rotation angle of cam 7 (Figure 13).
In the next step, the dependence to calculate the Qj component of Lagrange’s equation was derived:
where: Ms is the sought torque value of the drive system, i.e., motor 1 and reduction gearbox 2 (Figure 13), which actuates the rotational motion of gear wheels 4, 5 and 6, together with compacting unit cam 7 (Figure 13). The component of Equation (12), expressed as constitutes the torque of the compaction force F in relation to the origin point of the coordinate system of the compaction unit constituting the axis of the electrical engine (Figure 13); it can be expressed with the following dependence:
The derivative of the stamp displacement yST as a function of the cam rotation angle can be expressed as the following Equation (14):
The compaction force value F was established on the basis of the regression curve equations of the two highlighted sections of the characteristic curve of the compaction force F as a function of the cam rotation angle, as provided in Figure 17.
Finally, the sought torque value Ms was determined, which is the main parameter for selecting the drive system for the compaction unit illustrated in Figure 13. It includes an electrical motor and a reduction gearbox. Expanding the expression of the Lagrange equation provided in (1), we derive the following:
After transforming Equation (15), we derive (16):
Finally, we receive Equation (17):
Figure 18 shows a characteristic of variance of the torque Ms of the drive system of the compacting unit calculated on the basis of the solution from the Lagrange equation provided above (17).
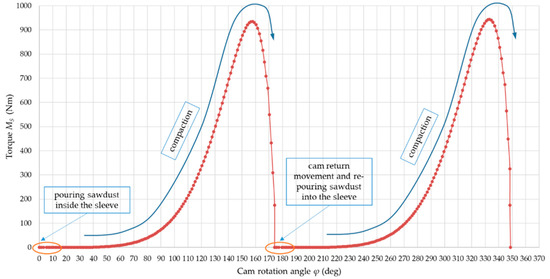
Figure 18.
Change of torque Ms required in the course of the compaction cycle for the biomass in the form of oak sawdust as a function of the cam rotation angle φ.
Figure 18 illustrates the change of the torque value Ms in the course of two example cycles of the compaction process, involving the action of filling the sleeve with sawdust, followed by compaction. After compaction, the product material is forced out of the other end of the sleeve, followed by the return movement of the cam, closing off the sleeve output end and refilling the sleeve with sawdust. In Figure 18, the ellipsis marks the section of the characteristic curve of the change in the torque Ms in which there was a momentary increase in the torque value by a small value in relation to the maximum. This is caused by the initial stage of motion of the drive motor, which has to set into motion all the revolving masses in the compacting unit. The subsequent phases of the compaction process cycle are illustrated in Figure 19.
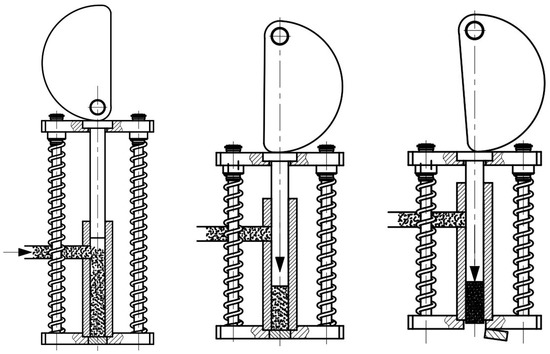
Figure 19.
The phases of a single sawdust compaction cycle. We begin with the stage of filling the sleeve, as visible on the left, followed by compaction and, finally, we have the last phase of forcing out the compacted material.
The initial stage of motion of the motor is set in the simulation of the Lagrange equation according to the below characteristic curve of the rotational velocity variance (Figure 20).
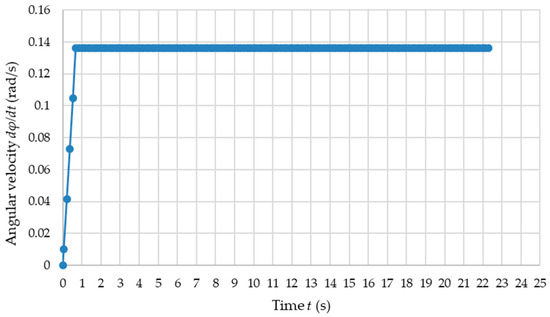
Figure 20.
The change of the set angular velocity over time.
The component of the Lagrange dependence with the largest value as the component of the sought motor torque value Ms is the (13) value as the torque of the compaction force F in relation to the assumed point of origin (Figure 13). For this component, an optimal value for the compaction force equal to F = 34,000 N was determined in the course of the experimental studies. This facilitates the lowering of the torque, as, otherwise, one might incorrectly assume that the maximum compaction force used in the experimental testing (F = 50,000 N) is the best value for the purpose of obtaining good physical and chemical characteristics of the produced biofuel. The higher the value of the compaction force, the higher the value of the component , together with the final torque value Ms. The component expressing energy dissipation QjR influences the torque value Ms as a result of the changing value of the coefficient of friction µ2. Changing this value for the material pairing of cam 7 and the upper surface of stamp 10 (Figure 13) may result in reducing that value. According to J. A. Collins [41], assuming the value of dry friction for the material pairing of the cam and stamp, i.e., steel–steel during a translation motion, the coefficient of friction shall assume a value in the range: µ2 = 0.1–0.42 for dry friction and µ2 = 0.03–0.12 for surfaces with applied lubricant. If a roller were to be installed in the upper part of stamp 10 (Figure 21), the coefficient of friction value would be in the range: µ2 = 0.001–0.003. Assuming the lower coefficient of friction values in the mathematical model for the discussed friction pair for the above mentioned coupling conditions for the surface of the cam and the stamp, the determined torque requirement for the motor Ms is between Ms = 1168 Nm for µ2 = 0.1 and Ms = 935 Nm for µ2 = 0.001.
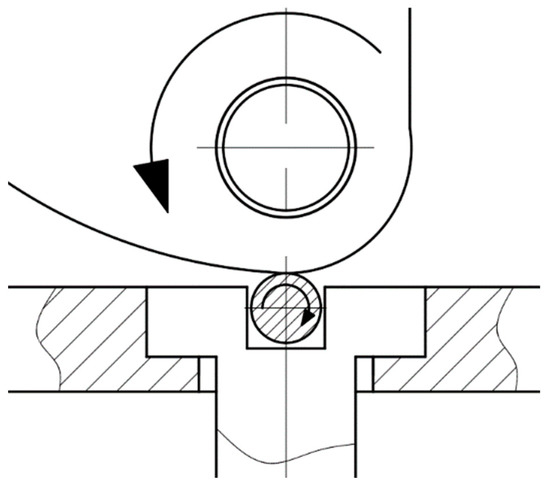
Figure 21.
Illustration of the concept of installing a roller in the upper part of the stamp for the purpose of reducing the value of the coefficient of friction µ2.
Figure 21 shows an illustrative example of an installed roller with the bearing to directly couple with the cam. This would allow a significant decrease in the resistance to the motion of the cam, resulting in a significant decrease in the coefficient of friction for this pair. This would be beneficial in decreasing the torque value Ms necessary to set in motion the drive system of the analyzed compaction unit. An example drive system proposed for this compacting device is gear–motor by NORD Drivesystems type SK 43—71SP/4 TF, with the torque value at the output shaft equal to M = 1043 Nm.
4. Conclusions
The present work presented the study of the biowaste compaction process for oak sawdust as a waste product in manufacturing parquet boards. An attempt was made to utilize such waste for the purpose of fabricating biofuel via compaction. In order to obtain the best possible physical and mechanical characteristics for such fuel in the process of compaction, the effect of the compaction force F on the value of the compressive force Fc (the destructive force from the standpoint of storage and transportation) was examined, together with the value of the coefficient of friction µ1. For these two answers, i.e., the strength of the sample and the coefficient of friction, an optimal value of the compaction force was determined. In the subsequent part, for the determined optimal parameters of the sawdust compaction process, a conceptual design of a compacting unit was proposed for which a drive torque value Ms was determined for the purpose of selecting a drive system comprising an electrical motor and a reduction gearbox. Based on the obtained results, the following main conclusions could be drawn:
- (1)
- Based on the results obtained in the experiment for the compressive force Fc and the coefficient of friction value, the optimal value of the compaction force F = 34,000 N was determined, for which the compressive force value was Fc = 13,500 N and the coefficient of friction was μ1 = 0.25.
- (2)
- A construction was proposed for a compaction unit (Figure 13) together with a drive system for which a system of Lagrange equations was developed for the purpose of determining the value of the drive torque Ms for an optimal value of the compaction force F.
- (3)
- The major influence on the value of the determined drive torque Ms is the compaction force F torque relative to the origin point of the Lagrange model. Therefore, the determination of the optimal compaction force value F = 34,000 N is justified and leads to a positive effect, a direct decrease of the sought torque value Ms.
- (4)
- The dissipation of energy in the friction pair of cam–stamp also effects the value of the torque Ms of the drive system; an alteration of the type of coupling between the surfaces of these components (Figure 13 and Figure 21) has a direct effect on the change in the value of the coefficient of the friction µ2, leading to a positive decrease in the required torque value Ms.
Author Contributions
Conceptualization, D.W. (Dominik Wilczyński), K.T. and D.W. (Dominik Wojtkowiak); methodology, D.W. (Dominik Wilczyński), K.T. and D.W. (Dominik Wojtkowiak); software, D.W. (Dominik Wilczyński), K.T., S.W. and K.W.; validation, D.W. (Dominik Wilczyński), K.T., D.W. (Dominik Wojtkowiak), S.W. and K.W.; formal analysis, D.W. (Dominik Wilczyński) and K.T.; investigation, D.W. (Dominik Wilczyński) and K.T.; resources, D.W. (Dominik Wilczyński); data curation, D.W. (Dominik Wilczyński) and K.T.; writing—original draft preparation, D.W. (Dominik Wilczyński) and K.T.; writing—review and editing, D.W. (Dominik Wilczyński), K.T., D.W. (Dominik Wojtkowiak), S.W. and K.W.; visualization, D.W. (Dominik Wilczyński) and K.T.; supervision, D.W. (Dominik Wilczyński) and K.T.; project administration, D.W. (Dominik Wilczyński) and K.T. and funding acquisition, D.W. (Dominik Wilczyński), K.T. and D.W. (Dominik Wojtkowiak). All authors have read and agreed to the published version of the manuscript.
Funding
This research was funded by the Polish Ministry of Science and Higher Education grant under no.: 0611/SBAD/0115.
Data Availability Statement
Not applicable.
Conflicts of Interest
The authors declare no conflict of interest.
References
- Siwale, W.; Frodeson, S.; Berghel, J.; Henriksson, G.; Finell, M.; Arshadi, M.; Jonsson, C. Influence on off-gassing during storage of Scots pine wood pellets produced from sawdust with different extractive contents. Biomass Bioenergy 2022, 156, 106325. [Google Scholar] [CrossRef]
- Tanger, P.; Field, J.L.; Jahn, C.E.; DeFoort, M.W.; Leach, J.E. Biomass for thermochemical conversion: Targets and challenges. Front. Plant Sci. 2013, 4, 218. [Google Scholar] [CrossRef]
- Ben-Iwo, J.; Manovic, V.; Longhurst, P. Biomass resources and biofuels potential for the production of transportation fuels in Nigeria. Renew. Sustain. Energy Rev. 2016, 63, 172–192. [Google Scholar] [CrossRef]
- Sims, R.E.H.; Mabee, W.; Saddler, J.N.; Taylor, M. An overview of second generation biofuel technologies. Bioresour. Technol. 2010, 101, 1570–1580. [Google Scholar] [CrossRef] [PubMed]
- Foust, T.D.; Aden, A.; Dutta, A.; Phillips, S. An economic and environmental comparison of a biochemical and a thermochemical lignocellulosic ethanol conversion processes. Cellulose 2009, 16, 547–565. [Google Scholar] [CrossRef]
- Kathuria, R.S. Using agricultural residues as a biomass briquetting: An alternative source of Energy. IOSR J. Electr. Electron. Eng. 2012, 1, 11–15. [Google Scholar] [CrossRef]
- Gebresas, A.; Asmelash, H.; Berhe, H.; Tesfay, T. Briquetting of charcoal from sesame stalk. J. Energy 2015, 2015, 757284. [Google Scholar] [CrossRef]
- Kyauta, E.E.; Adisa, A.B.; Abdulkadir, L.N.; Balogun, S. Production and Comparartive Study of Pellets from Maize Cobs and Groundnut Shell as Fuels for Domestic Use. Am. J. Eng. Res. 2015, 4, 97–102. Available online: https://www.ajer.org/papers/v4(01)/N04010970102.pdf (accessed on 31 August 2022).
- Henriksson, L.; Frodeson, S.; Berghel, J.; Andersson, S.; Ohlson, M. Bioresources for sustainable pellet production in Zambia: Twelve biomasses pelletized at different moisture contents. BioResources 2019, 14, 2550–2575. [Google Scholar] [CrossRef]
- Chevanan, N.; Womac, A.R.; Bitra, V.S.P.; Igathinathane, C.; Yang, Y.T.; Miu, P.I.; Sokhansanj, S. Bulk density and compaction behavior of knife mill chopped switchgrass, wheat straw, and corn stover. Bioresour. Technol. 2010, 101, 207–214. [Google Scholar] [CrossRef]
- Obidziński, S. Analysis of usability of potato pulp as solid fuel. Fuel Process. Technol. 2012, 94, 67–74. [Google Scholar] [CrossRef]
- Frodeson, S.; Henriksson, G.; Berghel, J. Effects of moisture content during densification of biomass pellets, focusing on polysaccharide substances. Biomass Bioenergy 2019, 122, 322–330. [Google Scholar] [CrossRef]
- Bergström, D.; Israelsson, S.; Öhman, M.; Dahlqvist, S.A.; Grefa, R.; Boman, C.; Wästerlund, I. Effects of raw material particle size distribution on the characteristics of Scots pine sawdust fuel pellets. Fuel Process. Technol. 2008, 89, 1324–1329. [Google Scholar] [CrossRef]
- Han, L.H.; Elliott, J.A.; Bentham, A.C.; Mills, A.; Amidon, G.E.; Hancock, B.C. A modified Drucker-Prager Cap model for die compaction simulation of pharmaceutical powders. Int. J. Solids Struct. 2008, 45, 3088–3106. [Google Scholar] [CrossRef]
- Brewin, P.R.; Coube, O.; Doremus, P.; Tweed, J.H. Modelling of Powder Die Compaction. In Modelling of Powder Die Compaction. Engineering Materials and Processes; Springer: London, UK, 2008. [Google Scholar] [CrossRef]
- Tumuluru, J.S.; Wright, C.T.; Hess, J.R.; Kenney, K.L. A review of biomass densification systems to develop uniform feedstock commodities for bioenergy application. Biofuels Bioprod. Biorefin. 2011, 5, 683–707. [Google Scholar] [CrossRef]
- Wilczyński, D.; Berdychowski, M.; Wojtkowiak, D.; Górecki, J.; Wałęsa, K. Experimental and numerical tests of the compaction process of loose material in the form of sawdust. MATEC Web Conf. 2019, 254, 02042. [Google Scholar] [CrossRef]
- Wilczyński, D.; Malujda, I.; Górecki, J.; Jankowiak, P. Research on the process of biomass compaction in the form of straw. MATEC Web Conf. 2019, 254, 05015. [Google Scholar] [CrossRef]
- Wilczyński, D.; Malujda, I.; Talaśka, K.; Długi, R. The Study of Mechanical Properties of Natural Polymers in the Compacting Process. Procedia Eng. 2017, 177, 411–418. [Google Scholar] [CrossRef]
- Talaśka, K.; Malujda, I.; Wilczyński, D. Agglomeration of natural fibrous materials in perpetual screw technique—A challenge for designer. Procedia Eng. 2016, 136, 63–69. [Google Scholar] [CrossRef][Green Version]
- Wilczyński, D.; Berdychowski, M.; Talaśka, K.; Wojtkowiak, D. Experimental and numerical analysis of the effect of compaction conditions on briquette properties. Fuel 2021, 288, 119613. [Google Scholar] [CrossRef]
- Tang, Y.; Chandra, R.P.; Sokhansanj, S.; Saddler, J.N. The Role of Biomass Composition and Steam Treatment on Durability of Pellets. BioEnergy Res. 2018, 11, 341–350. [Google Scholar] [CrossRef]
- Shang, L.; Nielsen, N.P.K.; Stelte, W.; Dahl, J.; Ahrenfeldt, J.; Holm, J.K.; Puig Arnavat, M.; Bach, L.S.; Henriksen, U.B. Lab and Bench-Scale Pelletization of Torrefied Wood Chips—Process Optimization and Pellet Quality. BioEnergy Res. 2014, 7, 87–94. [Google Scholar] [CrossRef]
- Colley, Z.; Fasina, O.O.; Bransby, D.; Lee, Y.Y. Moisture effect on the physical characteristics of switchgrass pellets. Trans. ASABE 2006, 49, 1845–1851. [Google Scholar] [CrossRef]
- Adapa, P.K.; Tabil, L.G.; Schoenau, G.J. Compaction characteristics of barley, canola, oat, and wheat straw. Biosyst. Eng. 2009, 104, 335–344. [Google Scholar] [CrossRef]
- Tumuluru, J.S. Effect of process variables on density and durability of pellets made from high moisture corn stover. Biosyst. Eng. 2014, 119, 45–57. [Google Scholar] [CrossRef]
- Relova, I.; Vignote, S.; Leo’n, M.A.; Ambrosio, Y. Optimisation of the manufacturing variables of sawdust pellets from the bark of Pinus caribaea Morelet: Particle size, moisture and pressure. Biomass Bioenergy 2009, 33, 1351–1357. [Google Scholar] [CrossRef]
- Stelte, W.; Holm, J.K.; Sanadi, A.R.; Barsberg, S.; Ahrenfeldt, J.; Henriksen, U.B. A study of bonding and failure mechanisms in fuel pellets from different biomass resources. Biomass Bioenergy 2011, 35, 910–918. [Google Scholar] [CrossRef]
- Whittaker, C.; Shield, I. Factors affecting wood, energy grass and straw pellet durability—A review. Renew. Sustain. Energy Rev. 2017, 71, 1–11. [Google Scholar] [CrossRef]
- Carone, M.T.; Pantaleo, A.; Pellerano, A. Influence of process parameters and biomass characteristics on the durability of pellets from the pruning residues of Olea europaea L. Biomass Bioenergy 2011, 35, 402–410. [Google Scholar] [CrossRef]
- Monedero, E.; Portero, H.; Lapuerta, M. Pellet blends of poplar and pine sawdust: Effects of material composition, additive, moisture content and compression die on pellet quality. Fuel Process. Technol. 2015, 132, 15–23. [Google Scholar] [CrossRef]
- Ishii, K.; Furuichi, T. Influence of moisture content, particle size and forming temperature on productivity and quality of rice straw pellets. Waste Manag. 2014, 34, 2621–2626. [Google Scholar] [CrossRef] [PubMed]
- Bitra, V.S.P.; Womac, A.R.; Igathinathane, C.; Miu, P.I.; Yang, Y.T.; Smith, D.R.; Chevanan, N.; Sokhansanj, S. Direct measures of mechanical energy for knife mill size reduction of switchgrass, wheat straw, and corn stover. Bioresour. Technol. 2009, 100, 6578–6585. [Google Scholar] [CrossRef]
- Xavier, C.A.N.; Moset, V.; Wahid, R.; Moeller, H.B. The efficiency of shredded and briquetted wheat straw in anaerobic co-digestion with dairy cattle manure. Biosyst. Eng. 2015, 139, 16–24. [Google Scholar] [CrossRef]
- Bitra, V.S.P.; Womac, A.R.; Chevanan, N.; Miu, P.I.; Igathinathane, C.; Sokhansanj, S.; Smith, D.R. Direct mechanical energy measures of hammer mill comminution of switchgrass, wheat straw, and corn stover and analysis of their particle size distributions. Powder Technol. 2009, 193, 32–45. [Google Scholar] [CrossRef]
- Jun Li, J.; Jankowski, R.; Kotecki, M.; Yang, W.; Szewczyk, D.; Blasiak, W.; Brzdekiewicz, A. Numerical Analysis of Loads Effect on Combustion Performance and NOx Emissions of a 220 MW Pulverized Coal Boiler. In Cleaner Combustion and Sustainable World. ISCC; Springer: Berlin/Heidelberg, Germany, 2011. [Google Scholar] [CrossRef]
- Nowak, D.; Dobski, T.; Slefarski, R.; Jankowski, R.; Magni, F. Experimental Studies of Crude Oil Combustion in a Top-Mounted Silo Combustor. In Proceedings of the ASME 2011 Turbo Expo: Turbine Technical Conference and Exposition, Vancouver, BC, Canada, 6–10 June 2011; pp. 269–275. [Google Scholar] [CrossRef]
- Bembenek, M. Exploring Efficiencies: Examining the Possibility of Decreasing the Size of the Briquettes Used as the Batch in the Electric Arc Furnace Dust Processing Line. Sustainability 2020, 12, 6393. [Google Scholar] [CrossRef]
- Janewicz, A.; Kosturkiewicz, B.; Hryniewicz, M. Comparative Tests of the Briquetting Process in New Asymmetrical Compacting Systems of Roller Presses (Badania porównawcze brykietowania w nowych asymetrycznych układach zagęszczania pras walcowych). Przemysł Chem. 2018, 8, 1363–1366. (In Polish) [Google Scholar] [CrossRef]
- Vaneck Bot, B.; Axaopoulos, P.J.; Sakellariou, E.I.; Sosso, O.T.; Gaston Tamba, J. Energetic and economic analysis of biomass briquettes production from agricultural residues. Appl. Energy 2022, 321, 119430. [Google Scholar] [CrossRef]
- Collins, J.A. Mechanical Design of Machine Elements and Machines a Failure Prevention Perspective; John Wiley and Sons, Inc.: Hoboken, NJ, USA, 2003. [Google Scholar]
Publisher’s Note: MDPI stays neutral with regard to jurisdictional claims in published maps and institutional affiliations. |
© 2022 by the authors. Licensee MDPI, Basel, Switzerland. This article is an open access article distributed under the terms and conditions of the Creative Commons Attribution (CC BY) license (https://creativecommons.org/licenses/by/4.0/).