Article

CFD Investigation on Movement Features of Hydrogen Bubble under Microgravity Environment

1
Institute of Refrigeration & Cryogenic Engineering, Xi’an Jiaotong University, Xi’an 710049, China
2
Shanghai Institute of Aerospace System Engineering, Shanghai 201109, China
*
Author to whom correspondence should be addressed.
Energies 2022, 15(20), 7528; https://doi.org/10.3390/en15207528
Submission received: 2 September 2022 / Revised: 27 September 2022 / Accepted: 7 October 2022 / Published: 12 October 2022
(This article belongs to the Special Issue Liquid Hydrogen Management and Application)

Abstract

:
A designed cryogenic upper stage adopted liquid hydrogen and liquid oxygen (LH2/LO2) as an aerospace propellant. During a zero-gravity coast period in space, the wall heat leakage into the delivery tube could induce liquid propellant evaporation and two-phase flow phenomenon, so that a bubble discharge operation must be employed prior to engine restart. In this study, a CFD approach was utilized to numerically study the bubble discharge behaviors inside the LH2 delivery tube of the upper stage. The bubble motion properties under two different schemes, including positive acceleration effect and circulation flow operation, were analyzed and discussed. The results showed that the boiled hydrogen bubbles could increase to the size of the tube inner diameter and distribute randomly within the entire tube volume, and that, in order for the bubble to spill upward under the acceleration effect, a higher acceleration level than the needed value of acquiring liquid–vapor separation inside the propellant tank should be provided. When creating an acceleration level of 10−3 g0, most of the bubbles could spill upward within 700 s. Significantly, the bubbles could not be completely expelled in the created acceleration condition since a number of small bubbles always stagnate in the bulk liquid region. In the circulation flow operation, the gas volume reduction was mainly attributed to two mechanisms: the vapor condensation effect; and bubble discharge effect. For the case with a circulation flow rate of 0.2 kg/s, a complete bubble discharge purpose was reached within 820 s, while a large bubble stagnation in the spherical distributor occupied a remarkable proportion of the total time. In addition, both the liquid flow rate and liquid subcooling exert important effects on bubble performance. When applying a high circulation flow, the gas volume reduction is mainly due to the inertial effect of liquid flow, but the bubble stagnation in the spherical distributor still affects the total discharge time. The liquid subcooling influence on the gas volume reduction is more significant in smaller circulation flow cases. Generally, the present study provides valuable conclusions on bubble motions inside a LH2 delivery tube in microgravity, and the results could be beneficial to the sequence design of engine restart for the cryogenic upper stage.

1. Introduction

Cryogenic propellant, owing to its incomparable advantages of high specific impulse and environmentally friendly features, has been selected as an aerospace propellant in many upper stage platforms. To execute a high-efficient orbit insertion of spacecraft, the rocket upper stage successively experiences a long-term zero-gravity coast period, a propellant reorientation process, and then an engine restart operation. For the cryogenic propellant, wall heat leakage in the coast period could bring about liquid evaporation as well as a two-phase flow phenomenon inside the propellant system. The lack of convection effect may cause boiled bubbles to stagnate at the bubble generation location or cause a random bubble distribution phenomenon over the entire propellant system. To avoid cryopump cavitation hazards, the existing bubbles must be discharged prior to engine restart, and a pure liquid supplement is a restricted condition for the engine works. Generally, a propellant reorientation is performed previously to realize liquid–ullage separation inside the propellant tank. In this situation, the induced buoyancy force affects the bubble motions inside the delivery tube as well. Moreover, a chilldown operation for engine turbopump is usually performed prior to engine ignition, and the liquid inflow through the channel also exerts an influence on the bubble movement. To develop a reliable design of propellant management sequence for the cryogenic upper stage, the bubble behaviors and the discharge features should be known beforehand.
Usually, the gas-liquid phase separation or the propellant reorientation inside the propellant tank is preferentially guaranteed. For example, the famous Centaur upper stage adopted a propellant settlement approach to separate liquid–vapor phases inside the tank, and an acceleration level of about 3 × 10⁻⁴ g0 was provided [1]. Blatt and Aydelott [2] and Groesbeck [3], respectively, reported the thrust design parameters for the Centaur platform. It was reported that during the propellant reorientation period, the large ullage deformed and moved towards the tank top region, and the separation performance could be represented by the ullage motion. For this issue, a few of studies had been conducted to reveal the detailed evolutions of the ullage interface. Der and Stevens [4] pointed out that the ullage movement during reorientation could not reach a steady state, but a reciprocating motion of ullage largely yielded a geyser phenomenon inside the tank. Marchetta and Roos [5] exhibited propellant positioning in microgravity through a three-dimensional (3-D) simulation. Dalmon et al. [6] also studied the ullage motion under external forces and microgravity conditions based on a direct numerical simulation. Ma et al. [7] numerically studied the gas–liquid separation performance by applying an electric field technique. Dhir et al. [8] and Kuhlman et al. [9] experimentally studied the bubble dynamics and bubble positions in microgravity by Kelvin force in virtue of NASA’s KC-135 parabolic flight aircraft. These results on ullage deformation and motion could provide guidelines for the design of gas–liquid phase separation inside the propellant tanks.
Under axial thrust effect, the bubbles generated inside the cryogenic delivery tube largely spill upward owing to the induced buoyancy force, and the bubble properties and discharging times are closely related to the created acceleration level. It was reported that S-IVB upper stage, the third stage of Saturn V, experienced dramatic temperature rises at different components in the coast period [10], so that liquid evaporation and two-phase flow could occur in the delivery system. To quench the structure components of the delivery system and to discharge the interior bubbles, a pump-driven circulation precooling approach was utilized prior to engine restart. Using this method, the bubbles might move and discharge under the joint effects of forced convection and induced buoyance. Understanding the bubble behaviors is beneficial to the chilldown operation design. However, the gas–liquid separation inside a propellant duct has been less frequently studied, and more work is necessary to explore the microgravity bubble mechanisms in order to assist the development of bubble management techniques.
In the design of cryogenic fluid management techniques, the bubble features inside a delivery tube and in the propellant tank should be considered, respectively, since the fluid volume could affect the bubble behaviors. For the bubble size issue, several scholars have focused on the microgravity bubble properties using theoretical and experimental approaches. Herman et al. [11] and Burke and Dunbar [12] found that the bubbles in microgravity could rise to a large size and appeared to have a nearly spherical shape. Colin et al. [13] showed that turbulence-induced coalescence and shear-induced coalescence effects could affect bubble size. Zhao et al. [14] observed that several large bubbles dominated the boiling heat transfer process. Actually, the boiled bubbles inside a cryogenic propellant duct appear to have bubble group behaviors, and the detailed variations are related to the duct structure, thermal condition, and force field. Performing a flight-based test faces great challenges, including high risk, high cost and measuring technique difficulties, and numerical approaches can be used to assist in the design as an alternative. However, the existing studies on bubble motion are largely devoted to single bubble behaviors in a bulk liquid or interactions among several bubbles. Wang et al. [15] performed a numerical study on bubble departure performance from different surfaces. Luo et al. [16] and De Bernardis [17] also conducted bubble rising simulations. Moreover, in the bubble simulations, the volume-of-fluid (VOF) method was frequently used to account for the bubble deformation and interface movement characteristics, including the cryogenic bubble features under different gravity conditions [18,19,20,21,22,23,24,25]. Other CFD platforms or new simulation methods, like moving mesh methods, OpenFOAM solver, in-home codes, Lattice Boltzmann Method (LBM), mesh-free method, and so forth, have been used in the bubble simulations [26,27,28,29,30,31,32,33,34,35,36].
Only a few typical situations concerning pipe bubble features have been investigated using numerical approaches. Liu et al. [37] numerically studied the gas–liquid two-phase flow event inside a horizontal pipe and under different gravities. The results indicated that the gravity level had significant effect on the two-phase flow pattern, and the pattern transition appeared as a result of bubble coalescence. Darzi and Park [38] analyzed the gravity effect on hydrodynamics of Taylor bubble. Xu et al. [39] performed a numerical simulation on R134a flow boiling through a small tube. Mao et al. [40,41,42] investigated geyser phenomena through a CFD tool, and the flow instability event induced by the geyser life cycle was revealed. Dhir et al. [8] suggested a 2-D model could be used in the bubble dynamics simulation in microgravity.
In this study, a CFD approach was used to numerically investigate the bubble behaviors inside a LH2 tube, and the bubble generation and distribution, bubble movement characteristics under axial acceleration effect and circulation flow operation are presented and analyzed. Besides, phase change effect is involved in the numerical simulations, and the bubble discharge performance in different propellant management schemes are compared. It is believed that the present study could provide reliable theoretical guidelines for the design of propellant management sequences in the cryogenic upper stage.

2. Physical Model

Figure 1 displays a LH2 delivery pipe structure for the cryogenic upper stage. For this upper stage concept, the LH2 tank locates above the LO2 tank, and two main engines are used to provide space propulsion. This delivery tube adopts a vertical tunnel channel structure, in which the LH2 tube passes through the center of the LO2 tank and then connects to the two engines by two branch tubes. A spherical distributor is utilized to realize the LH2 propellant transferring into the two engines equally. This tunnel channel scheme was also reported by Fisher [43]. Table 1 presents the main parameters of the delivery tube structure, which are provided by the upper stage concept designer. Moreover, for the upper stage restart operation, an effective cryopump chilldown must be performed previously so that a pure liquid hydrogen flow can be maintained in the subsequent processes. To execute this structure quenching, cryogenic liquid inside the tank is used, and LH2 stream with a low flow rate passes through the cryopump cavity as well as the associated channels to yield a temperature decrease effect. For the present upper stage concept, a closed-loop quenching method is used for the consideration of reducing liquid propellant consumption, just as the pipeline layout configuration in Reference [43]. In this circulation flow operation, LH2 is injected into the cryopump structure through the delivery tube, and the induced two-phase flow in the quenching process discharges from the cryopumps and then returns to the LH2 tank through the return tubes. It is easy to speculate that the circulation flow operation could affect the bubble motion behaviors inside the delivery tube. Therefore, the thruster logic design in the upper stage should involve the circulation flow rate effect.

3. CFD Modeling

3.1. Numerical Implementation

ANSYS Fluent software was used in this study to perform the liquid–vapor two-phase flow simulations inside the delivery tube in microgravity. It should be noted that conducing an accurate 3-D transient simulation faces great challenges, and thus a 2-D numerical model was developed to conduct the two-phase flow simulations. More information on the model setup can be found in Reference [44]. Moreover, the application of 2-D approach has also been employed by other scholars in similar two-phase flow simulation issues, and a series of valuable results have been reached [8,42].

3.2. Phase Change Model

To consider the liquid–vapor interface formation as well as bubble movement, the VOF method was used in the present CFD model. Liquid–vapor phase change effect has significant influence on the bubble size and bubble movement behaviors, and thus the phase change calculation must be involved in the present simulation. In this CFD model, Lee model is suggested to account for the phase change calculations. The mass and energy transfer is represented through incorporating mass and energy source terms into the continuity and energy conservation equations, respectively, and the related calculations, as given by Equations (1)–(3), are coded and implemented via customized user defined Functions (UDF). All the source terms are driven by the difference between the cell temperature and the fluid saturation temperature [24,42].
For the liquid phase with T > Tsat, liquid evaporation occurs, and the mass transfer rate is solved as
S l = F ρ l α l | T T s a t | T s a t
For the vapor phase with T < Tsat, vapor condensation happens, and the mass transfer rate is calculated as
S v = F ρ v α v | T T s a t | T s a t
Together with the mass transfer occurrence, energy transfer is also yielded, as written below.
S h = i f g S l
or
S h = i f g S v
Here, F denotes the relaxation parameter used for adjusting the rate of mass transfer in a cell of unit volume.
The phase change model proposed by Lee has been frequently applied in different liquid–vapor situations, including the events about cryogenic propellant [24,25,41]. Existing studies show that F has a strong influence on the calculated phase change rate. A too small value of F could underestimate the phase change rate and bring about an apparent deviation. A too large value of F could produce a computational divergence problem. Comparatively, an appropriate F can ensure not only computational stability but also the accurate calculation of the phase change rate. Different scholars have suggested different F in their numerical simulations with values varying from 0.1 s−1 to 107 s−1, depending on many factors, including objective geometry, mesh size, time step, fluid physical properties, and so forth [45]. For example, Da Riva and Del Col [46] adopted F = 750,000 s−1 in simulating condensation of R134a inside a 1 mm mini-channel. Mao et al. [42] suggested F = 10,000 s−1 in condensation process and F = 1 s−1 in evaporation calculation when simulating a geyser event. Wang et al. [24,25] selected a F range from 102 to 104 s−1 in a subcooled film boiling calculation of liquid hydrogen. Therefore, selecting an appropriate F is necessary for the phase change calculation. In this study, a F-independence study was performed to reach an appropriate F value. The bubble discharge process under a circulation quenching condition was simulated, and the circulation liquid flow is 0.2 kg/s. Figure 2 displays the comparison of predicted gas fractions inside the tube with different values of F. It shows that the optimum value of F = 10 s−1 could be suggested in this study. This result also demonstrates that the grid model is appropriate. Moreover, the comparison study demonstrates that the phase change rate has a significant influence on the bubble discharge behaviors, which may indicate that vapor condensation is a key factor for the performance of bubble diminution and bubble disappearance.

3.3. Initial and Boundary Conditions

In the present study, both bubble generation and bubble discharge behaviors under two different approaches were simulated. Table 2 lists the initial and boundary conditions for the present CFD simulation. First, the bubble generation induced by heat leakage was simulated. To simplify the calculation, a pure liquid hydrogen with a saturation temperature was used to initialize the whole delivery tube range. The wall heat leak to the tube was considered as a heat flux boundary at the tube wall. In the coast period, no macro flow occurs inside the tube and thus an adiabatic wall condition was used at the bottom of the tube. A pressure outlet boundary was applied at the tube top, and the pressure was 0.4MPa. Contact angle has great influence on the bubble properties, and a value of 5° was used for the hydrogen-stainless steel interface situation [47]. In bubble spilling upward simulations, the two-phase flow field distributions after experiencing different coast times were selected as the initial conditions. Most of the parameter settings are inherited from the bubble generation model except for the gravity value, which was changed on the basis of the case selection. A standard k-ε turbulence model was selected to account for the probable turbulence effect. To perform circulation flow case simulations, the two-phase flow field distribution in coast process was also applied. A mass inlet boundary was used at the top of the delivery tube, and a mass outlet boundary was adopted at the exits of the two branch tubes.

4. Validation Study

To strengthen the confidence in using the present CFD model, a validation study using experimental data comparison should be adopted. However, it seems that there is no available experimental study on bubble motion inside a cryogenic tube under microgravity. Instead, the predicted results by a widely accepted theoretical model was used.
In a vertical tube with liquid stagnation situation, the spilling velocity for a Taylor bubble can be predicted by the following relation [48].
u = C 1 g D
Here, C1 is a coefficient and is related to bubble velocity, tube diameter, liquid viscosity, and velocity profile of the liquid flow. D is the tube inner diameter. For cryogenic bubble issues, Zhang [49] suggested C1 = 0.284 after an experimental study. Therefore, in this CFD model, the following formula was used:
u = 0.284 g D
To execute a validation study, a vertical tube with an inner diameter of 100 mm was modeled. A Taylor bubble with about 100 mm in diameter and 200 mm in length was initialized at the pipe bottom region, and the bubble rising velocities under different acceleration levels of 10−1 g0, 10−2 g0, and 4 × 10⁻³ g0 were predicted using the CFD model. Figure 3 displays the comparison of bubble rising velocities under different gravity levels. It shows that a good agreement was reached between the theoretical and CFD predictions. More discussion on the validation study can also be found in Reference [44].

5. Results and Discussion

5.1. Bubble Performance in 0 g0 Condition

In the previous study, the bubble accumulation performance inside the LH2 delivery tube was analyzed [44]. The results are reprepared and displayed here for a clear exhibition. Figure 4 shows with the coast period proceeding, the evaporated bubbles grow up gradually and a random bubble distribution is observed within the entire fluid range. It has been pointed out that the bubble size increase in microgravity is mainly attributed to the bubble coalescence effect but not the direct phase change. With the coast period further lasting, the bubble size increases continuously and even the bubble size reaches the inner diameter of the tube. In the propellant reorientation stage, a positive acceleration field is provided over the entire propellant system so that a liquid–gas phase separation can be reached in the propellant tank. Under this acceleration force, the bubbles inside the delivery tube spill upward to reach a liquid–vapor separation here. Different from the boiled bubble rising issue in normal gravity, the bubble size exhibited in Figure 4 is apparently larger and the buoyance force associated with positive acceleration exerts a more significant effect on the bubble motion.
Compared to the liquid–gas phase separation inside the propellant tank, the needed axial thrust force should be larger for the liquid–gas separation purpose inside the delivery tube. In other words, there is an inconsistent requirement in acceleration level and acceleration period for achieving liquid–gas phase separations between in the propellant tank and in the delivery tube. To ensure liquid propellant located at the tank bottom all the time during the orbital coast phase, the third stage of the Saturn V rocket adopted vented hydrogen to provide thrust and the acceleration level was only on the order of 10−5 g0–10−4 g0 [50].

5.2. Bubble Spilling Upward under Low-Gravity

Figure 5 displays the evolutions of bubble motion and bubble distribution inside the delivery tube under different acceleration levels of 10−2 g0 and 10−3 g0, and the physical field after experiencing 60 min zero-gravity coast period is selected as the initial condition. It shows that once an acceleration force acts on the delivery tube, a significant bubble deformation together with bubble rising is activated under a new force balance. Figure 5a shows under a relatively high acceleration field, the generated large bubbles could break up immediately, and the bubble spilling upward is observed as a small bubble state. Under a low acceleration field, both bubble coalescence and bubble breakup are observed in the spilling process, as seen in Figure 5b. For the coalescence phenomenon, the latter bubble locating within the wake region of the front bubble faces a smaller flow resistance and has a higher floating velocity, so that the bubble distance decreases gradually and ultimately the two bubbles merge to produce a larger bubble. The bubble coalescence process can be distinctly observed from the development of Bubble “A” and Bubble “B”, as exhibited in Figure 5b. For the bubble breakup issue, however, forces rebalance on the bubble is the main reason. For this issue, surface tension and buoyancy force exert significant influences on the bubble size. Under microgravity or zero-gravity conditions, surface tension dominates the bubble size, and an apparently large size can be seen in the coast period. In the propellant reorientation operation, in contrast, an acceleration environment is provided by which the induced buoyancy force affects the critical balancing bubble size. Therefore, the large bubble breaks up to form small bubbles, which corresponds to the new force balance constraint.
Figure 6 displays the evolution of gas volume fraction inside the delivery tube during the bubble spilling period under different acceleration levels. The bubble field after experiencing 60 min zero-gravity coast period is considered as the initial condition. It shows that generally the gas fraction decreases with the axial acceleration proceeding. Under 10−2 g0, a relatively stable decreasing tendency in the gas volume fraction is observed, and the discharge time is about less than 200 s. This is because the gas volume decrease is yielded by discharging a series of small bubbles but not the few large bubbles discharging process, which can be seen by comparing the field distributions in Figure 5. Comparatively, under 10−3 g0 the visible bubbles are expelled within 700 s. Moreover, it shows that the decrease rate of gas fraction approximatively appears as a “stair-step” tendency in the propellant orientation process but not a linear variation, which is more significant under the low acceleration condition. This is because the bubble distribution inside the delivery tube is discontinuous, which can be observed in Figure 5. Only the large bubble discharge or the relatively large bubble discharge exerts an apparent influence on the total gas volume reduction. In addition, it should be noted that even all the large bubbles are discharged in this acceleration condition, the gas volume fraction is still not zero. Instead, a number of small bubbles can still stagnate over the whole tube range. The reason is that under certain a gravity level, there is a critical bubble size to determine whether a bubble could rise under the buoyancy force. Only the bubbles with the size larger than this critical value can spill upward, but the bubbles smaller than the critical bubble cannot rise. Therefore, for the acceleration-induced bubble spilling situation, the bubble discharge purpose means the bubbles, larger than the critical bubble size, are expelled. Further analysis reveals that a small acceleration yields a larger critical bubble size, which means a larger number of residual bubbles can be left in the tube range.

5.3. Bubble Motions under Circulation Flow Process

Figure 7 displays the evolutions of bubble motion and bubble distribution inside the delivery tube when circulation precooling working, and the physical field distribution after experiencing 30 min zero-gravity coast period is selected as the initial condition. In this circulation process, a gravity level of 10−3 g0 is created to reach liquid sinking inside the propellant tank, and the situations with liquid flow rate of m = 0.2 kg/s are discussed. It shows that under inertial effect of circulation liquid flow, the random bubbles are expelled from the tube outlets, which reveals the inertial force surpasses the buoyance force in this case. Along with the bubble discharge process, bubble coalescence is also observed, as shown in Figure 7. Especially, the bubble coalescence mostly occurs inside the spherical distributor range. This is because the flow velocity decreases due to the increase of flow section. The probable vortex flow exerts certain an influence on the inertial effect of liquid flow, and the incoming bubbles could stagnate here so that the possibility of bubble coalescence increases correspondingly. Moreover, the bubble motion inside the spherical distributor has a significant effect on the bubble movement, and a longer time stagnation requires a longer total discharge period. It can be seen clearly that a large bubble is formed inside the distributor at about t = 250 s. This bubble stays here for a long time until being discharged at about t = 800 s. In addition, in the bubble stagnation process, the vapor condensation associated with subcooling liquid inflow brings about a continuous decrease in bubble size. This phenomenon implies that the vapor condensation effect is also a mechanism for vapor amount reduction. The bubble stagnation inside the distributor also indicates that the incoming bubble is not easily discharged from the spherical distributor. Only when the large bubble is condensed to a relatively small size, can the liquid flow drive it away from the distributor to be discharged from the tube ultimately. Therefore, in the view of bubble discharge, the probable bubble stagnation inside the spherical distribution should be considered.
Figure 8 displays the temperature distributions inside the tube during the liquid circulation flow process, and a subcooled liquid inflow case with ΔT = 1 K is considered. It is seen clearly that an approximate interface to identify the circulation liquid flow leading edge can be recognized, as shown in the figures of t = 50 s to t = 250 s. Using this leading edge, the bubble discharge due to liquid flow moving forward or bubble disappearance due to vapor condensation can be determined. The results reveal that within 250 s of circulation flow operation, the continuous liquid inflow can replace the original two-phase flow volume, and all the bubbles should be expelled. However, both the temperature distribution and phase distribution indicate that the induced buoyancy force restrains the bubble discharge effect, so that a longer circulation flow time is needed to expel all the bubbles. Moreover, it seen that with the moving forward of liquid inflow, apparent heat transfer takes place at the flow leading edge due to the remarkable temperature difference between the original two-phase flow and the subcooled liquid flow, which further brings about an extended temperature-varied flow length. The stagnated large bubble inside the spherical distributor can also be recognized from the temperature distribution field, as indicated by the dotted line circle.
Figure 9 displays the evolution of gas fraction in the circulation liquid flow process with m = 0.2 kg/s. It shows the gas amount decreases with the subcooling liquid inflow, and a complete bubble discharge target is reached at about t = 820 s. Different from the gas fraction reduction under only buoyance force effect, the gas volume decrease in this situation appears to have two different rates, which respectively correspond to different mechanisms including the vapor condensation effect and the bubble discharge result. For the former one, the temperature difference between the bubble and the incoming liquid yields relatively steady vapor condensation, so that the decrease rate in gas amount exhibits approximately equal and relatively slow. For the latter reason, a large bubble discharge from the tube outlet exerts a significant contribution to the gas volume reduction, so that a steeper decrease curve can be observed. The last large bubble stagnation phenomenon inside the spherical distributor can also be determined in Figure 9. From t = 420 s to t = 820 s, a continuous and slow gas volume decrease curve is observed, and this variation is mainly produced by the vapor condensation effect. Furthermore, a significant feature for the circulation flow operation is that the final gas volume is approximately zero, which means a complete bubble discharge purpose can be realized through adopting this circulation liquid inflow. This is significantly different from the buoyance force-driven bubble spilling upward behaviors.

5.4. Influence of Circulation Flow Rates

The above results demonstrate that the liquid flow rate in the circulation flow process may have important effect on the bubble discharge performance. Therefore, the liquid inflow rate effect on the bubble behaviors is compared and the results are shown in Figure 10. It seen clearly that a large circulation liquid flow results in a significant reduction in time consumption of bubble discharge. In the case of m = 0.4 kg/s, the discharging time is less than 200 s. Comparatively, the time cost for the case of m = 0.1 kg/s is longer than 1200 s. In a large liquid flow situation, inertial effect induced by liquid flow exerts a dominant influence on the bubble discharge performance, and the random bubble distribution is discharged as the liquid flow. In a small liquid flow case, however, the bubble discharge rate is not the same pace with the liquid inflow. The bubbles stay in the subcooled liquid phase for a long time owing to the buoyance force. In this situation, the vapor condensation is the principal factor to the gas volume reduction. Moreover, in the view of bubble discharge purpose, about 62 kg of circulated liquid is provided to the delivery tube for the m = 0.4 kg/s case, and the circulated liquid amount increases to 165 kg for the case of m = 0.2 kg/s. For the case of m = 0.1 kg/s, the needed liquid flow amount also exceeds 120 kg. This phenomenon should be involved in the circulation flow operation design. To reduce propellant consumption in space precooling operation, a trickle liquid supplying method is usually used on the basis of sufficient utilization of the fluid latent heat and sensible heat, so that the liquid inflow rate is usually small. The present study implies that a too small liquid supplement requires a longer time to discharge the evaporated bubbles, which is disadvantageous to the precooling efficiency as well as the precooling time cost.

5.5. Influence of Circulation Flow Subcooling

The above results also suggest that the liquid subcooling affects the bubble discharge performance since the vapor condensation is one of the gas amount reduction reasons and the liquid subcooling indeed affects the condensation rate. Therefore, the liquid subcooling was also investigated, and the results are shown in Figure 11. It can be seen that for the case of 0.2 kg/s, a visible influence of liquid subcooling on bubble discharge rate is observed. When a saturation liquid is provided in the circulation flow process, the bubbles are difficult to discharge, and a relatively stable residual gas volume, but not zero, is reached after t = 400 s. Comparatively, when a subcooling liquid is adopted, all the bubbles can be discharged, and a larger subcooling case requires a shorter bubble discharge time. Comparing the curves of ΔTsub = 1 K with ΔTsub = 2 K suggests that the liquid subcooling significantly affects the condensation rate inside the spherical distributor. Under large subcooling conditions, the stagnated bubble is more easily condensed to a critical bubble size. After reaching this value, the bubble can be further discharged from the distributor under the liquid flow inertia, so that a shorter time consumption is needed. Figure 11b shows the liquid subcooling appears slight influence on bubble discharge performance for large liquid flow case. Under large inertial force conditions, the bubble discharge time is primarily attributed to the liquid replacement rate associated with liquid inflow velocity. The liquid subcooling has a weak influence due to the insufficient heat transfer. In addition, it should be noted that even under a large liquid inflow case with m = 0.4 kg/s, a large bubble stagnation phenomenon is also observed in the case with saturation liquid supplying. Since there is no obvious bubble size reduction, the incoming large bubble stagnates here for a long time, bringing about an extended bubble discharging time. Generally, the bubble discharge from the delivery tube is mainly determined by the liquid inflow inertia effect, and a larger liquid flow usually needs a shorter discharge time. The inflow liquid subcooling also exerts an influence on the gas volume reduction base for two reasons, including the vapor condensation effect itself, and condensing a large bubble to a small size so that the bubble is taken away with liquid flow.

6. Conclusions

In the present study, a CFD approach was applied to perform numerical research on cryogenic hydrogen bubble discharge performance under low gravity conditions, and two bubble discharge methods were analyzed and compared. The following conclusions have been drawn:
(1)
Space heat leakage at the propellant delivery tube may give rise to propellant evaporation, and the generated bubbles increase to a large size through the bubble coalescence effect. The largest bubble even reaches the size of the tube inner diameter. In the thrust design of upper stage, there is an inconsistent requirement in the acceleration level for achieving liquid–gas phase separations in propellant tank and in delivery tube. To meet the bubble discharge purpose inside the tube, a higher acceleration field should be created;
(2)
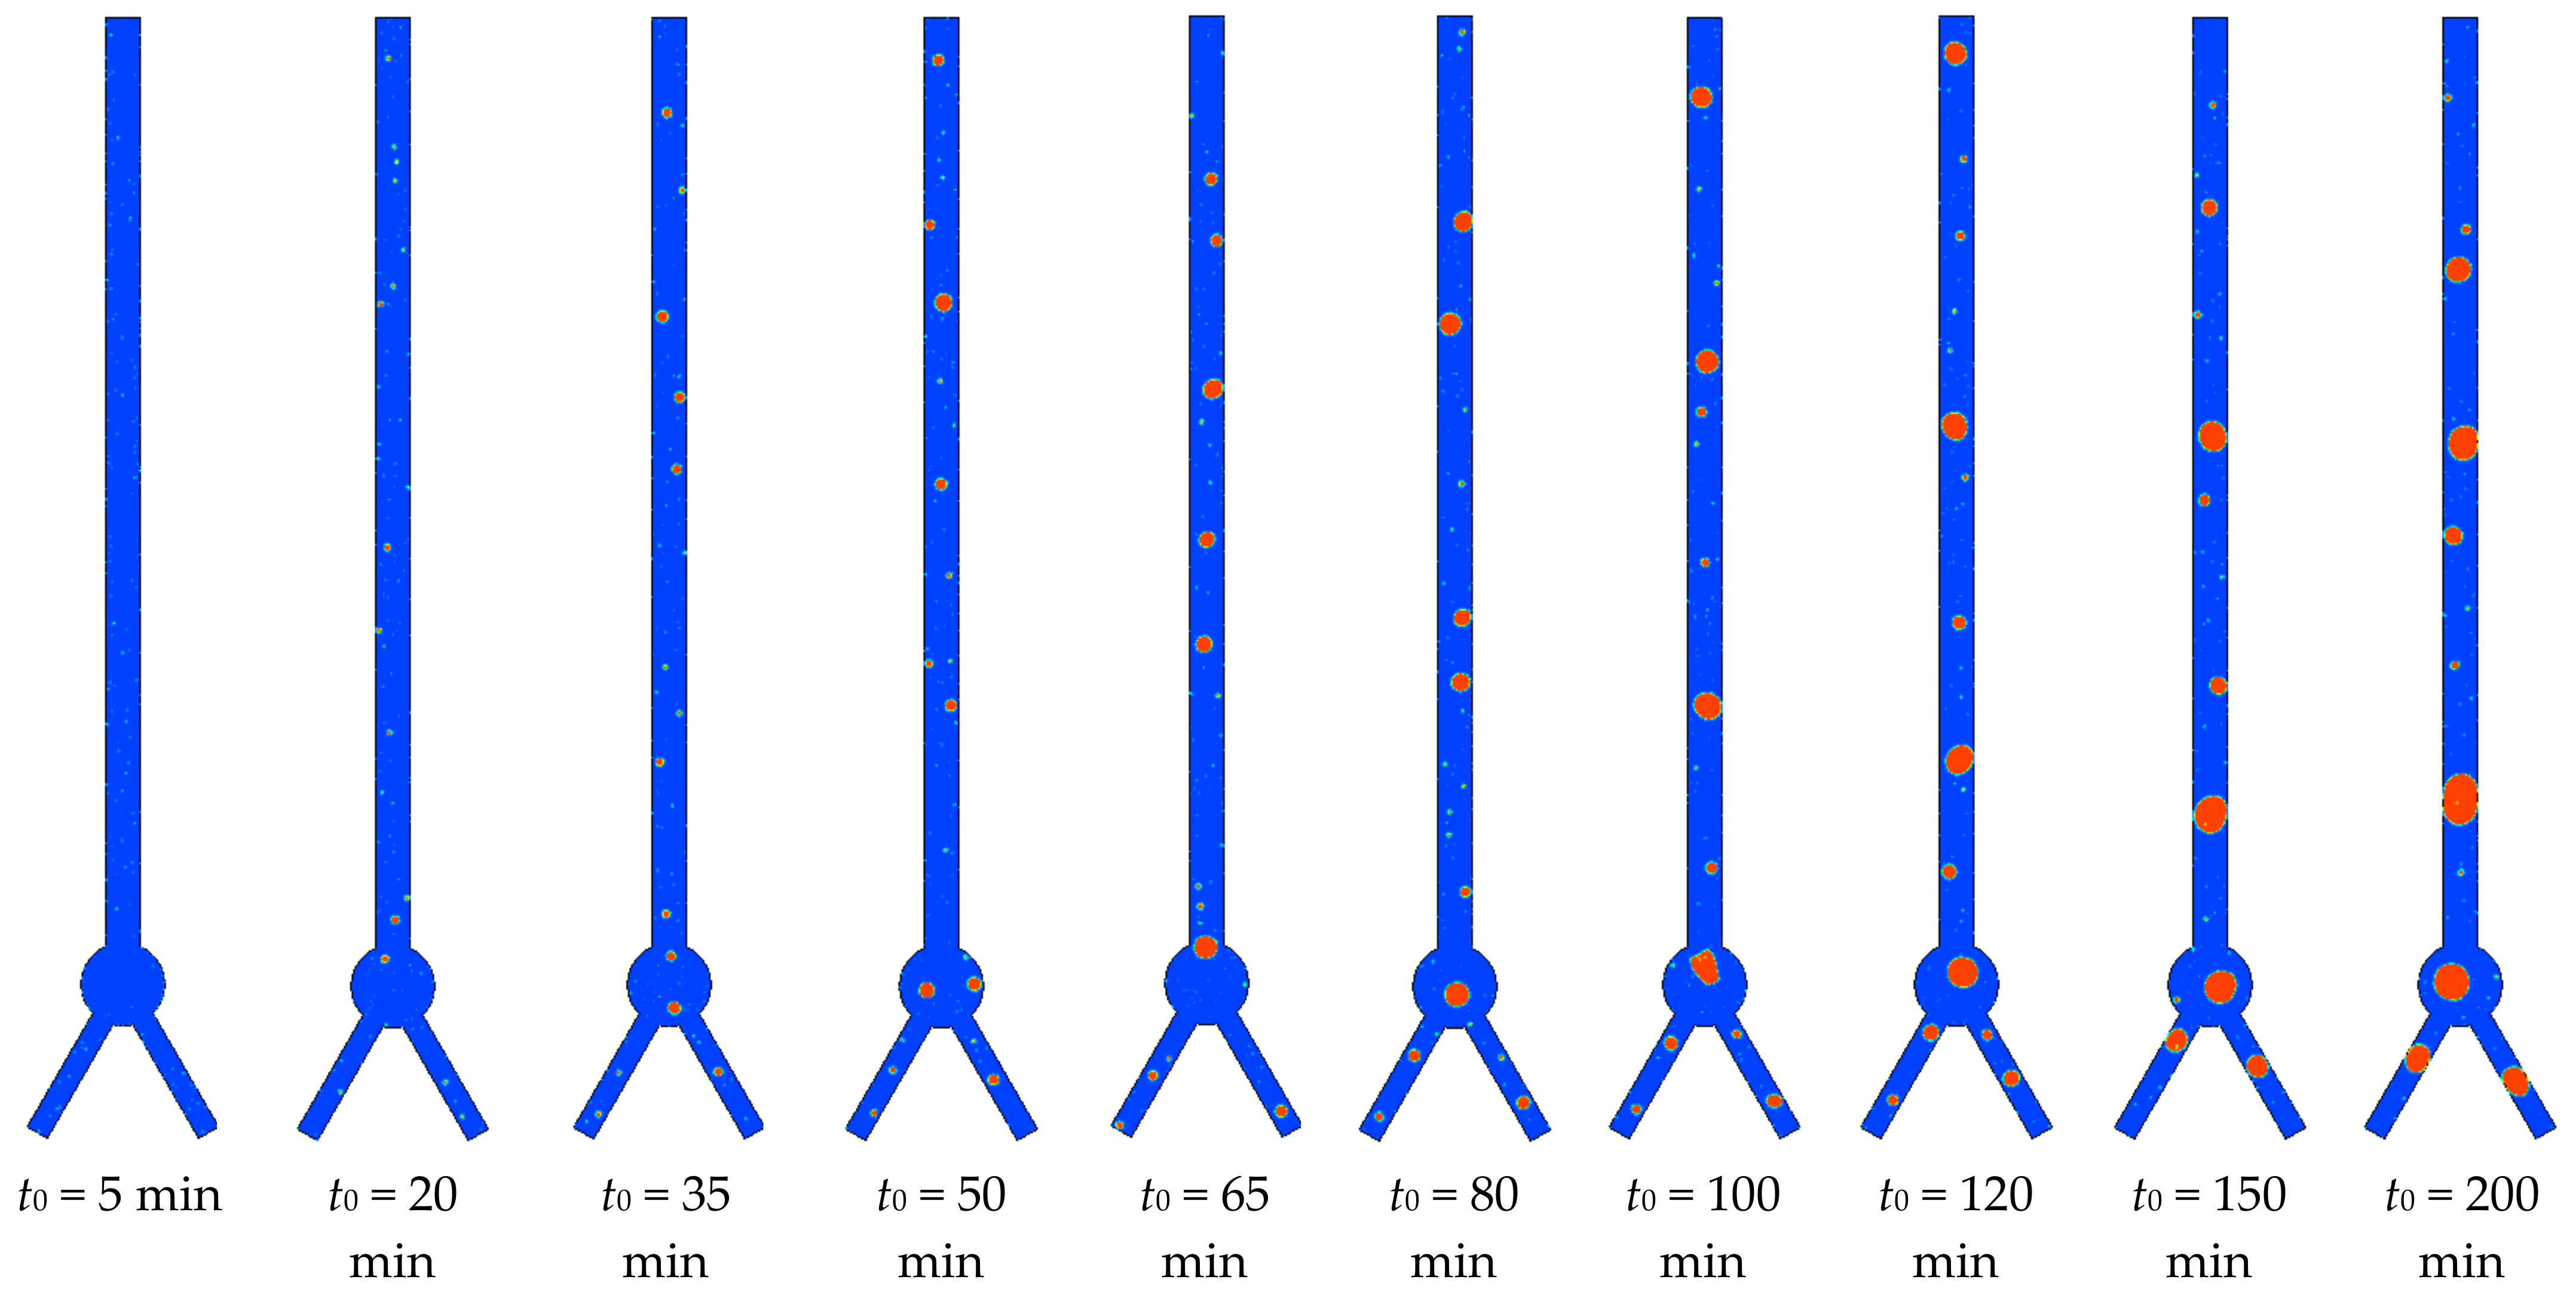
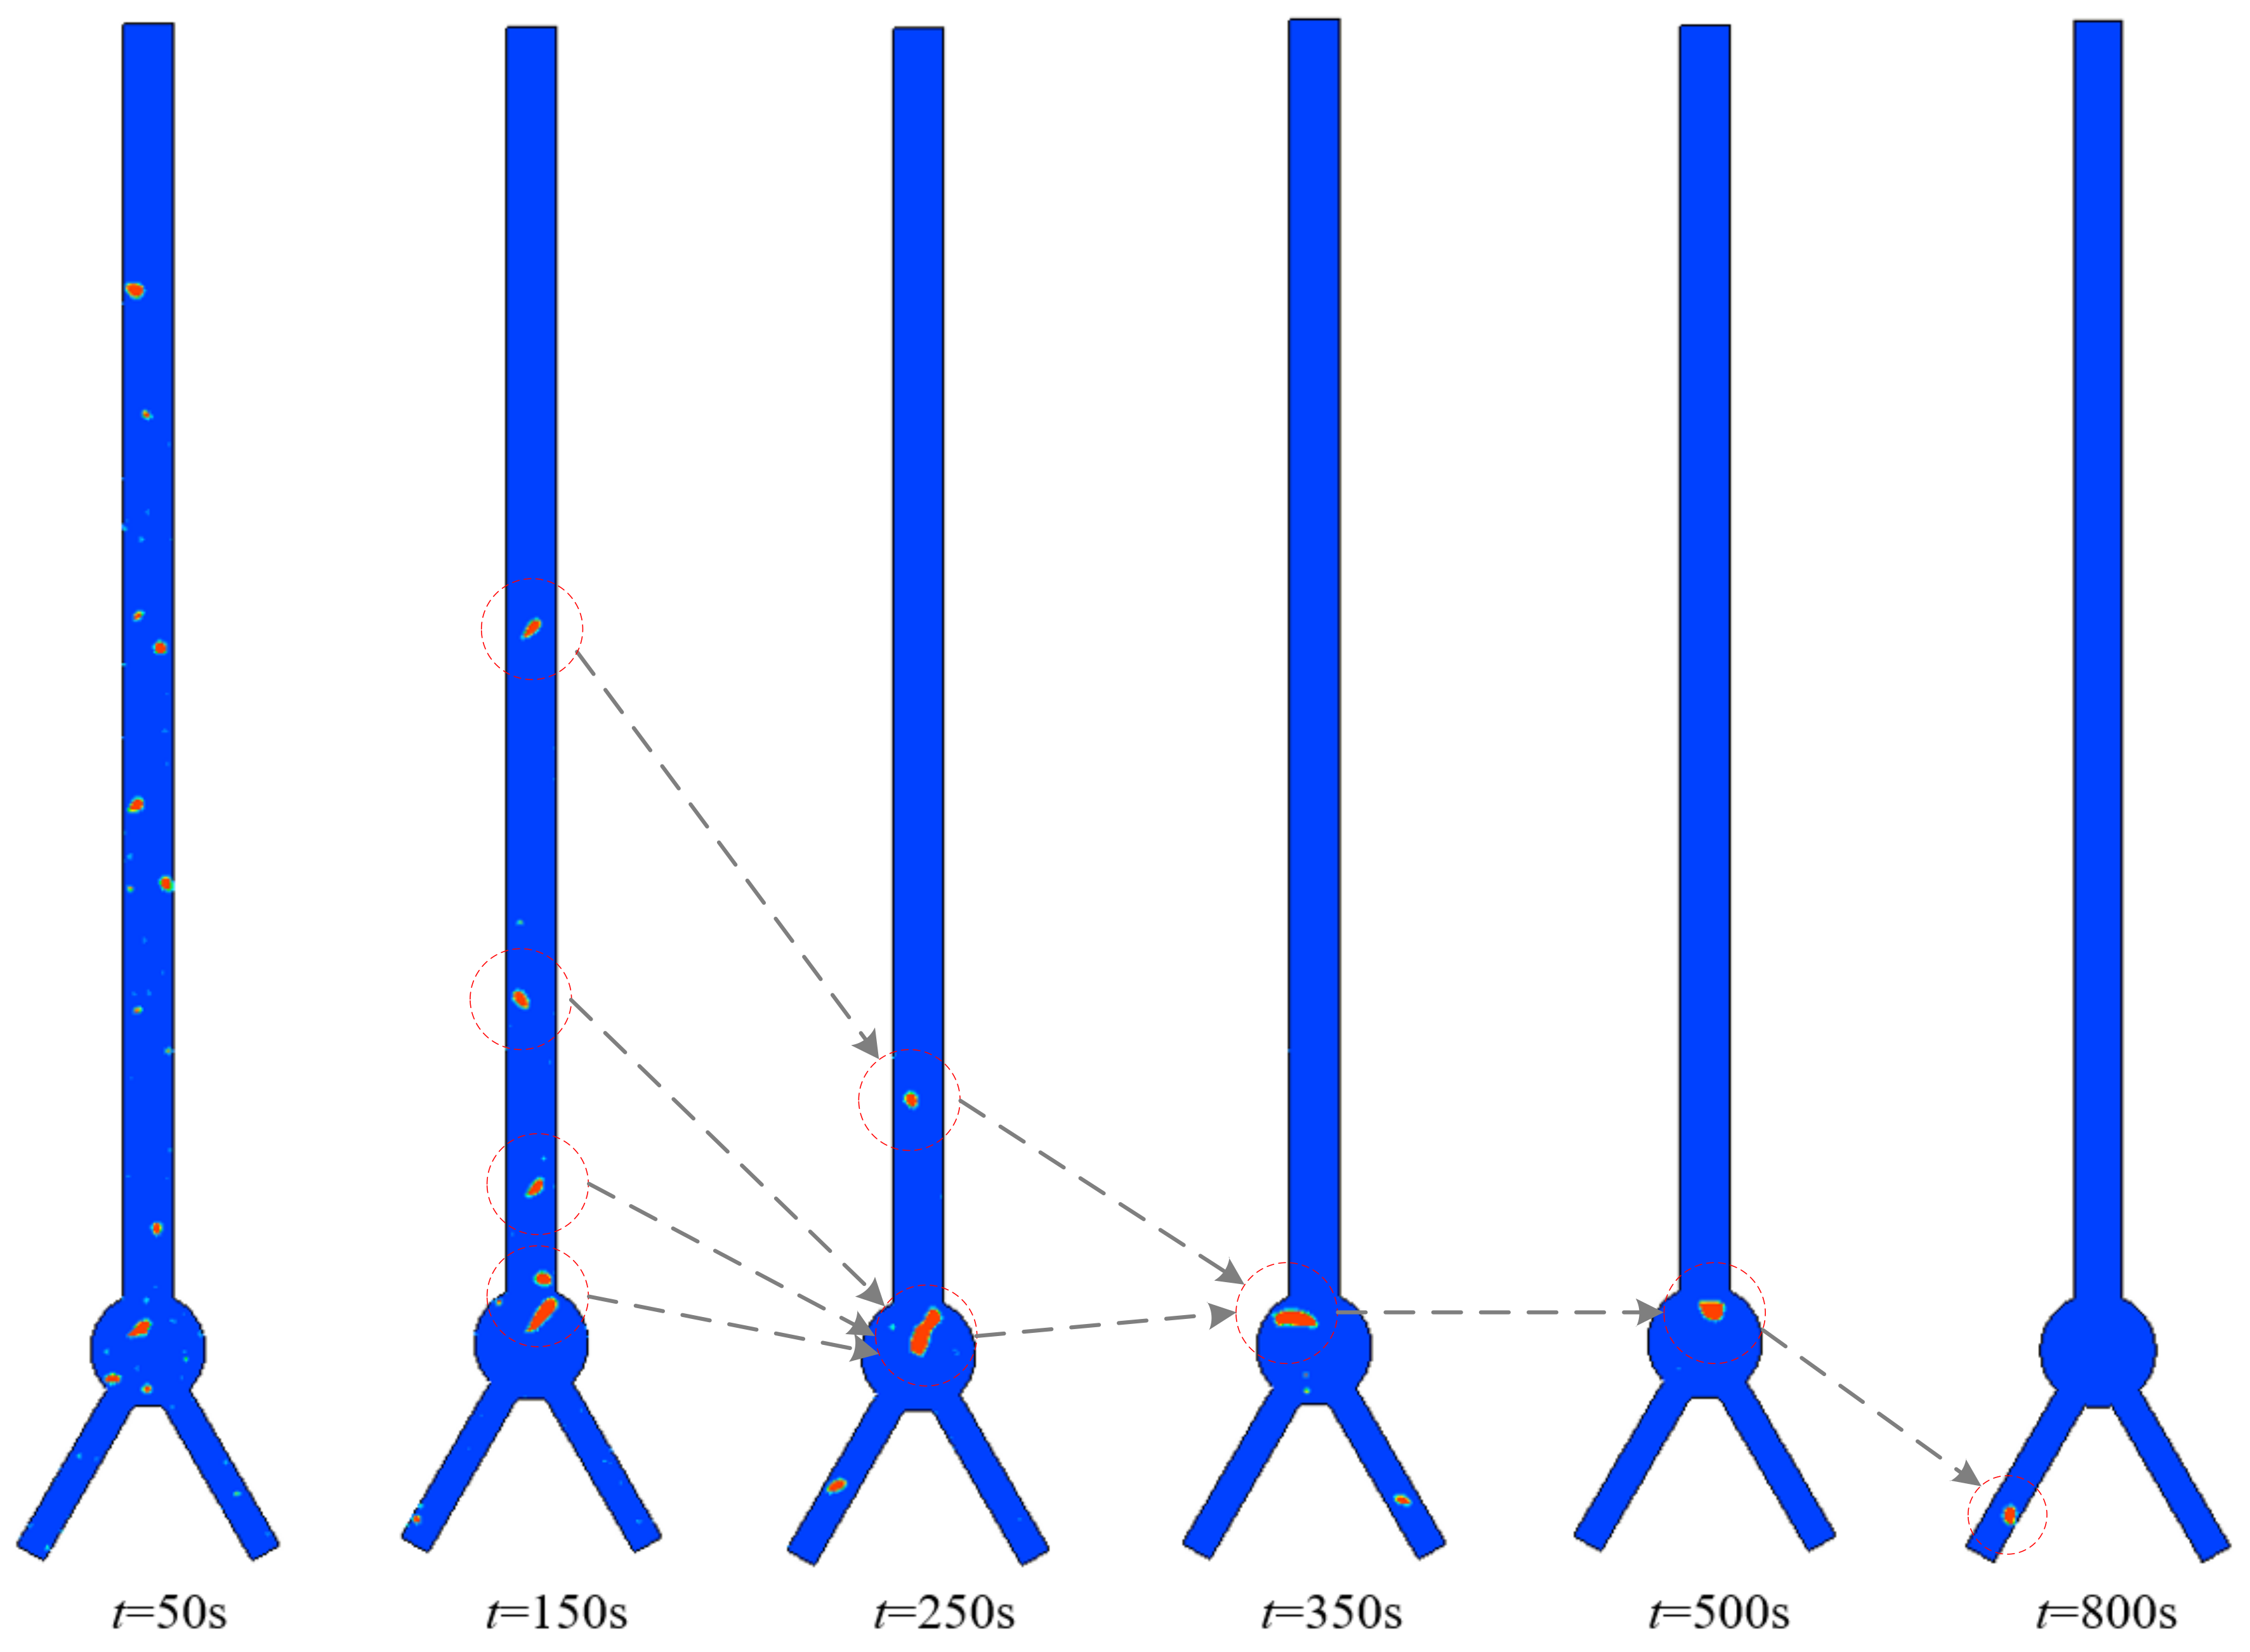
When providing an axial acceleration condition, the generated large bubbles inside the delivery tube may break up under the new force balance and then be discharged under the induced buoyancy effect. For the present tube structure, most of the bubbles are discharged within 200 s under the acceleration level of 10−2 g0. Under 10−3 g0, the bubble discharge time is about 700 s. During the bubble spilling upward, both bubble breakup and bubble coalescence phenomena occur, and only the large bubble discharge exerts a significant effect on the gas volume reduction;
(3)
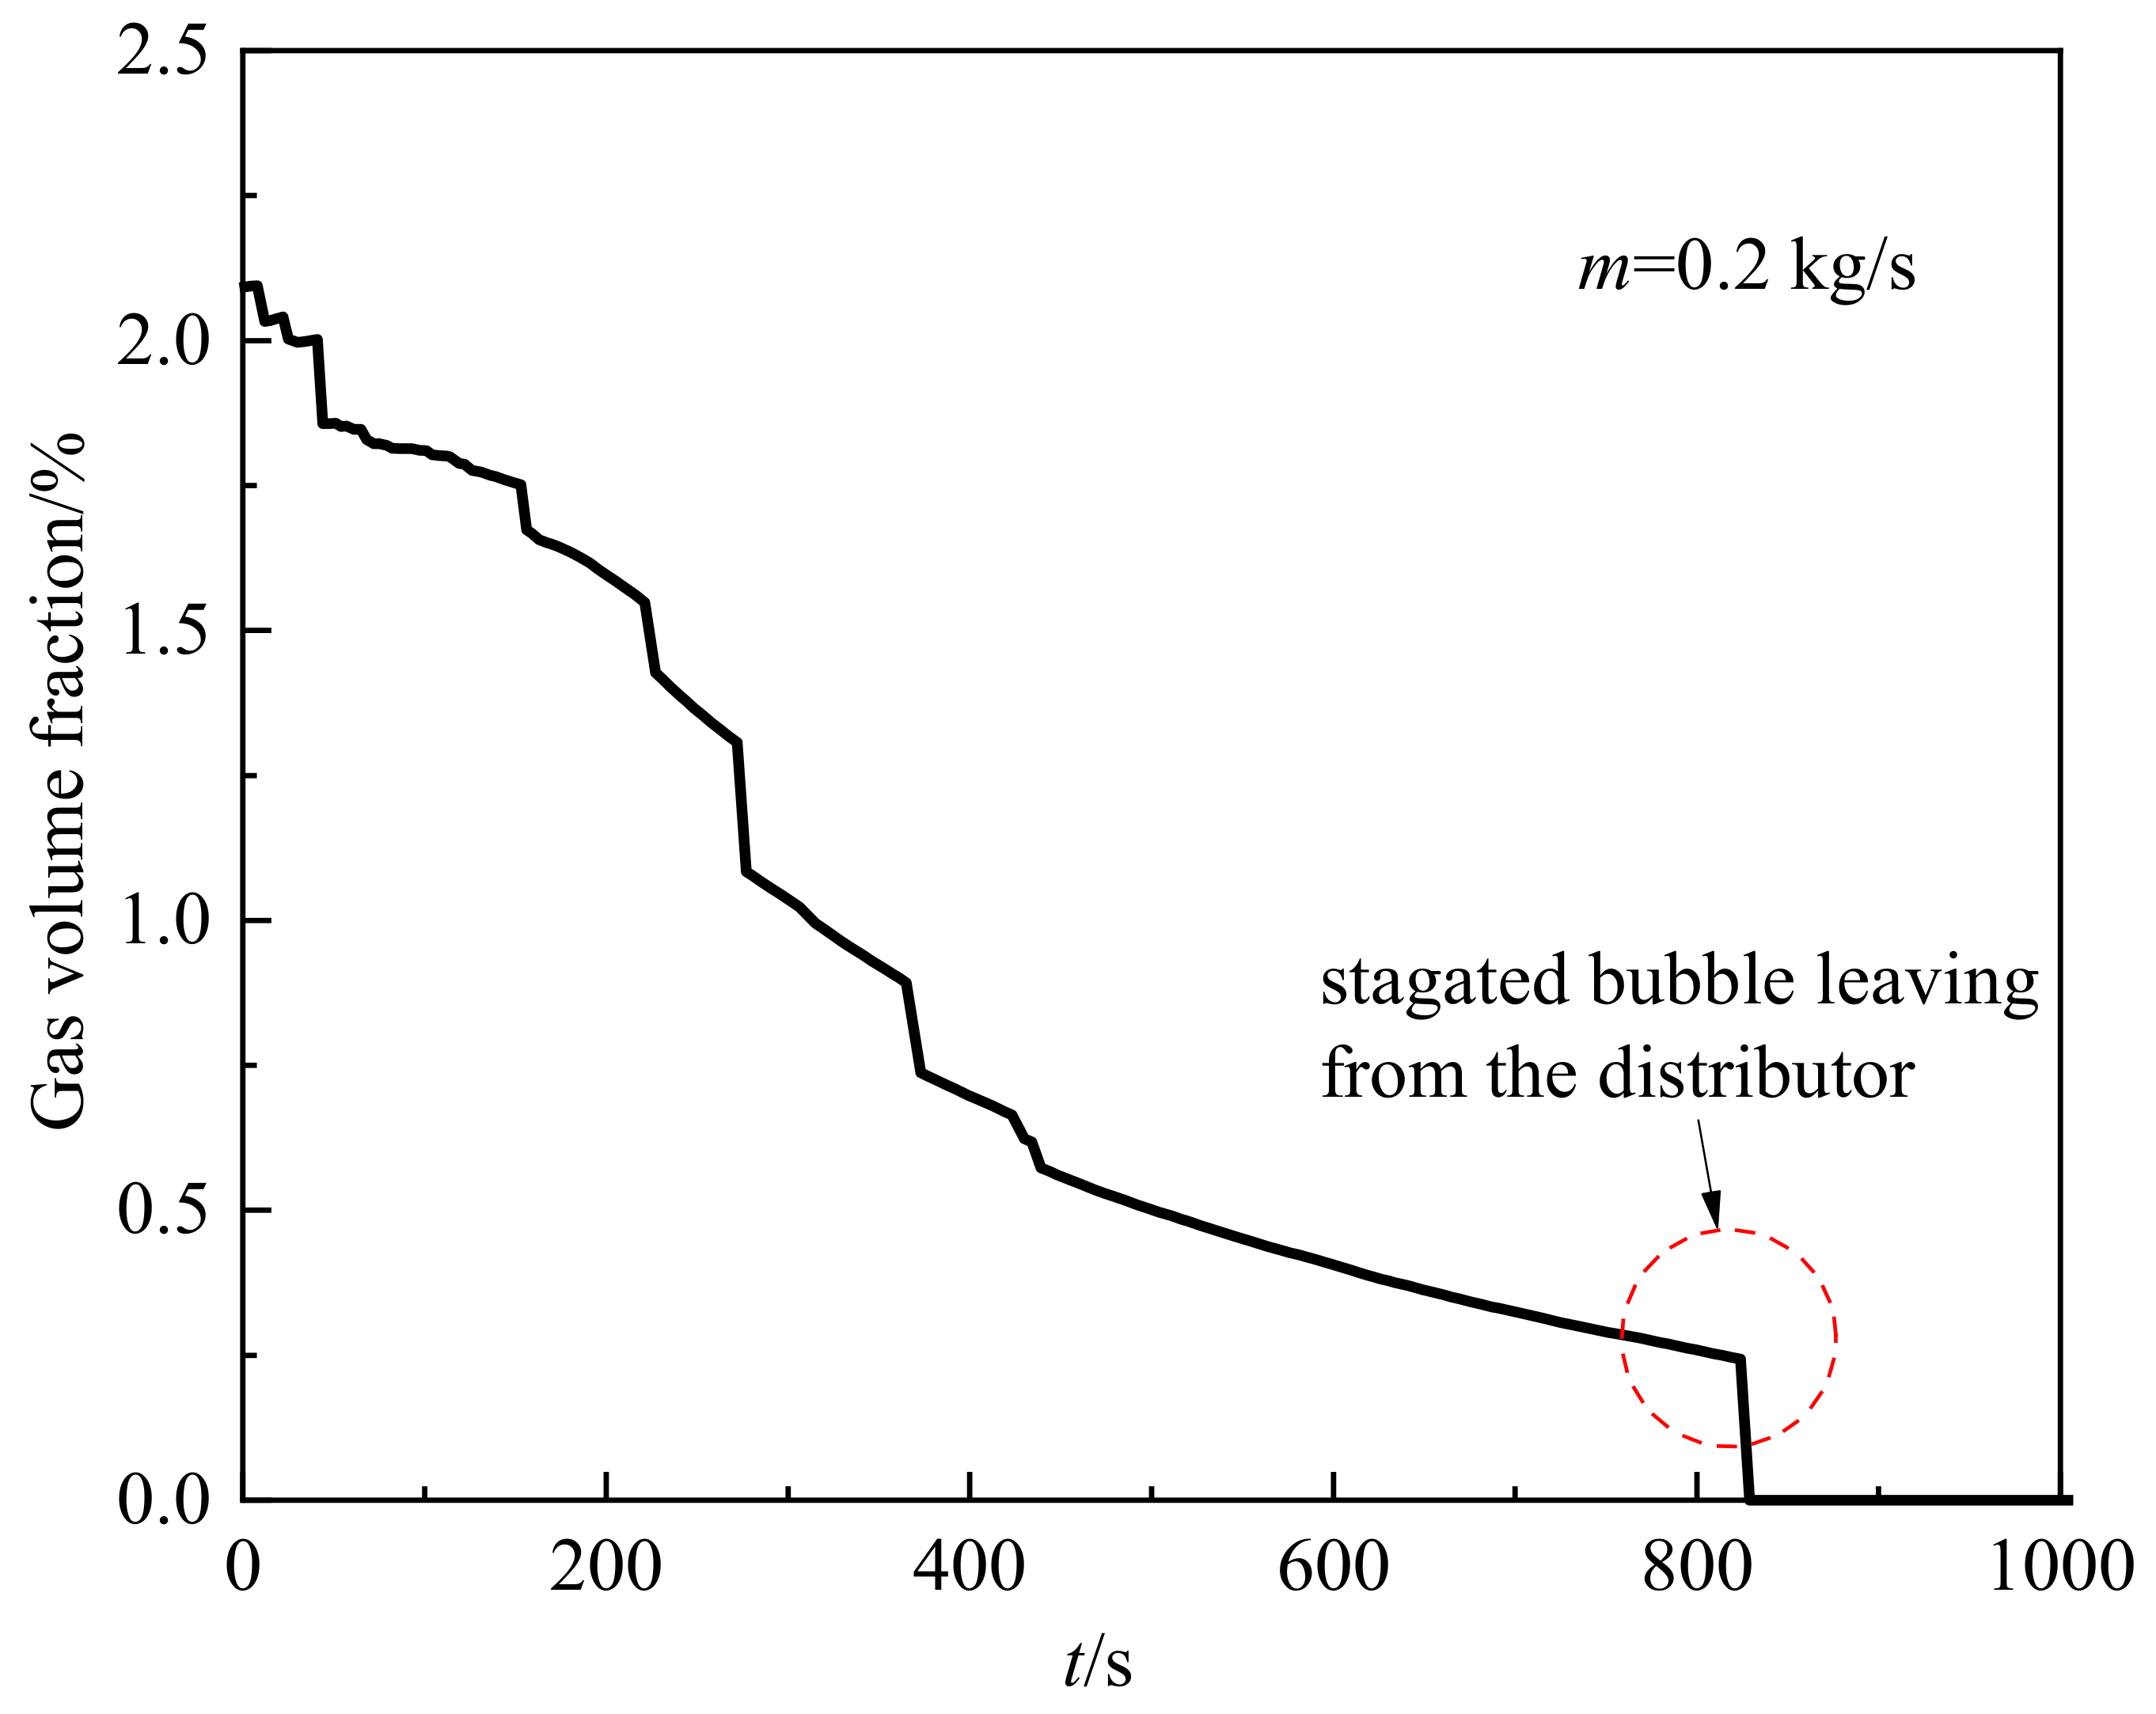
In the circulation flow operation, the gas volume reduction is determined by two different mechanisms, including the vapor condensation effect and bubble discharge effect. In the bubble flow downward process, the bubble entering the spherical distributor and stagnating there has significant influence on the discharge time. For the m = 0.2 kg/s case, a complete bubble discharge target is reached at about 820 s, but a large bubble stagnation in the spherical distributor occupies a remarkable proportion, which is longer than 400 s;
(4)
For the liquid circulation flow issue, both of liquid flow rate and liquid subcooling exert important influence on the bubble discharge performance. When applying a large circulation flow, the gas volume reduction mainly owes to the inertial effect of liquid flow, but the bubble stagnation in the spherical distribution affects the total discharge time. The liquid subcooling influence on the gas volume reduction is more significant under small circulation flow situation.

Author Contributions

Conceptualization, L.W.; methodology, L.W.; software, M.Q.; validation, S.S.; formal analysis, L.W.; investigation, L.W.; resources, P.S. and L.Y.; data curation, L.W.; writing—original draft preparation, L.W.; writing—review and editing, L.W.; visualization, S.S.; supervision, Y.L.; project administration, Y.L.; funding acquisition, L.W. All authors have read and agreed to the published version of the manuscript.

Funding

This research was funded by National Natural Science Foundation of China (No. 51976151).

Data Availability Statement

Not applicable.

Acknowledgments

This work is supported by National Natural Science Foundation of China (No. 51976151).

Conflicts of Interest

The authors declare no conflict of interest.

Nomenclature

cpspecific heat, J/(kg·K)
dbubble diameter, m
Dtube inner diameter, m
Frelaxation parameter for mass transfer, s−1
gacceleration, m/s2
g0normal gravity, g0 = 9.81 m/s2
henthalpy, J/kg
i f g latent heat, J/kg
mcirculation flow rate, kg/s
ppressure, Pa
PrtPrandtl number
Smass transfer rate, kg/(m3·s)
Shenergy transfer rate, J/(m3·s)
ttime, s
t0zero-g coast time, s
Ttemperature, K
∆Tsubliquid subcooling, K
Tsatsaturation temperature, K
ububble spilling velocity, m/s
vfluid velocity, m/s
αvolume fraction
λthermal conductivity, W/(m·K)
λeffeffective thermal conductivity, W/(m·K)
μviscosity, Pa·s
ρdensity, kg/m3
σsurface tension, N/m
Φ volumetric weighted average fluid properties
subscripts
lliquid
vvapor
mmixture

References

  1. Heald, D.A.; Holland, K.D. Centaur hydrogen tank venting experience. In Proceedings of the AIAA/NASA Flight Testing Conference, Huntsville, AL, USA, 15–17 February 1965. AIAA 65-216. [Google Scholar]
  2. Blatt, M.H.; Aydelott, J.C. Centaur propellant acquisition system. J. Spacecr. Rockets 1975, 13, 515–521. [Google Scholar] [CrossRef]
  3. Groesbeck, W. Centaur upper stage. In Orbital Debris from Upper-Stage Breakup; Loftus, J., Ed.; NASA Johnson Space Center: Houston, TX, USA, 1989; pp. 211–213. [Google Scholar]
  4. Der, J.J.; Stevens, C.L. Low-gravity bubble reorientation in liquid propellant tanks. In Proceedings of the AIAA 25th Aerospace Sciences Meeting, Reno, NV, USA, 24–26 March 1987. AIAA 87-0622. [Google Scholar]
  5. Marchetta, J.G.; Roos, K.M. A three-dimensional computational simulation of magnetic positive positioning. In Proceedings of the 45th AIAA Aerospace Sciences Meeting and Exhibit, Reno, NV, USA, 8–11 January 2007. AIAA 2007-956. [Google Scholar]
  6. Dalmon, A.; Lepilliez, M.; Tanguy, S.; Pedrono, A.; Busset, B.; Bavestrello, H.; Mignot, J. Direct numerical simulation of a bubble motion in a spherical tank under external forces and microgravity conditions. J. Fluid Mech. 2018, 849, 467–497. [Google Scholar] [CrossRef] [Green Version]
  7. Ma, R.; Lu, X.; Wang, C.; Yang, C.; Yao, W. Numerical simulation of bubble motions in a coaxial annular electric field under microgravity. Aerosp. Sci. Technol. 2020, 96, 105525. [Google Scholar] [CrossRef]
  8. Dhir, V.K.; Qiu, D.M.; Chao, D.F.; Hasan, M. Bubble dynamics and heat transfer associated with pool nucleate boiling under microgravity conditions. In Proceedings of the Conference and Exhibit on International Space Station Utilization—2001, Cape Canaveral, FL, USA, 15–18 October 2001. AIAA 2001-4995. [Google Scholar]
  9. Kuhlman, J.; Gray, D.; Glaspell, S.; Kreitzer, P. Positioning of bubbles in microgravity by the Kelvin force. In Proceedings of the 38th AIAA Thermalphysics Conference, Toronto, ON, Canada, 6–9 June 2005. AIAA 2005-5201. [Google Scholar]
  10. Davisson, J.C.; Mcharris, G.A. S-IVB restart chilldown experience. J. Spacecr. 1971, 8, 99–104. [Google Scholar] [CrossRef]
  11. Herman, C.; Iacona, E.; Földes, I.; Suner, G.; Milburn, C. Experimental visualization of bubble formation from an orifice in microgravity in the presence of electric fields. Exp. Fluids 2002, 32, 396–412. [Google Scholar] [CrossRef]
  12. Burke, P.A.; Dunbar, B.J. Development of computational fluid dynamic (CFD) models of the formation and buoyancy-driven detachment of bubbles in variable gravity environments. In Proceedings of the AIAA SciTech Forum, Virtual Event, 11–15 & 19–21 January 2021. AIAA 2021-1838. [Google Scholar]
  13. Colin, C.; Riou, X.; Fabre, J. Bubble coalescence in gas-liquid flow at microgravity conditions. Microgravity Sci. Technol. 2008, 20, 243–246. [Google Scholar] [CrossRef]
  14. Zhao, J.-F.; Li, J.; Yan, N.; Wang, S.-F. Bubble behavior and heat transfer in quasi-steady pool boiling in microgravity. Microgravity Sci. Technol. 2009, 21, 175–183. [Google Scholar] [CrossRef] [Green Version]
  15. Wang, T.; Li, H.; Zhao, J. Three-dimensional numerical simulation of bubble dynamics in microgravity under the influence of nonuniform electric fields. Microgravity Sci. Technol. 2016, 28, 133–142. [Google Scholar] [CrossRef] [Green Version]
  16. Luo, X.-Y.; Ni, M.-J.; Ying, A.; Abdou, M. Numerical analysis of phase change and dynamics associated with bubbles and droplets. In Proceedings of the 17th AIAA Computational Fluid Dynamics Conference, Toronto, ON, Canada, 6–9 June 2005. AIAA 2005-5346. [Google Scholar]
  17. De Bernardis, E.; Riccardi, G. Dynamics of a bubble rising in gravitational field. Commun. Appl. Ind. Math. 2016, 7, 48–67. [Google Scholar] [CrossRef] [Green Version]
  18. Cao, B.; Fan, J.; Sun, X.; Li, S. Numerical simulation of mass-transfer characteristics of a bubble rising in yield stress fluids. ACS Omega 2020, 5, 13878–13885. [Google Scholar] [CrossRef]
  19. Van Sint Annaland, M.; Deen, N.G.; Kuipers, J.A.M. Numerical simulation of gas bubbles behaviors using a three dimensional volume of fluid method. Chem. Eng. Sci. 2005, 60, 2999–3011. [Google Scholar] [CrossRef]
  20. Vishnu, S.B.; Kuzhiveli, B.T. Effect of micro- and elevated gravity condition on the evolution of stratification and self-pressurization in a cryogenic propellant tank. Indian Acad. Sci. 2019, 44, 63. [Google Scholar] [CrossRef] [Green Version]
  21. Zeng, C.; Yuan, B.; Meng, Z.; Zhang, X.; Jiang, H.; Mu, D.; Yan, R. Numerical investigation of helium bubble rising behavior in cross-type channel. Front. Energy Res. 2020, 8, 184. [Google Scholar] [CrossRef]
  22. Agarwal, R.; Dondapati, R.S. Numerical investigation on hydrodynamic characteristics of two-phase flow with liquid hydrogen through cryogenic feed lines at terrestrial and microgravity. Appl. Therm. Eng. 2020, 173, 115240. [Google Scholar] [CrossRef]
  23. Pesich, J.M.; Hauser, D.M.; Hartwig, J.W.; Kassemi, M.; Kinefuchi, K.; Umemura, Y.; Himeno, T. CFD modeling of cryogenic chilldown in a complex channel under normal and low gravity conditions. In Proceedings of the AIAA Propulsion and Energy 2020 Forum, Virtual Event, 24–28 August 2020. AIAA 2020-3818. [Google Scholar]
  24. Wang, J.; Li, Y.; Wang, L.; Xia, S.; Ren, J.; Mao, H.; Xu, Y. Numerical investigation on subcooled pool film boiling of liquid hydrogen in different gravities. Int. J. Hydrog. Energy 2021, 46, 2646–2657. [Google Scholar] [CrossRef]
  25. Wang, J.; Li, Y.; Wang, L. Numerical study on pool film boiling of liquid hydrogen over horizontal cylinders. Energies 2022, 15, 1044. [Google Scholar] [CrossRef]
  26. Malekzadeh, S.; Roohi, E. Investigation of different droplet formation regimes in a T-junction microchannel using VOF technique in OpenFOAM. Microgravity Sci. Technol. 2015, 27, 231–243. [Google Scholar] [CrossRef]
  27. Pu, L.; Li, H.; Lv, X.; Zhao, J.; Chen, T.; Zhu, Y. Numerical simulation of bubble dynamics in microgravity. Microgravity Sci. Technol. 2008, 20, 247–251. [Google Scholar] [CrossRef]
  28. Pu, L.; Li, H.; Zhao, J.; Chen, T. Numerical simulation of condensation of bubbles under microgravity conditions by moving mesh method in the double-staggered grid. Microgravity Sci. Technol. 2009, 21, S15–S22. [Google Scholar] [CrossRef] [Green Version]
  29. Cano-Lozano, J.C.; Jimenez, R.B.; Gutierrez-Montes, C.; Martínez-Bazán, C. The use of volume of fluid technique to analyze multiphase flows: Specific case of bubble rising in still liquids. Appl. Math. Model. 2015, 39, 3290–3305. [Google Scholar] [CrossRef]
  30. Daryaei, A.; Hanafizadeh, P.; Akhavan-Behabadi, M.A. Three-dimensional numerical investigation of a single bubble behavior against non-linear forced vibration in a microgravity environment. Int. J. Multiph. Flow 2018, 109, 84–97. [Google Scholar] [CrossRef]
  31. Martian, J.; Holt, J. Magnetically actuated propellant orientation, controlling fluids in a low-gravity environment. In Proceedings of the 36th AIAA/ASME/SAE/ASEE Joint Propulsion Conference and Exhibit, Huntsville, AL, USA, 24–28 July 2000. AIAA 2000-3440. [Google Scholar]
  32. Zhang, R.-P.; Bao, S.-R.; Gu, C.-J.; Qiu, L.-M.; Zhi, X.-Q.; Zhang, X.-B. Numerical study on the bubble rising behavior in liquid oxygen under magnetic field. Cryogenics 2019, 101, 43–52. [Google Scholar] [CrossRef]
  33. Yang, Q.; Li, B.Q.; Shao, J.; Ding, Y. A phase field numerical study of 3D bubble rising in viscous fluids under an electric field. Int. J. Heat Mass Transf. 2014, 78, 820–829. [Google Scholar] [CrossRef]
  34. Shi, J.; Ma, Q.; Chen, Z. Numerical study on bubble motion in pore structure under microgravity using the lattice Boltzmann method. Microgravity Sci. Technol. 2019, 31, 207–222. [Google Scholar] [CrossRef]
  35. Amaya-Bower, L.; Lee, T. Numerical simulation of single bubble rising in vertical and inclined square channel using lattice Boltzmann method. Chem. Eng. Sci. 2011, 66, 935–952. [Google Scholar] [CrossRef]
  36. Zhang, A.; Sun, P.; Ming, F. An SPH modeling of bubble rising and coalescing in three dimensions. Comput. Methods Appl. Mech. Eng. 2015, 294, 189–209. [Google Scholar] [CrossRef]
  37. Liu, X.; Chen, Y.; Shi, M. Influence of gravity on gas-liquid two-phase flow in horizontal pipes. Int. J. Multiph. Flow 2012, 41, 23–35. [Google Scholar] [CrossRef]
  38. Darzi, M.; Park, C. Hydrodynamics of intermediate-scale Taylor flow under gravities of space colonies. Microgravity Sci. Technol. 2019, 31, 865–876. [Google Scholar] [CrossRef]
  39. Xu, Y.; Zhu, Z.; Xiong, X. Numerical study of flow boiling flow patterns and pressure drop of R134a in small tubes under high flight acceleration. J. Braz. Soc. Mech. Sci. Eng. 2020, 42, 482. [Google Scholar] [CrossRef]
  40. Mao, H.; Li, Y.; Wang, L.; Wang, J.; Xie, F. Investigation of appearance and intensity of geyser phenomenon in a vertical cryogenic pipe. Int. J. Heat Mass Transf. 2020, 150, 119390. [Google Scholar] [CrossRef]
  41. Mao, H.; Li, Y.; Wang, L.; Xie, F.; Wang, J. Investigation on the difference of geyser behaviors among different cryogenic fuels of launch vehicle. Int. J. Hydrog. Energy 2020, 45, 34150–34162. [Google Scholar] [CrossRef]
  42. Mao, H.; Li, Y.; Wang, L.; Wang, J.; Xie, F. Numerical investigation on the mechanism of geyser in cryogenic fluid pipes. Int. J. Heat Mass Transf. 2020, 154, 119670. [Google Scholar] [CrossRef]
  43. Fisher, M.F. Propellant management in booster and upper-stage propulsion systems. J. Propuls. Power 1998, 14, 649–656. [Google Scholar] [CrossRef] [Green Version]
  44. Wang, L.; Wang, J.; Shangguan, S.; Qu, M.; Mao, H.; Li, Y.; Lei, G. Numerical investigation on spilling upward performance of hydrogen bubbles inside a delivery tube under low-gravity environment. Cryogenics 2021, 118, 103333. [Google Scholar] [CrossRef]
  45. Kharangate, C.R.; Mudawar, I. Review of computational studies on boiling and condensation. Int. J. Heat Mass Transf. 2017, 108, 1164–1196. [Google Scholar] [CrossRef]
  46. Da Riva, E.; Del Col, D. Numerical simulation of laminar liquid film condensation in a horizontal circular minichannel. J. Heat Transf. 2012, 134, 051019. [Google Scholar] [CrossRef]
  47. Bellur, K.; Konduru, V.; Kulshreshtha, M.; Tyrewala, D.; Medici, E.; Allen, J.S.; Choi, C.K.; Hussey, D.S.; Jacobson, D.C.; Leão, J.B.; et al. Contact angle measurement of liquid hydrogen (LH2) in stainless steel and aluminum cells. J. Heat Transf. 2016, 138, 020904. [Google Scholar] [CrossRef]
  48. Moissis, R.; Griffith, P. Entrance effects in a two-phase slug flow. J. Heat Transf. Trans. ASME 1962, 84, 29–39. [Google Scholar] [CrossRef]
  49. Zhang, L. Study on Geyser Phenomenon and Natural Circulation Analysis of Cryogenic Fluid in Vertical Pipeline; Shanghai Jiaotong University: Shanghai, China, 2004. (In Chinese) [Google Scholar]
  50. Muratov, C.B.; Osipov, V.V.; Smelyanskiy, V.N. Issues of Long-Term Cryogenic Propellant Storage in Microgravity; NASA/TM 2011-215988; NASA Ames Research Center: Moffett Field, CA, USA, 2011. [Google Scholar]
Figure 1. Schematic diagram of LH2 pipeline in the cryogenic upper stage.
Energies 15 07528 g001
Figure 2. Influence of relaxation parameter F on simulated calculation (m = 0.2 kg/s, ΔTsub = 1 K).
Energies 15 07528 g002
Figure 3. Comparison of bubble rise velocities between theoretical and CFD results under different gravity levels [44].
Energies 15 07528 g003
Figure 4. Bubble generation and distribution inside delivery tube under 0 g0 condition.
Energies 15 07528 g004
Figure 5. Bubble rise features under 10−2 g0 and 10−3 g0 (t0 = 60 min). (a) 10−2 g0; (b) 10−3 g0.
Energies 15 07528 g005
Figure 6. Gas fraction decreasing curves under −2 g0 and −3 g0 (t0 = 60 min).
Energies 15 07528 g006
Figure 7. Bubble discharge characteristics under circulation liquid flow with m = 0.2 kg/s.
Energies 15 07528 g007
Figure 8. Temperature distribution inside delivery tube under circulation liquid flow with m = 0.2 kg/s.
Energies 15 07528 g008
Figure 9. Evolution of gas fraction inside delivery tube under circulation precooling process with flow rate of m = 0.2 kg/s.
Energies 15 07528 g009
Figure 10. Influence of flow rate on gas volume fraction variation during circulation flow process.
Energies 15 07528 g010
Figure 11. Influence of liquid subcooling on gas volume fraction variation in circulation flow process. (a) Cases under m = 0.2 kg/s; (b) Cases under m = 0.4 kg/s.
Energies 15 07528 g011
Table 1. Main parameters of LH2 delivery tube.
ParametersValues
Main tubeInner diameter155 mm
Wall thickness4 mm
Pipeline length4 m
Heat leakage1 W/m2
Branch tubeInner diameter100 mm
Wall thickness3.5 mm
Pipeline length0.56 m
Heat leakage1 W/m2
Spherical distributorInner diameter300 mm
Table 2. Initial and boundary parameters in the present CFD simulation.
ParametersValues
Initial liquid pressure0.4 MPa
Initial liquid temperature25.95 K
Contacting angle
Gravity levelCoast stage0 g0
Propellant reorientation10−1 g0–10−4 g0
Circulation flow10−3 g0
Flow rate in circulation flow0.1 kg/s, 0.2 kg/s, 0.4 kg/s
Liquid subcooling in circulation quenching0 K, 1 K, 2 K
Publisher’s Note: MDPI stays neutral with regard to jurisdictional claims in published maps and institutional affiliations.

