Article

Experimental Study on Shear Characteristics of Structural Plane with Different Fluctuation Characteristics

1
State Key Laboratory of Geomechanics and Geotechnical Engineering, Institute of Rock and Soil Mechanics, Chinese Academy of Sciences, Wuhan 430071, China
2
University of Chinese Academy of Sciences, Beijing 100049, China
3
Hubei Key Laboratory of Geo-Environmental Engineering, Institute of Rock and Soil Mechanics, Chinese Academy of Sciences, Wuhan 430071, China
4
Pipe China West East Gas Pipeline Company, Shanghai 200120, China
*
Author to whom correspondence should be addressed.
Energies 2022, 15(20), 7563; https://doi.org/10.3390/en15207563
Submission received: 8 September 2022 / Revised: 6 October 2022 / Accepted: 10 October 2022 / Published: 13 October 2022
(This article belongs to the Special Issue Advances in the Utilization of Underground Energy and Space)

Abstract

:
With the increasing scale and depth of underground engineering, the geological environment that engineering is faced with is becoming more complex. As the weak position of rock mass, the structural surface has a particularly great influence on the mechanical characteristics of the rock mass. In order to obtain the shear strength characteristic of the structural plane and analyze the influence of morphological parameters such as the undulating angle and bulge degree on shearing, taking medium-low permeability tight sandstone as the research object, four kinds of structural plane samples with different undulating angles (10, 20, 30 and 40°) were prepared with a Python and high-precision engraving machine. Direct shear tests under different normal stresses (2, 4, 6 and 8 MPa) and shear rates (0.6, 1.2 and 2.4 mm/min) were performed, and the shear mechanical properties were analyzed. The structural surfaces before and after shearing were scanned using a high-precision three-dimensional scanner, so as to evaluate the roughness of the structural surface and determine the influence from various factors on the shear characteristics. The test results showed that for the structural plane with the same undulating angle, the peak shear stress increased approximately linearly with an increase in normal stress at a 0.6 mm/min shear rate and an increment speed of approximately 0.82, while the peak shear stress negatively correlated with the shear rate at a value of 4 MPa for normal stress. The larger the undulating angle was, the greater the influence of the shear rate (the shear stress decreased by 2.31 MPa at a 40° angle). When the normal stress and the shear rate were fixed, the peak shear stress corresponding to the structural surface gradually increased with the increase in the undulating angle, and the maximum increment was 5.04 MPa at 4 MPa normal stress and a 0.6 mm/min shear rate. An analysis of the morphological characteristics of the structural plane showed that when the undulating angle (40°) and the normal stress (6 and 8 MPa) were larger, the damage of the structural plane became more obvious, the shear point was closer to the tooth valley position, and the mechanical bite force and friction force of the structural plane were better utilized. When the shear rate was lower (0.6 mm/min), the friction characteristics of the shear surface were more visible, the shear was increasingly sufficient, and the corresponding shear strength was also greater.

1. Introduction

Natural rock mass contains many structural planes, which are evolved and interlaced, forming the weak surface of the rock mass and weakening the strength of the intact rock [1,2,3,4,5]. Engineering practice in water conservancy and hydropower, the construction of traffic tunnels, deep mining, salt cavern gas storage and other applications shows that the characteristics and distribution of structural plane are among the key factors for determining safety in underground engineering, a field which brings many challenges to the stability of engineering rock mass [6,7,8,9,10,11,12]. As the main factor affecting the mechanical properties of natural rock mass, the most common failure mode of structural plane is shear failure, and there are many factors affecting shear mechanical properties, including the geometric characteristics, roughness and filler of the structural plane, as well as the rock cohesion and internal friction angle [13,14,15,16]. Therefore, research on the shear characteristics of structural planes with different fluctuation characteristics has a guiding significance for engineering.
Scholars have conducted a series of shear characteristics research studies concerning different kinds of structural planes and have achieved some results. In the area of theory research, according to the principle of strain energy equivalence, Zhao et al. [17] established an equivalent homogeneous model and an expression of the stress state for coal-rock mass and derived the compression shearing damage criterion for this model. Through the spatial modeling of the rock wedge sliding phenomenon, Deng [18] obtained the LE solution for its stability and derived the formula for calculating its FOS. Based on shear creep experiments from two different marble structural planes, He et al. [19] proposed a constitutive model to describe time-dependent damage characteristics. Xiao et al. [20] presented a new shear stress–shear displacement constitutive model based on the softening and strengthening mechanism of structural plane during shear failure. After a detailed analysis of the existing model′s limitations, Tang et al. [21] put forward an updated broad-sense constitutive model, which could describe the changing characteristics of curves by using a function.
Regarding the research on numerical simulation, Tan et al. [22] conducted field direct shear experiments on the structure planes with thick mud layers in the muddy interlayer of Guizhou Expressway and used the UDEC program to establish a related numerical model, which revealed the shear failure mechanism of the muddy structure plane. Naji et al. [23] studied the effect of the shear zone on the occurrence of rock burst near the tunnel by using a FLAC(3D), revealing that the stress near the shear zone was more concentrated and the rock near this area was displaced. Badika et al. [24] used the cohesive friction model to verify the shear characteristics of the concrete-rock interface, which provided ideas for robust statistical analysis. Zhang et al. [25] employed PFC(2D) to numerically simulate shear mechanical tests on five kinds of structural plane samples with different roughnesses and obtained the shear characteristics under different normal stresses. Liu et al. [26] systematically studied the macroscopic and microscopic shear mechanical behavior of the rock mass with through-serrated structural plane through a combination of laboratory tests and numerical simulations. Ghazvinian et al. [27] and Sarfarazi et al. [28] also used PFC(2D) to simulate the shear behavior of non-persistent joint models with different shapes, indicating that tension was the dominant mode for fracturing.
In terms of experimental studies, Meng et al. [10] used granite joints for shearing tests, during which acoustic emission monitoring was performed, and finally, a prediction method for fault-slip rockburst was obtained. Huang et al. [29] obtained the shear strength characteristics of the structural plane of the multi-scale rock model through direct shear tests; the samples were mixed with high-strength cement, silica fume, highly efficient water reducer, standard sand and water. Dong et al. [30] proposed a calculation method for obtaining the static displacement of a rock mass slope based on the cyclic simple shear experiment of splitting the structural plane. Seidel and Haberfield [31] conducted shear tests on regular saw-shaped structural plane using concrete samples and researched the variation law for shearing strains with different normal stresses. Kwon et al. [32] used gypsum materials to make rectangular structural planes with different undulating heights. The relationship between the shearing strength, normal stress and convex height was obtained by performing a direct shear test, and a rigid structural plane model was established based on this relationship. In order to reinforce fractured rock mass, grouting technology is applied, and its effect on rock mass is mainly reflected in the mechanical properties of structural planes. Lu et al. [33] took red sandstone as their research object. The structural plane was made by the splitting method, and the cement and the epoxy resin were selected as grouting materials. Direct shearing experiments under different normal stresses were performed and compared with those for non-grouting structural planes. Based on a shear-seepage experiment device, Xu et al. [34] conducted shearing tests on structural planes with different filled conditions and studied the aperture evolution of structural planes with the use of three-dimensional scanning technology. Gu et al. [35] used natural rock mass interlayer as their research object and conducted a direct shearing test after a dry–wet cycle in order to obtain the relevant damage evolution model.
In general, scholars mostly used static (cyclic) direct shearing tests and numerical simulation methods as the main means with which to research the shearing properties of rock structural plane, and the laboratory test samples were generally made with similar materials. Although some achievements have been realized, the results are barely satisfactory considering the differences between similar materials and natural rocks.
In this study, medium-low permeability tight sandstone was taken as the research object. Four kinds of structural plane samples with different undulating angles were prepared by using Python and a high-precision engraving machine; direct shearing tests under various normal stresses and shear rates were performed to obtain the shearing mechanical properties. The structural surfaces before and after shearing were scanned by a high-precision 3D scanner, and the roughness changes in the structural planes were compared and analyzed to determine the failure behavior and the influence from various factors on the shear characteristics. The achievements from this research could enrich existing fundamental theory concerning the shear characteristics of natural rock structural planes and aid in making reference values for stability analysis.

2. Experimental Design and Preparation

2.1. Preparation of Test Samples

The surface fluctuation characteristics of natural structural plane rock mass are diverse, so it is difficult to collect samples with the same structural plane characteristics. If the direct shear test is carried out using natural structural plane rock mass, a consistent law may not be obtained.
In order to obtain the characteristic parameters of fault shear strength and analyze the influence of morphological parameters such as the undulating angle and bulge degree of the fault slip plane on the shearing effect, considering the representativeness of the samples comprehensively, a medium-low permeability tight sandstone was chosen to be used to process a 50 mm × 50 mm × 60 mm cuboid. Then, it was cut into two 50 mm × 50 mm × 30 mm cuboids along the center line of the 60 mm side. Using the same sandstone, 24 groups of samples using these specifications were processed to meet the requirements of the relevant experiments for different shear conditions.
In the process of making fault simulation samples, Python was first used to establish a 3D model of the fault surface in a square range of 50 mm × 50 mm; the fixed step size of the sawteeth-shaped undulating body was 5 mm with a total of 10 steps, and the undulating angles were set to 10°, 20°, 30° and 40°. The built model was output in an STL file. Then the processed 50 mm × 50 mm × 30 mm sample was fixed on a carving panel, and a numerical-controlled rock engraving machine automatically reconstructed the mesh and generated a carving path according to the imported STL file content. Finally, the taper ball-end cutter automatically completed the production of the structural plane according to the tool path. The accurate modeling capability of Python and the fine engraving of the high-precision engraving machine ensured that the undulating angles of the structural surface were completely shaped in accordance with the design angle.
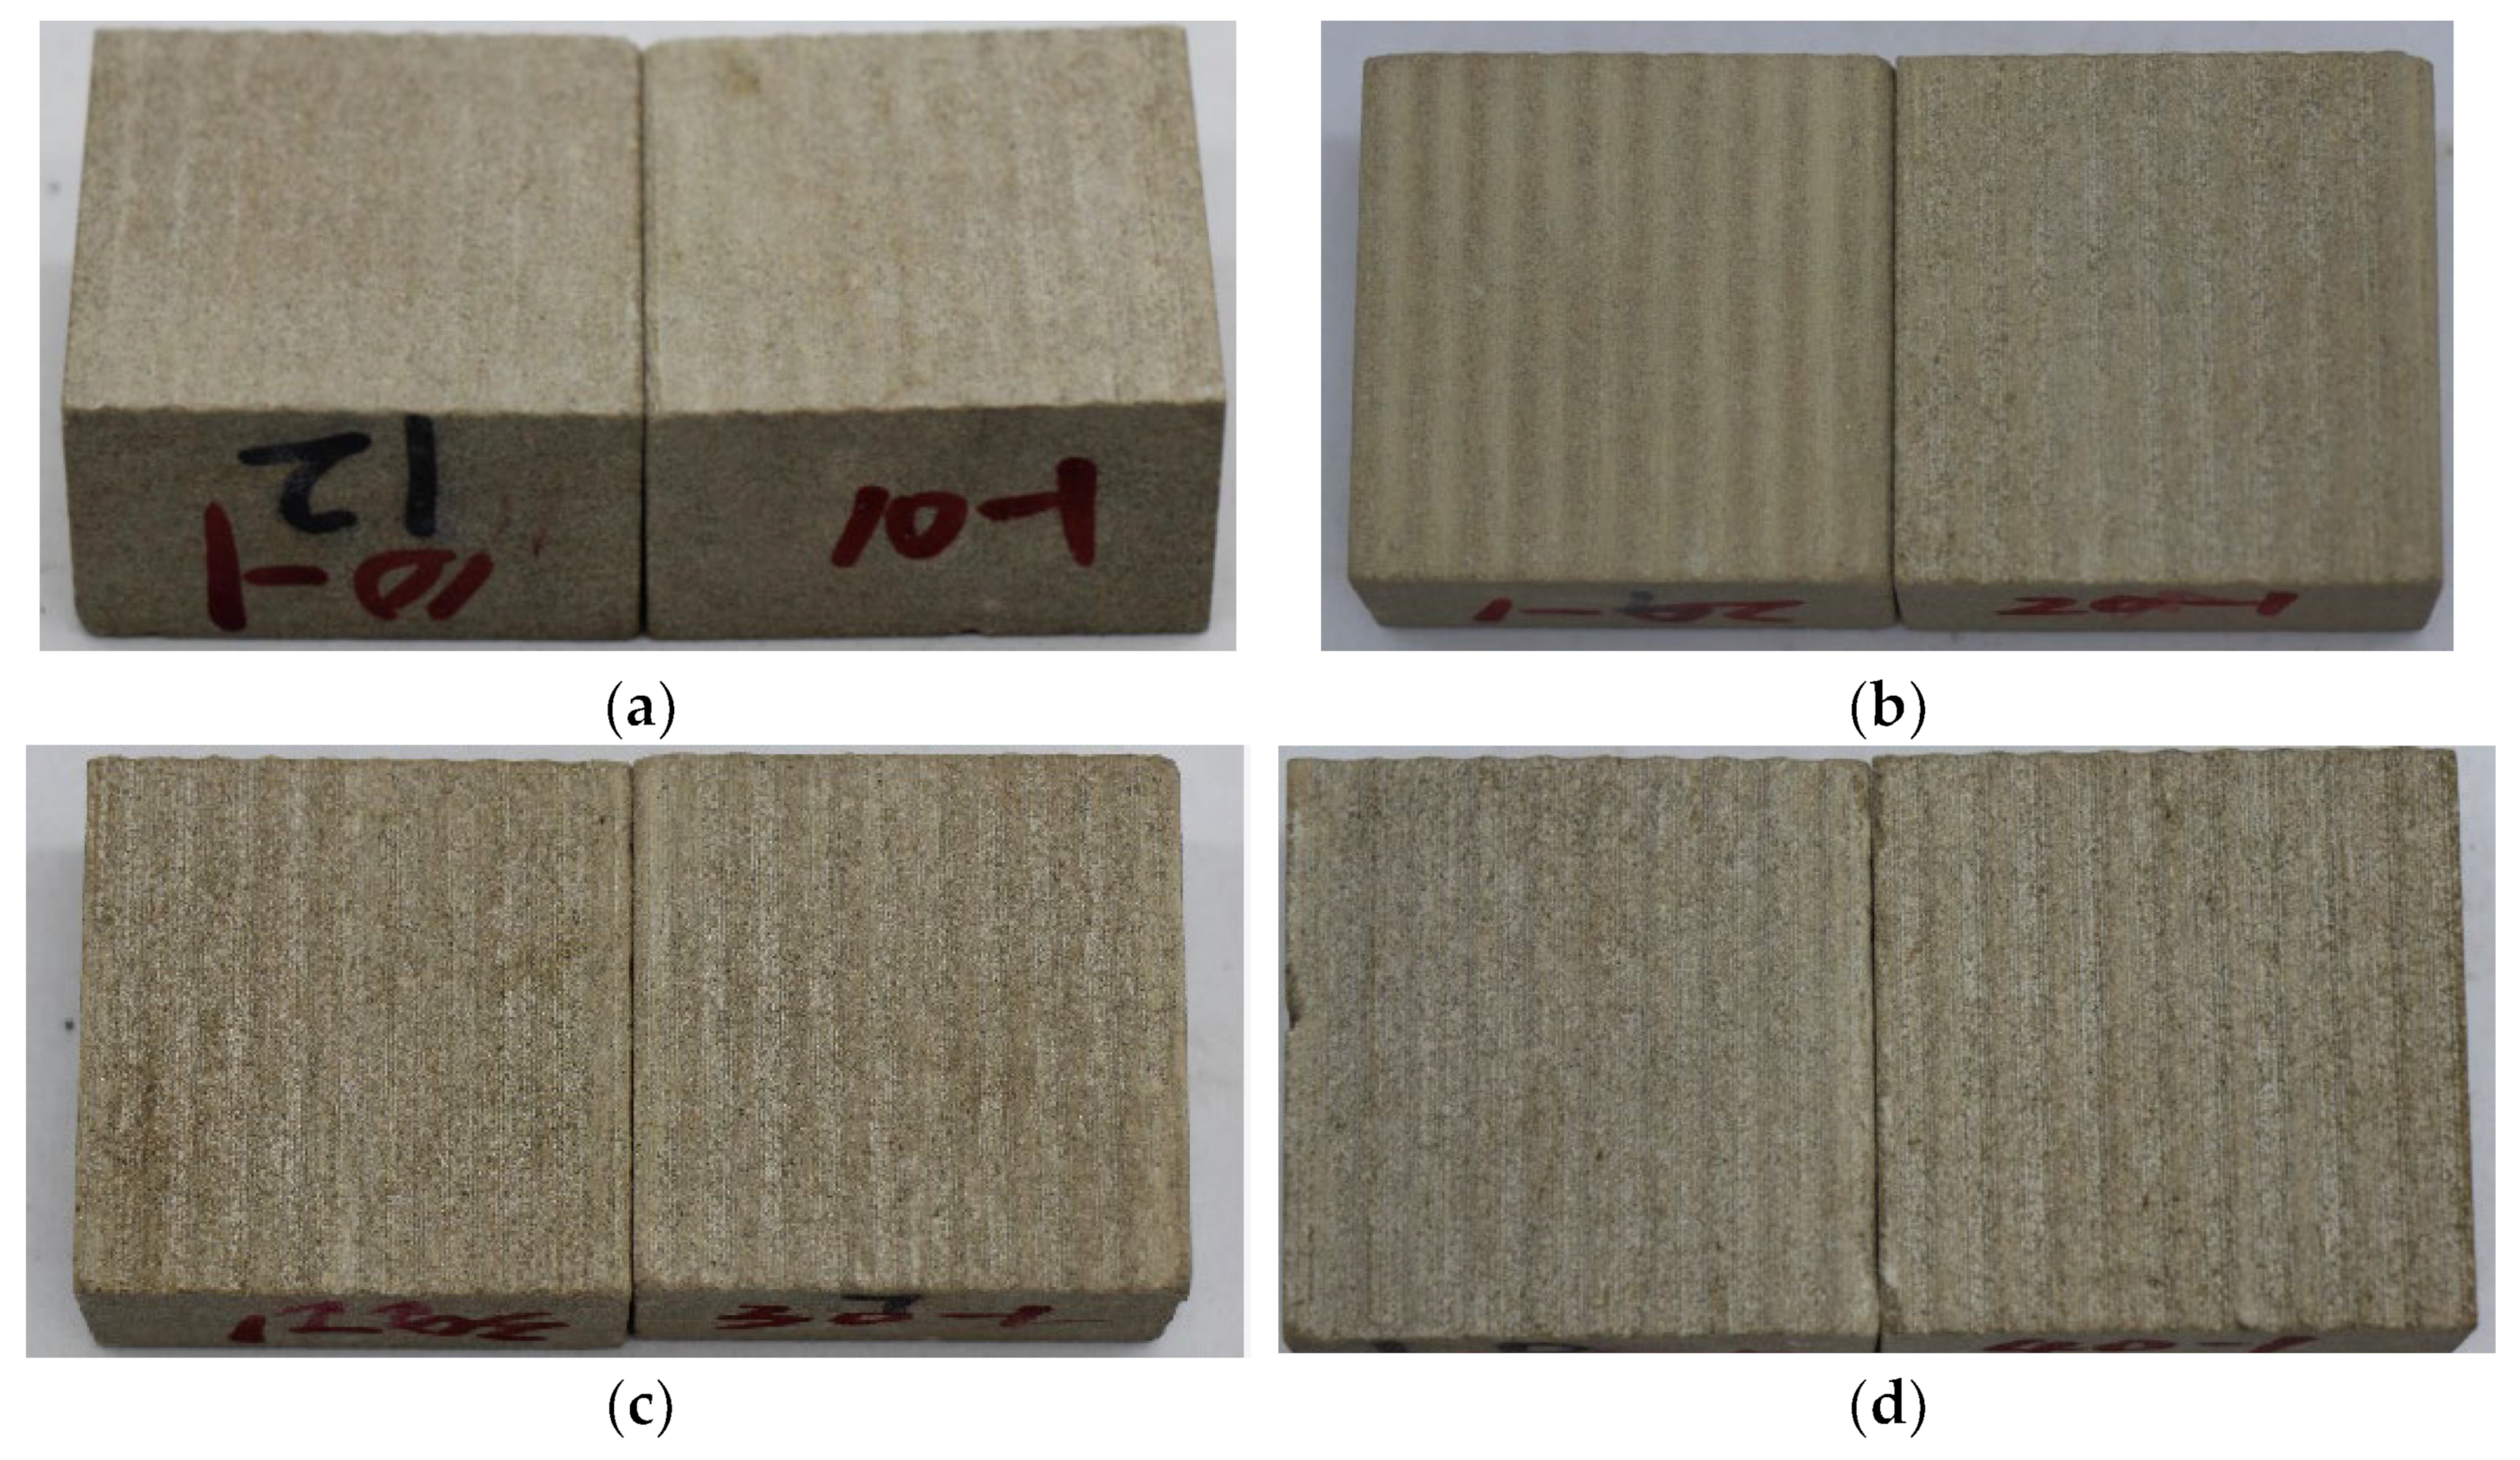
The carving process of the high-precision engraving machine and the carved fault simulation sample are shown in Figure 1. Figure 2 shows the carved sample surfaces with undulating angles of 10°, 20°, 30° and 40°. Six groups of samples were processed for each undulating angle, as shown in Figure 3. It can be clearly observed from Figure 2 and Figure 3 that with an increase in the undulating angle, the undulating characteristics of the structural plane become more obvious, and the upper and lower samples are closely fitted with almost no gaps, indicating that the processed fault simulation samples fully meet the accuracy requirements of the test.

2.2. Testing Equipment and Methods

The direct shear test was completed using the RMT-150C rock mechanics experimental system independently developed by the Wuhan Institute of Rock and Soil Mechanics at the Chinese Academy of Sciences. The testing machine adopts a digitally controlled electro-hydraulic servo system, which is mainly used to test the mechanical properties of rock or concrete materials. During the test, the system can automatically record the tangential force, normal force and displacement data. The maximum horizontal load is 500.0 kN, the horizontal piston stroke limit is 50.0 mm and the deformation rate is 0.0001~1.0 mm/s. The RMT-150C rock mechanics experimental system and direct shear test are shown in Figure 4.
The normal stress σ n and shear stress τ s of the direct shear test can be expressed as:
τ s = Q A σ n = N A
where N (kN) is the normal force, Q (kN) is the the shear force on the test sample and A (m2) is the effective shearing area of the sample along the shear direction.
The uniaxial compressive strength of tight sandstone was measured to be 38 MPa~40 MPa by using a standard cylindrical specimen with a diameter of 25 mm and a height of 50 mm. The single shear test method recommended by the International Society of Rock Mechanics (ISRM) was adopted, which refers to a direct shear test with a fixed shear rate on the specimen under a certain normal pressure. The normal stress was set as 2, 4, 6 and 8 MPa. In the test, the normal force was loaded to the predetermined value at the rate of 1 kN/s and then kept constant, thereby fixing the upper shear test block. In order to apply the shear load, the lower block moved with a constant horizontal shear displacement, the shearing rate was 0.6 mm/min and the test was terminated when the shear stress reached the residual strength. At the same time, for the purpose of studying the influence of different shear rates on the shear characteristics of the structural plane, direct shear tests with the same normal stress of 4 MPa and shearing rates of 0.6, 1.2 and 2.4 mm/min were carried out. A total of 24 groups of experiments were carried out in combination with four undulating angles of 10°, 20°, 30° and 40°. The experimental process is shown in Table 1.

3. Test Results and Analysis

3.1. Effect of Normal Stress under Different Undulating Angles

The shear stress–displacement curves for the structural planes with different fluctuation characteristics under different normal stress levels are shown in Figure 5, Figure 6, Figure 7 and Figure 8. It can be seen that the shear stress–displacement curve of a non-flat structural plane has obvious peak characteristics. In the initial stage of shearing, the shear stress increased approximately linearly and rapidly with the increase in shear displacement. After the shear stress reached the first peak point, the shear stress showed obvious drop characteristics as the displacement continued to increase. Then, the second peak of shear stress appeared, which was smaller than the first peak in value.
An analysis shows that the first shear stress peak was caused by the undulating angle between the structural planes. At the beginning of the shearing, the mechanical bite force between the undulating angles prevented the occurrence of shear displacement, so that the shear stress quickly rose to the shear strength of the structural plane. When the undulating angle was destroyed, it reached the first peak point, then the shear stress dropped rapidly. With the advance of shear displacement, the rock particles produced by the shear failure generated a certain friction force between the structural planes. According to the principle of force balance, with the increase in damaged particles, the second shear stress peak appeared when the friction force accumulated to a certain value.
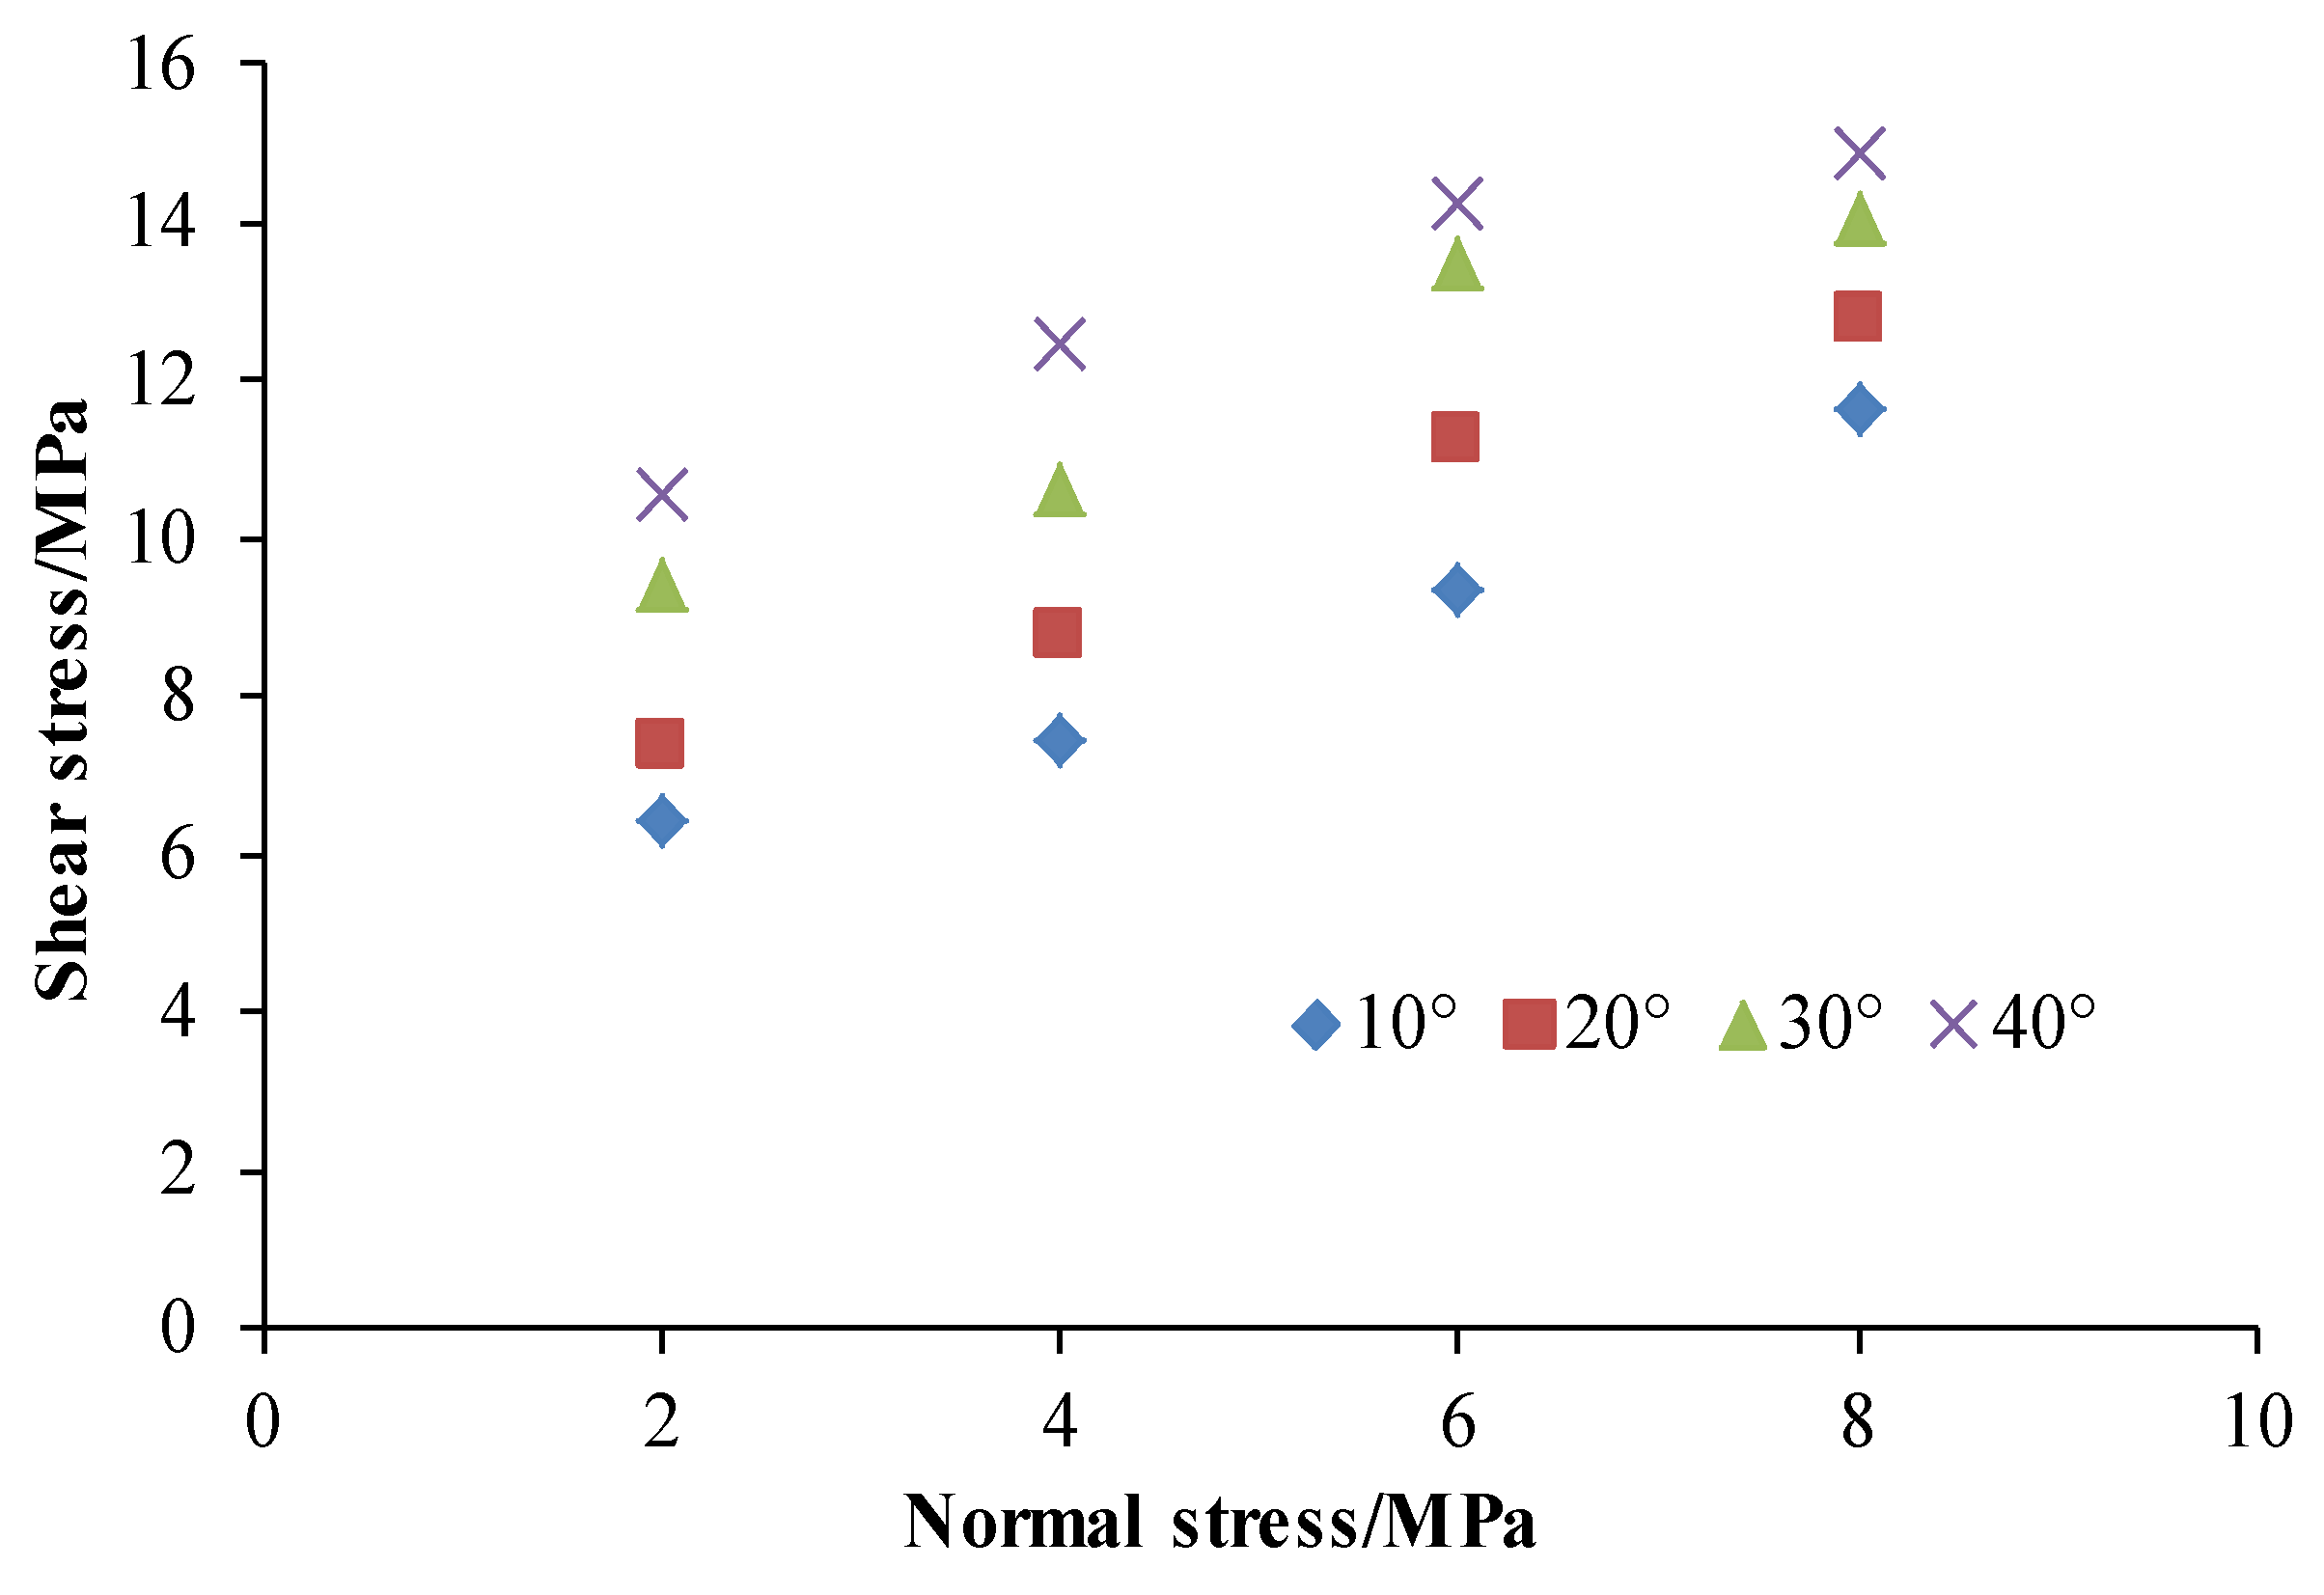
The morphological characteristics of the shear stress–displacement curves with the same undulating angle were similar under different normal stresses, the difference being that the peak shear stress corresponding to the shear slip was different. With an equal undulating angle under the same shear rate conditions (0.6 mm/min), which is manifested as the larger the normal stress, the greater the shear strength and it is almost linear growth. The shear strength increased by 5.25, 5.41, 4.63 and 4.36 MPa at the undulating angles of 10°, 20°, 30° and 40°, respectively, from 2 to 8 MPa normal stress with an increment speed of approximately 0.82. Specific references are found in Table 2 and Figure 9.
Through further comparative analysis, it was found that when the normal stress and shear rate were fixed, the peak shear stress corresponding to the structural surface gradually increased with the increase in the undulating angle, and the maximum increment of the shear stress was 5.04 MPa from a 10° to 40° undulating angle at 4 MPa normal stress and a 0.6 mm/min shear rate.

3.2. Effect of Shear Rate under Different Undulating Angles

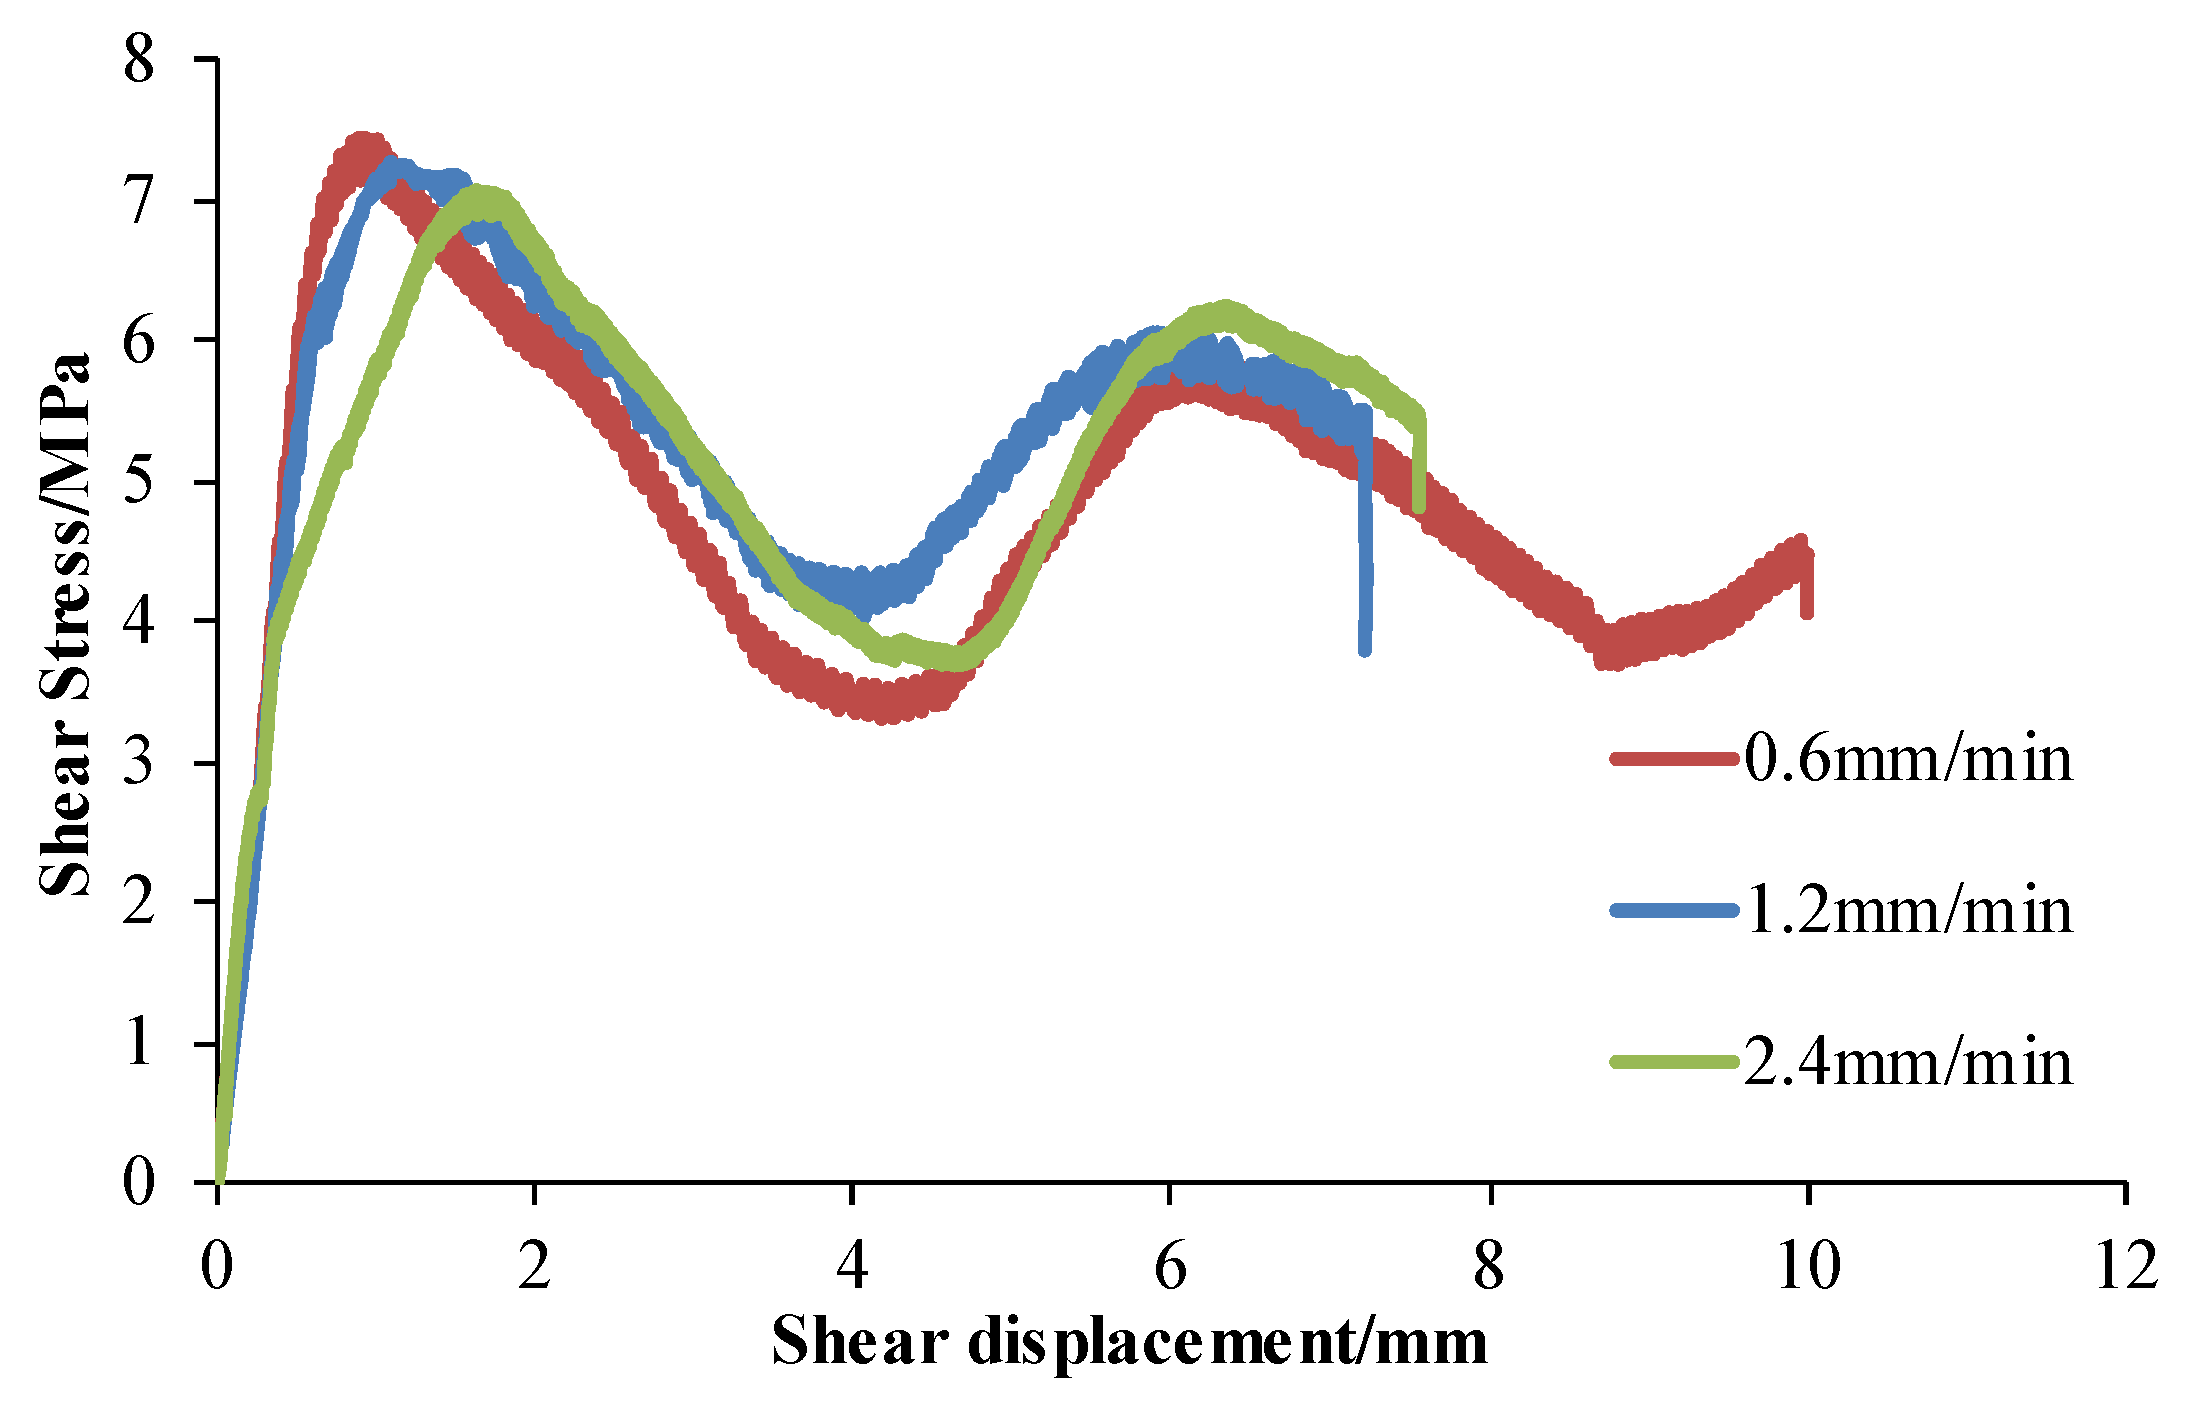
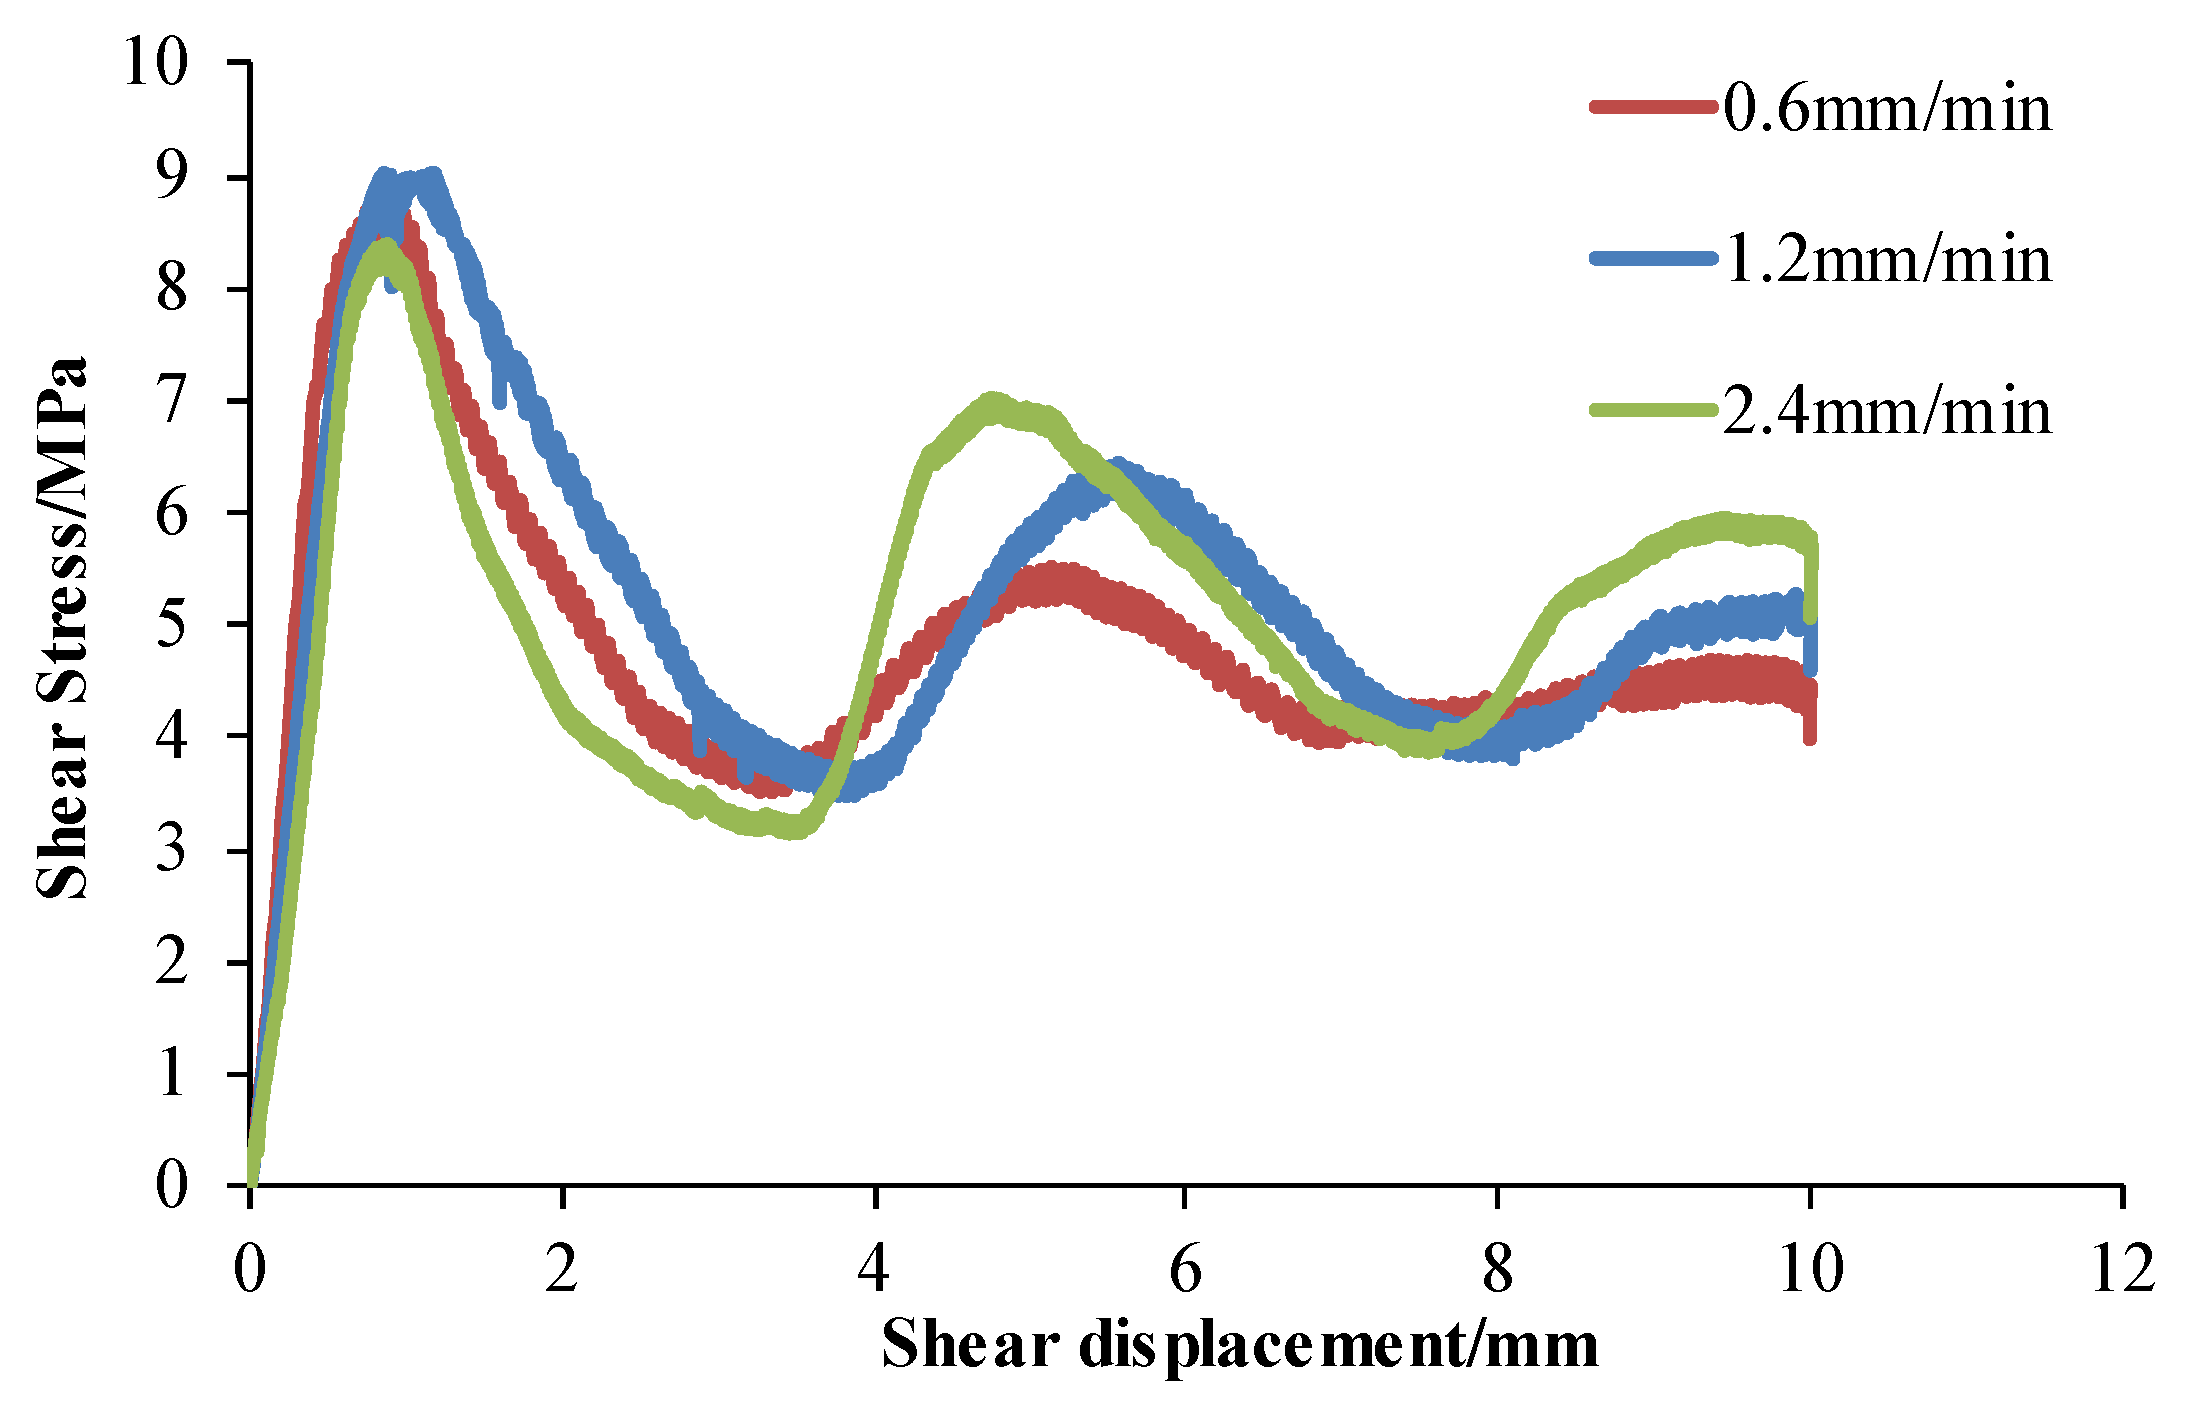
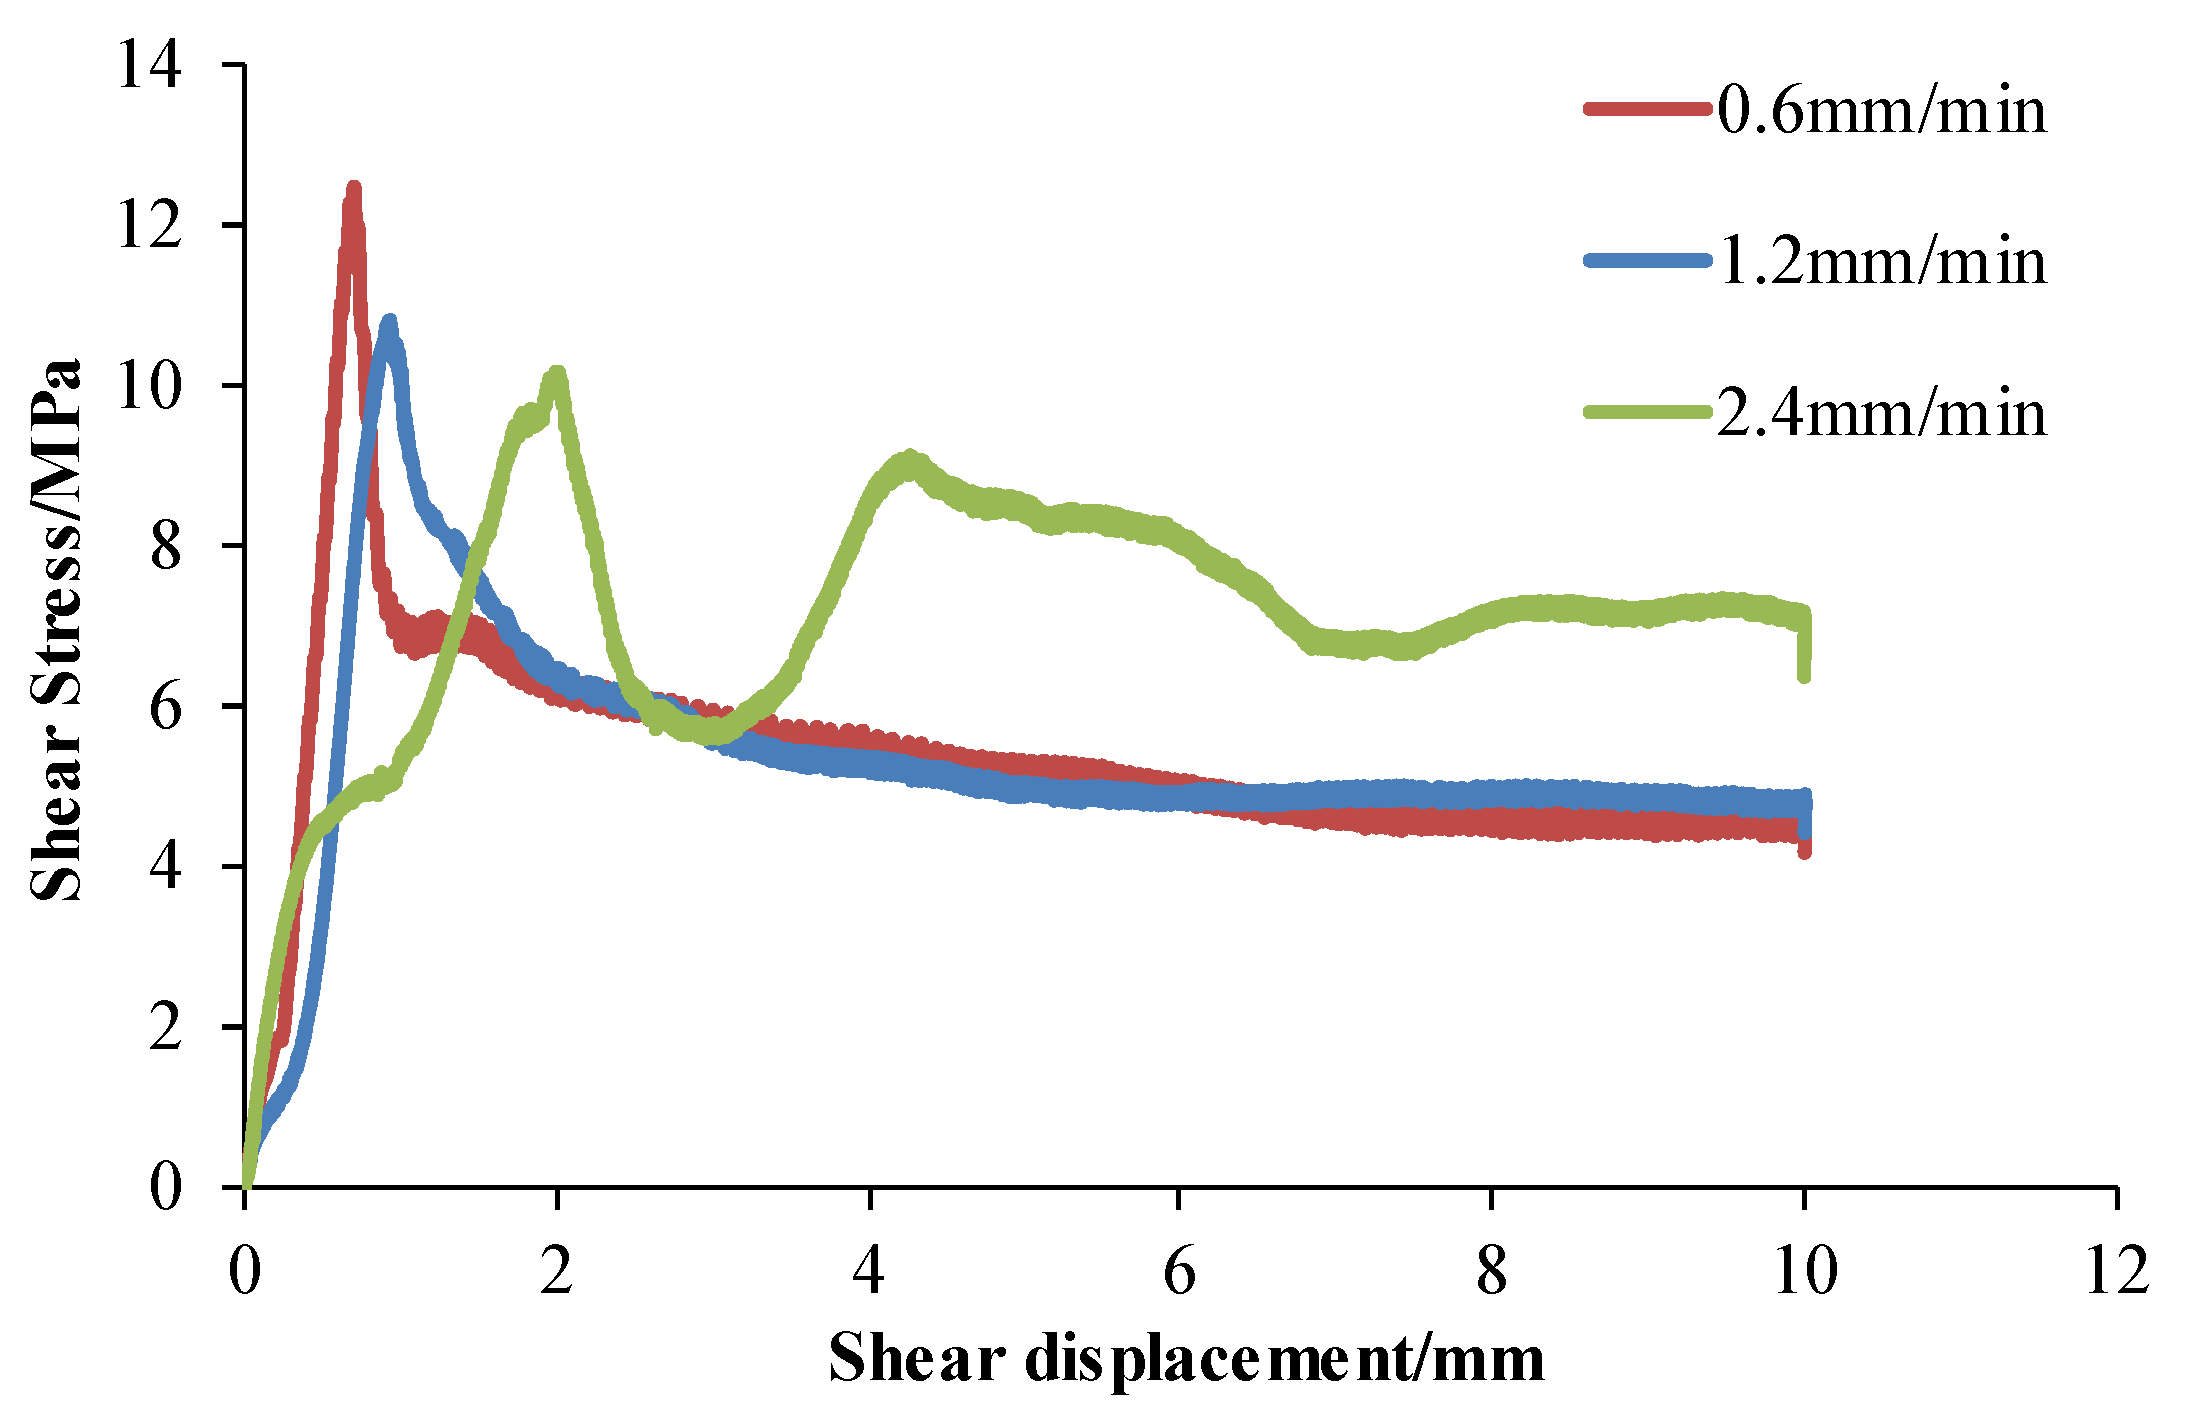
In order to study the effect of shear rate on fault, the shear stress–displacement curves for different fluctuation characteristics under the same normal stress and different shear rates are given, as shown in Figure 10, Figure 11, Figure 12 and Figure 13, where the normal stress was fixed at 4 MPa, and the shear rates were 0.6, 1.2 and 2.4 mm/min. It can be seen that when the undulating angles were 10°, 20° and 30°, the morphological characteristics of the shear stress–displacement curves under different shear rates were similar; when the undulating angle reached 40°, the characteristic curve fluctuated greatly under the action of a high shear rate (2.4 mm/min), indicating that the high fluctuation angle was more sensitive to the shear rate reaction.
Combined with the comprehensive analysis in Table 3 and Figure 14, it can be seen that when the structural plane with the same undulating angle was under the fixed normal stress of 4 MPa, the peak shear stress showed a decreasing trend on the whole as the shear rate increased. Among these, the peak shear stress almost linearly decreased at a structural plane with a lower undulating angle (10°) and exponentially decreased at a structural plane with a higher undulating angle (40°). The shear strength decreased by 0.37, 0.37, 1.14 and 2.31 MPa at the undulating angles of 10°, 20°, 30° and 40°, respectively, from a 0.6 to 2.4 mm/min shear rate, which further indicated that the shear strength of a structural plane with a high undulating angle was greatly affected by the shear rate. In particular, when the angle was 20°, the shear strength corresponding to the shear rate of 1.2 mm/min was greater than that of the 0.6 mm/min shear rate, which was caused by the heterogeneity of the rock. This experimental error does not affect the analysis of the overall shear characteristics.
It was also found that under the same normal stress and shear rate, the shear strength increased with the increase in the undulating angle. When the shear rate was 0.6, 1.2 and 2.4 mm/min, the shear strength increased by 5.04, 3.55 and 3.10 MPa, respectively, indicating that the undulating angle has a great influence on the shear strength under the action of a small shear rate.

3.3. Failure Analysis of Structural Plane

For the purpose of further clarification of the shear-slip characteristics and the understanding of the influence of different undulating angles on the failure of the structural plane, four groups of samples with a normal stress of 4 MPa and a shear rate of 0.6 mm/min were selected. A high-precision morphological scanning system was used to extract the morphological features of the fault plane after the direct shear test, and a the otherness under different fluctuation characteristics was analyzed by comparison with the scanning results before the experiment. Based on digital quantitative characterization processing (Wu et al. [36] and Han et al. [37]), the structural plane images before and after the experiment were obtained, as shown in Figure 15, where the 10-2, 20-2, 30-2 and 40-2 samples represent the undulating angles of 10°, 20°, 30° and 40°, respectively. It is especially noteworthy that, in order to make the images more intuitive for interpretation, a change in the elevation difference of the structural plane was used to reflect its roughness. Different colors represent the distinctions in the elevation difference, in which red (positive value) represents the convex part and blue (negative value) represents the concave position. The shear direction of all the structural planes is from left to right.
By observing Figure 15a,c,e,g, it can be found that with the increase in the undulating angle, the blue at the tooth valley deepened, indicating that the sawteeth of the structural plane became more obvious, which made the structural plane possess greater mechanical bite force and increased the contact surface of the upper and lower specimens. Under the same normal stress and shear rate, the structural planes after direct shear test are shown in Figure 15b,d,f,h. It can be clearly observed that there were chopped and pulverized materials on the damaged structural plane, and with the increase in shear displacement, the debris and powder slipped along the shear direction. Therefore, when the structural plane was subjected to a horizontal shear force, the convex undulating angle underwent shear failure due to the force. With the increase in the undulating angle, the damage of the structural plane became more obvious. When the shear wear particles increased, the friction coefficient between the structural surfaces increased indirectly, so the mechanical bite force and friction force between the structural planes with the larger undulating angle jointly promoted the increase in its shear strength. The analysis results were consistent with the Table 2.
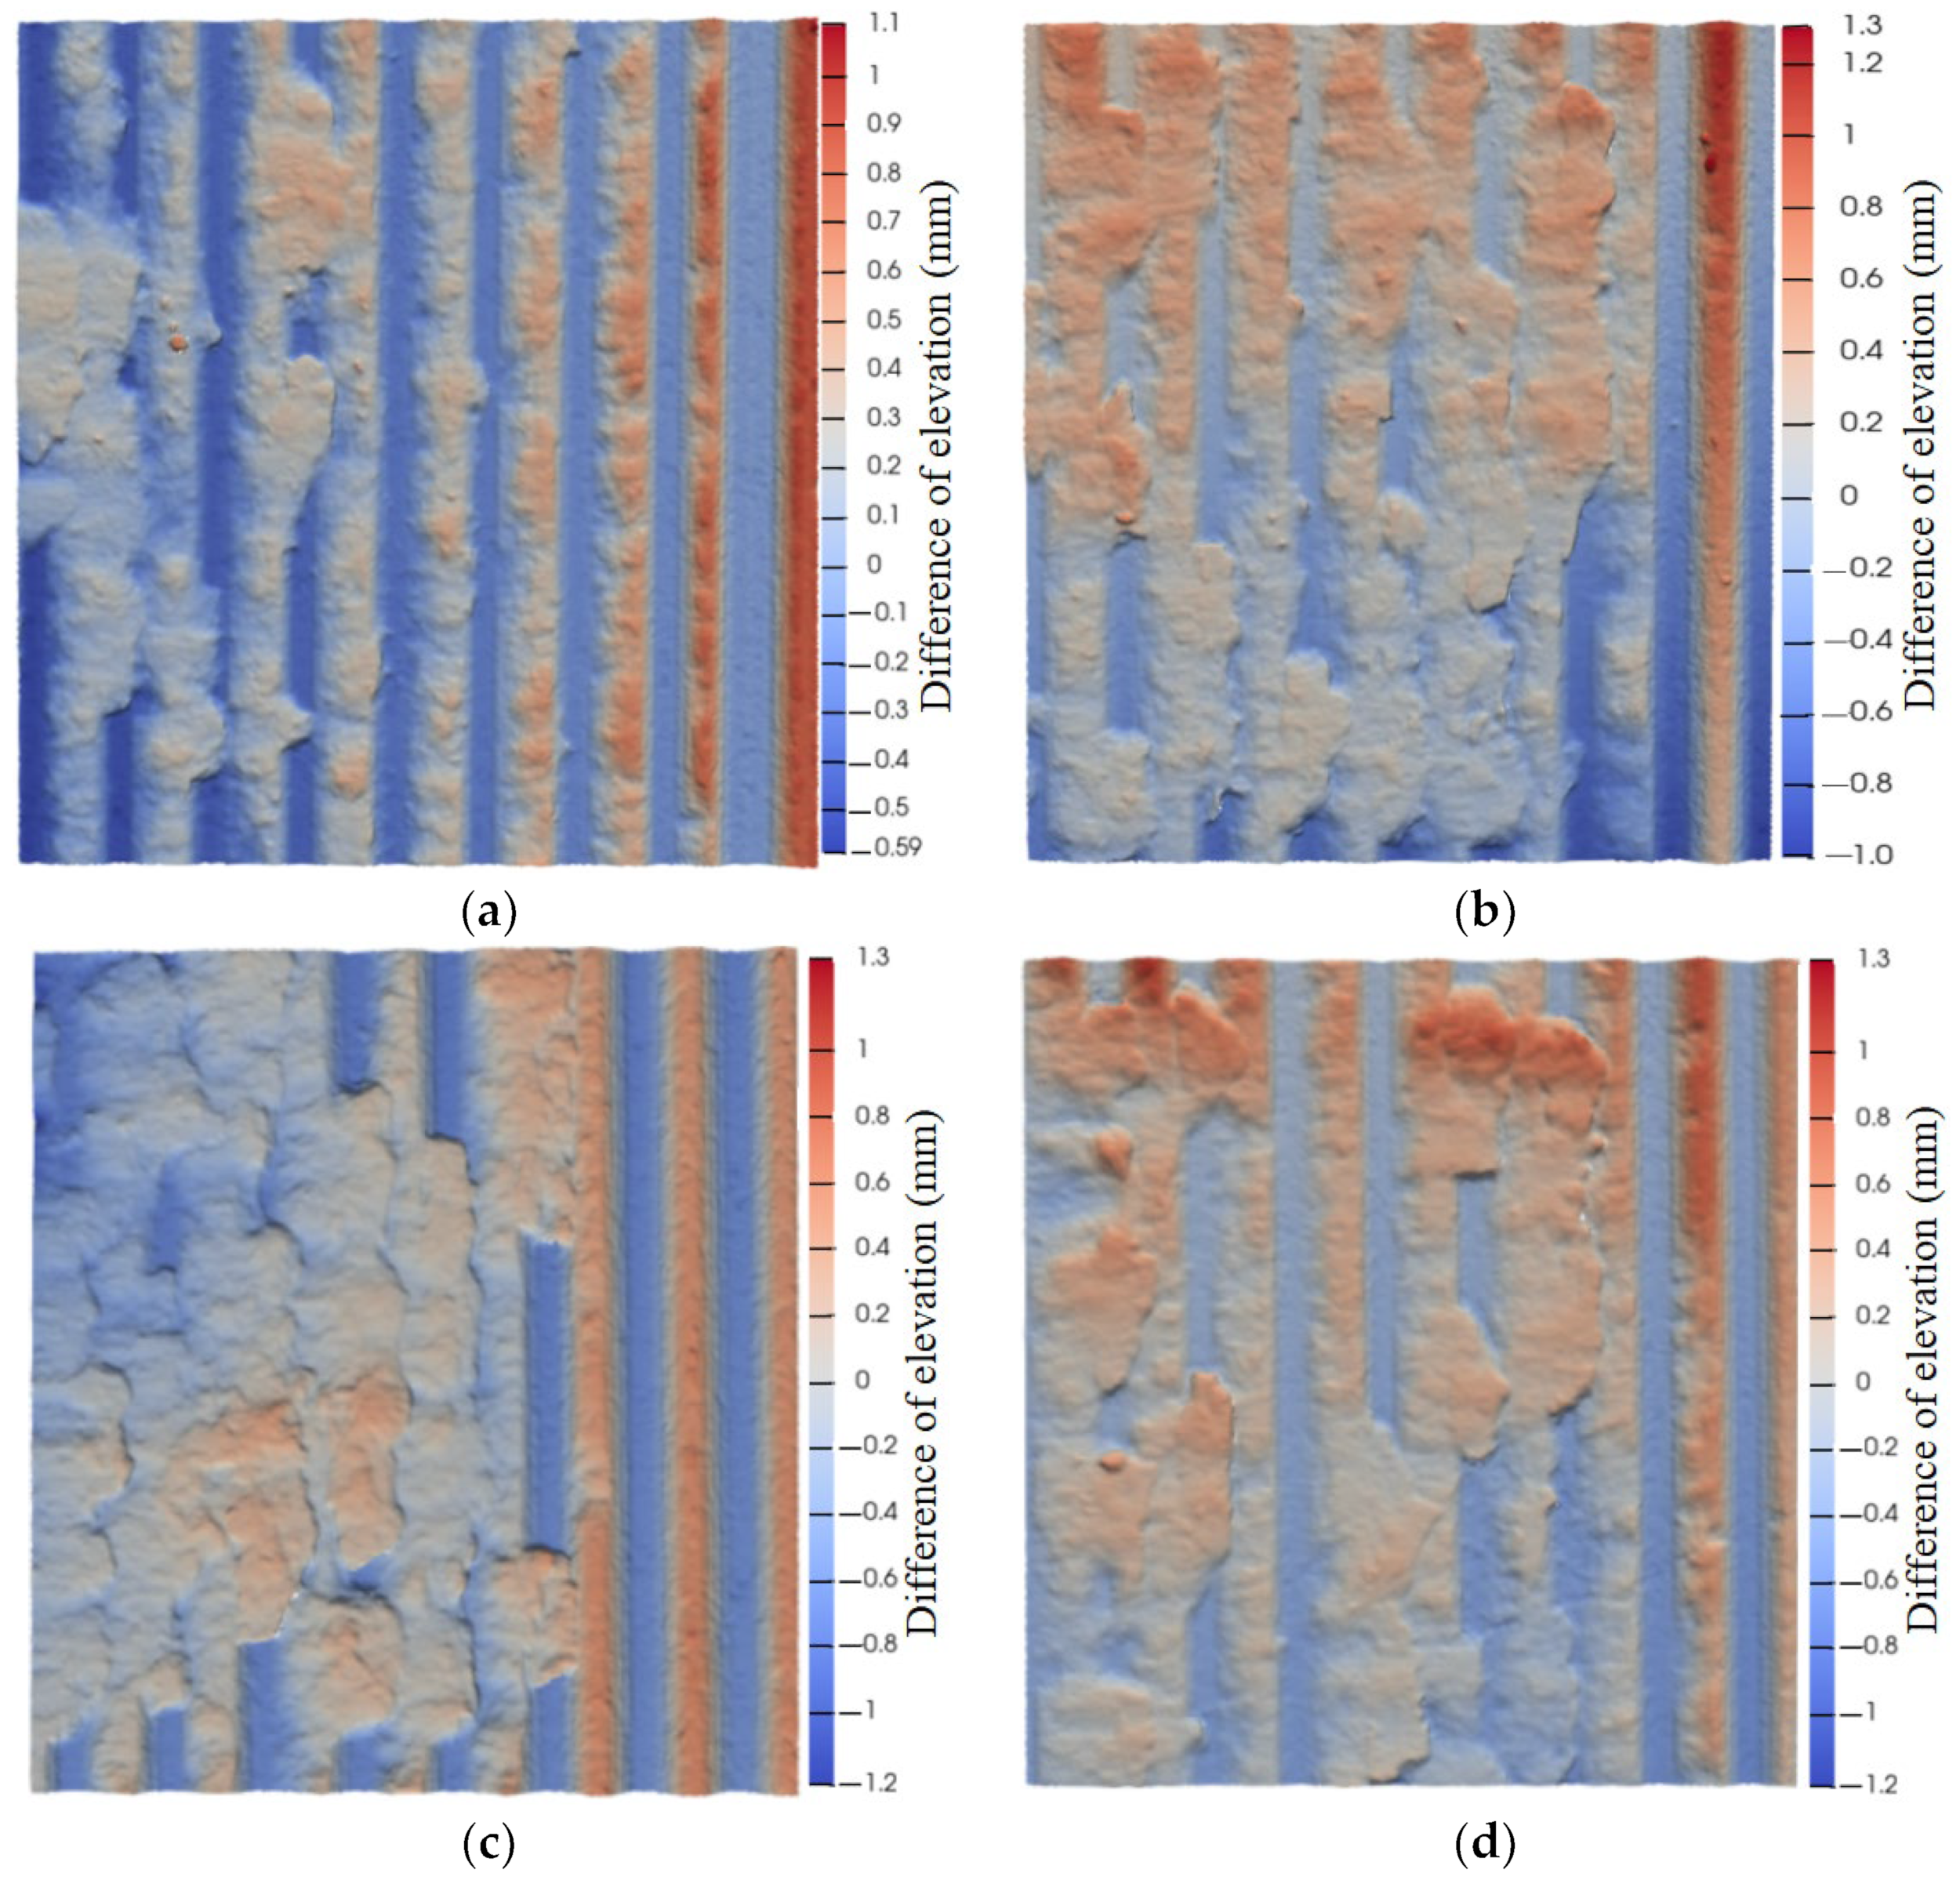
Based on the results from the previous analysis, it was determined that the rupture form was the most obvious when the undulating angle was 40°. For the purpose of analyzing the effect of different normal stresses and shear rates on the fracture characteristics of the structural plane in a more detailed and intuitive way, the structural surfaces of the six groups of samples with a 40° angle were processed by the same scanning method after experiment. The images of the damaged structural planes are shown in Figure 16, and the normal stress and shear rate corresponding to each sample are shown in Table 1.
Through comparing and analyzing Figure 16a–d, which represents the structural planes with a 40° undulating angle under the same shear rate (0.6 mm/min), it can be found that, when the normal stress was a lower value (2 MPa), the friction bandwidth of the undulating wave crest of the structural surface was relatively smaller. When the normal stress was higher (6 and 8 MPa), the shearing position of the structural plane was closer to the tooth valley, the shear area was larger and the destructiveness was stronger. The application of a normal load ensured that the structural planes of the upper and lower specimens could contact better. With the increase in normal stress, the friction force of the structural planes increased when the shear movement occurred, which led to the increase in the peak shear stress, indicating that the normal load played a positive role in the shear strength of the structural plane. The analysis results are consistent with Table 2.
Further analysis of Figure 16b,e,f shows that under the same normal stress (4 MPa), when the shear rate was lower (0.6 mm/min), the shearing action was increasingly sufficient, the friction features of the shear surface were more obvious, and the corresponding shear strength was also greater. When the shear rate was larger (2.4 mm/min), the shear failure mainly occurred in the initial stage, the undulating angle was relatively less damaged, the residual friction powder on the structural plane was also reduced, and the corresponding shear strength was also lessened. The analysis results are consistent with Table 3.

4. Conclusions

This paper took tight sandstone as the research object, used Python and a high-precision engraving machine to prepare four kinds of structural plane samples with different undulating angles, conducted direct shear tests under different normal stresses and shear rates, and analyzed the shear mechanical properties. Finally, a high-precision 3D scanner was used to describe the morphological changes in the structural planes before and after shearing. The conclusions are as follows:
(1)
The shear stress–displacement curve of the non-flat structural plane had obvious peak characteristics. The first shear stress peak was caused by the mechanical bite force between the undulating angles, and the second shear stress peak was mainly determined by the friction force between the structural planes.
(2)
For a structural plane with the same undulating angle, the shear strength increased approximately linearly with the increase in normal stress. The increment speed was approximately 0.82, while the shear strength w negatively correlated with the shear rate, and which with a high undulating angle, was greatly affected by the shear rate (the shear stress decreased by 2.31 MPa at a 40° angle).
(3)
As the normal stress and the shear rate were fixed, the shear strength corresponding to the structural surface gradually increased with the increase in the undulating angle, and the maximum increment was 5.04 MPa at 4 MPa normal stress and a 0.6 mm/min shear rate.
(4)
With an increase in the undulating angle, the mechanical bite force of the structural plane increased, and its shear failure became more obvious. The shear wear particles further increased the friction force between the structural planes, thereby increasing the shear strength.
(5)
When the undulating angle was 40°, the shear point was closer to the tooth valley position, while the normal stress was higher (6 and 8 MPa), and the shear process was increasingly sufficient as the shear rate became lower (0.6 mm/min). These conditions made the friction features of the shear surface more visible and the corresponding shear strength also increased.

Author Contributions

Conceptualization, Y.G.; Data curation, Q.Y. and D.X.; Formal analysis, L.H.; Investigation, H.Z. and F.H.; Methodology, M.X.; Project administration, H.G.; Resources, D.W.; Supervision, H.L.; Writing—original draft, M.X.; Writing—review & editing, M.X. All authors have read and agreed to the published version of the manuscript.

Funding

The authors would like to express their appreciation for the funding support from the CAS Pioneer Hundred Talents Program (No. 2017-124).

Data Availability Statement

Not applicable.

Conflicts of Interest

The authors declare no conflict of interest.

References

  1. Shaunik, D.; Singh, M. Strength behaviour of a model rock intersected by non-persistent joint. J. Rock Mech. Geotech. Eng. 2019, 11, 1243–1255. [Google Scholar] [CrossRef]
  2. Fan, Q.; Feng, X.; Weng, W.; Fan, Y.; Jiang, Q. Unloading performances and stabilizing practices for columnar jointed basalt: A case study of Baihetan hydropower station. J. Rock Mech. Geotech. Eng. 2017, 9, 1041–1053. [Google Scholar] [CrossRef]
  3. Wang, D.; Li, X.; Li, G.; Mao, T.; Zheng, B. The Characterization of Shale Differences Based on Petrophysical Properties and Pore Structure: A Case Study of the Longmaxi Formation in Northern Guizhou Province and the Yanchang Formation in the Ordos Basin. Appl. Sci. 2022, 12, 5303. [Google Scholar] [CrossRef]
  4. Wan, J.; Peng, T.; Shen, R.; Jurado, M.J. Numerical model and program development of TWH salt cavern construction for UGS. J. Pet. Sci. Eng. 2019, 179, 930–940. [Google Scholar] [CrossRef] [Green Version]
  5. Wan, J.; Peng, T.; Yuan, G.; Ban, F.; Jurado, M.J.; Xia, Y. Influence of tubing/oil-blanket lifting on construction and geometries of two-well-horizontal salt caverns. Tunn. Undergr. Space Technol. 2021, 108, 103688. [Google Scholar] [CrossRef]
  6. Yang, C.; Jing, W.; Daemen, J.J.; Zhang, G.; Du, C. Analysis of major risks associated with hydrocarbon storage caverns in bedded salt rock. Reliab. Eng. Syst. Saf. 2013, 113, 94–111. [Google Scholar] [CrossRef]
  7. Guo, Y.; Deng, P.; Yang, C.; Chang, X.; Wang, L.; Zhou, J. Experimental Investigation on Hydraulic Fracture Propagation of Carbonate Rocks under Different Fracturing Fluids. Energies 2018, 11, 3502. [Google Scholar] [CrossRef] [Green Version]
  8. Xu, M.; Li, X.; Liu, T.; Luo, Y.; Huang, J.; Wang, G.; Wang, Y.; Gao, W. A study on hollow effect and safety design of deep crossing caverns under blasting vibration. Tunn. Undergr. Space Technol. 2021, 111, 103866. [Google Scholar] [CrossRef]
  9. Barton, N. Review of a new shear-strength criterion for rock joints. Eng. Geol. 1973, 7, 287–332. [Google Scholar] [CrossRef]
  10. Meng, F.; Zhou, H.; Wang, Z.; Zhang, L.; Kong, L.; Li, S.; Zhang, C. Experimental study on the prediction of rockburst hazards induced by dynamic structural plane shearing in deeply buried hard rock tunnels. Int. J. Rock Mech. Min. Sci. 2016, 86, 210–223. [Google Scholar] [CrossRef]
  11. Fang, J.; Kong, G.; Yang, Q. Group Performance of Energy Piles under Cyclic and Variable Thermal Loading. J. Geotech. Geoenvironmental Eng. 2022, 148, 04022060. [Google Scholar] [CrossRef]
  12. Li, J.; Wan, J.; Liu, H.; Jurado, M.J.; He, Y.; Yuan, G.; Xia, Y. Stability Analysis of a Typical Salt Cavern Gas Storage in the Jintan Area of China. Energies 2022, 15, 4167. [Google Scholar] [CrossRef]
  13. Caleb, W.; Jan, T. Formation and maintenance of shear zones. Geology 2006, 34, 105–108. [Google Scholar]
  14. Belem, T.; Souley, M.; Homand, F. Modeling surface roughness degradation of rock joint wall during monotonic and cyclic shearing. Acta Geotech. 2007, 2, 227–248. [Google Scholar] [CrossRef]
  15. Pirzada, M.A.; Bahaaddini, M.; Moradian, O.; Roshan, H. Evolution of contact area and aperture during the shearing process of natural rock fractures. Eng. Geol. 2021, 291, 106236. [Google Scholar] [CrossRef]
  16. Li, J.; Wan, J.; Wang, T.; Yuan, G.; Jurado, M.J.; He, Q. Leakage simulation and acoustic characteristics based on acoustic logging by ultrasonic detection. Adv. Geo-Energy Res. 2022, 6, 181–191. [Google Scholar] [CrossRef]
  17. Zhao, Z.; Wang, W.; Wang, L.; Dai, C. Compression–shear strength criterion of coal–rock combination model considering interface effect. Tunn. Undergr. Space Technol. 2015, 47, 193–199. [Google Scholar] [CrossRef]
  18. Deng, D. Limit equilibrium analysis on the stability of rock wedges with linear and nonlinear strength criteria. Int. J. Rock Mech. Min. Sci. 2021, 148, 104967. [Google Scholar] [CrossRef]
  19. He, Z.; Zhu, Z.; Ni, X.; Li, Z. Shear creep tests and creep constitutive model of marble with structural plane. Eur. J. Environ. Civ. Eng. 2019, 23, 1275–1293. [Google Scholar] [CrossRef]
  20. Xiao, W.; Dui, G.; Chen, T.; Ren, Q. A study of constitutive model coupling dilatancy and degradation for jointed rock. Chin. J. Rock Mech. Eng. 2009, 28, 2535–2543. [Google Scholar]
  21. Tang, Z.; Xia, C.; Xiao, S. Constitutive model for joint shear stress-displacement and analysis of dilation. Chin. J. Rock Mech. Eng. 2011, 30, 917–925. [Google Scholar]
  22. Tan, X.; Ren, Y.; Li, T.; Zhou, S.; Zhang, J.; Zhou, S. In-situ direct shear test and numerical simulation of slate structural planes with thick muddy interlayer along bedding slope. Int. J. Rock Mech. Min. Sci. 2021, 143, 104791. [Google Scholar] [CrossRef]
  23. Naji, A.; Rehman, H.; Emad, M.; Yoo, H. Impact of shear zone on rockburst in the deep neelum-jehlum hydropower tunnel: A numerical modeling approach. Energies 2018, 11, 1935. [Google Scholar] [CrossRef]
  24. Badika, M.; EI Merabi, B.; Capdevielle, S.; Dufour, F.; Saletti, D.; Briffaut, M. Influence of Concrete–Rock Bonds and Roughness on the Shear Behavior of Concrete–Rock Interfaces under Low Normal Loading, Experimental and Numerical Analysis. Appl. Sci. 2022, 12, 5643. [Google Scholar] [CrossRef]
  25. Zhang, Y.; Wang, D.; Tang, H.; Li, C.; Yi, X. Study of shear strength characteristics of heterogeneous discontinuities using PFC2D simulation. Rock Soil Mech. 2016, 37, 1031–1041. [Google Scholar]
  26. Liu, X.; Xu, B.; Huang, J.; Lin, G.; Zhou, X.; Wang, J.; Xiong, F. Macro-meso shear mechanical behaviors of coalescent rock joints with different morphologies. Chin. J. Geotech. Eng. 2021, 43, 406–415. [Google Scholar]
  27. Ghazvinian, A.; Sarfarazi, V.; Schubert, W.; Blumel, M. A study of the failure mechanism of planar non-persistent open joints using PFC2D. Rock Mech. Rock Eng. 2012, 45, 677–693. [Google Scholar] [CrossRef]
  28. Sarfarazi, V.; Ghazvinian, A.; Schubert, W.; Blumel, M.; Nejati, H.R. Numerical simulation of the process of fracture of echelon rock joints. Rock Mech. Rock Eng. 2014, 47, 1355–1371. [Google Scholar] [CrossRef]
  29. Huang, M.; Du, S.; Luo, Z.; Ni, X. Study of shear strength characteristics of simulation rock structural planes based on multi-size direct shear tests. Rock Soil Mech. 2013, 34, 3180–3186. [Google Scholar]
  30. Dong, S.; Feng, W.; Yin, Y.; Hu, R.; Dai, H.; Zhang, G. Calculating the permanent displacement of a rock slope based on the shear characteristics of a structural plane under cyclic loading. Rock Mech. Rock Eng. 2022, 53, 4583–4598. [Google Scholar] [CrossRef]
  31. Seidel, J.; Haberfield, C. The application of energy principles to the determination of the sliding resistance of rock joints. Rock Mech. Rock Eng. 1995, 28, 211–226. [Google Scholar] [CrossRef]
  32. Kwon, T.; Hong, E.; Cho, G. Shear behavior of rectangular-shaped asperities in rock joints. KSCE J. Civ. Eng. 2010, 14, 323–332. [Google Scholar] [CrossRef]
  33. Lu, H.; Zhu, C.; Liu, Q. Study on shear mechanical properties of structural planes grouted with different materials. J. Rock Mech. Eng. 2021, 40, 1803–1811. [Google Scholar]
  34. Xu, J.; Lei, J.; Liu, Y. Experimental study on shear behavior of joints filled with different materials. Rock Soil Mech. 2019, 40, 4129–4137. [Google Scholar]
  35. Gu, D.; Liu, H.; Gao, X.; Huang, D.; Zhang, W. Influence of cyclic wetting–drying on the shear strength of limestone with a soft interlayer. Rock Mech. Rock Eng. 2021, 54, 4369–4378. [Google Scholar] [CrossRef]
  36. Wu, M.; Wang, W.; Shi, D.; Song, Z.; Li, M.; Luo, Y. Improved box-counting methods to directly estimate the fractal dimension of a rough surface. Measurement 2021, 177, 109303. [Google Scholar] [CrossRef]
  37. Han, L.; Wang, L.; Zhang, W.; Geng, B.; Li, S. Rockhead profile simulation using an improved generation method of conditional random field. J. Rock Mech. Geotech. Eng. 2022, 14, 896–908. [Google Scholar] [CrossRef]
Figure 1. Machining process and carved rock sample of high-precision engraving machine. (a) Engraving process; (b) Carved rock sample.
Energies 15 07563 g001
Figure 2. Rock sample surfaces with different undulating angles. (a) Undulating angle of 10°; (b) Undulating angle of 20°; (c) Undulating angle of 30°; (d) Undulating angle of 40°.
Energies 15 07563 g002
Figure 3. Summary of rock samples with different fluctuation characteristics. (a) Undulating angle of 10°; (b) Undulating angle of 20°; (c) Undulating angle of 30°; (d) Undulating angle of 40°.
Energies 15 07563 g003
Figure 4. RMT-150C rock mechanics experimental system and principle of direct shear test. (a) RMT-150C rock mechanics experimental system; (b) Principle of direct shear test.
Energies 15 07563 g004
Figure 5. Shear stress–displacement curves under different normal stresses at a 0.6 mm/min shear rate with a 10° undulating angle.
Energies 15 07563 g005
Figure 6. Shear stress–displacement curves under different normal stresses at a 0.6 mm/min shear rate with a 20° undulating angle.
Energies 15 07563 g006
Figure 7. Shear stress–displacement curves under different normal stresses at a 0.6 mm/min shear rate with a 30° undulating angle.
Energies 15 07563 g007
Figure 8. Shear stress–displacement curves under different normal stresses at a 0.6 mm/min shear rate with a 40° undulating angle.
Energies 15 07563 g008
Figure 9. Relationship between normal stress and peak shear stress with different undulating angles at a 0.6 mm/min shear rate.
Energies 15 07563 g009
Figure 10. Shear stress–displacement curves under different shear rates at 4 MPa normal stress with a 10° undulating angle.
Energies 15 07563 g010
Figure 11. Shear stress–displacement curves under different shear rates at 4 MPa normal stress with a 20° undulating angle.
Energies 15 07563 g011
Figure 12. Shear stress–displacement curves under different shear rates at 4 MPa normal stress with a 30° undulating angle.
Energies 15 07563 g012
Figure 13. Shear stress–displacement curves under different shear rates at 4 MPa normal stress with a 40° undulating angle.
Energies 15 07563 g013
Figure 14. Relationship between shear rate and peak shear stress with different undulating angles at 4 MPa normal stress.
Energies 15 07563 g014
Figure 15. Comparison of structural plane before and after a direct shear test with different undulating angles. (a) Sample 10-2 before test; (b) Sample 10-2 after test; (c) Sample 20-2 before test; (d) Sample 20-2 after test; (e) Sample 30-2 before test; (f) Sample 30-2 after test; (g) Sample 40-2 before test; (h) Sample 40-2 after test.
Energies 15 07563 g015aEnergies 15 07563 g015b
Figure 16. Shear fracture characteristics of a structural plane with a 40° undulating angle. (a) 40-1; (b) 40-2; (c) 40-3; (d) 40-4; (e) 40-5; (f) 40-6.
Energies 15 07563 g016aEnergies 15 07563 g016b
Table 1. Statistical table of experimental parameters.
Sample NumberUndulating Angle
(°)
Normal Load
(kN)
Normal Stress
(MPa)
Shear Rate
(mm/min)
10-110520.6
10-2101040.6
10-3101560.6
10-4102080.6
10-5101041.2
10-6101042.4
20-120520.6
20-2201040.6
20-3201560.6
20-4202080.6
20-5201041.2
20-6201042.4
30-130520.6
30-2301040.6
30-3301560.6
30-4302080.6
30-5301041.2
30-6301042.4
40-140520.6
40-2401040.6
40-3401560.6
40-4402080.6
40-5401041.2
40-6401042.4
Table 2. Shear strength of structural planes with different undulating angles under different normal stresses at a 0.6 mm/min shear rate (MPa).
Undulating Angle (°)Normal Stress (MPa)Shear Rate
(mm/min)
2468
106.427.459.3411.670.6
207.368.7611.2412.77
309.4410.6313.5114.07
4010.5412.4914.2214.9
Table 3. Shear strength of structural planes with different undulating angles under different shear rates at 4 MPa normal stress (MPa).
Undulating Angle (°)Shear Rate (mm/min)Normal Stress (MPa)
0.61.22.4
107.457.287.084
208.769.038.39
3010.6310.019.49
4012.4910.8310.18
Publisher’s Note: MDPI stays neutral with regard to jurisdictional claims in published maps and institutional affiliations.