Article

Experimental Investigation on the Evolution of Tensile Mechanical Behavior of Cement Stone Considering the Variation of Burial Depth

1
School of Pipeline and Civil Engineering, China University of Petroleum (East China), Qingdao 266580, China
2
State Key Laboratory of Geomechanics and Geotechnical Engineering, Institute of Rock and Soil Mechanics, Chinese Academy of Sciences, Wuhan 430071, China
3
State Key Laboratory for Coal Mine Disaster Dynamics and Control, Chongqing University, Chongqing 400044, China
*
Author to whom correspondence should be addressed.
Energies 2022, 15(19), 7340; https://doi.org/10.3390/en15197340
Submission received: 2 September 2022 / Revised: 27 September 2022 / Accepted: 3 October 2022 / Published: 6 October 2022
(This article belongs to the Special Issue Advances in the Utilization of Underground Energy and Space)

Abstract

:
The cement sheath is an annular structure between casing and formation, which is crucial to the integrity of the wellbore system. Considering that the temperature and pressure environment is changing continuously with increasing burial depth, the micro-structure and macro=mechanical properties of the in-situ cement sheath will change accordingly. To investigate the variation of burial depth on the evolution of the tensile mechanical behavior of oil cement stone, five temperature-pressure curing and testing conditions (25 °C—0 MPa, 50 °C—10 MPa, 80 °C—20 MPa, 110 °C—30 MPa, and 140 °C—40 MPa) are set to approximately simulate an in situ temperature-pressure environment at five typical burial depths (0 m, 1000 m, 2000 m, 3000 m, and 4000 m). The in situ tensile behavior, micro-structure and pore size distribution of the cement stones at each condition are tested and comparatively analyzed. Results show that with increasing temperature and pressure, the brittleness of the cement stone reduces and its ductility strengthens accordingly. The tensile strength experiences rapid growth at first, then increases at a slower rate and finally decreases. The failure mode of the cement stone gradually transforms from tensile splitting to tensile-shear composite fracture, accompanied by increasing fracture surface roughness. Microscopically, with increasing curing temperature and pressure, the pore structure of cement stone gradually transforms from closely stacked laminated sheets to interconnected fiber networks. The dense structure of cement stone gradually becomes loose and porous. The porosity also increases from 15.96% to 29.46%.

1. Introduction

Wellbore is the critical channel connecting surface and underground stratum in the practice of underground energy exploitation [1] and storage (Compressed air storage [2], Natural gas storage [3], Crude oil storage [4], Underground hydrogen storage [5,6]). Wellbore integrity is crucial to oil and gas engineering [7]. The destruction of its integrity will not only seriously affect the comprehensive development benefits of oil and gas fields, but can also cause catastrophic accidents such as oil and gas leakage [8].
Cementing is the technology in which casing is run into the wellbore and the annular space between the wellbore and casing is filled with cement slurry [9]. After the cement slurry solidifies for a certain period of time, the annular structure formed between the casing and the formation is the cement sheath (Figure 1). Cementing is a crucial link in well construction of oil and gas wells, as the cement sheath can effectively support and protect the casing and ensure long-term zonal isolation of the well.
In the wellbore system, the cement sheath is a weak link. It has the potential to be damaged and destroyed under various engineering disturbances after a job, leading to the sealing failure of the wellbore system. As depicted in Figure 1, the cement sheath damage could be divided into four modes: (a) casing-cement interface debonding, (b) cement-formation interface debonding, (c) cement shear damage and (d) cement tensile failure. All these four modes of cement sheath damage are affected mainly by the material’s mechanical properties, such as cement compressive strength [10], Young’s modulus [11], tensile strength [12], bond strength [1], loading conditions [13] and cement shrinkage [14]. However, except for the third damage mode, which is caused by compression, the other three are caused by the tensile failure of the cement sheath body or interface, so it is essential to evaluate and study the tensile properties of the cement sheath.
In recent years, many research results have been reported in cement sheath failure during underground energy storage and hydrocarbon exploitation. Li [15] studied the effect of carbon fiber, calcium carbonate whisker and hybrid fiber on the mechanical properties of cement stones, which were cured and tested under room temperature and normal pressure. Lima [16] analyzed the effect of the strengthening effect of confining pressure on the cement stones by mechanical tests without considering the effect of the temperature. Xu [17] conducted conventional triaxial compression test of cement stones at five different temperatures from 25 °C to 135 °C, with confining pressure varying from 5 to 45 MPa. However, the curing conditions are only under room temperature and normal pressure. Shakor [18] measured the compressive strength of cement stones under room temperature and normal pressure, which were made by 3D printed powders. Quercia [19] and Liu [20] measured the tensile strength of cement stones under room temperature and normal pressure. Li [21] tested the microstructure of cement stones by scanning electron microscope, which were cured at 60 °C and 90 °C, without considering the effect of the curing pressure. Yang [22] investigated the pore structure of cement stones under one curing temperature and pressure condition (50 °C and 10 MPa) through CT scanning, but it did not take into account other curing temperature and pressure conditions. Table 1 presents detailed information on test materials and test conditions in the above references.
All the literature above reports mainly on the mechanical properties or microstructure of cement stone under room temperature and normal pressure, or a single temperature or pressure, but there were few reports discussing the effect of both temperature-pressure curing and testing conditions on the mechanical properties of cement stone, especially on tensile strength. As the temperature and pressure environment of cement sheath formation and service changes with increasing burial depth (Figure 2), the mechanical parameters conventionally measured under room temperature and normal pressure or a single temperature or pressure may not be representative. Therefore, different temperature-pressure curing and testing conditions should be set to simulate the temperature and pressure environment of cement sheath so as to evaluate its mechanical properties comprehensively and reasonably.
In this study, the cement stone specimens are prepared under five temperature-pressure curing and testing conditions (25 °C—0 MPa, 50 °C—10 MPa, 80 °C—20 MPa, 110 °C—30 MPa and 140 °C—40 MPa) to approximately simulate in situ temperature-pressure environment at five typical burial depths (0 m, 1000 m, 2000 m, 3000 m and 4000 m). The in situ tensile behavior, micro-structure, and pore size distribution of the cement stones at each condition are tested and comparatively analyzed. The results can provide accurate and valuable tensile parameters for cementing design and safety assessment.

2. Materials and Methods

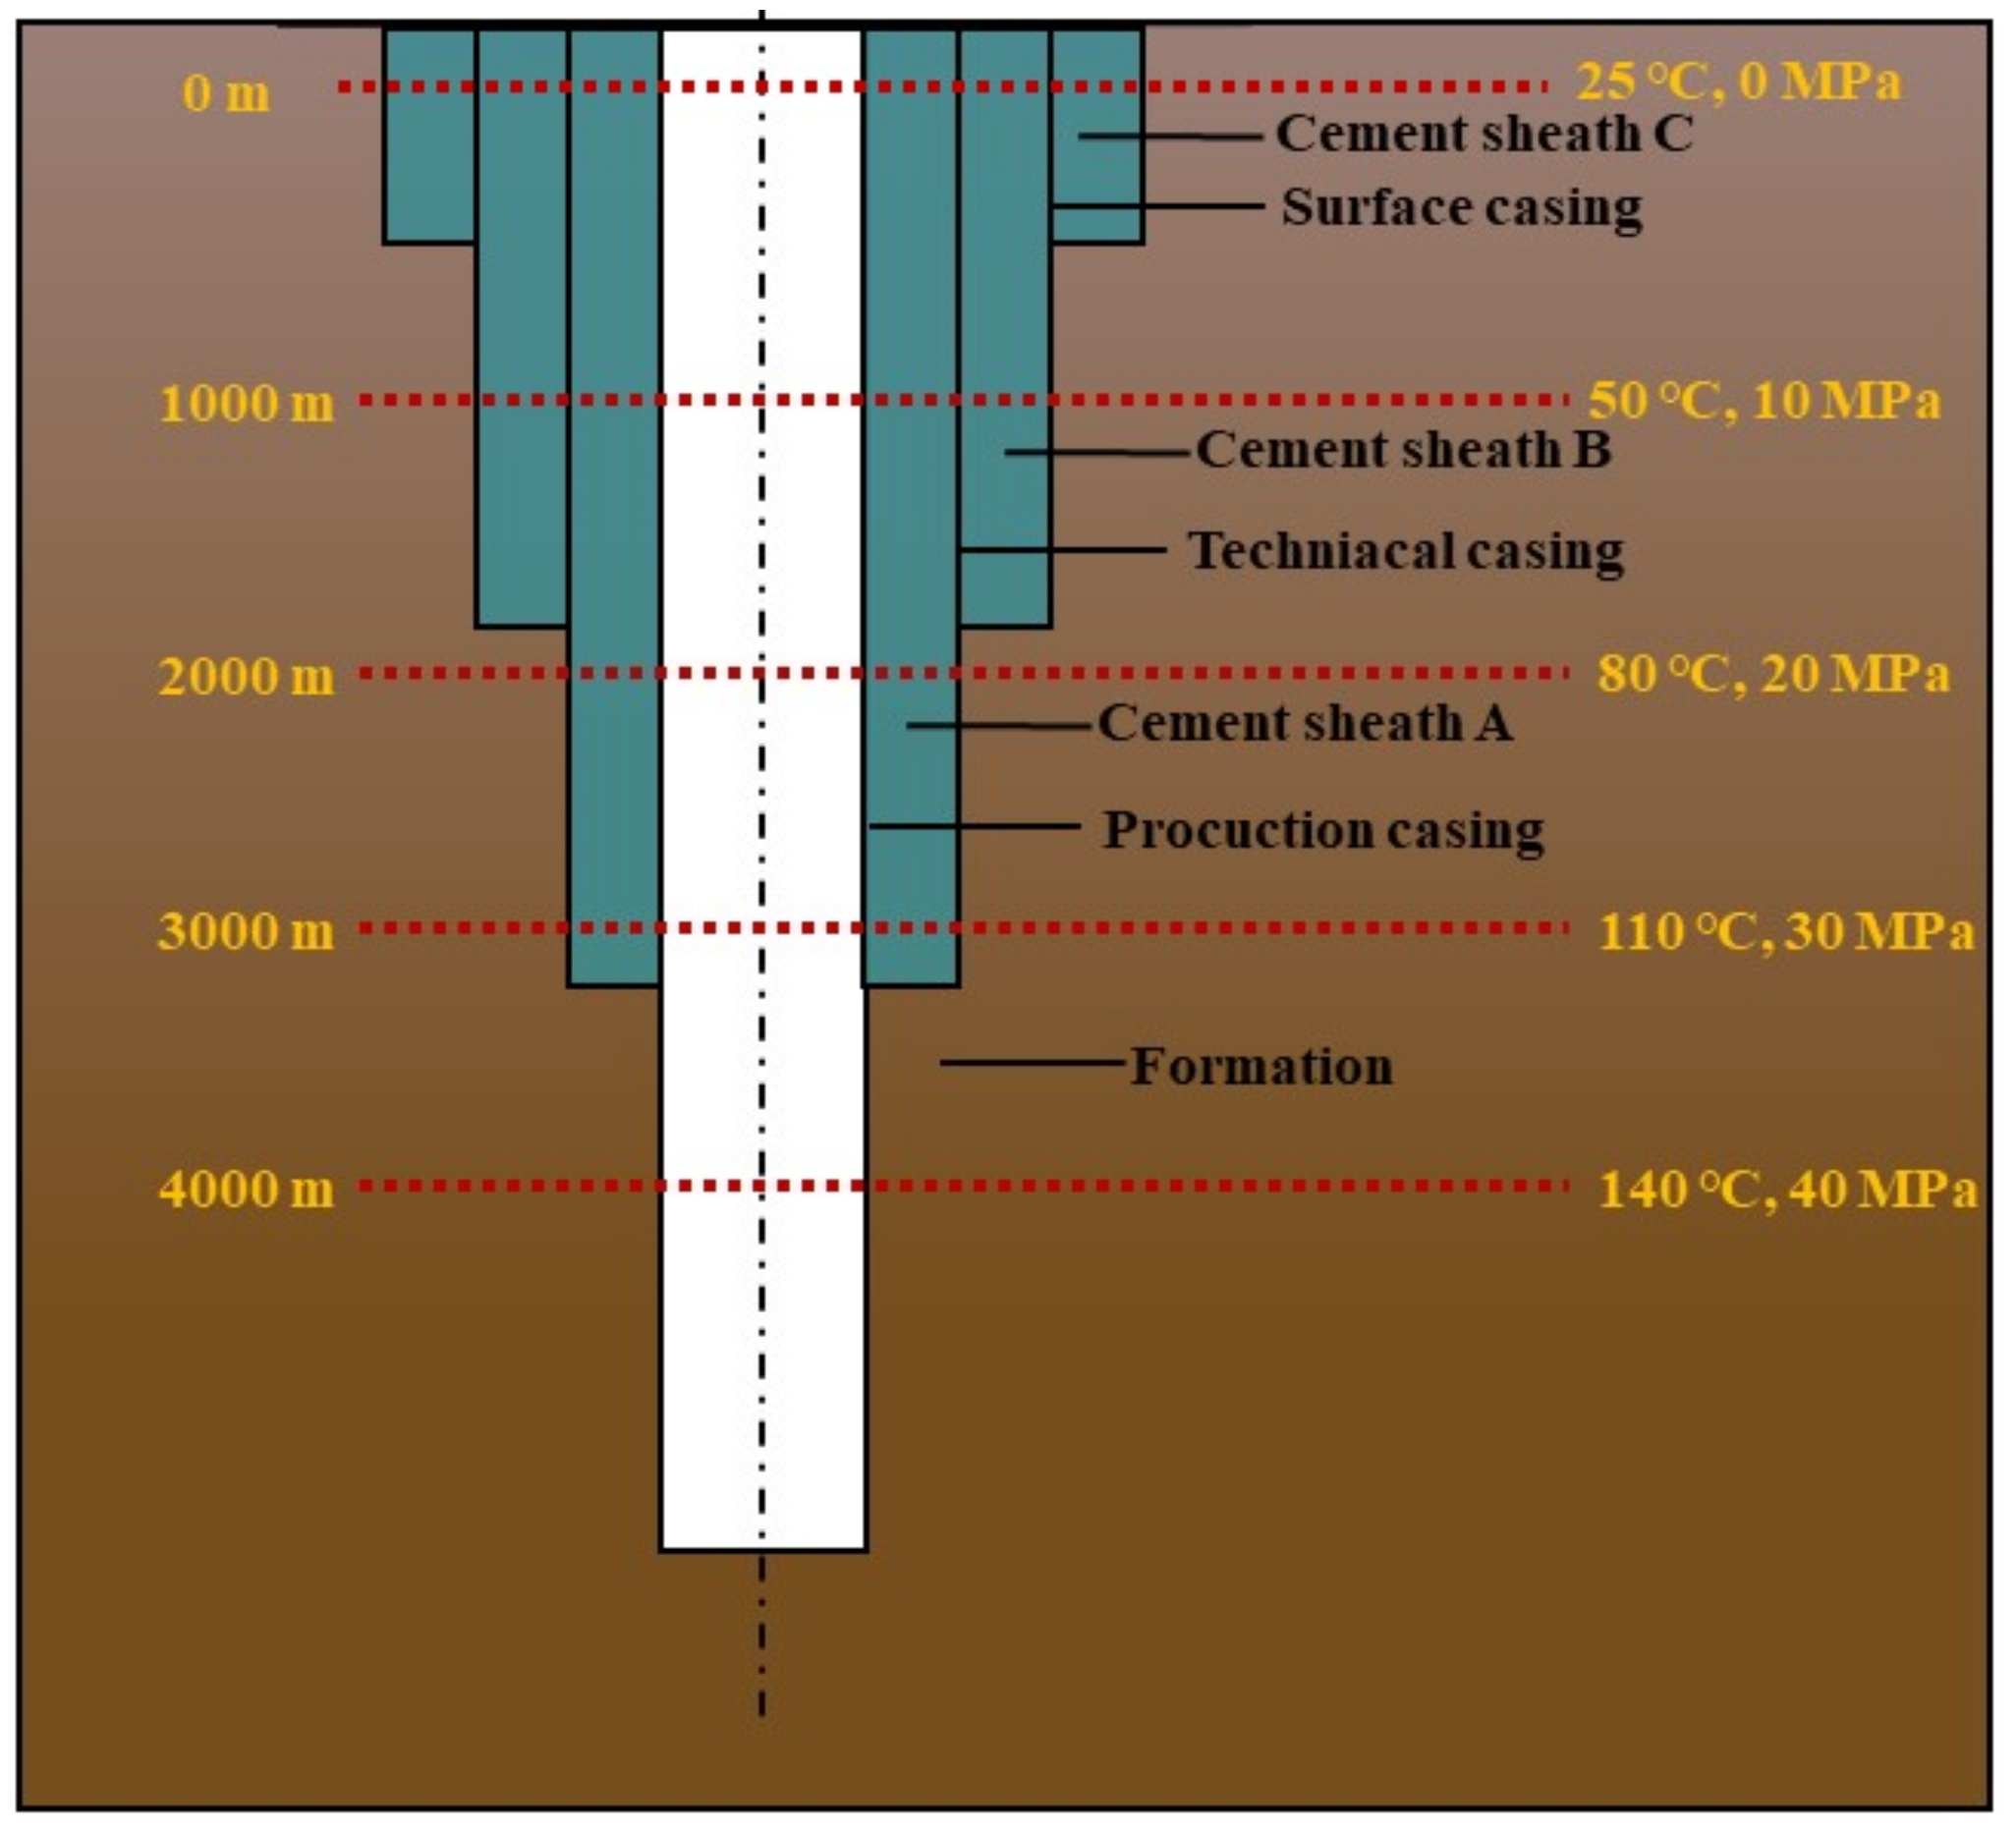
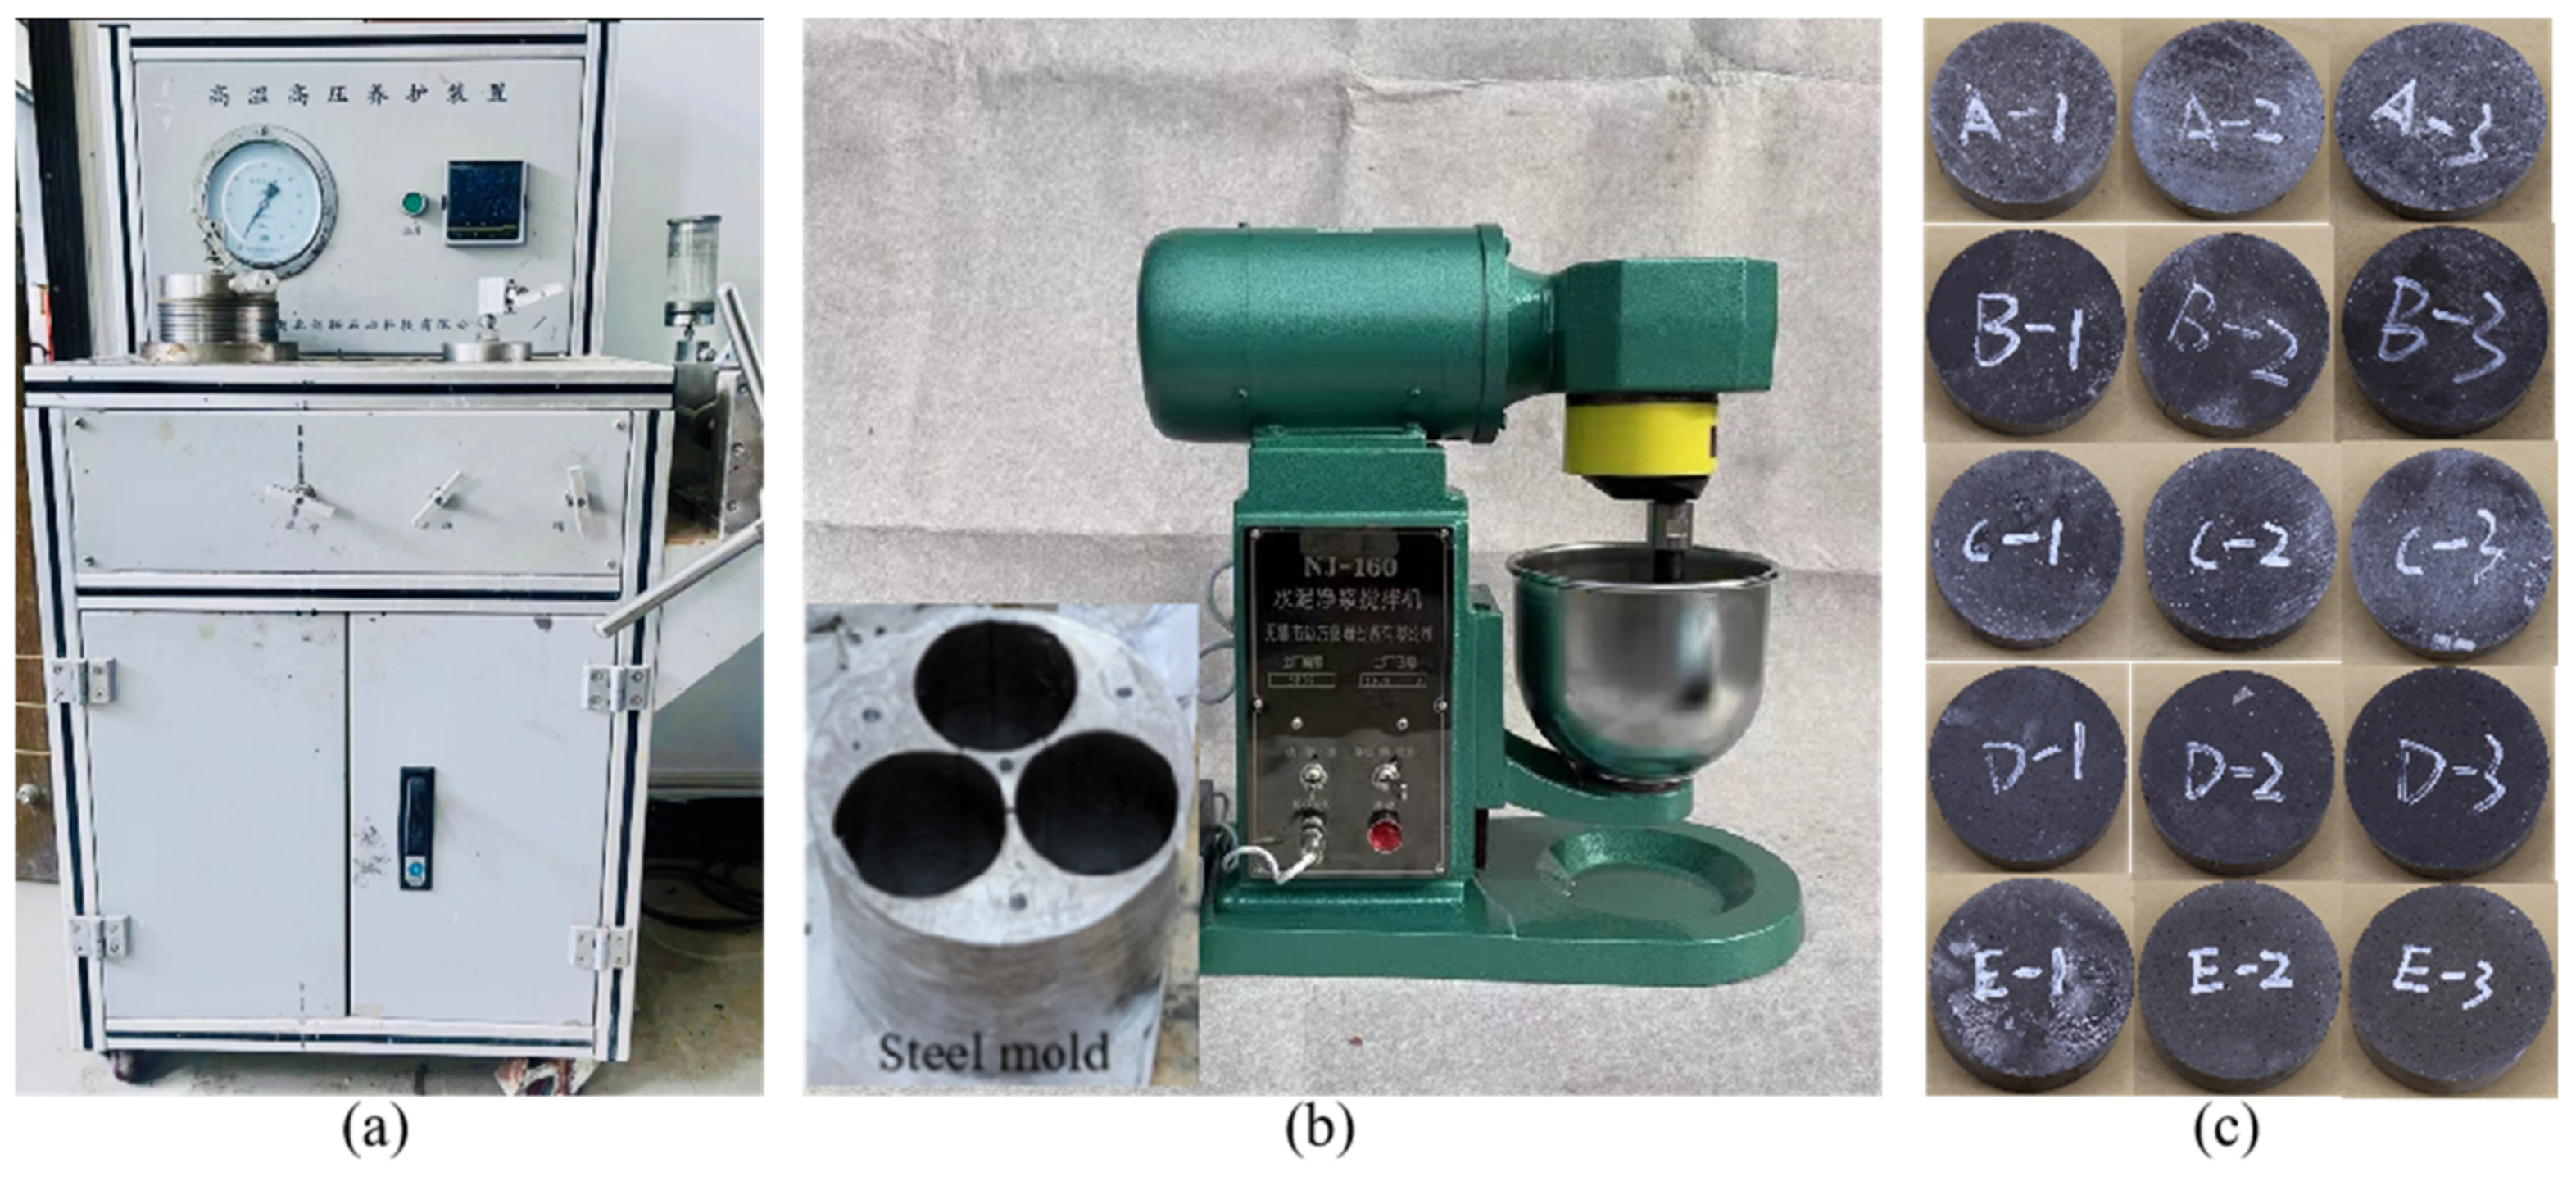
2.1. Materials and Specimen Preparation

The material used in this study is elastic cement (97% Class G cement and 3% elastic material), which is mainly composed of tricalcium silicate, dicalcium silicate, tricalcium aluminate, tetra-calcium ferro-aluminate and an appropriate amount of gypsum. Its composition included 100% elastic cement, 3% fluid loss additive, 31% clean water and 10% liquid silicon. The liquid–solid ratio was 44%. A curing device was used for specimen preparation, which could simulate the high-temperature and high-pressure environment of deep formations (Figure 3a). The effective internal size of the curing device was φ 120 × 250 mm and the working ranges of pressure and temperature were (0–50 MPa) and (0–200 °C), respectively.
The preparation of cement slurry was carried out in accordance with the method recommended in API RP 10B-2 [23] and GB/T1939-2012 [24]. The evenly mixed cement slurry was first poured into a special mold with internal dimensions of φ 50 × 110 mm (Figure 3b). Then, the mold was placed in the high-temperature and high-pressure curing device. Under five different temperature and pressure conditions (25 °C—0 MPa, 50 °C—10 MPa, 80 °C—20 MPa, 110 °C—30 MPa, and 140 °C—40 MPa), water bath curing was continued for three days. Finally, the mold was removed from the curing device and cured in a water bath at 25 °C for 28 days to ensure that the cement was fully hydrated. The reason for curing for 3 days in the high-temperature and high-pressure curing device is that, after curing for 3 days, the hydration degree of each component in the cement clinker has exceeded 90% and the structure of the cement stone has become stable; The reason for curing at 25 °C for 28 days is that the strength of cement stone is close to its long-term strength after 28 days of curing [25]. The conditions of 25 °C—0 MPa, 50 °C—10 MPa, 80 °C—20 MPa, 110 °C—30 MPa, and 140 °C—40 MPa roughly corresponded to the temperature and pressure environments of cement sheath at the depths of 0 m, 1000 m, 2000 m, 3000 m and 4000 m, respectively. Demolding was conducted after curing. Through cutting and grinding of the end faces, the cement stones were processed into disc specimens of diameter 50 mm and height 25 mm (Figure 3c, which are used for the splitting test under different test temperatures and pressures. One specimen in each group of temperature and pressure conditions is selected to measure roughness of fracture surface. Part of the excess specimens were processed into thin slices of less than 1 × 1 × 0.5 cm and 1 × 1 × 1 cm blocks for scanning electron microscopy tests and mercury injection tests, respectively.

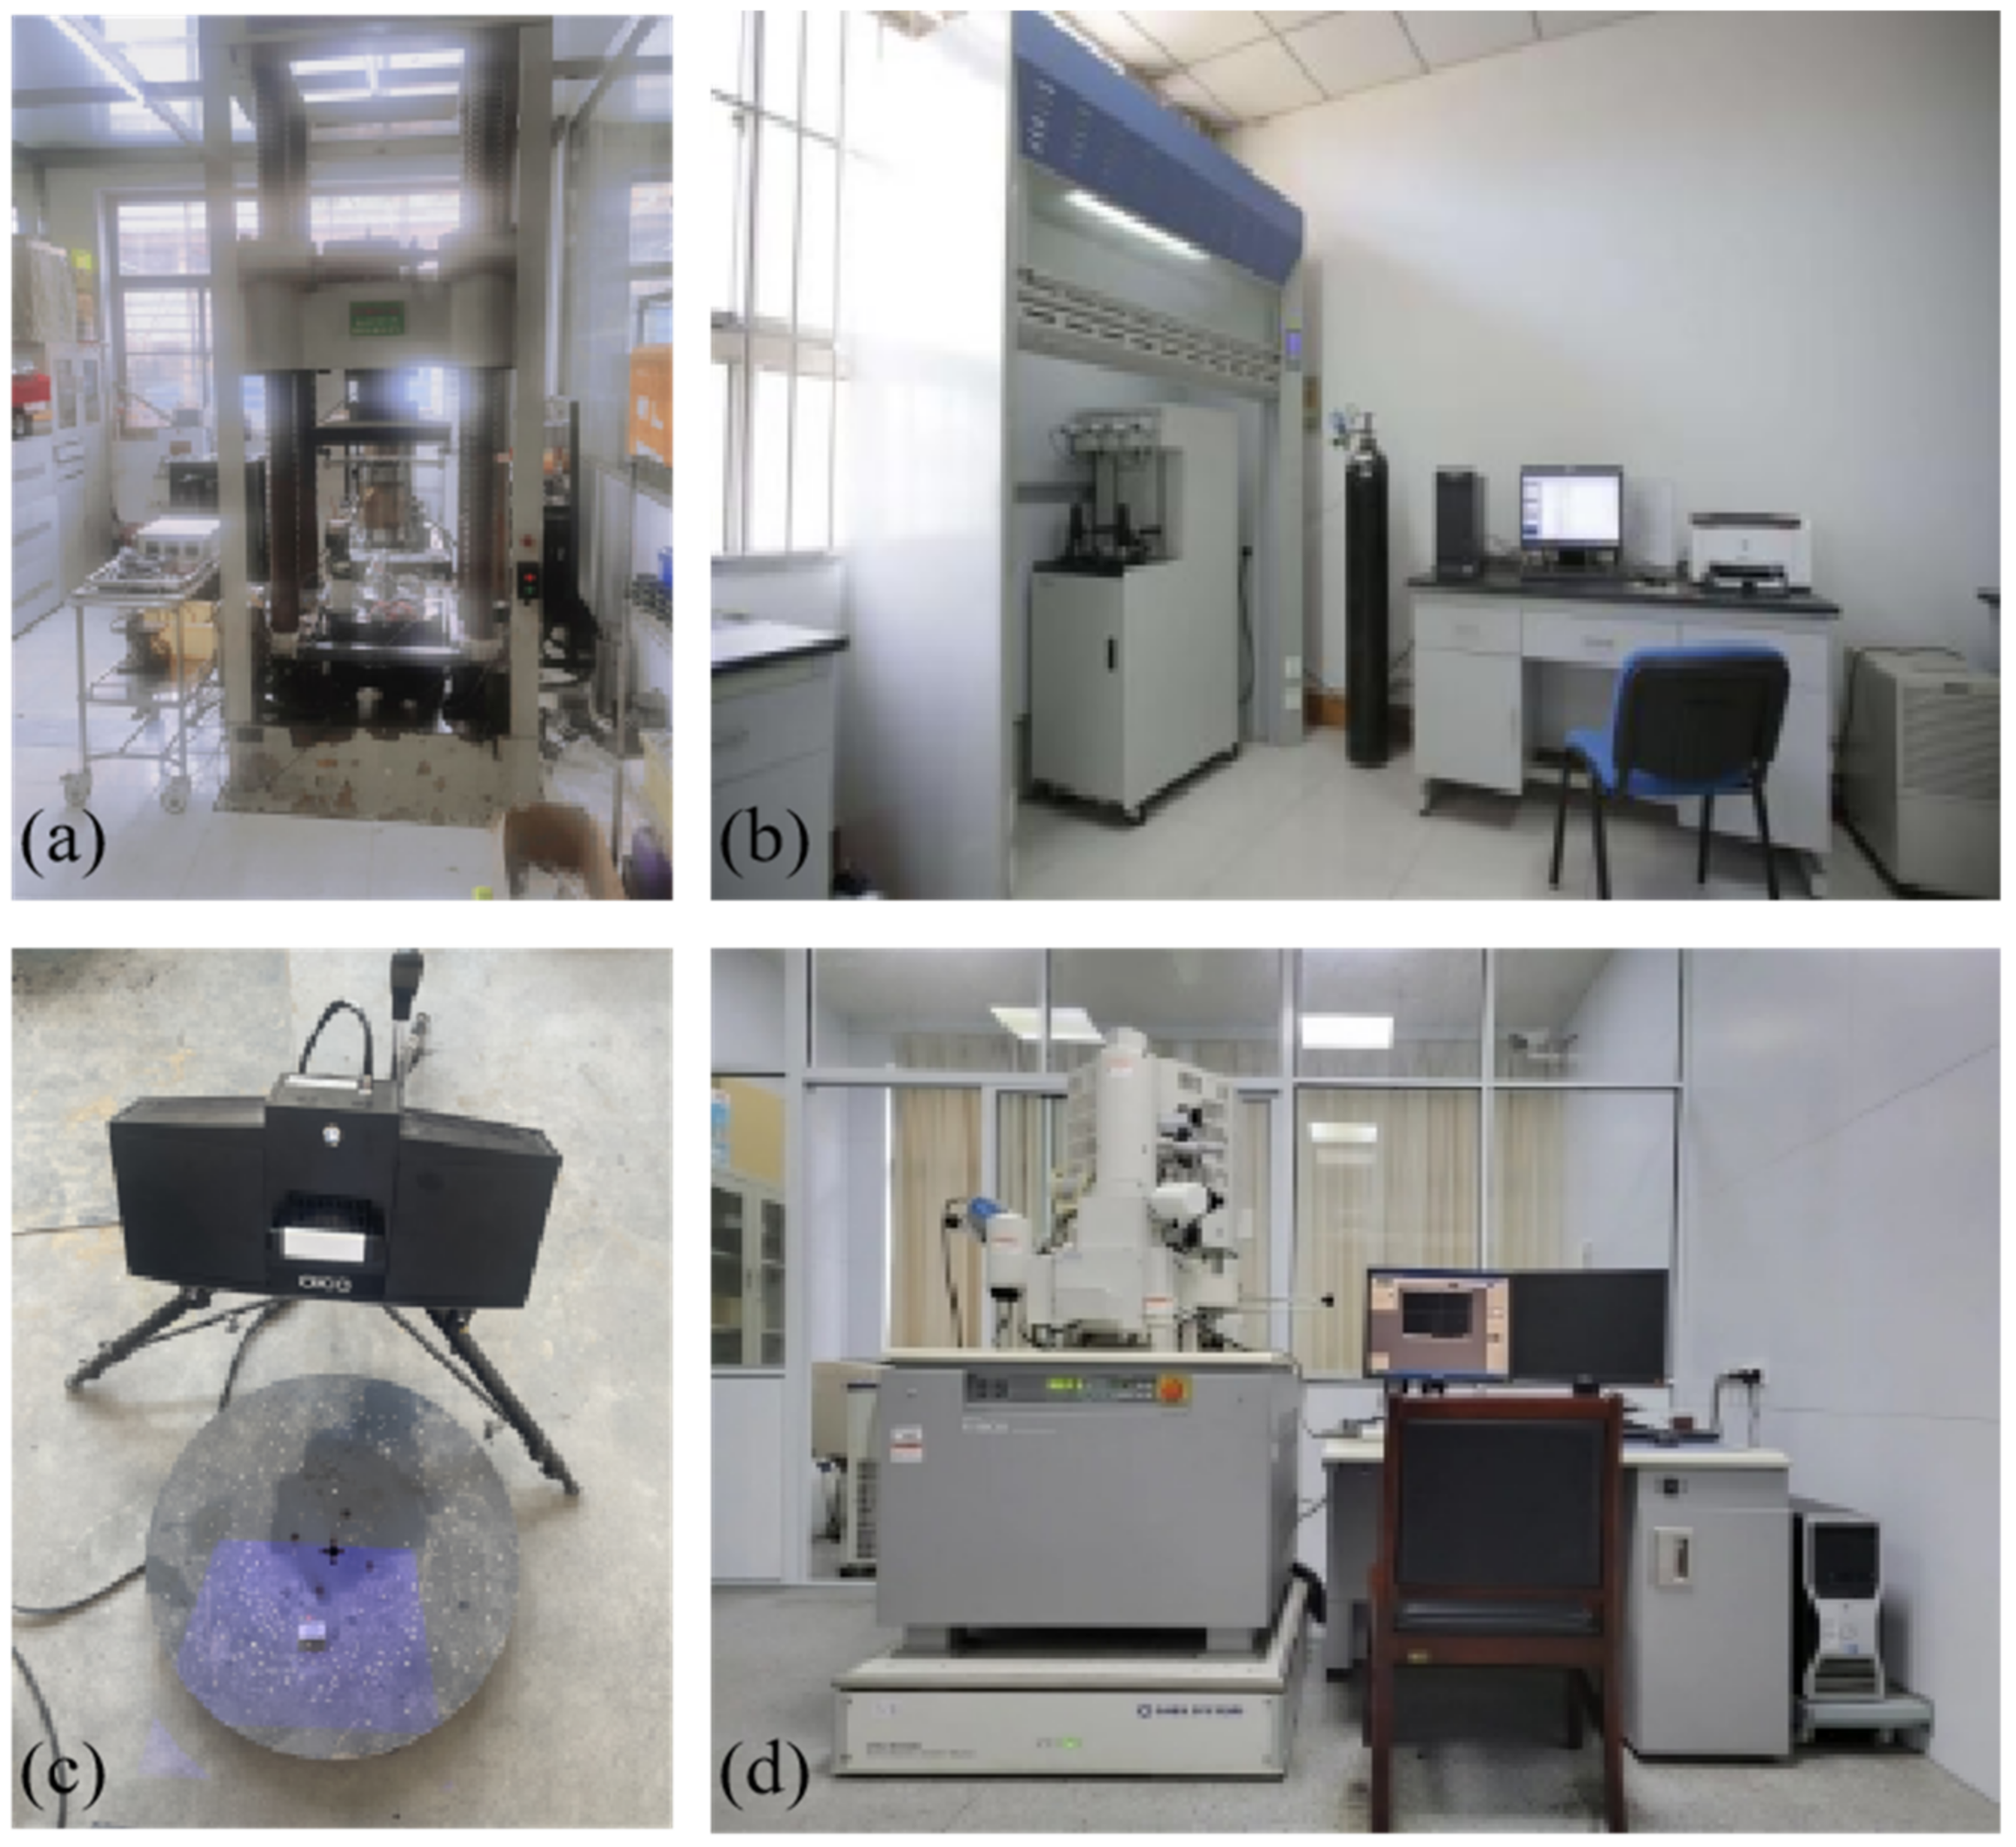
2.2. Testing Methods

In this study, five groups of tests were designed. The temperature and pressure conditions during the tests were consistent with those during the curing process (Table 2). The testing machine was the XTR01-01 rock triaxial tester developed by the Institute of Rock and Soil Mechanics, Chinese Academy of Sciences (Wuhan, China). In this test, we adopted a displacement-controlled loading mode with a rate of 0.24 mm/min. Before the test, the specimens were packaged (Figure 4). The steps of packaging treatment are: first, heat the heat shrinkable tube with a hair dryer to wrap the heat shrinkable tube outside a cylindrical indenter, then put a specimen into it, then pour an appropriate amount of silica gel evenly stirred into it, so that it just submerges the specimen, finally, place another cylindrical indenter on the sample, heat the heat shrinkable tube with a hair dryer to fix it, and wait for the silica gel to solidify before the test. Two cylindrical indenters were placed at the top and bottom of the specimen to exert the axial pressure. The white substance inside was a kind of silica gel, which could transfer heat and confining pressure, and could also fix the specimen. Heat shrinkable tubes with high-temperature resistance were wrapped outside. To heat the specimens, each test was conducted evenly and fully after raising the oil temperature in the triaxial chamber to the target temperature and stabilizing for 1 h. At least three cement stone specimens were tested at the same temperature and confining pressure. We removed the invalid test values of the specimens with splitting fracture deviating from the center of the disc in each group.
Table 1. Information on test materials and test conditions in some references.
TestMaterialsCuring ConditionsTest ConditionsReference
TimeTemperaturePressureTemperaturePressure
(Days)(°C)(MPa)(°C)(MPa)
uniaxial compression testG grade oil well cement;
carbon fiber; calcium carbonate
2830atmospheric pressureroom temperatureatmospheric pressure[15]
triaxial compression testG grade oil well cementnot mentionednot mentionednot mentionedroom temperature10; 20; 40[16]
triaxial compression testG grade oil well cement28room temperatureatmospheric pressure20; 60; 95; 115; 1355; 15; 30; 45[17]
uniaxial compression testordinary Portland cement;
calcium aluminate cement
not mentionedroom temperatureatmospheric pressureroom temperatureatmospheric pressure[18]
direct tensile test;
indirect tensile test
G grade oil well cement;
several inorganic microfibers
12510.34room temperatureatmospheric pressure[19]
brazilian splitting testsG grade oil well cement76020.7room temperatureatmospheric pressure[20]
SEMG grade oil well cement760; 90atmospheric pressureroom temperatureatmospheric pressure[21]
CT scanningG grade oil well cement75010room temperatureatmospheric pressure[22]
The roughness of fracture surface after tensile failure was measured using the 3D scanner of OKIO-3M-400-200-100 (Hangzhou, China). The microstructure of cement stone was observed by the scanning electron microscope of Hitachi S4800 (Tokyo, Japan). The mercury porosimeter of Micromeritics AutoPore V 9620 (Micromeritics Instrument Corporation, Norcross, GA, USA) was used to provide the pore characteristics of the cement stone (Figure 5).

3. Results

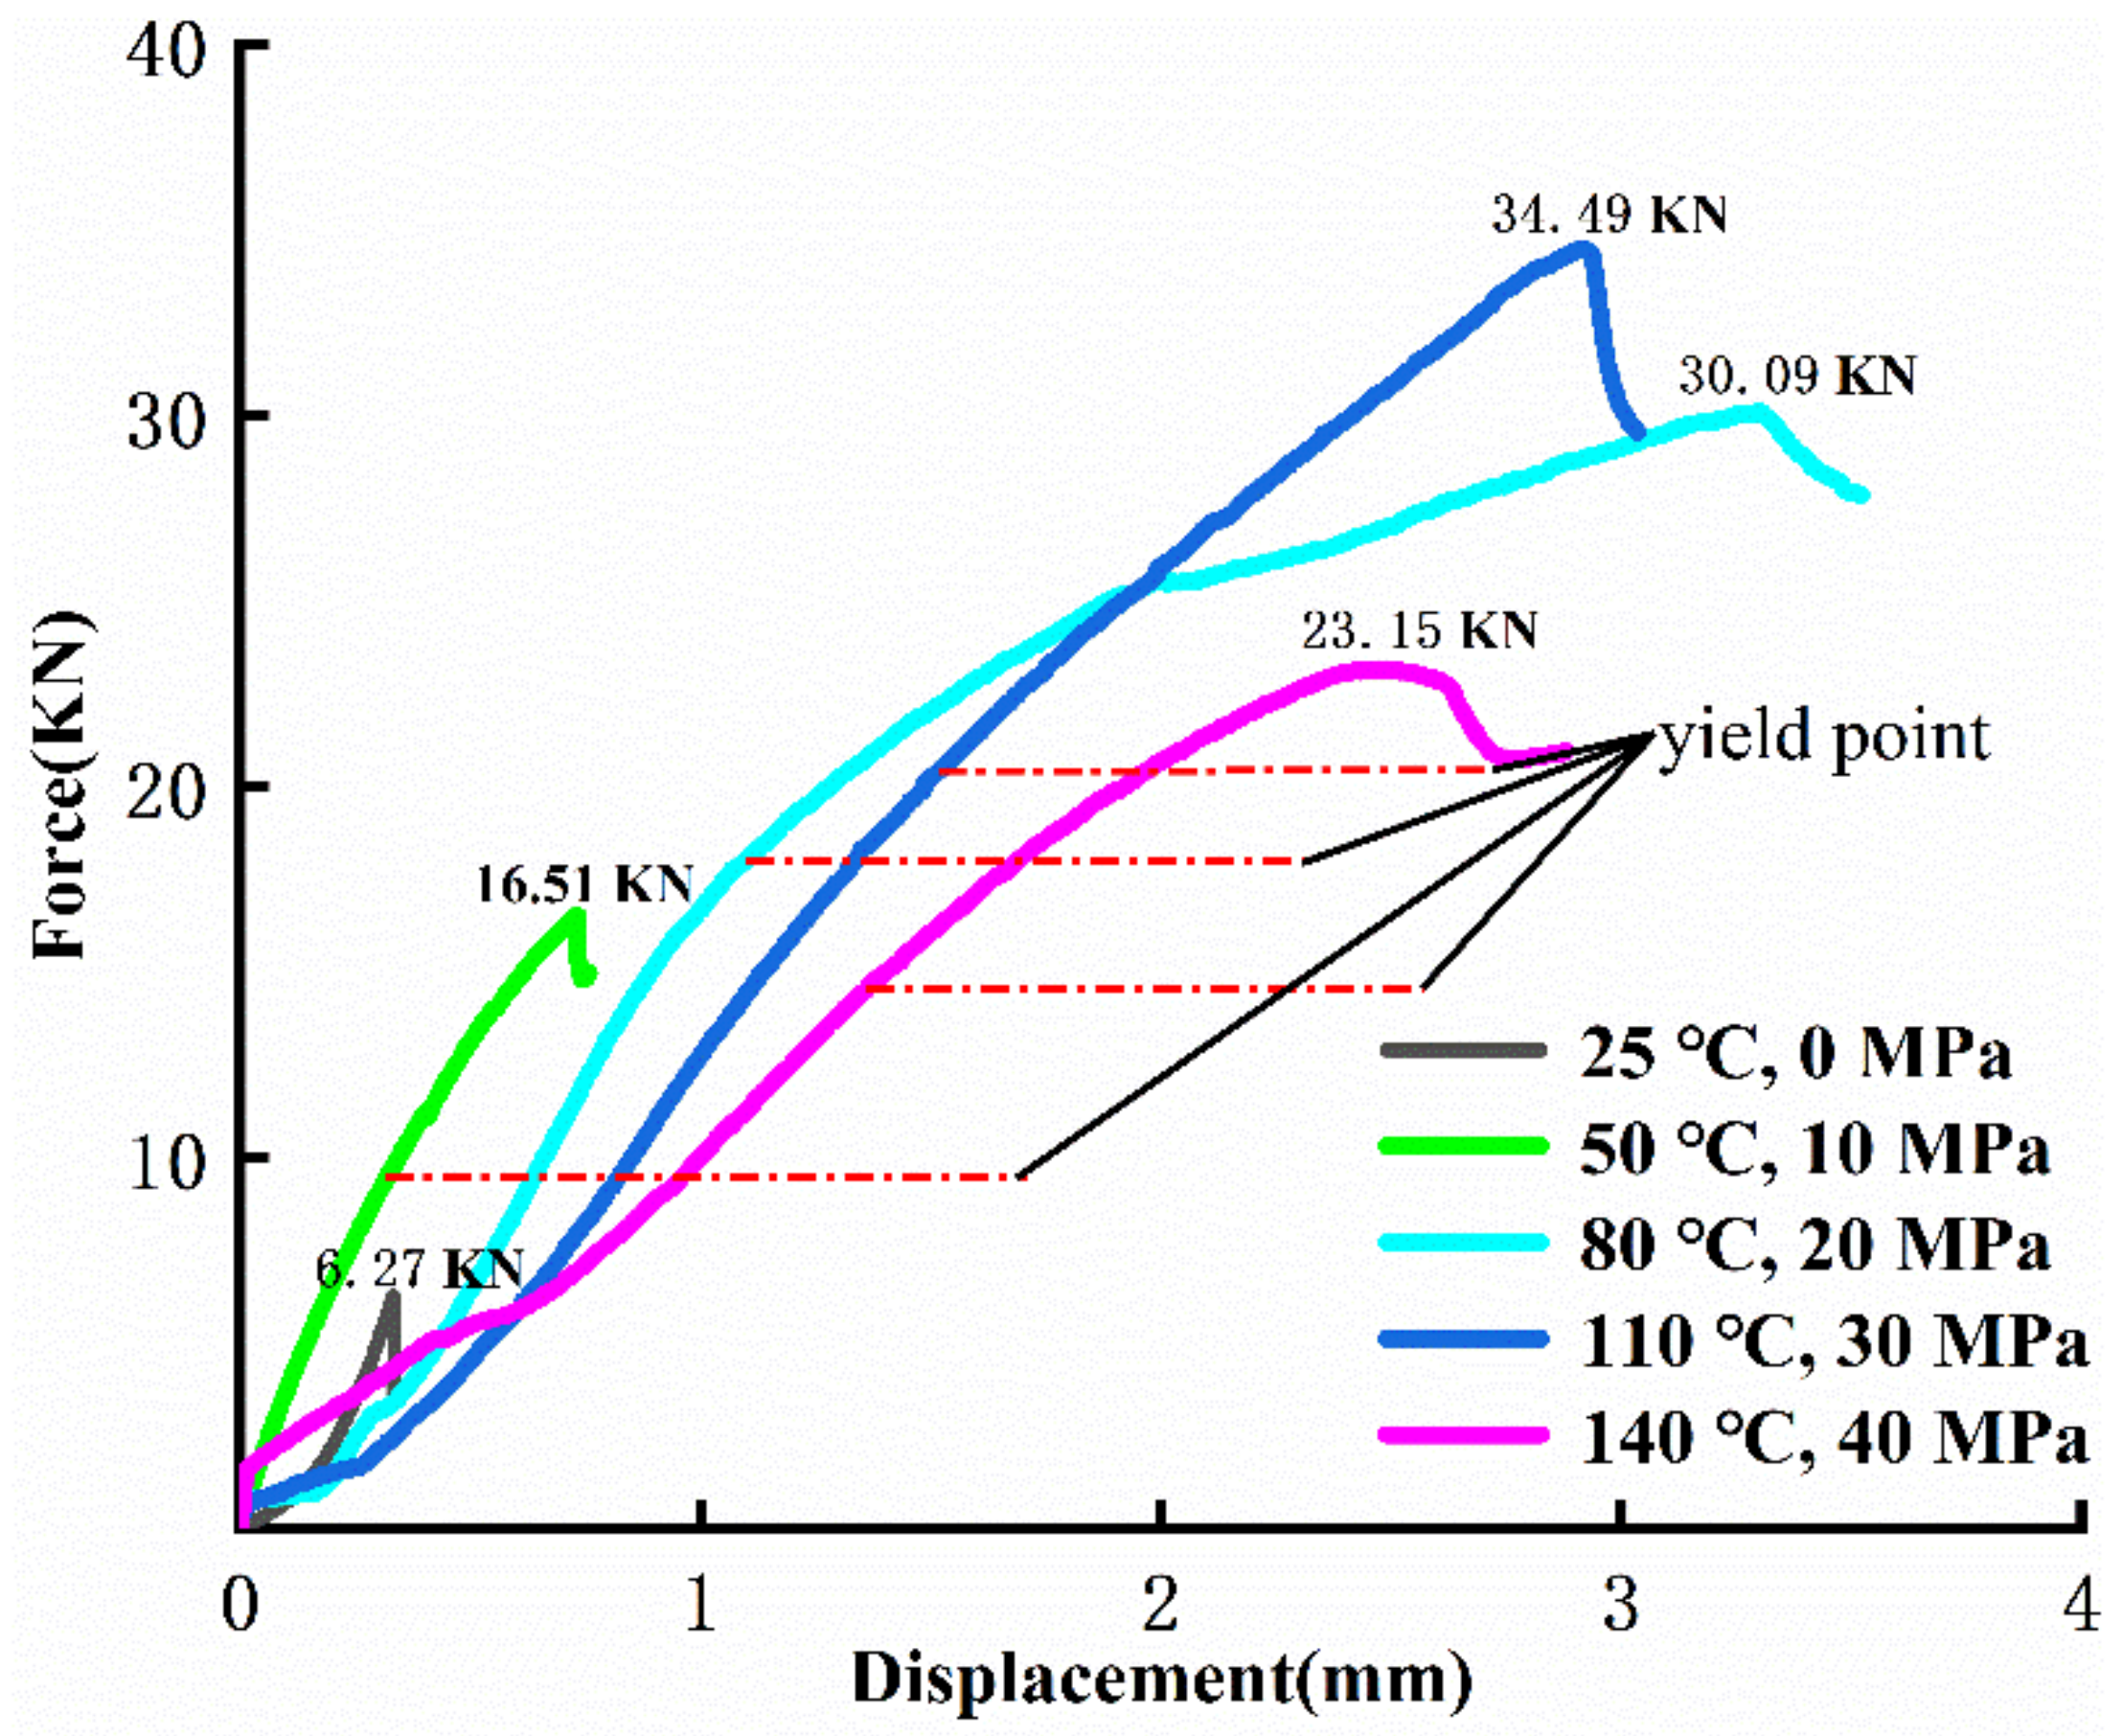
3.1. Load-Displacement Curve

The load-displacement curve can be divided into four stages: compaction, elastic deformation, yield failure and post-peak drop. At the initial loading, the primary pores and microcracks of the specimens are compacted and the load-displacement curve increases slowly in a nonlinear state. As the load increases, the load-displacement curve goes up in an approximately linear state. As the load continues to increase, the curve gradually bends and its growth slows down. Simultaneously, plastic damage continues to accumulate inside the specimen. When the load reaches the peak, the specimen is split and loses its bearing capacity. Then, the curve drops rapidly.
As shown in Figure 6, under the test conditions of 25 °C—0 MPa and 50 °C—10 MPa, the yield failure stage is not obvious. The specimen exhibits typical brittle failure. At the test temperatures and pressures of 80 °C—20 MPa, 110 °C—30 MPa, and 140 °C—40 MPa, the yield stage is significantly longer. This indicates that with an increase in temperature and pressure, the brittleness of the specimen reduces and its ductility strengthens accordingly.
In general, in the splitting tests under different temperatures and pressures, the slope of the elastic stage of the cement stone gradually decreases with increasing temperature and pressure. The peak load and corresponding displacement have the same trend of increase first and then decrease. The maximum peak load and displacement occur at 110 °C—30 MPa. The peak load increases from 6.27 kN at 25 °C—0 MPa to 34.32 kN, with an increase of 447.37%. Accordingly, the peak displacement increases from 0.332 mm to 4.012 mm, with an increase of 1108.43%. At 140 °C—40 MPa, the peak load and displacement begin to decrease. The peak load decreases from 34.32 kN at 110 °C—30 MPa to 23.15 kN, with a decrease of 32.55%. The peak displacement decreases from 4.012 mm to 2.458 mm, with a decrease of 38.73%.

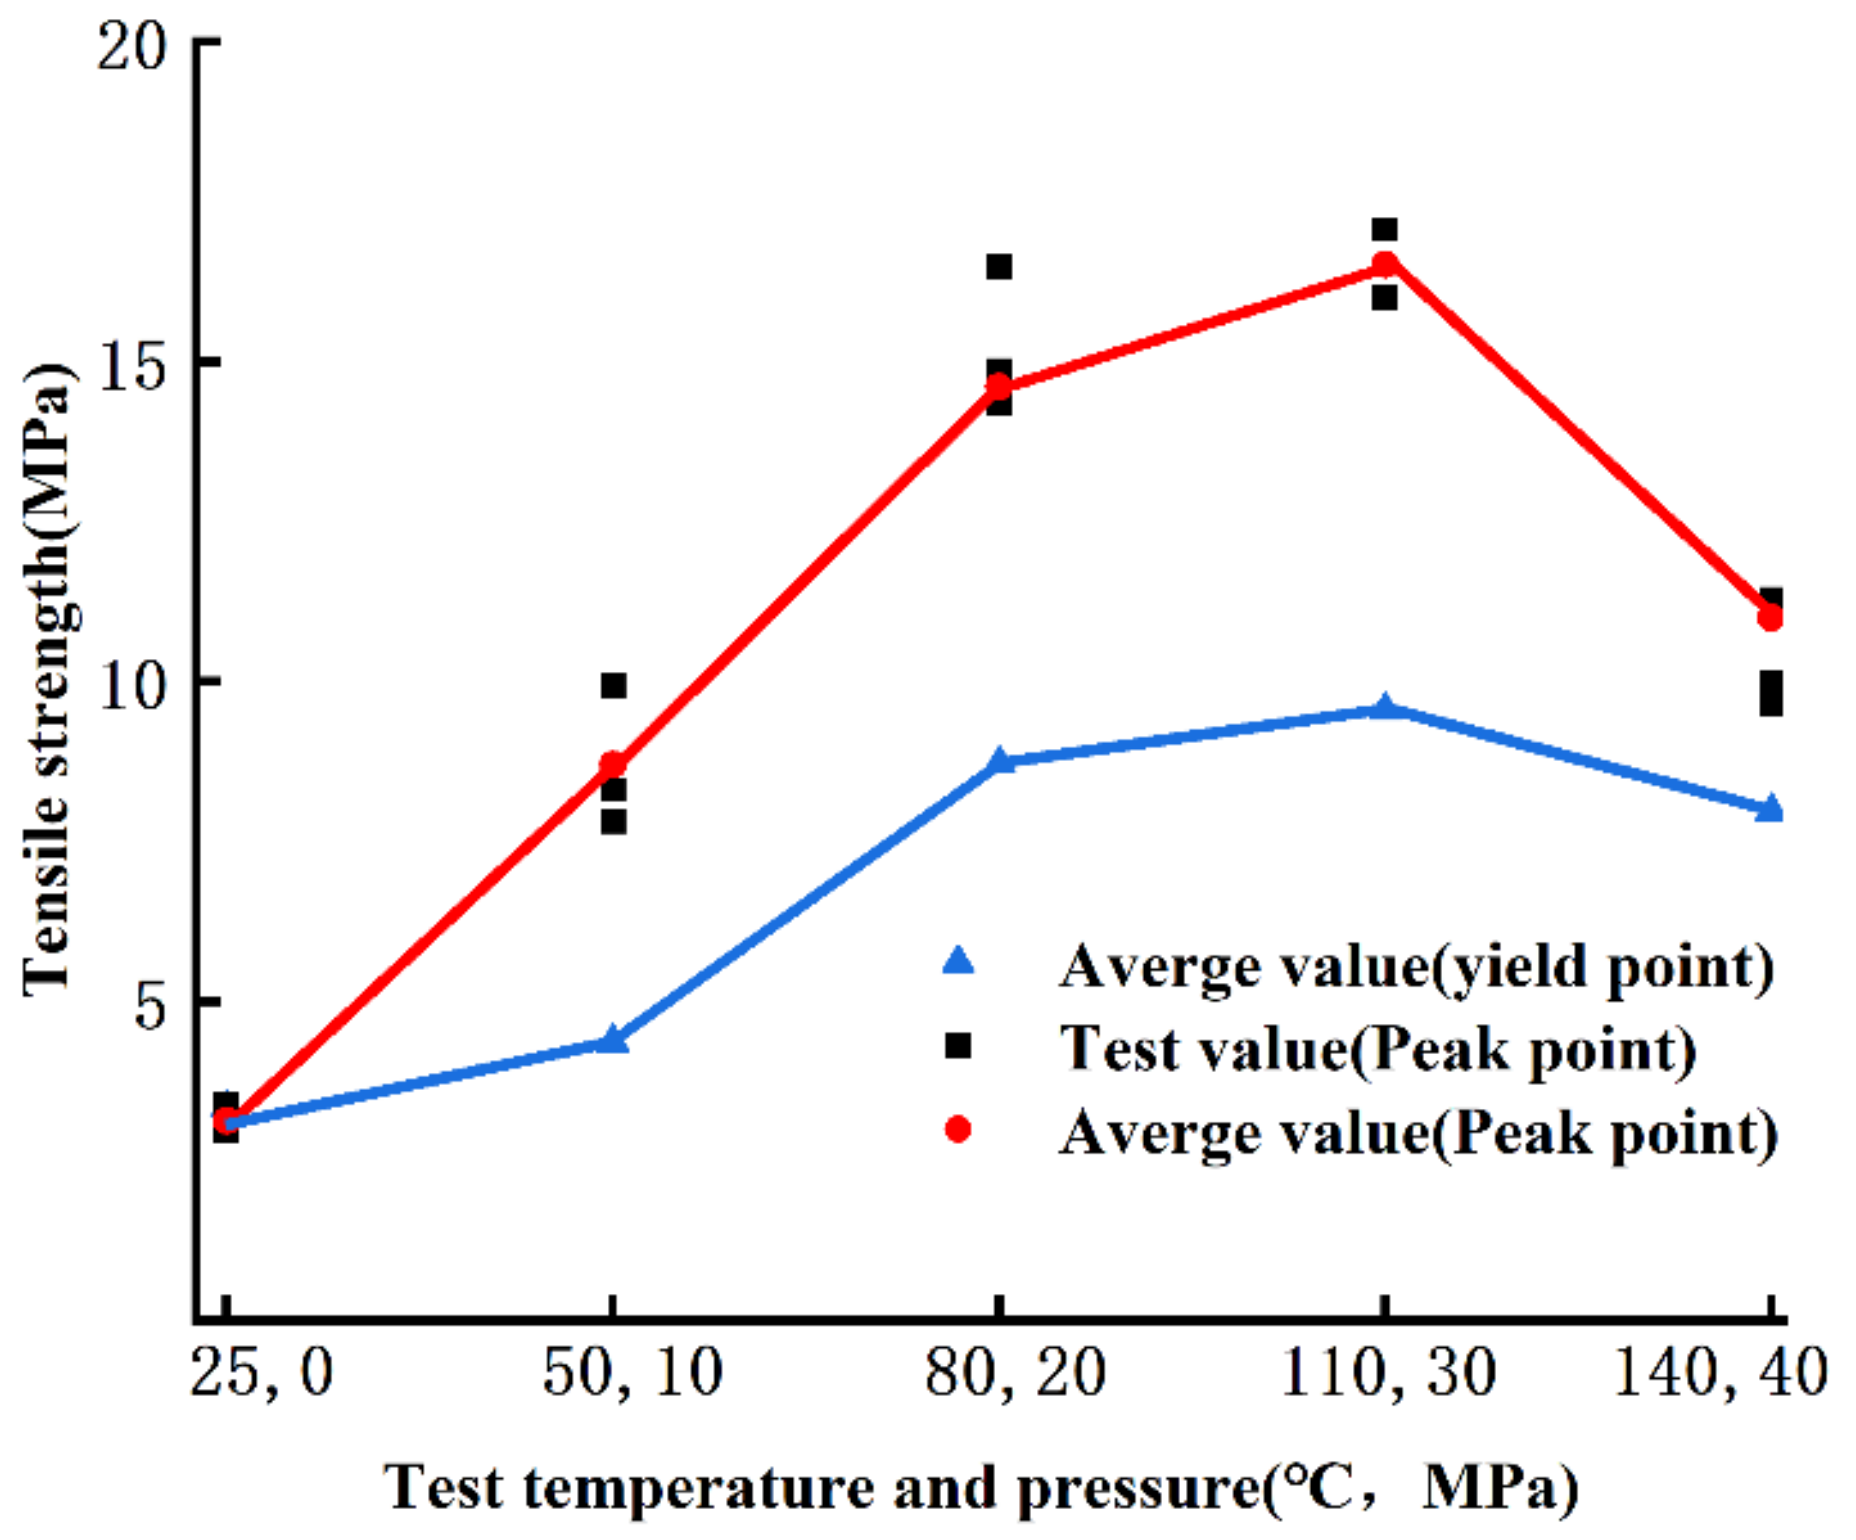
3.2. Tensile Strength

At present, the Brazilian splitting test method is commonly used to indirectly measure the tensile strength of rocks. The calculation equation of the tensile strength without confining pressure is:
σ t = 2 P π DL
where σt is the indirect tensile strength, MPa; P is the load corresponding to the tensile fracture initiation at the center of the specimen, N; D is the diameter of the test specimen, mm; L is the thickness of the test specimen in mm.
When confining pressure is applied, the specimen is subjected to the confining pressure in addition to the load applied during the test in the diameter direction. Therefore, the equation of tensile strength of the specimen under confining pressure is:
σ t = 2 ( P + σ c A ) π DL - σ c
where A is the area of indenter, mm2; σc is the confining pressure, MPa.
As shown in Figure 7, when the test temperatures and pressures are 25 °C—0 MPa, 50 °C—10 MPa, 80 °C—20 MPa, 110 °C—30 MPa, and 140 °C—40 MPa, the average tensile strengths of the specimens are 3.12, 8.68, 14.60, 16.51, and 10.99 MPa, respectively. As the test temperature and pressure increases from 25 °C—0 MPa to 50 °C—10 MPa, and further to 80 °C—20 MPa, the average tensile strength of the specimens increases rapidly, with an increase of 178.21% and 68.2%, respectively. As the test temperature and pressure increases from 80 °C—20 MPa to 110 °C—30 MPa, the rate of increase in the average tensile strength slows down and the increase is 13.08%. As the test temperature and pressure increases from 110 °C—30 MPa to 140 °C—40 MPa, the average tensile strength decreases significantly by 33.43%. It could be inferred that the tensile strength of cement stone could experience rapid growth at first, then increases at a slower rate and finally decreases with increasing formation depth.
By comprehensively comparing the stress–strain curves and specimen failure modes, it was discovered that tensile failure and plastic shear deformation coexisted under the effect of confining pressure. It is assumed that the cement stone might have tensile failure when it enters the yield stage. Therefore, the load corresponding to the yield point is taken as the critical force, at which the initiation of tensile fracture at the center of the specimen occurs. For the test temperatures and pressures of 25 °C—0 MPa, 50 °C—10 MPa, 80 °C—20 MPa, 110 °C—30 MPa, and 140 °C—40 MPa, the average tensile strengths are 3.12, 4.36, 8.71, 9.55, and 7.97 MPa, respectively. The newly calculated tensile strength of the specimens decreases as a whole compared with the values calculated before, but the overall trend remains unchanged.

3.3. Characteristics of Splitting Fracture Surface
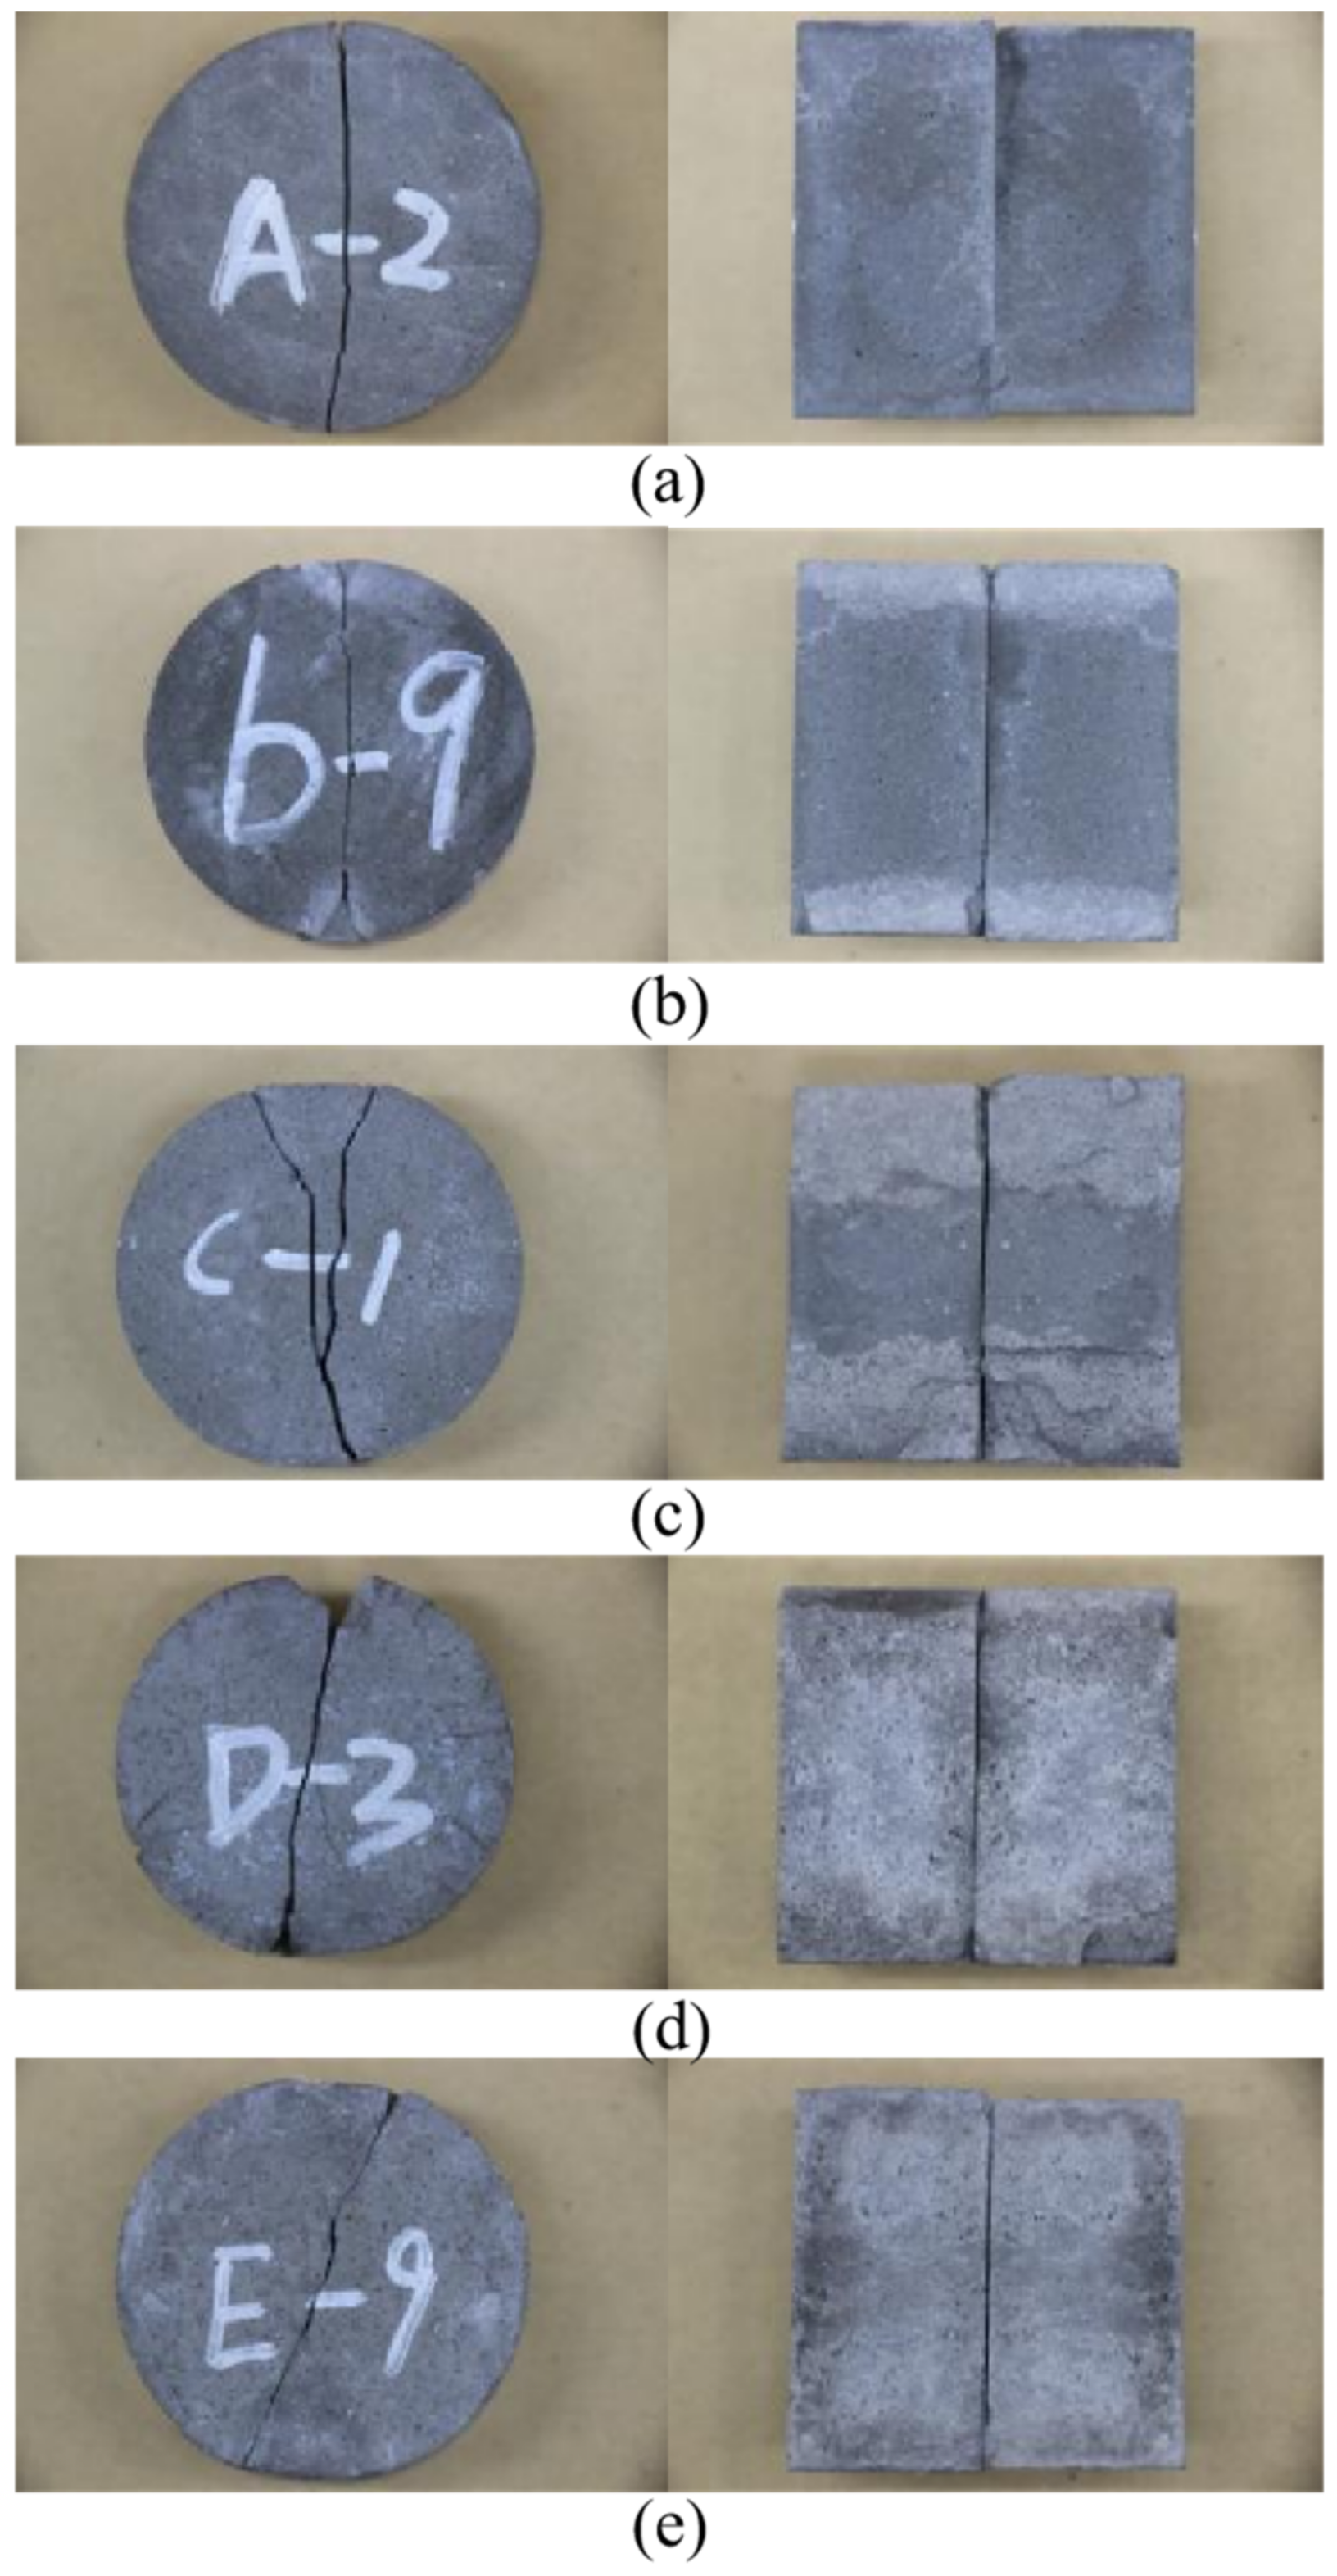
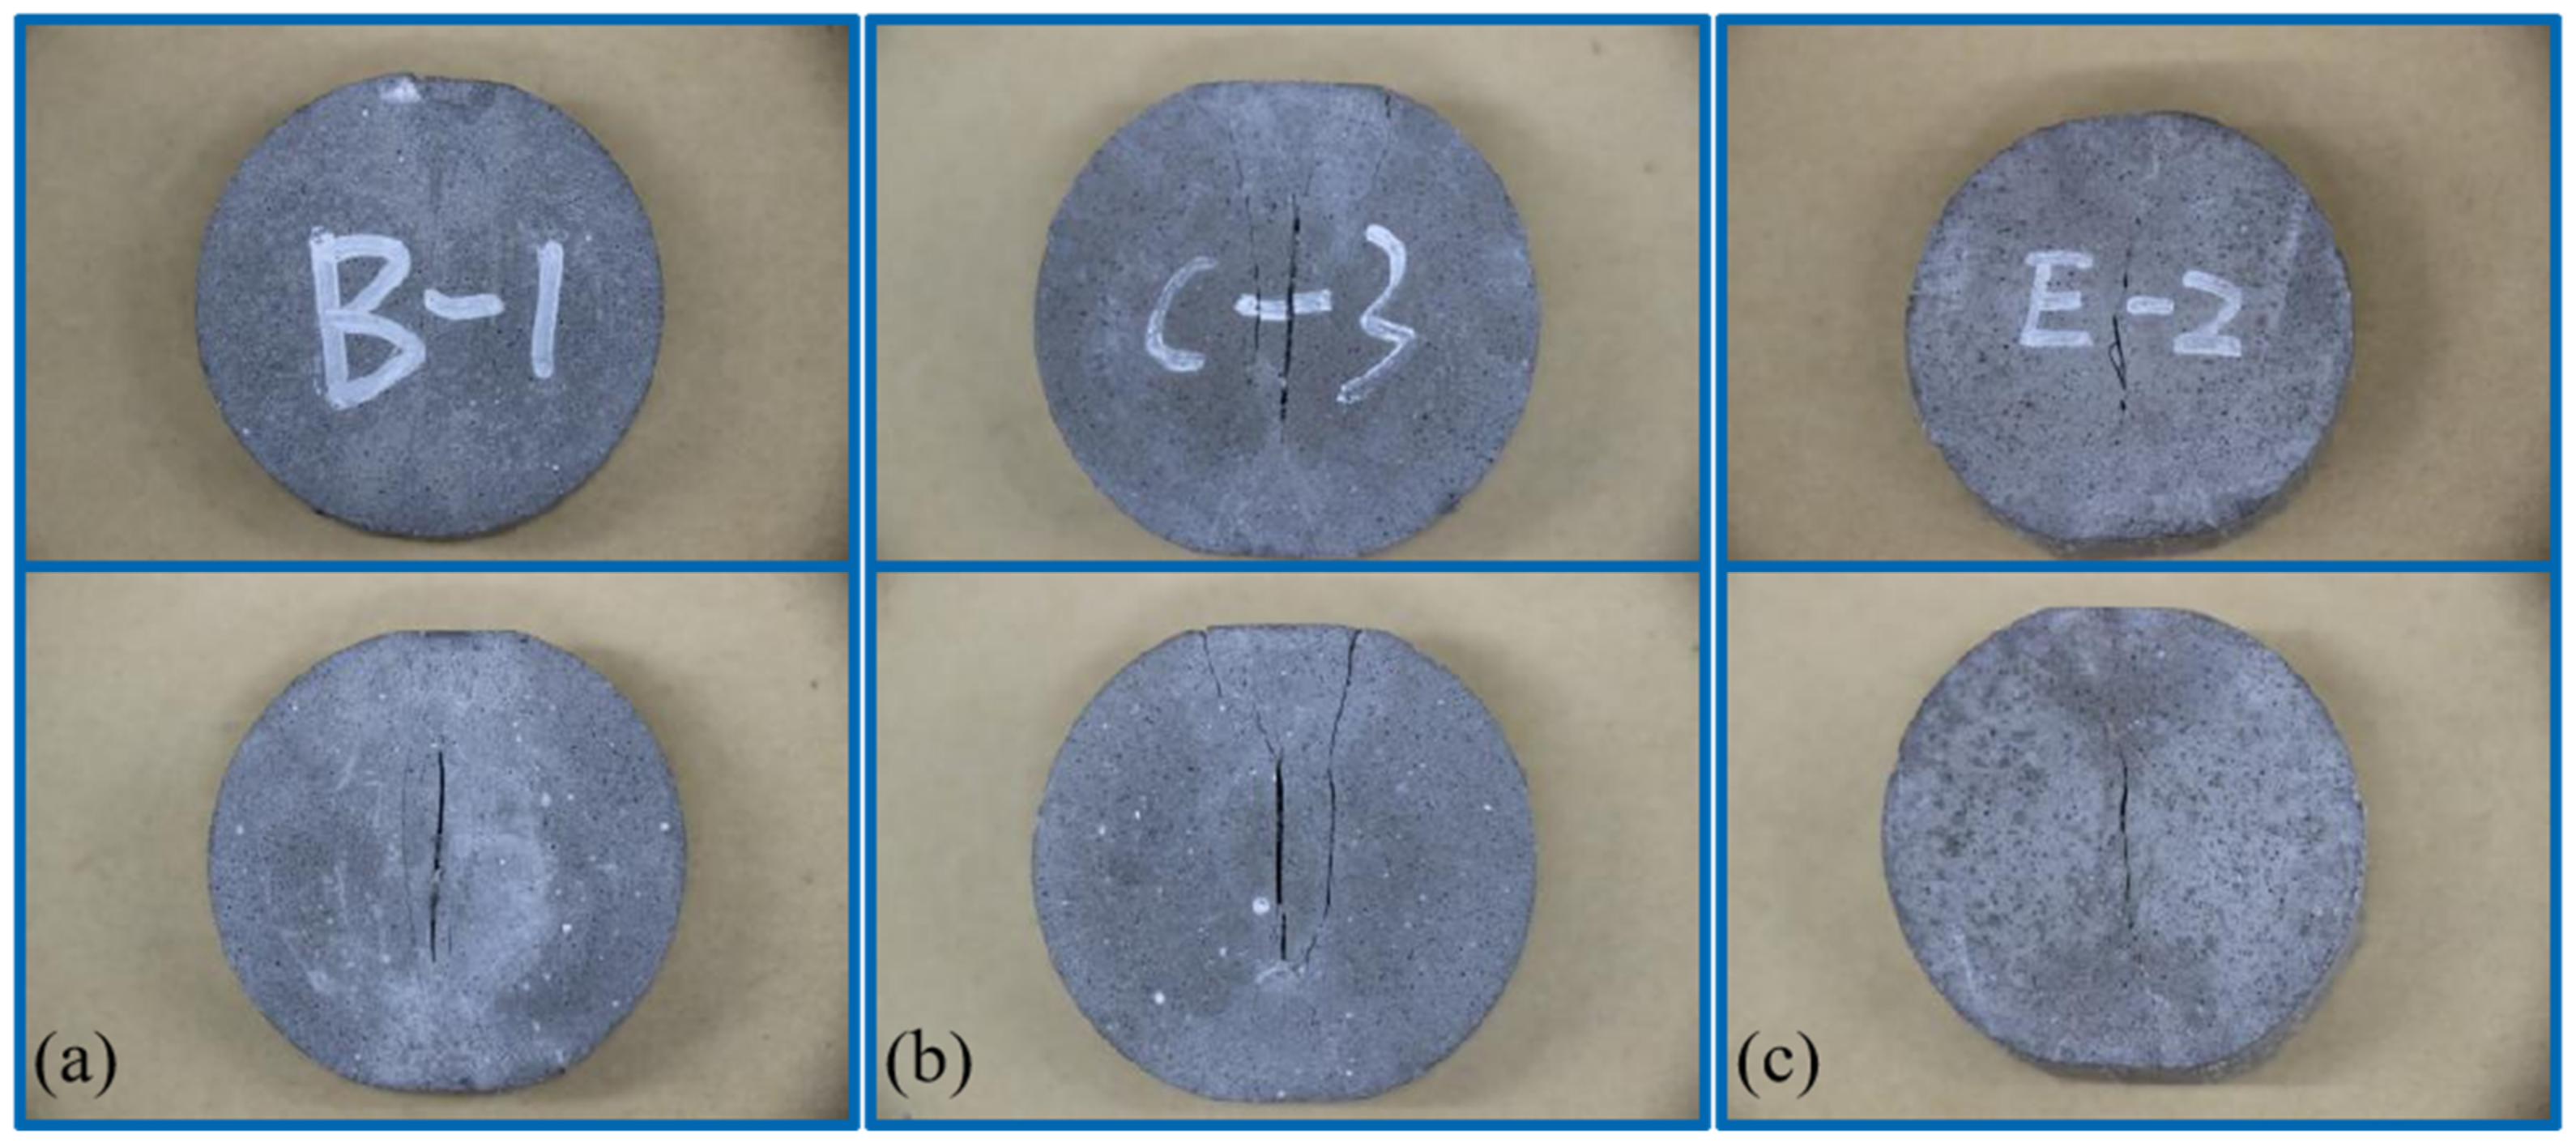
Almost all cement stone specimens are fractured along the diametrical loading. The specimens are split into two hemispheres. However, with an increase in the test temperature and pressure, the propagation direction of fracture gradually changes (Figure 8).
When the test temperature and pressure are 25 °C—0 MPa and 50 °C—10 MPa, the main fracture of the specimens is approximately straight and passes through the center of the disc. The specimens are fractured along the loading direction and are evenly split into two hemispheres. The fracture surface is smooth with small roughness. The fractured specimens maintain good integrity. When the test temperature and pressure are 80 °C—20 MPa, 110 °C—30 MPa and 140 °C—40 MPa, the main fracture of the specimens deviates from the center of the disc, the fracture surface roughness increases and a small number of fragments fall off the end faces of the specimens. With increasing test temperatures and pressures, the degree of the main fracture of the specimens deviates from the center of the disc and the fracture surface roughness also increases.
It is evident that when the test temperature and pressure are 25 °C—0 MPa and 50 °C—10 MPa, the main fracture of the specimens passes through the center of the disc. The specimens undergo tensile failure along the loading direction. When the test temperature and pressure are 80 °C—20 MPa, 110 °C—30 MPa, and 140 °C—40 MPa, the main fracture of the specimens initiates along and then deviates from the center of the disc, which indicates that the specimens are subjected to tensile failure and shear failure at the same time. The characteristics of splitting tensile failure of cement stone specimens under different test temperatures and pressures were analyzed. At 80 °C—20 MPa, 110 °C—30 MPa, and 140 °C—40 MPa, the main fracture of the specimens gradually deviates from the center of the disc. This indicates that shear failure and tensile failure occur at the same time.

3.4. Fracture Modes

After the test, the three specimens do not break into two halves. However, there is a fracture with a length less than the diameter of the disc in the center of the specimens along the loading direction, which is tensile splitting failure (Figure 9). Hence, we can conclude that the failure of the specimens is mainly caused by tensile failure. Along with tensile failure, shear failure simultaneously occurs at the end of the specimens. Therefore, the main fracture of the specimens deviates from the center of the disc with an increase in the testing temperature and pressure.

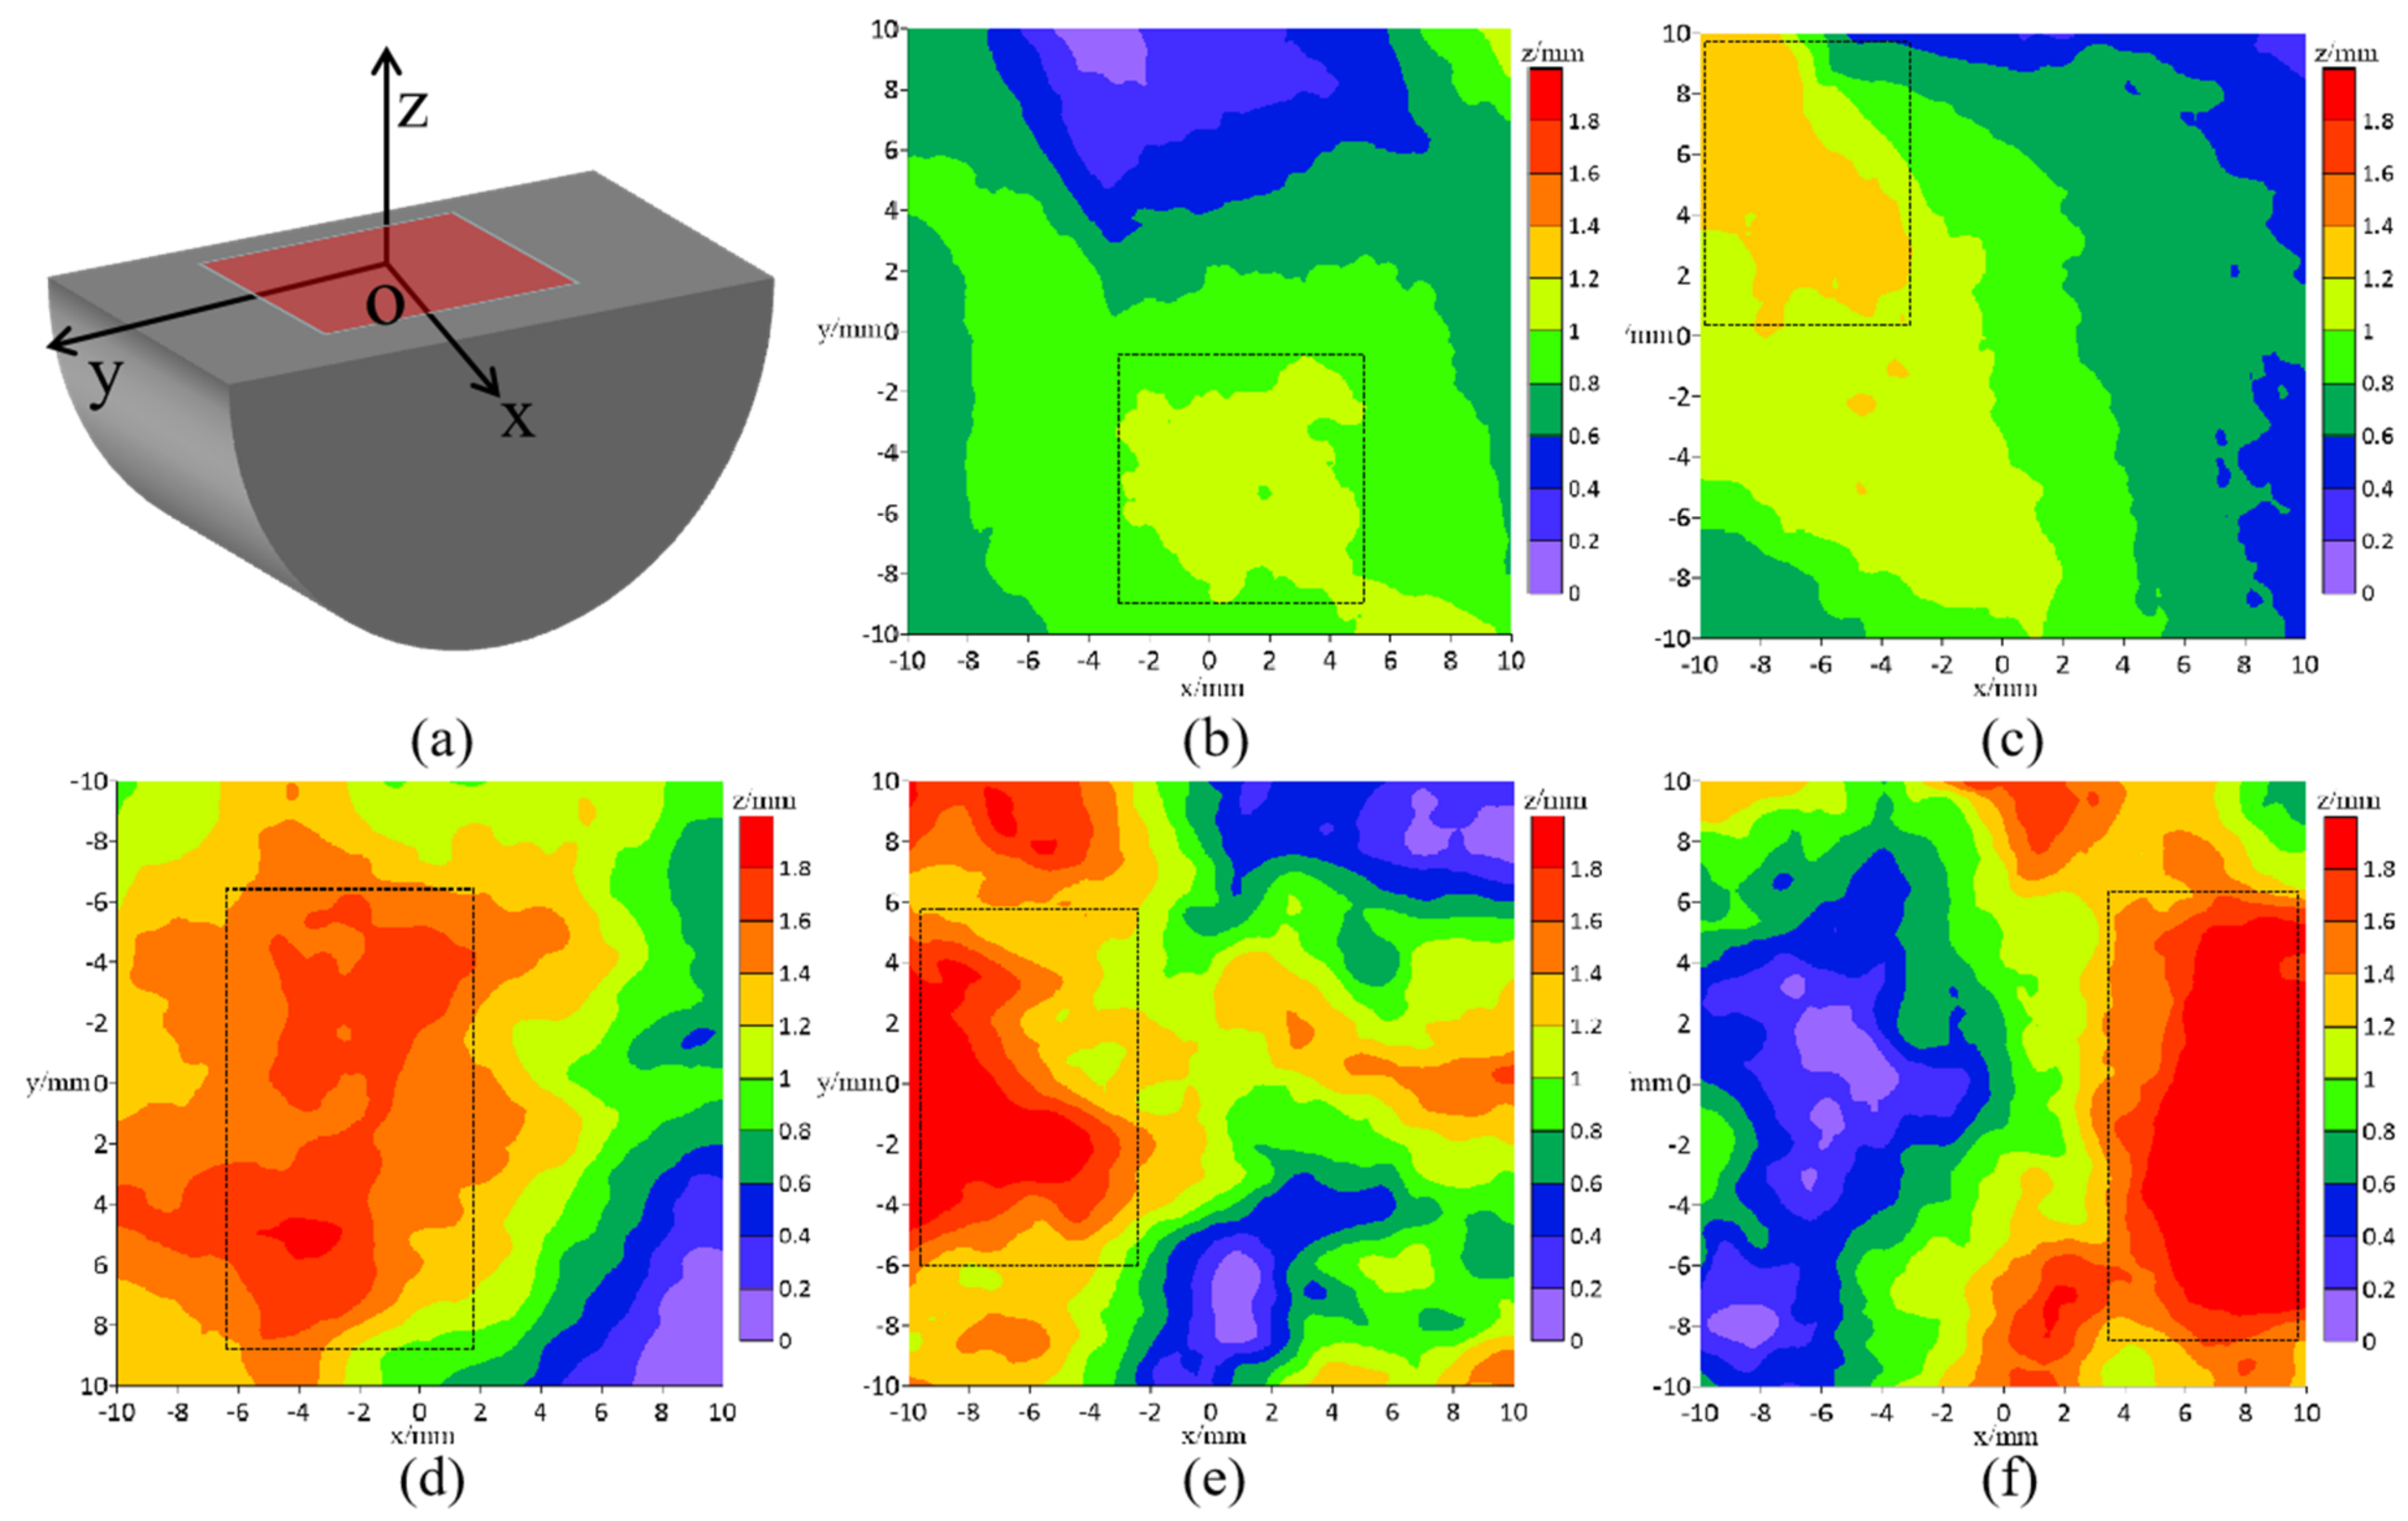
3.5. Roughness of Splitting Fracture Surface

With the center of the fracture surface as the benchmark, we selected a square area with side length of 20 mm in the fracture surface. As shown in Figure 10a, a space rectangular coordinate system was established, with the thickness direction of the disc as the x-axis, the diameter direction of the disc as the y-axis, and the direction perpendicular to the fracture surface as the z-axis. Software of Geomagic Control (Santa Clara, CA, USA) and 3D Studio Max (San Rafael, CA, USA) were used to draw the coordinates of the scanned fracture surface points into a point cloud (Figure 10b–f).
With increasing test temperatures and pressures, the fluctuations of the splitting surfaces of the specimens gradually increase. At the test temperatures and pressures of 25 °C—0 MPa and 50 °C—10 MPa, the areas with the greatest fluctuations appear on the right side of the lower edge and left side of the upper edge of the splitting surface, respectively. When the test temperature and pressure are 110 °C—30 MPa and 140 °C—40 MPa, respectively, the areas with the greatest fluctuations appear in the centers of the left edge and right edge of the splitting surface. The evolution of the position with the greatest fluctuations did not show obvious regularity. In addition, the roughness can effectively reflect the morphological change of the splitting surface of the cement stone. The root mean square (Sq) [26] is often used to calculate the surface roughness:
Sq = 1 A A Ζ 2 x , y dxdy
where A is the horizontally defined area of fracture surface; Z (x, y) is the height function that defines the fracture surface; x and y are the location coordinates.
At the test temperatures and pressures of 25 °C—0 MPa, 50 °C—10 MPa, 80 °C—20 MPa, 110 °C—30 MPa, and 140 °C—40 MPa, the roughness values of the specimens are 0.81, 0.88, 1.01, 1.20, and 1.28, respectively. The splitting surface roughness of the cement stone presented an increasing trend, which is inconsistent with that of tensile strength. The quantitative characterization of roughness is an important indicator of fracture morphology. The increase of roughness might be related to the evolution of the micro-structure of the cement stone, which would be discussed in the following section.

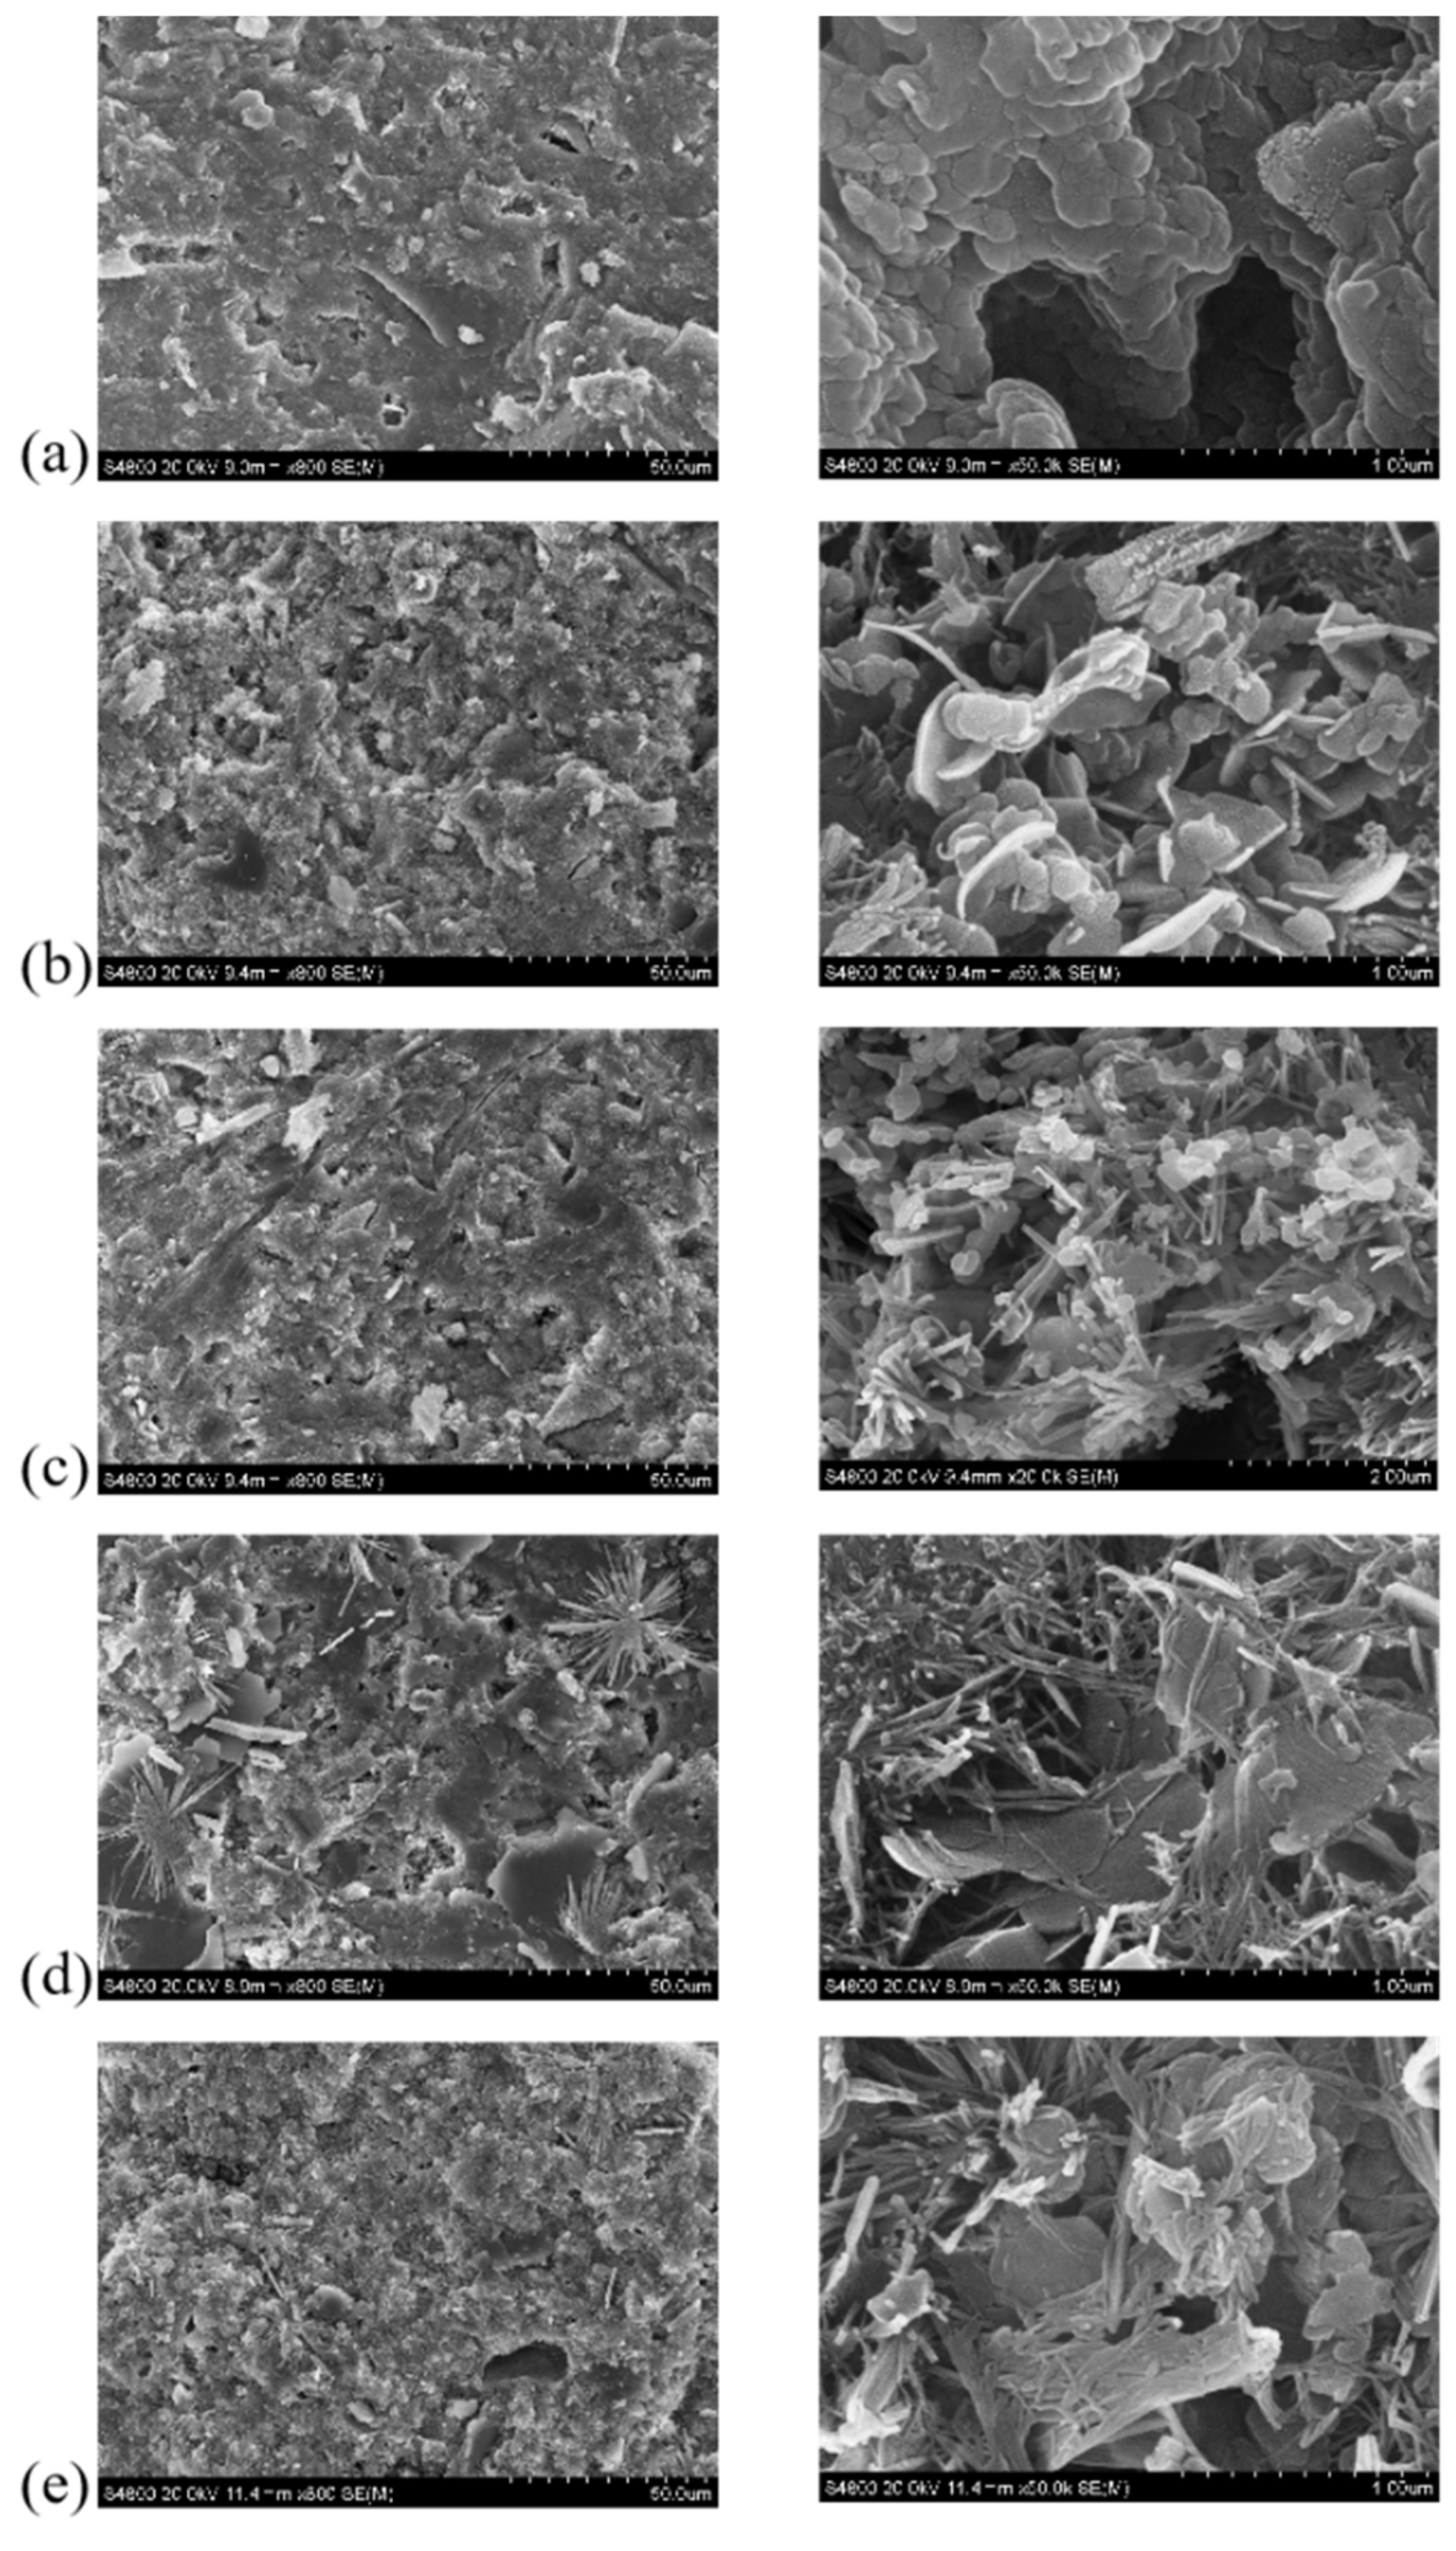
3.6. Micro-Morphology
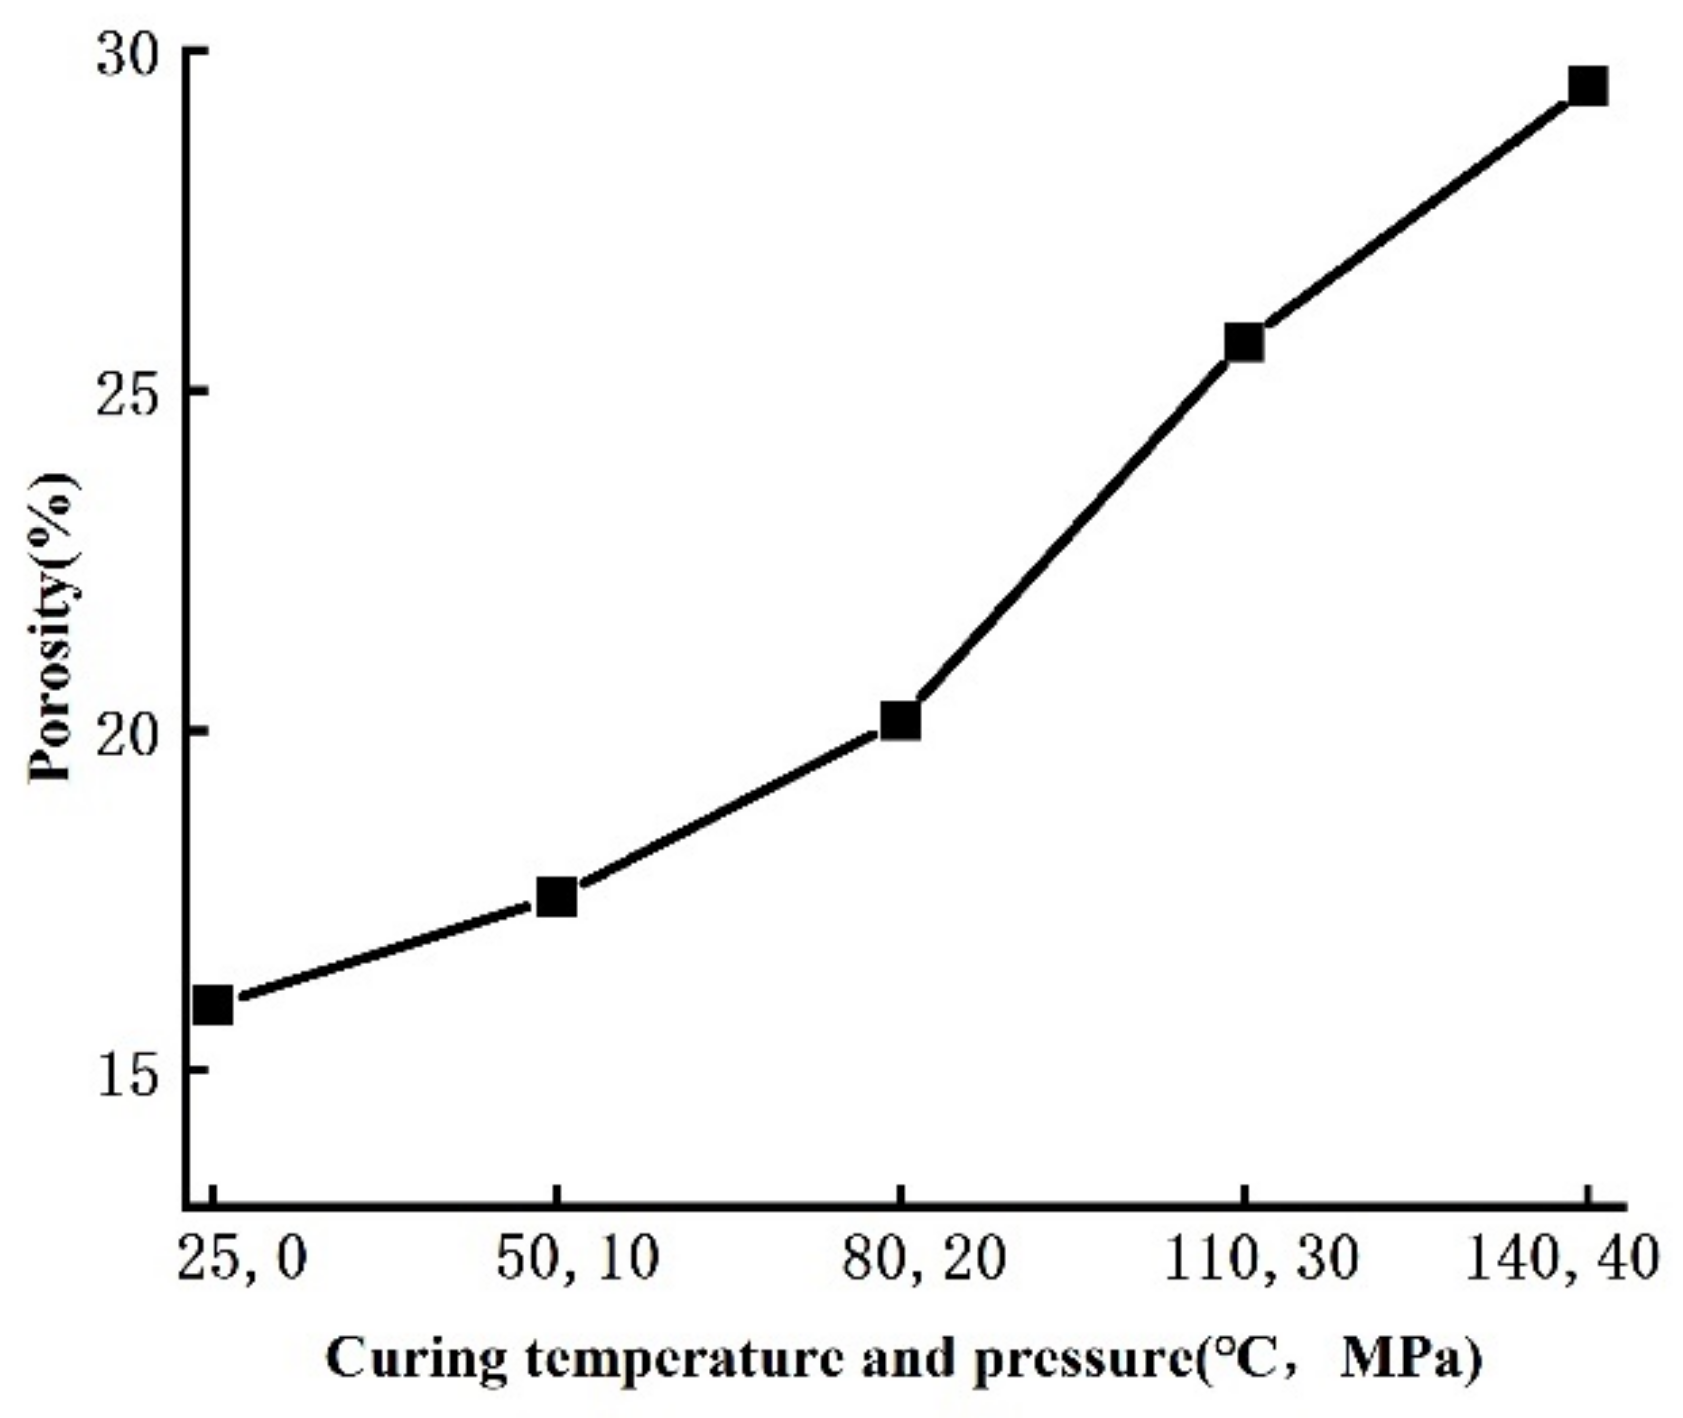
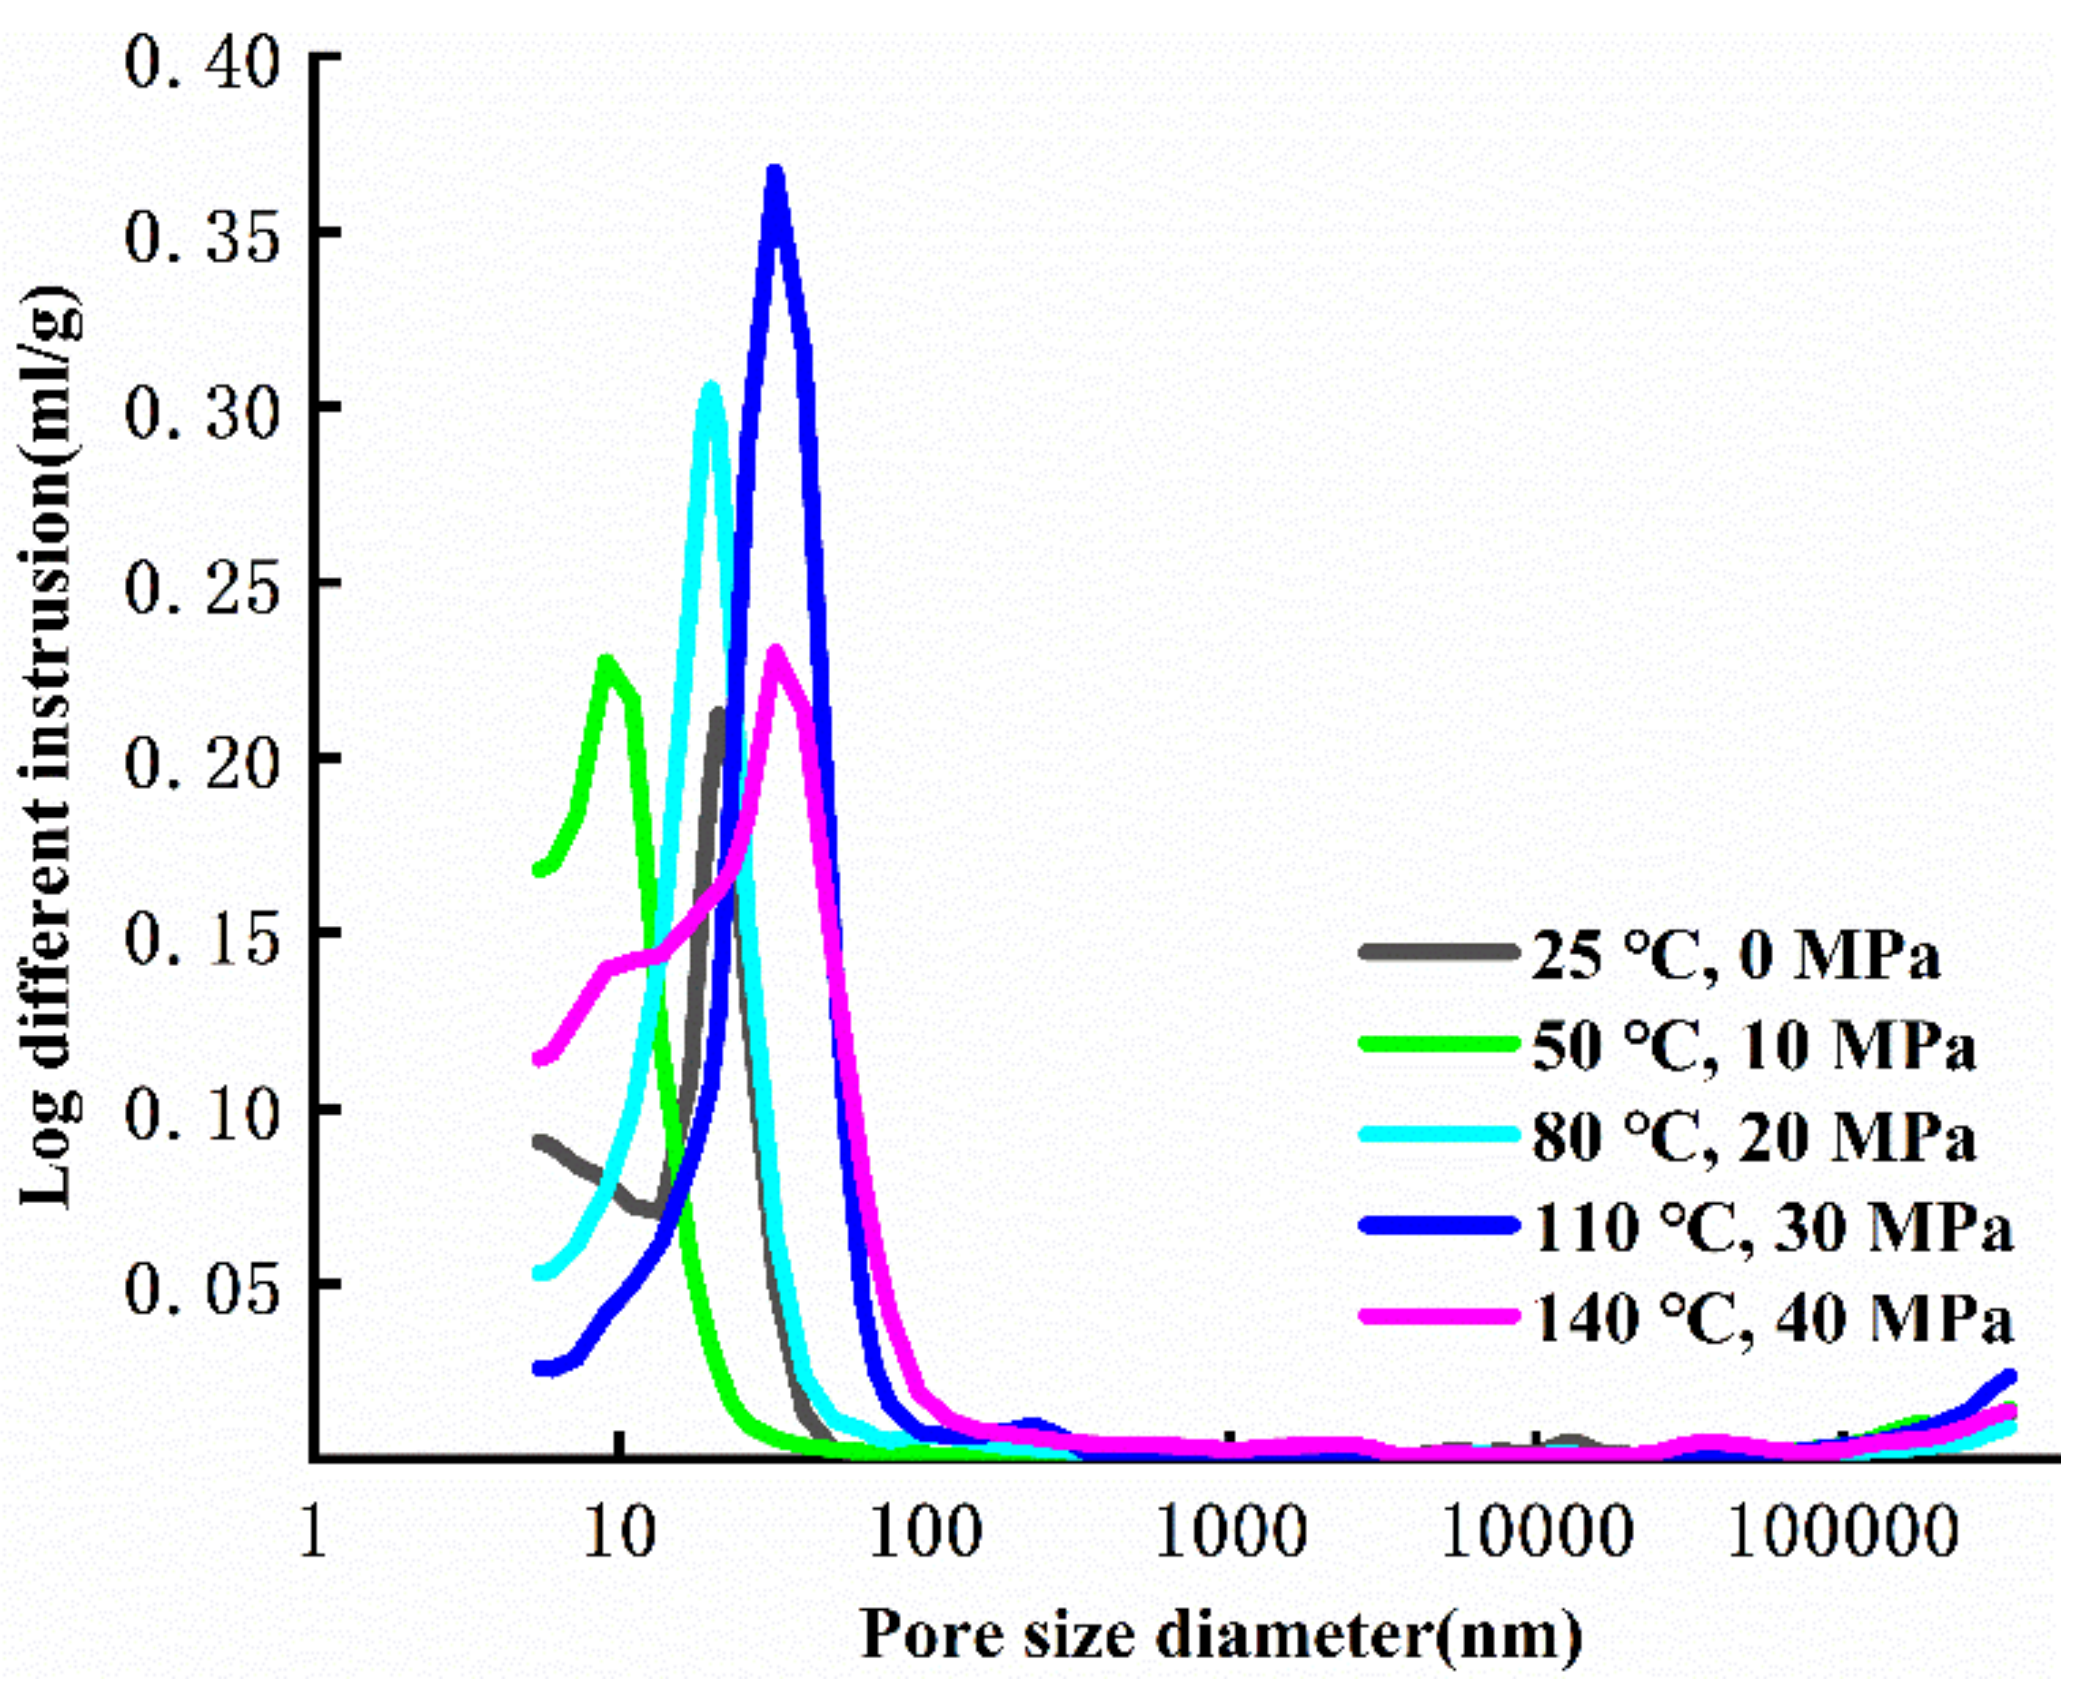
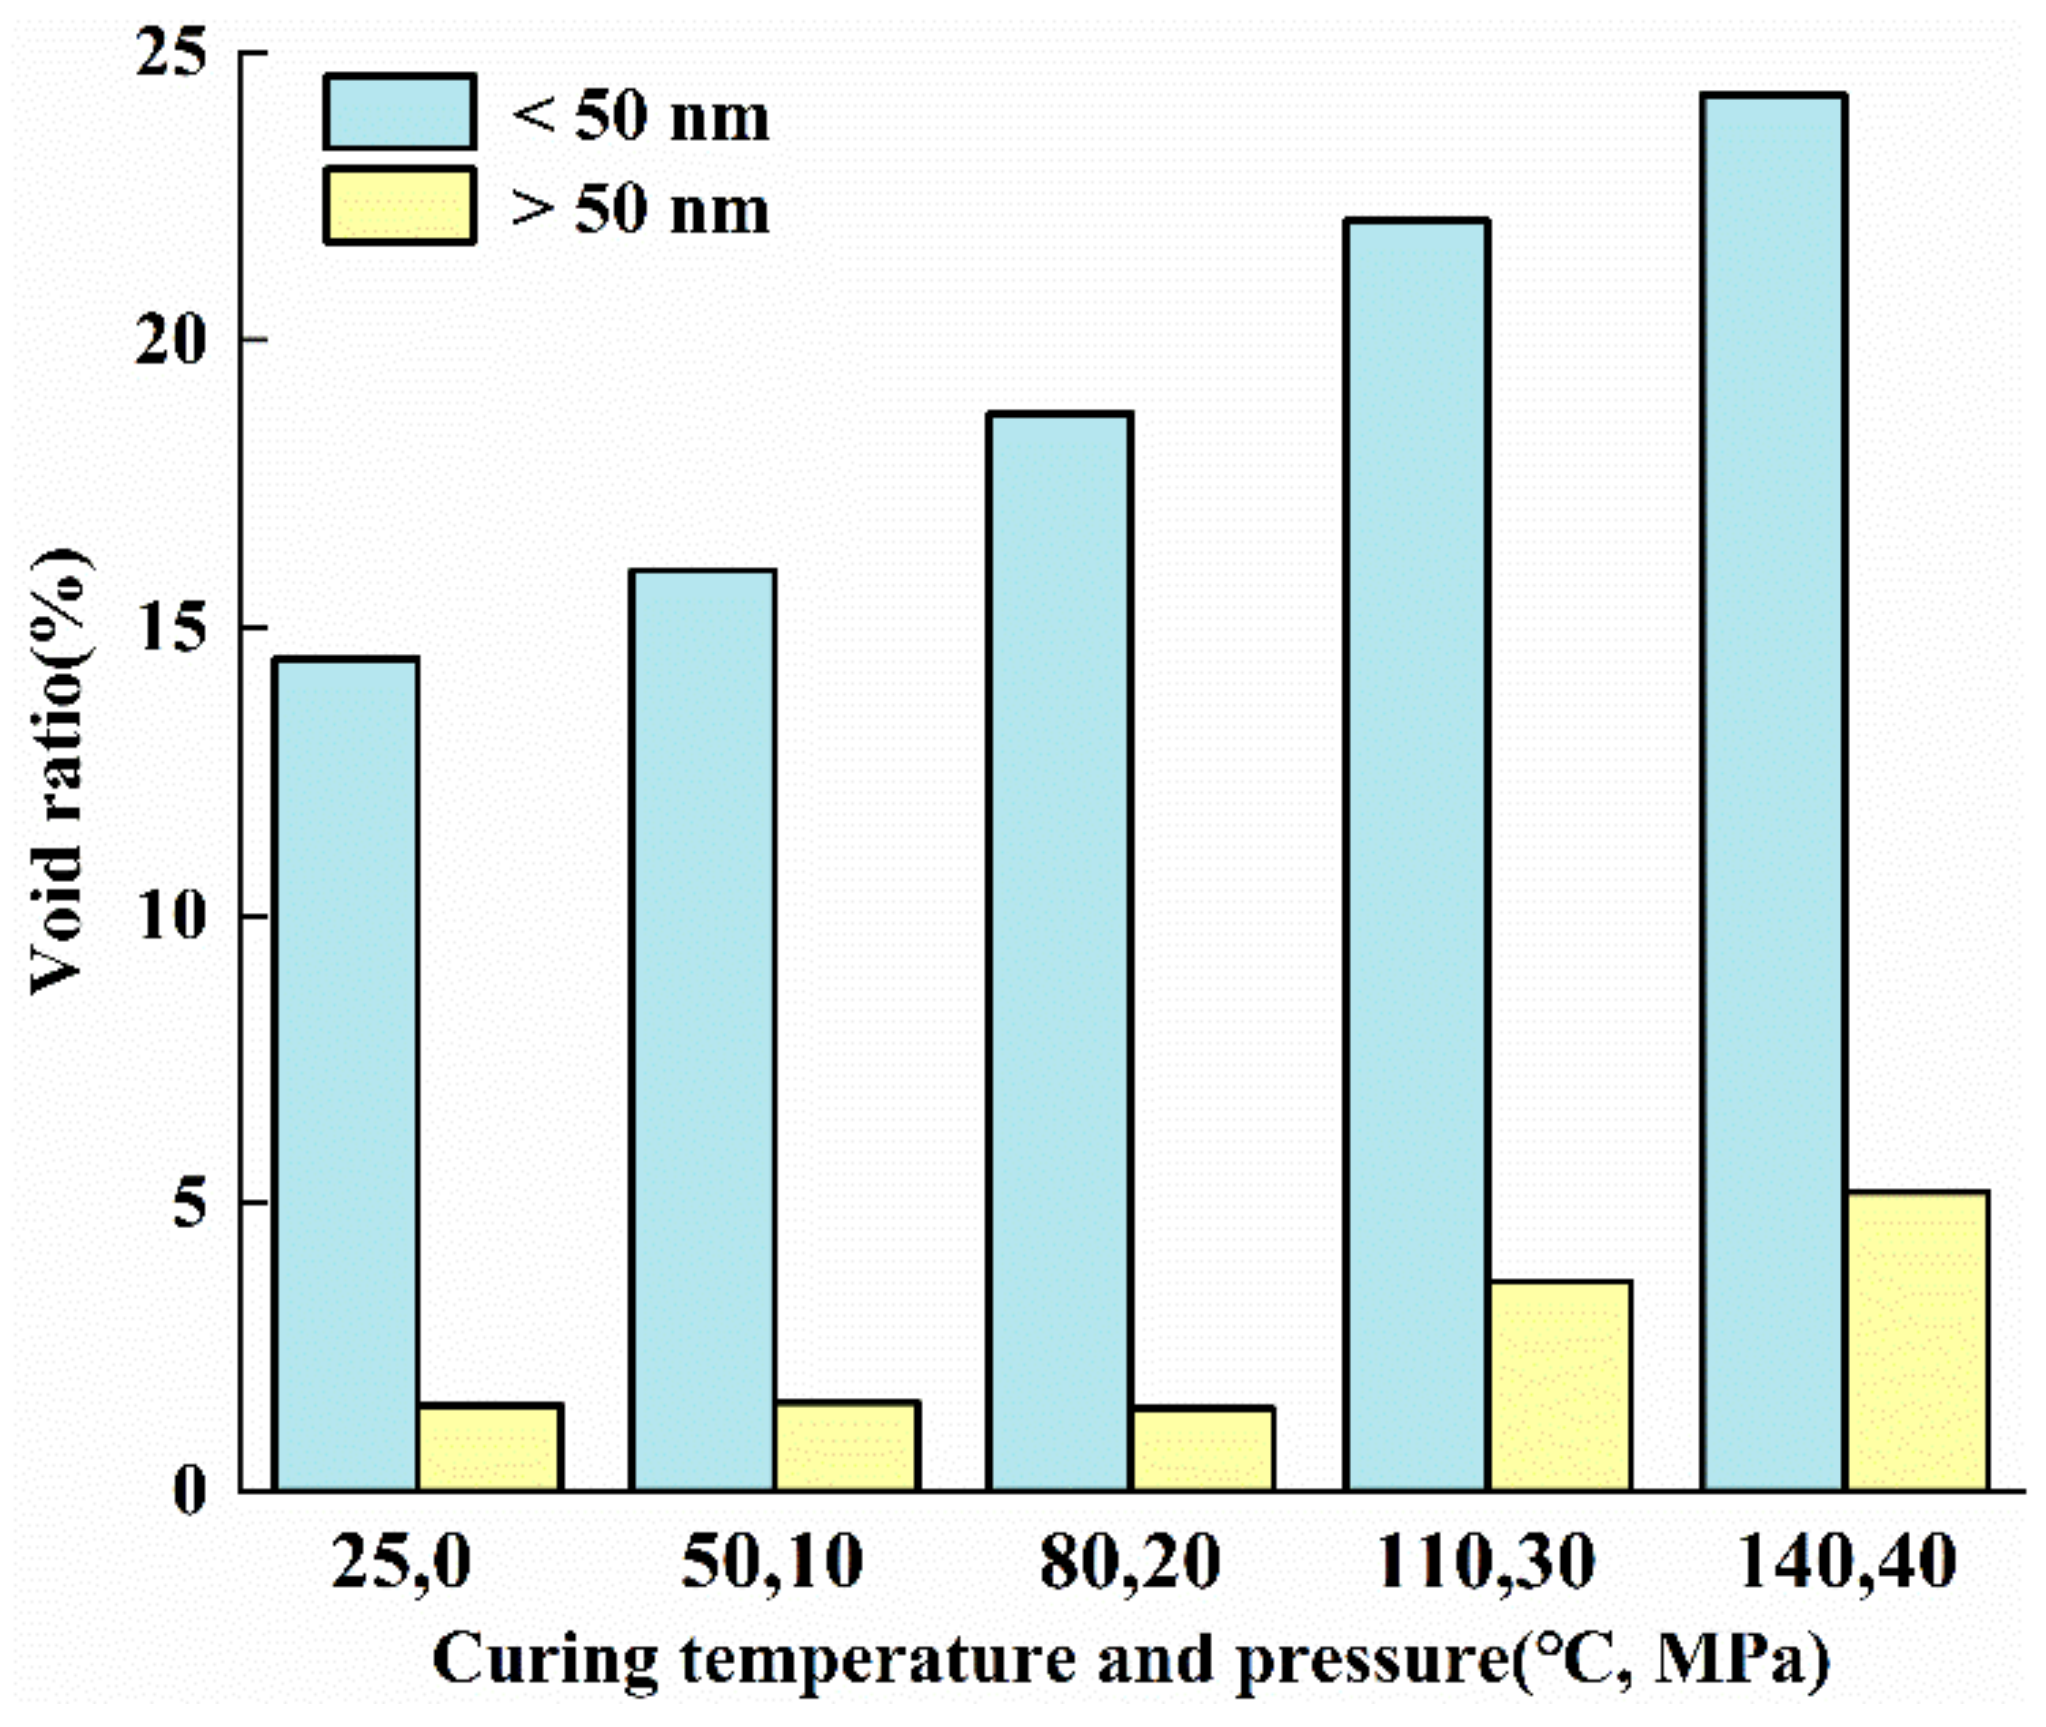
As shown in Figure 11, at a low magnification (800 times), the pores of cement stone increase significantly with gradual increase in the curing temperatures and pressures. At a high magnification (50,000 times) observation scale, the pore structure of the cement stone with the curing temperature and pressure of 25 °C—0 MPa, respectively, is laminated and closely stacked, which significantly increases the density of the cement stone. With gradual increase in the curing temperature and pressure, the pore structure of the cement stone gradually transforms from closely stacked and laminated sheets to interconnected fiber networks. As a result, the degree of pore connectivity is increased, and the proportion of pores also increases. According to the microscopic morphology of cement stone observed by SEM, the dense structure of cement stone gradually changes into a loose and porous structure with increasing formation depth.

3.7. Pore Structure

Cement stone has a porous structure. The porosity and pore size distribution of cement stone has a significant impact on its strength. To quantitatively analyze the pore structure of cement stone under different curing temperatures and pressures, mercury porosimetry was used to measure the porosity of the specimens. Considering the impact of different pore sizes on the strength of cement-based materials, the pore size could be classified into four levels [27]. According to the classification, a pore with a diameter less than 20 nm is harmless; a pore with a diameter of 20–50 nm is less harmful; a pore with a diameter of 50–200 nm is harmful; and a pore with a diameter more than 200 nm is the most harmful.
The research of Li [28] showed that the pore structure of cement stone is affected both by the curing temperature and pressure. When the curing pressure is constant, if cement stone is cured at high temperatures, the average pore diameter and proportion of pores with larger diameters are significantly greater than those in cement stone cured at low temperatures. When the curing temperature is constant, in cement stone cured at high pressure, the average pore diameter and proportion of pores with larger diameters are significantly lower than those in cement stone cured at low pressures. This indicates that an increase in the curing temperature can reduce the compactness of the pore structure of cement stone, while an increase in curing pressure improves the compactness.
As shown in Figure 12, at the curing temperatures and pressures of 25 °C—0 MPa, 50 °C—10 MPa, 80 °C—20 MPa, 110 °C—30 MPa and 140 °C—40 MPa, the porosity of the specimens is 15.96%, 17.54%, 20.15%, 25.71% and 29.46%, respectively. When the curing temperatures and pressures are increased from 25 °C—0 MPa to 50 °C—10 MPa, the porosity of the specimens increases slowly by 9.9%. As the curing temperatures and pressures are further increased from 50 °C—10 MPa to 80 °C—20 MPa and from 110 °C—30 MPa to 140 °C—40 MPa, the porosity of the specimens increases rapidly by 14.88% and 14.59%, respectively. When the curing temperatures and pressures increase from 80 °C—20 MPa to 110 °C—30 MPa, the porosity of the specimens increases rapidly by 27.59%. It could be inferred that the porosity of cement stone would grow with an increase in the formation depth, which is consistent with the observation results of SEM. This indicates that the temperature plays a leading role in the determination of porosity of cement stone, which overpowers the compaction effect of increasing pressure.
As shown in Figure 13, the pore size of the cement stone is mainly distributed in the range of 10–100 nm. With an increase in the curing temperatures and pressures, the peak value of pore size distribution is 21.1, 9.06, 19.95, 32.39, and 32.39 nm, respectively, which do not show obvious regularity. However, when the curing temperatures and pressures are increased from 50 °C—10 MPa to 110 °C—30 MPa, the peak value of pore size distribution of cement stones gradually increases.
Considering that the proportion of pore size of cement stones obtained by MIP is relative, we multiplies the porosity to calculate the absolute value of the proportion of pore size of cement stones (Figure 14). As shown in Figure 14, with an increase in the curing temperatures and pressures, the proportions of harmless pores and less harmful pores are 14.46%, 15.99%, 18.72%, 22.07% and 24.26%, respectively. The proportions of harmful pores and the most harmful pores are 1.50%, 1.55%, 1.43%, 3.64% and 5.20%, respectively.
As the curing temperatures and pressures increase, the proportions of harmless pores and less harmful pores in cement stones showed an obvious increasing trend. In contrast, the proportion of harmful pores and the most harmful pores basically remains unchanged when the curing temperature and pressure increase from 25 °C—0 MPa to 80 °C—30 MPa, and rapidly increases when the curing temperature and pressure increase from 110 °C—30 MPa to 140 °C—40 MPa.

4. Discussion

With an increase in the curing temperature and pressure, the pore structure of cement stone gradually transforms from closely stacked laminated sheets to interconnected fiber networks. The dense structure of cement stone gradually becomes loose and porous. The porosity gradually increases, which has a strong impact on the tensile strength. When the porosity is greater, the tensile strength of the rock is reduced [29]. At the same time, the proportions of pores with different sizes in cement stone also change. With an increase in the curing temperature and pressure, there is a reduction in the proportion of the most harmful pores in cement stone, which have the greatest impact on the strength of cement-based materials. The reduction in the proportion of the most harmful pores can improve the mechanical properties of cement-based materials to a certain extent. The test temperatures and pressures also have a substantial influence on the mechanical properties of cement stone. Thus, the pore structure of cement stone after curing and the test temperature and pressure jointly affect the tensile strength of cement stone. With an increase in the formation depth, under the joint impact of the pore structure of cement stone and the formation temperature and pressure, the tensile strength of cement stone increases rapidly in the range of depths from 0 to 2000 m, increases slowly from 2000 m to 3000 m depth and decreases gradually from 3000 m to 4000 m depth.

5. Conclusions

In this study, splitting tensile tests of cement stone cured at different temperatures and pressures were carried out at different test temperatures and pressures. The splitting tensile strength of cement stone at depths from 0 to 4000 m and the failure characteristics after splitting were studied. The roughness of fracture surface after tensile failure was measured using the 3D scanner. The pore structure was studied using SEM and MIP. The main conclusions are:
(1)
At the test temperatures and pressures of 25 °C—0 MPa and 50 °C—10 MPa, the yield failure stage is not obvious in the stress curve. The cement stone exhibits typical brittle failure. At the test temperatures and pressures of 80 °C—20 MPa, 110 °C—30 MPa, and 140 °C—40 MPa, the cement stone becomes more ductile.
(2)
At the test temperatures and pressures of 25 °C—0 MPa and 50 °C—10 MPa, the main fracture in cement stone passes through the center of the disc and tensile failure occurs. When the test temperatures and pressures are 80 °C—20 MPa, 110 °C—30 MPa, and 140 °C—40 MPa, the main failure mode is tensile failure, accompanied by plastic shear failure.
(3)
The fracture surface roughness of cement stone increases gradually with an increase in the test temperature and pressure. Additionally, the fracture surface roughness in cement stone cannot be predicted only by the tensile strength and is also affected by the pore structure, test temperature and pressure.
(4)
With an increase in the curing temperature and pressure, the porosity of cement stone gradually increases. The pore structure of cement stone gradually transforms from closely stacked laminated sheets to interconnected fiber networks. The dense structure of cement stone gradually becomes loose and porous.
(5)
Under the joint influence of the pore structure and the formation temperature–pressure environment, the tensile strength of cement stone rapidly increases at depths from 0 to 2000 m, slows down at depths from 2000 to 3000 m and decreases at depths from 3000 to 4000 m.

Author Contributions

Conceptualization, L.W. and Y.G.; data curation, B.L. and L.W.; formal analysis, B.L. and L.W.; funding acquisition, L.W. and Y.G.; investigation, B.L. and H.Y.; project administration, Y.G. and J.L.; resources, Y.G.; supervision, J.L. and Y.G.; validation, B.L. and H.Y.; writing—original draft, B.L. and L.W.; writing—review and editing, B.L., L.W., Y.G. and J.L. All authors have read and agreed to the published version of the manuscript.

Funding

This work was sponsored by the “National Natural Science Foundation of China’’ (No. 52104010), the “Sinopec Science and Technology Department Project” (No. P21056).

Data Availability Statement

The data presented in this study are available on request from the corresponding author.

Conflicts of Interest

The authors declare no conflict of interest.

References

  1. Gray, K.E.; Podnos, E.; Becker, E. Finite-Element Studies of Near-Wellbore Region During Cementing Operations: Part I. Spe. Drill Complet. 2009, 24, 127–136. [Google Scholar] [CrossRef]
  2. Raju, M.; Kumar Khaitan, S. Modeling and simulation of compressed air storage in caverns: A case study of the Huntorf plant. Appl. Energ 2012, 89, 474–481. [Google Scholar] [CrossRef]
  3. Wang, T.; Yang, C.; Ma, H.; Li, Y.; Shi, X.; Li, J.; Daemen, J.J.K. Safety evaluation of salt cavern gas storage close to an old cavern. Int. J. Rock Mech. Min. 2016, 83, 95–106. [Google Scholar] [CrossRef]
  4. Zhang, N.; Shi, X.; Wang, T.; Yang, C.; Liu, W.; Ma, H.; Daemen, J.J.K. Stability and availability evaluation of underground strategic petroleum reserve (SPR) caverns in bedded rock salt of Jintan, China. Energy 2017, 134, 504–514. [Google Scholar] [CrossRef]
  5. Lankof, L.; Tarkowski, R. Assessment of the potential for underground hydrogen storage in bedded salt formation. Int. J. Hydrogen Energy 2020, 45, 19479–19492. [Google Scholar] [CrossRef]
  6. Liu, W.; Zhang, Z.; Chen, J.; Jiang, D.; Wu, F.; Fan, J.; Li, Y. Feasibility evaluation of large-scale underground hydrogen storage in bedded salt rocks of China: A case study in Jiangsu province. Energy 2020, 198, 117348. [Google Scholar] [CrossRef]
  7. Yin, F.; Hou, D.; Liu, W.; Deng, Y. Novel assessment and countermeasure for micro-annulus initiation of cement sheath during injection/fracturing. Fuel 2019, 252, 157–163. [Google Scholar] [CrossRef]
  8. Li, J.; Xi, Y.; Tao, Q.; Li, Y.; Qu, G. Experimental investigation and numerical simulation of the emergence and development of micro-annulus in shale gas wells subjected to multistage fracturing. J. Nat. Gas Sci. Eng. 2020, 78, 103314. [Google Scholar] [CrossRef]
  9. Zhao, C.; Hu, X.; Zhang, Y.; Liang, H.; Fang, H.; Zhang, L.; Tang, S.; Zeng, F. Anti-channeling cementing technology for long horizontal sections of shale gas wells. Nat. Gas Ind. B 2018, 5, 212–218. [Google Scholar] [CrossRef]
  10. Ravi, K.; Bosma, M.; Gastebled, O. Improve the Economics of Oil and Gas Wells by Reducing the Risk of Cement Failure. In Proceedings of the IADC/SPE Drilling Conference, Dallas, TX, USA, 26–28 February 2002. SPE-74497-MS. [Google Scholar]
  11. Shahri, M.; Schubert, J.J.; Amani, M. Detecting and Modeling Cement Failure in High-Pressure/High-Temperature (HP/HT) Wells, Using Finite Element Method (FEM). In Proceedings of the International Petroleum Technology Conference, Doha, Qatar, 21–23 November 2005. IPTC-10961-MS. [Google Scholar]
  12. Griffith, J.E.; Lende, G.; Ravi, K.; Saasen, A.; Nødland, N.E.; Jordal, O.H. Foam Cement Engineering and Implementation for Cement Sheath Integrity at High Temperature and High Pressure. In Proceedings of the IADC/SPE Drilling Conference, Dallas, TX, USA, 2–4 March 2004. SPE-87194-MS. [Google Scholar]
  13. Li, Y.; Liu, S.; Wang, Z.; Yuan, J.; Qi, F. Analysis of Cement Sheath Coupling Effects of Temperature and Pressure in Non-Uniform In-Situ Stress Field. In Proceedings of the International Oil and Gas Conference and Exhibition in China, Beijing, China, 8–10 June 2010. SPE-131878-MS. [Google Scholar]
  14. Bois, A.; Garnier, A.; Galdiolo, G.; Laudet, J. Use of a Mechanistic Model to Forecast Cement-Sheath Integrity for CO2 Storage. In Proceedings of the SPE International Conference on CO2 Capture, Storage, and Utilization, New Orleans, LO, USA, 10–12 November 2010. SPE-139668-MS. [Google Scholar]
  15. Li, M.; Liu, M.; Yang, Y.; Li, Z.; Guo, X. Mechanical properties of oil well cement stone reinforced with hybrid fiber of calcium carbonate whisker and carbon fiber. Petrol. Explor. Dev. 2015, 42, 104–111. [Google Scholar] [CrossRef]
  16. Lima, V.N.; Silva, F.D.A.; Skadsem, H.J.; Beltrán-Jiménez, K.; Sunde, J.K. Effects of confinement pressure on the mechanical behavior of an oil well cement paste. J. Petrol. Sci. Eng. 2022, 208, 109769. [Google Scholar] [CrossRef]
  17. Xu, F.; Xu, Z.; Tang, S.; Ren, Q.; Guo, Y.; Wang, L.; Hou, Z.; Liu, Z. Evolution of physical and mechanical properties of cementing materials during underground energy exploitation and storage. J. Energy Storage 2022, 45, 103775. [Google Scholar] [CrossRef]
  18. Shakor, P.; Sanjayan, J.; Nazari, A.; Nejadi, S. Modified 3D printed powder to cement-based material and mechanical properties of cement scaffold used in 3D printing. Constr. Build Mater. 2017, 138, 398–409. [Google Scholar] [CrossRef]
  19. Quercia, G.; Chan, D.; Luke, K. Weibull statistics applied to tensile testing for oil well cement compositions. J. Petrol. Sci. Eng. 2016, 146, 536–544. [Google Scholar] [CrossRef]
  20. Liu, J. Research on Constitutive Equations and Evaluation Models of Mechanical Integrity of Cement Stone; Southwest Petroleum University: Chengdu, China, 2013. [Google Scholar]
  21. Li, Z.; Sun, J.; Luo, P.; Lin, L.; Deng, Z.; Guo, X. Research on the law of mechanical damage-induced deformation of cement sheaths of a gas storage well. J. Nat. Gas Sci. Eng. 2017, 43, 48–57. [Google Scholar] [CrossRef]
  22. Yang, X.; Kuru, E.; Gingras, M.; Iremonger, S. CT-CFD integrated investigation into porosity and permeability of neat early-age well cement at downhole condition. Constr. Build Mater. 2019, 205, 73–86. [Google Scholar] [CrossRef]
  23. UNE-EN ISO 10426-2-2003; Petroleum and natural gas industries - Cements and materials for well cementing - Part 2: Testing of well cements (ISO 10426-2:2003). (Endorsed by AENOR in December of 2003.).
  24. GB/T19139-2012; General Administration of Quality Supervision, Inspection and Quarantine of the People’s Republic of China. Oil Well Cement Test Method. Standards Press of China: Beijing, China, 2013.
  25. Zhang, J. Hydration, Hardening and Properties of Class G Oil Well Cement; Zhejiang University: Zhejiang, China, 2001. [Google Scholar]
  26. Tan, J.; Hu, C.; Lyu, Q.; Feng, G.; Chen, S. Experimental investigation on the effects of different fracturing fluids on shale surface morphology. J. Petrol. Sci. Eng. 2022, 212, 110356. [Google Scholar] [CrossRef]
  27. Feng, Q.; Liu, G.M.; Ba, H.J. Relation of Grain Grading and Deleterious Porosity of Cement-based Materials. J. Tongji Univ. Nat. Sci. 2004, 32, 1168–1172. [Google Scholar]
  28. Li, W. Study on Influence Factors and Action Rules of Mechanical Property Test of Cement Paste; Southwest Petroleum University: Chengdu, China, 2019. [Google Scholar]
  29. Yang, Y.; Ju, Y.; Liu, H.; Wang, H. Influence of porous structure properties on mechanical performances of rock. Chin. J. Rock Mech. Eng. 2009, 28, 2031–2038. [Google Scholar]
Figure 1. The casing-cement-formation system and the modes of cement sheath damage. (a) The composition of casing-cement-formation system, (b) casing-cement interface debonding, (c) cement-formation interface debonding, (d) cement shear damage and (e) cement radial tensile failure.
Energies 15 07340 g001
Figure 2. Wellbore structure and typical temperature-pressure environment with increase of depth.
Energies 15 07340 g002
Figure 3. Preparation of cement stone specimens: (a) high-temperature and high-pressure curing device, (b) cement pouring and curing and (c) some prepared cement stone specimens.
Energies 15 07340 g003
Figure 4. Preparation of sealed cement stone specimens: (a) cylinder indenter, (b) silica gel, (c) heat shrinkable tube with high temperature resistance and (d) sealed specimen.
Energies 15 07340 g004
Figure 5. The testing machine: (a) the triaxial testing machine of XTR01-01, (b) the mercury porosimeter of Micromeritics AutoPore V 9620, (c) the 3D scanner of OKIO-3M-400-200-100, and (d) the scanning electron microscope of Hitachi S4800.
Energies 15 07340 g005
Figure 6. Load-displacement curves under different temperatures and pressures.
Energies 15 07340 g006
Figure 7. The evolution of tensile strength with the increase of test temperature and confining pressure.
Energies 15 07340 g007
Figure 8. Splitting fracture surface under different temperatures and pressures: (a) 25 °C—0 MPa, (b) 50 °C—10 MPa, (c) 80 °C—20 MPa, (d) 110 °C—30 MPa, and (e) 140 °C—40 MPa.
Energies 15 07340 g008
Figure 9. Splitting fracture surface of some cement stone specimens: (a) 50 °C—10 MPa, (b) 80 °C—20 MPa, and (c) 140 °C—40 MPa.
Energies 15 07340 g009
Figure 10. Point cloud of relative elevation of splitting fracture surface under different temperatures and pressures: (a) space rectangular coordinate system (b) 25 °C—0 MPa, (c) 50 °C—10 MPa, (d) 80 °C—20 MPa, (e) 110 °C—30 MPa, and (f) 140 °C—40 MPa.
Energies 15 07340 g010
Figure 11. Microstructure of cement stone under different curing temperatures and pressures: (a) 25 °C—0 MPa, (b) 50 °C—10 MPa, (c) 80 °C—20 MPa, (d) 110 °C—30 MPa, and (e) 140 °C—40 MPa.
Energies 15 07340 g011
Figure 12. Porosity of cement stone under different curing temperatures and pressures.
Energies 15 07340 g012
Figure 13. Pore-size distribution curves.
Energies 15 07340 g013
Figure 14. Void ratio of cement stone under different curing temperatures and pressures.
Energies 15 07340 g014
Table 2. Physical parameters of cement stone.
Sample NumberCuring ConditionsTest ConditionsDiameter
(mm)
Length
(mm)
Temperature
(°C)
Pressure
(MPa)
Temperature
(°C)
Pressure
(MPa)
A-125025050.5925.18
A-250.6425.31
A-350.7325.38
B-15010501050.7625.57
B-250.4125.11
B-950.5625.13
C-18020802050.7625.01
C-250.5025.07
C-350.2125.09
D-1110301103050.6025.24
D-250.5225.21
D-350.5624.99
E-1140401404050.4024.97
E-250.5225.22
E-950.4025.07
Publisher’s Note: MDPI stays neutral with regard to jurisdictional claims in published maps and institutional affiliations.

