Article

Study of Hybrid Transmission HVAC/HVDC by Particle Swarm Optimization (PSO)

Department of Electrical Engineering, Universitas Sumatera Utara, Medan 20222, Indonesia
*
Author to whom correspondence should be addressed.
Energies 2022, 15(20), 7638; https://doi.org/10.3390/en15207638
Submission received: 30 August 2022 / Revised: 11 October 2022 / Accepted: 13 October 2022 / Published: 16 October 2022
(This article belongs to the Special Issue Power System Simulation and Modeling)

Abstract

:
There are considerable power losses in Indonesia’s SUMBAGUT 150 kV transmission High Voltage Alternating Current Network (HVAC) system. These power losses and the voltage profile are critical problems in the transmission network system. This research provides one possible way to reduce power losses involving the use of a High Voltage Direct Current (HVDC) network system. Determining the location to convert HVAC into HVDC is very important. The authors of the current study used Particle Swarm Optimization (PSO) to determine the optimal location on the 150 kV SUMBAGUT HVAC transmission network system. The study results show that, before using the HVDC network system, the power loss was 68.41 MW. On the other hand, power loss with the conversion of one transmission line to HVDC was 57.31 MW for “Paya Pasir–Paya Geli” (efficiency 16.22%), 51.79 MW for “Paya Pasir–Sei Rotan” (efficiency 24.29%), and 60.8 MW for “Renun–Sisikalang” (efficiency 110.12%). The power loss with the conversion of two transmission lines to HVDC was 45.7 MW for “Paya Pasir–Paya Geli” and “Paya Pasir–Sei Rotan” (efficiency 33.19%), 44.95 MW for “Paya Pasir–Paya Geli” and “Renun–Sidikalang” (efficiency 26.98%), and 44.69 MW for “Paya Pasir–Sei Rotan” and “Renun–Sidikalang” (efficiency 34.67%). The power loss with the conversion of three transmission lines to HVDC was 38.71 MW for “Paya Pasir–Paya Geli,” “Paya Pasir–Sei Rotan,” and “Renun–Sidikalang” (efficiency 41.41%).

1. Introduction

A transmission system is a system that functions to transmit electricity from the generator to the main power substation. Therefore, transmission systems must be able to deliver a good supply of electrical power. Transmission lines are generally in the form of open conductors whose channel lengths are up to tens of kilometers long. This results in a short circuit and voltage stability. There are three types of transmission systems: High Voltage Alternating Current (HVAC) [1], High Voltage Direct Current (HVDC) [2], and Hybrid HVAC/HVDC systems [3].
Future energy network research is increasingly focusing on energy and renewable energy issues. Over the past few years, there has been a huge increase in energy demand, which has caused existing fossil power plants to emit dangerous gases. The government has been compelled to consider alternative energy sources more carefully due to global warming and environmental awareness concerns. One of the more intriguing solutions to this problem is incorporating of renewable energy sources, such as wind, hydropower, and solar power, into HVDC transmission systems.
In HVDC transmission, the things to be considered include the existence of an HVDC converter substation. There are two main techniques that can be used for converting AC to DC and vice versa: the line commutated converter (LCC) [4], and the voltage source converter (VSC) [5,6]. The advance of power electronics technology has allowed for the success of these two methods. The atmospheric converter, transfer, and electrolytic converters were all developed in earlier attempts to undergo AC/DC conversion before the development of power electronics. Due to technical issues and the intrinsic safety precautions associated with their use, these initiatives were unsuccessful [4,5,6,7]. On the other hand, the function of Power Transmission among Multiple Power Sources or Multiple Receiving Ends can be achieved by Multi-Terminal Direct Current (MTDC). This method is more versatile and affordable than conventional transmission systems and has some other important benefits.
For constructing and running the DC grid, it is essential to have control and operation technology for the multi-terminal high voltage DC (HVDC), also referred to as the “MTDC”. The MTDC controls the power flow between the converter stations in HVDC systems with three or more converters. Because the MTDC system has the advantage of integrating distant renewable resources, it is noteworthy that much MTDC research has focused on integrating offshore wind farms. The length of the AC cables is a problem since there are a lot of fine wind resources offshore, and offshore wind farms are often located far from the mainland. Therefore, the MTDC is desirable for collecting and integrating various wind farms. Due to the advantage of the VSC with weak AC systems, hybrid MTDC systems have also been suggested. The VSC has several benefits, including independent reactive and active power management, AC voltage adjustment, and a small installation footprint [8].
The most common method used today to carry electrical power over distances of hundreds of kilometers from generating units to utilities for distribution is the VAC power transmission system [1]. There are numerous drawbacks to using of this established technology for long-distance bulk power transmission. Reactive losses are common because line reactance increases as the line length increases. In addition, skin effects and corona-related losses affect the HVAC system [9]. As a result, it is not easy to maintain the stability and availability of HVAC when some lines or production units are taken down [10]. These drawbacks could be avoided by connecting remote generators to load centers using an HVDC system [11,12,13,14,15].
Indonesia’s SUMBAGUT 150 kV transmission of High Voltage Alternating Current Network (HVAC) system has considerable power losses and voltage profile problems. These power losses and the voltage profile are critical problems in the transmission network system, as shown in previous research [16,17,18,19]. The HVAC/HVDC hybrid transmission system could reduce losses on the transmission side, especially in transmission systems that initially use an HVAC transmission system. Several studies have implemented HVAC/HVDC hybrid transmission systems, such as “Comparative Evaluation of the HVDC and HVAC Links Integrated into a Large Offshore Wind Farm (An Actual Case Study in Taiwan)”. This study concluded that the HVDC transmission system does not interfere with the ability of the HVAC transmission system to obtain maximum performance using the two transmission systems [20]. The study “New Adaptive Controller in a Two Area HVAC/HVDC Power System” concluded that the use of a new controller can improve the HVAC/HVDC hybrid transmission system [21]. The study “Analytical Modeling Of HVDC-HVAC Systems” concluded that the HVDC/HVAC system is reliable [22]. The paper “Comparative study of HVAC and HVDC transmission systems” concluded that the HVDC transmission system involves less power loss than the HVAC system with a difference of 1.4529% at a transmission distance of 100 km and a difference of 11.905% at a transmission distance of 1000 km [23]. The study “A life-cycle cost analysis of High Voltage Direct Current utilization for solar energy systems: The case study in Turkey” used real case study results to suggest that investment in HVDC is more profitable and feasible than the use of HVAC alternatives for solar energy transmission. [24]. The study “DC voltage droop control structures and its impact on the interaction modes in interconnected AC-HVDC systems” concluded that the selection of the droop control structure and its tuning affect the coupling level between the GSCs, the connected AC grids, and the DC grid [25]. The Study “VSC-HVDC for Frequency Support (a review)” concluded that there is a requirement for frequency response systems that can simulate inertia, sometimes known as synthetic inertia, which calls for quick-acting control devices. VSC- HVDC is a desirable interface option for the power levels and controllability needed to produce synthetic inertia [26]. The study “Optimal Power Flow in Multi-Terminal HVDC Systems” uses a multi-objective function in its OPF analysis to reduce both generation costs and losses in the lines and converters, which improves the system’s economic efficiency [27]. The study “Adaptive Droop Control of Multi-Terminal HVDC Network for Frequency Regulation and Power Sharing” concluded that reduced generation costs, frequency deviation costs, and converter losses are the main objectives of the optimization control [28]. The Study “Influence of VSC-HVDC Reactive Power Support on Hybrid Dual-infeed HVDC System” concluded that the hybrid dual-infeed HDIDC system’s dynamic reactive power and control technique are highly co-dependent, which significantly affects the transient stability of the receiving power grid [29]. Further, considering the above:
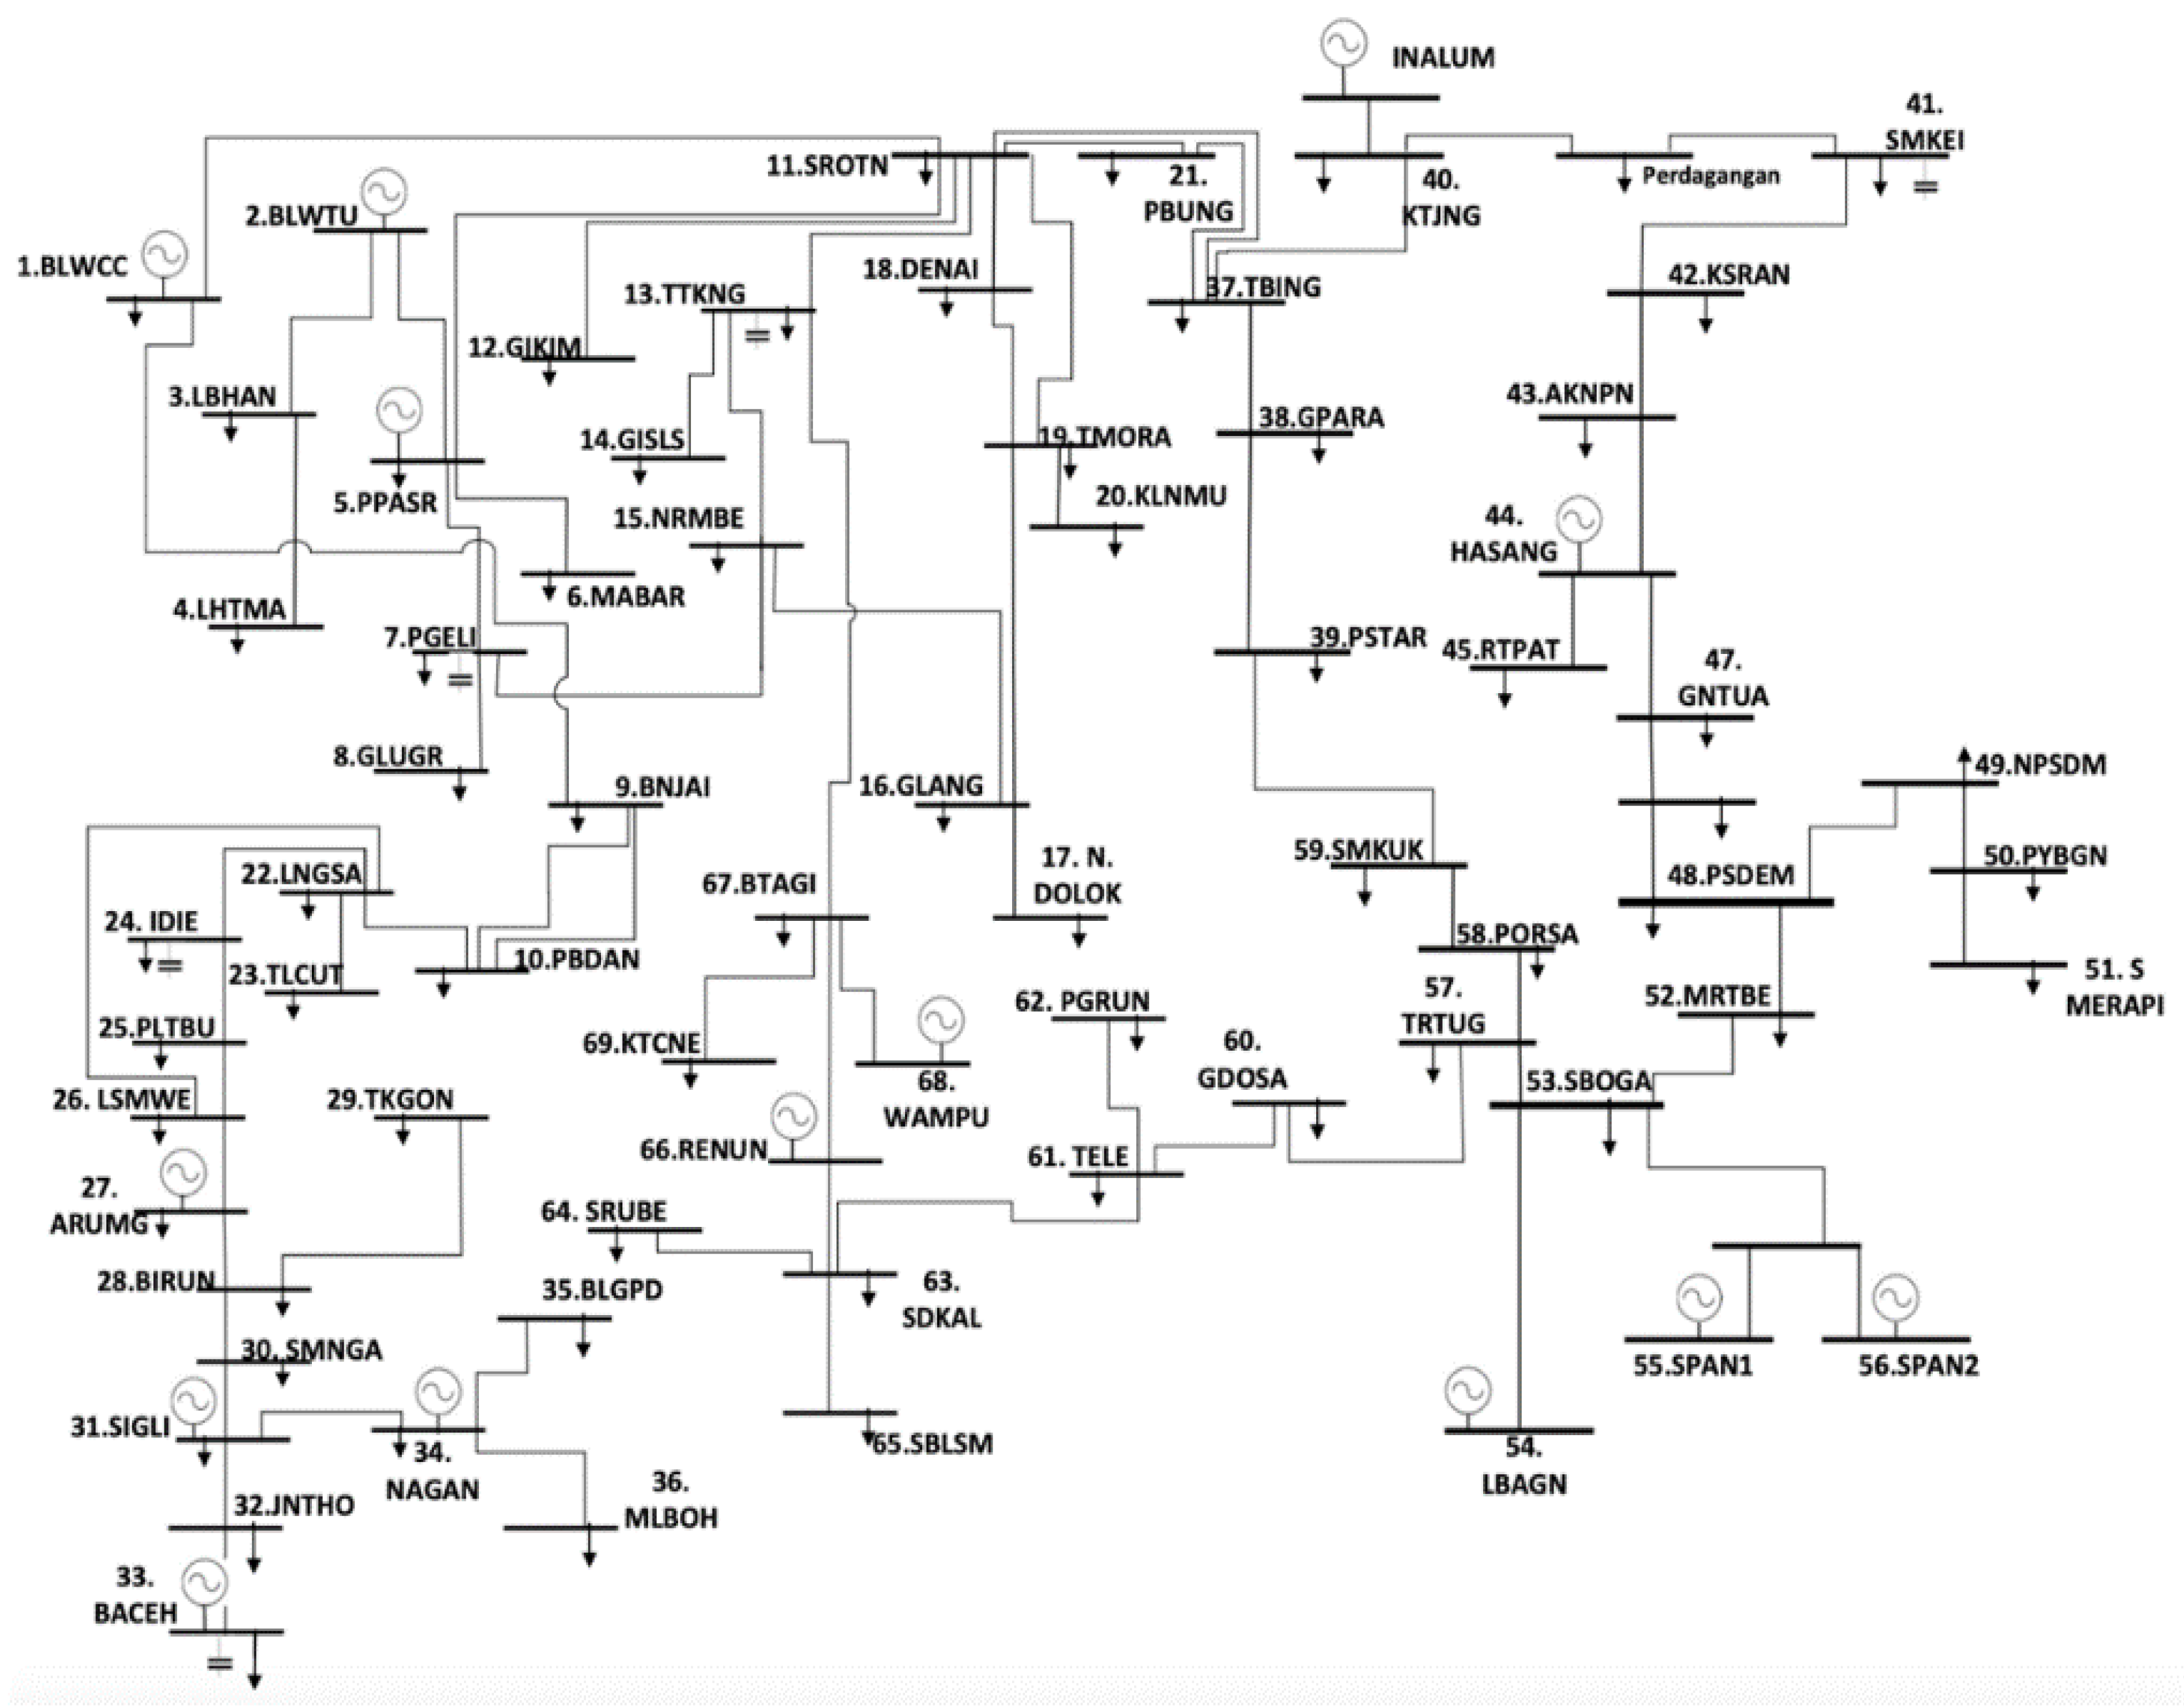
  • The authors constructed models and simulations that changed several types of bus lines (HVAC) to buses (HVDC) in the SUMBAGUT 150 kV so that the transmission system became a hybrid. Some transmissions used the HVDC system, and some used the HVAC system using particle swarm optimization algorithms to get optimal locations. A comparative analysis between the simulation results of HVDC Transmission and Hybrid transmission (HVAC/HVDC) with PSO algorithms is a novel aspect of the current research.
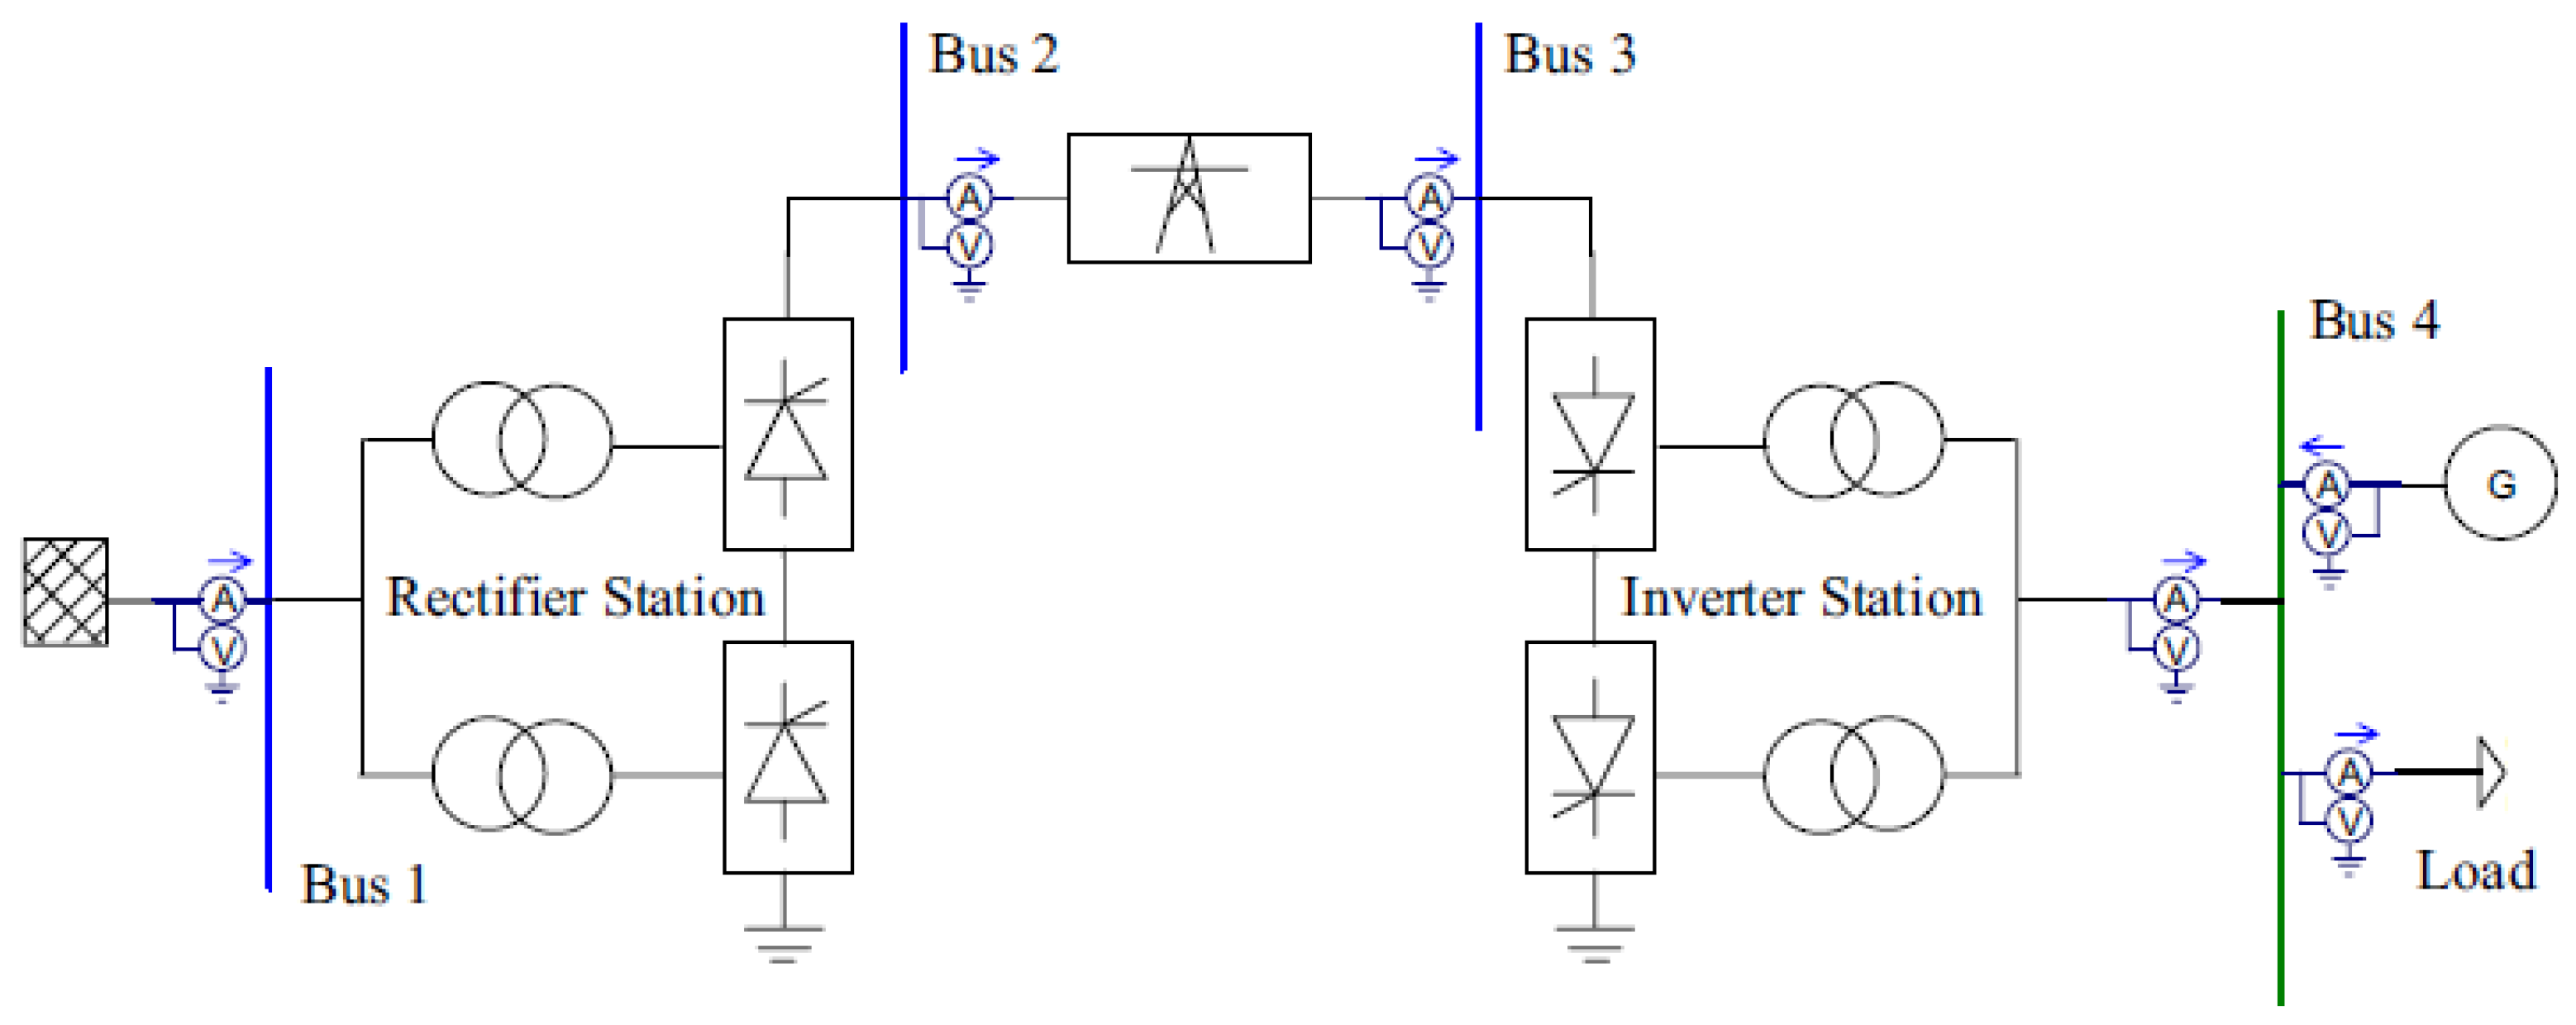
  • The authors use a monopolar metallic current return HVDC configuration in the transmission system.
  • This study aims to determine which transmission methods can feasibly be replaced with HVDC transmission systems to produce a transmission system with the least possible losses.
  • The power flow analysis method is analyzed in multiple bus systems using the Newton–Raphson method because it produces better calculations for large power systems.

2. Materials and Methods

2.1. Materials

A single-line diagram of SUMBAGUT 150 kV is shown in Figure 1. In the simulation of the 150 kV SUMBAGUT power system, a total of 72 buses were used, of which 1 bus was a slack bus, 14 buses were generator buses (PV), and 57 buses were load buses (PQ). This system has a bus voltage rating of 150 kV and base power of 100 MVA [17]. The classification of the types of buses used for the simulation can be seen in Table 1. From these data, the authors conducted a load flow simulation study of the transmission network to determine the transmission system’s power losses and voltage drops. For the load flow simulation, data from the SUMBAGUT transmission system were entered into the ETAP software with version 16.0.0C, and licence number is 4359168. Then, a simulation program was run under normal conditions before changing the transmission system to a hybrid HVAC/HVDC. Then, the researchers designed and ran the PSO algorithm program for MATLAB software with version 9.7.0.1190202 (R2019b), and license number is 123456.

2.2. Methods

The results obtained from the PSO program were the recommended transmission locations for changing the transmission system. After determining the recommended transmission line locations, a load flow simulation program was run with ETAP to determine the losses and voltages after implementing of an HVAC/HVDC hybrid transmission system. After that, the researchers compared the losses in the transmission system before and after changing the transmission system into a hybrid HVAC/HVDC.
In an alternating current (AC) system, it is easy to increase and decrease the voltage using a transformer [30]. Direct current distribution systems have advantages over alternating current systems, including simpler isolation, high efficiency, and no stability problems. An illustration of the HVDC transmission network can be seen in Figure 2 [31,32].
The converter transformer rating on the HVDC transmission system is determined using Equations (1) and (2).
S transformer   rectifier = 2   ×   I n   ×   V in   rectifier
S transformer   inverter = 2   ×   I n   ×   V in   inverter
In these equations, the following variables were used: S transformer   rectifier , S transformer   inverter , the total power of the transformer rectifier/inverter (MVA); I n , the input current (Amp); and V in   rectifier , V in   inverter , voltage transformer in the rectifier/inverter.
The electrical systems of generating and load centers are generally separated by hundreds or thousands of kilometers, so the electricity generated must be transmitted through transmission line wires. Electricity distribution involves several problems, which include power losses, or losses. Power losses occur due to several factors, namely corona factors, insulator leakage, distance, and other factors. Power loss can be recognized if the voltages at the sender (generating) and the receiver’s base are different, as shown in Equations (3)–(5) [33,34].
Vr = 3   ×   ρ   ×   L   ×   I   ×   Cos   phi   A
P Loses = I 2   ×   R
% P L = P L 1 P L 2 P L 1 · 100 %
In these equations, the following variables were used: Vr, the Voltage Drop (V); ρ, the specific resistance (Ωm); L, the length of the conducting cable (m); A, the cross-sectional area; Vin inverter, the voltage transformer; P, the power loss (kW); I, the current on the load side; R, the resistance of the conductor; %PL, the efficiency value of the power losses (%); PL1, the value of the initial power losses (MW); and PL2, the value of the final power losses (MW).
Moreover, constant Current Control (CCC) is a technology used by the rectifier control system. The inverter side serves as the reference for the current limit to ensure the converter’s protection in scenarios where the inverter side cannot sustain enough DC voltage (due to a defect) or cannot handle enough load (load rejection). The DC voltage at the inverter side determines the reference current utilized for rectifier control. Before being compared to produce the error signal, the DC on the rectifier side was measured using the appropriate transducers and put through the requisite filters. Afterward, a PI controller processed the error signal to generate the required firing angle order. The firing circuit uses these data to produce the equidistant value. Meanwhile, Extinction angle control and current control were implemented on the inverter side. Here, PI controllers were used to implementing the CCC with the Voltage Dependent Current Order Limiter (VDCOL). The reference limit for the current control was determined by comparing the external reference (chosen by the operator or load need) and the VDCOL (implemented through a lookup table) output. The required angle order was then generated by subtracting the measured current from the reference limit and sending the resulting error signal to the PI controller. The control generated a gamma angle order for the inverter using a different PI controller. The firing moment was determined by comparing the two angle orders and taking the lesser of the two [35].
The “voltage difference” applied to the HVDC lines’ two ends and the “line resistance” control how much power or current they can carry. Due to the constrained flexibility of the power flow regulation of the line, it is possible that under specific operating conditions, some power lines may be overloaded while other lines remain underutilized. Another major issue that needs to be addressed is the potential for higher power losses in the complicated HVDC systems of the future. Power flow management devices that redistribute direct currents inside the HVDC grid could resolve these potential problems and transmission bottlenecks [36,37].
Besides, computational intelligence is a solution that can solve problems that are difficult to solve analytically. Computational intelligent research is research that is used in the field of optimization techniques based on the intelligent calculations of a structured step. Algorithms incorporated in intelligent computing include Genetic Algorithm (GA) [38], Ant Colony Optimization (ACO) [39], Artificial Bee Colony Optimization (ABCO) [40], and Particle Swarm Optimization (PSO) [41]. The computational particle swarm optimization type is more popular in solving optimization problems. Swarm intelligence derives its research area inspiration from herds of animals or insects. Particle Swarm Optimization (PSO) is a population-based stochastic search and an alternative solution for complex non-linear optimization problems. It is based on the natural process of communicating with a group of birds or insects looking for food or migrating in search of space, even though not all birds or insects know the best position. However, from the nature of social behavior, if one member can find the desired path, the other members will follow immediately. The advantage of the PSO method is that the speed of solving an optimization problem is faster [42,43]. In the application of the transmission system, the particle is considered a bus or transmission. The proposed PSO’s optimization procedure is illustrated below.
  • Determine the size of the swarm and determine the initial value of the position and velocity of the particle randomly.
  • Evaluate the value of the objective function for each particle.
  • Determine the first Gbest and Pbest.
  • Calculate the speed in the next iteration with Equation (6).
V j ( i ) = θ v j ( i 1 ) + c 1 r 1 [ P best j X j ( i 1 ) ]   +   c 2 r 2 [ G best   j X j ( i 1 ) ]
  • In these equations, the following variables are used: I Iteration; j 1,2,3,…n; r 1   and   r 2 random number; and c 1   and   c 2 acceleration coefficient.
  • Determine the position of the particle in the next iteration using the following Equation (7).
    X j ( i ) = X j ( i 1 ) + V j ( i )
  • Evaluate the value of the objective function in the next iteration.
  • Update the Pbest and Gbest
In the application of the transmission system, the particle is considered a bus or channel. Meanwhile, the objective/objective function is used to reduce losses, as shown in Equation (8).
f c ( x , y ) = i = 1 n Loss i  
To maintain the search for the Gbest and Pbest, and obtain the minimum value of the objective function, it is necessary to find the value of the inertia weight. The value of θ is 0.4 to 0.9; the values of c 1 and c 2 are 0 to 4; c 1 + c 2     4 . Then, the values of r 1 and r 2 are in the interval 0 and 1. To speed up convergence, an inertia weight that decreases with increasing iterations is used with Equation (9).
θ 1 = θ max ( θ max θ min i max ) i
In these equations, the following variables are used: i max , the maximum iteration; i , the current iteration; θ min , the initial value of the inertial weight; and θ max , the final value of the inertial weight.

3. Results

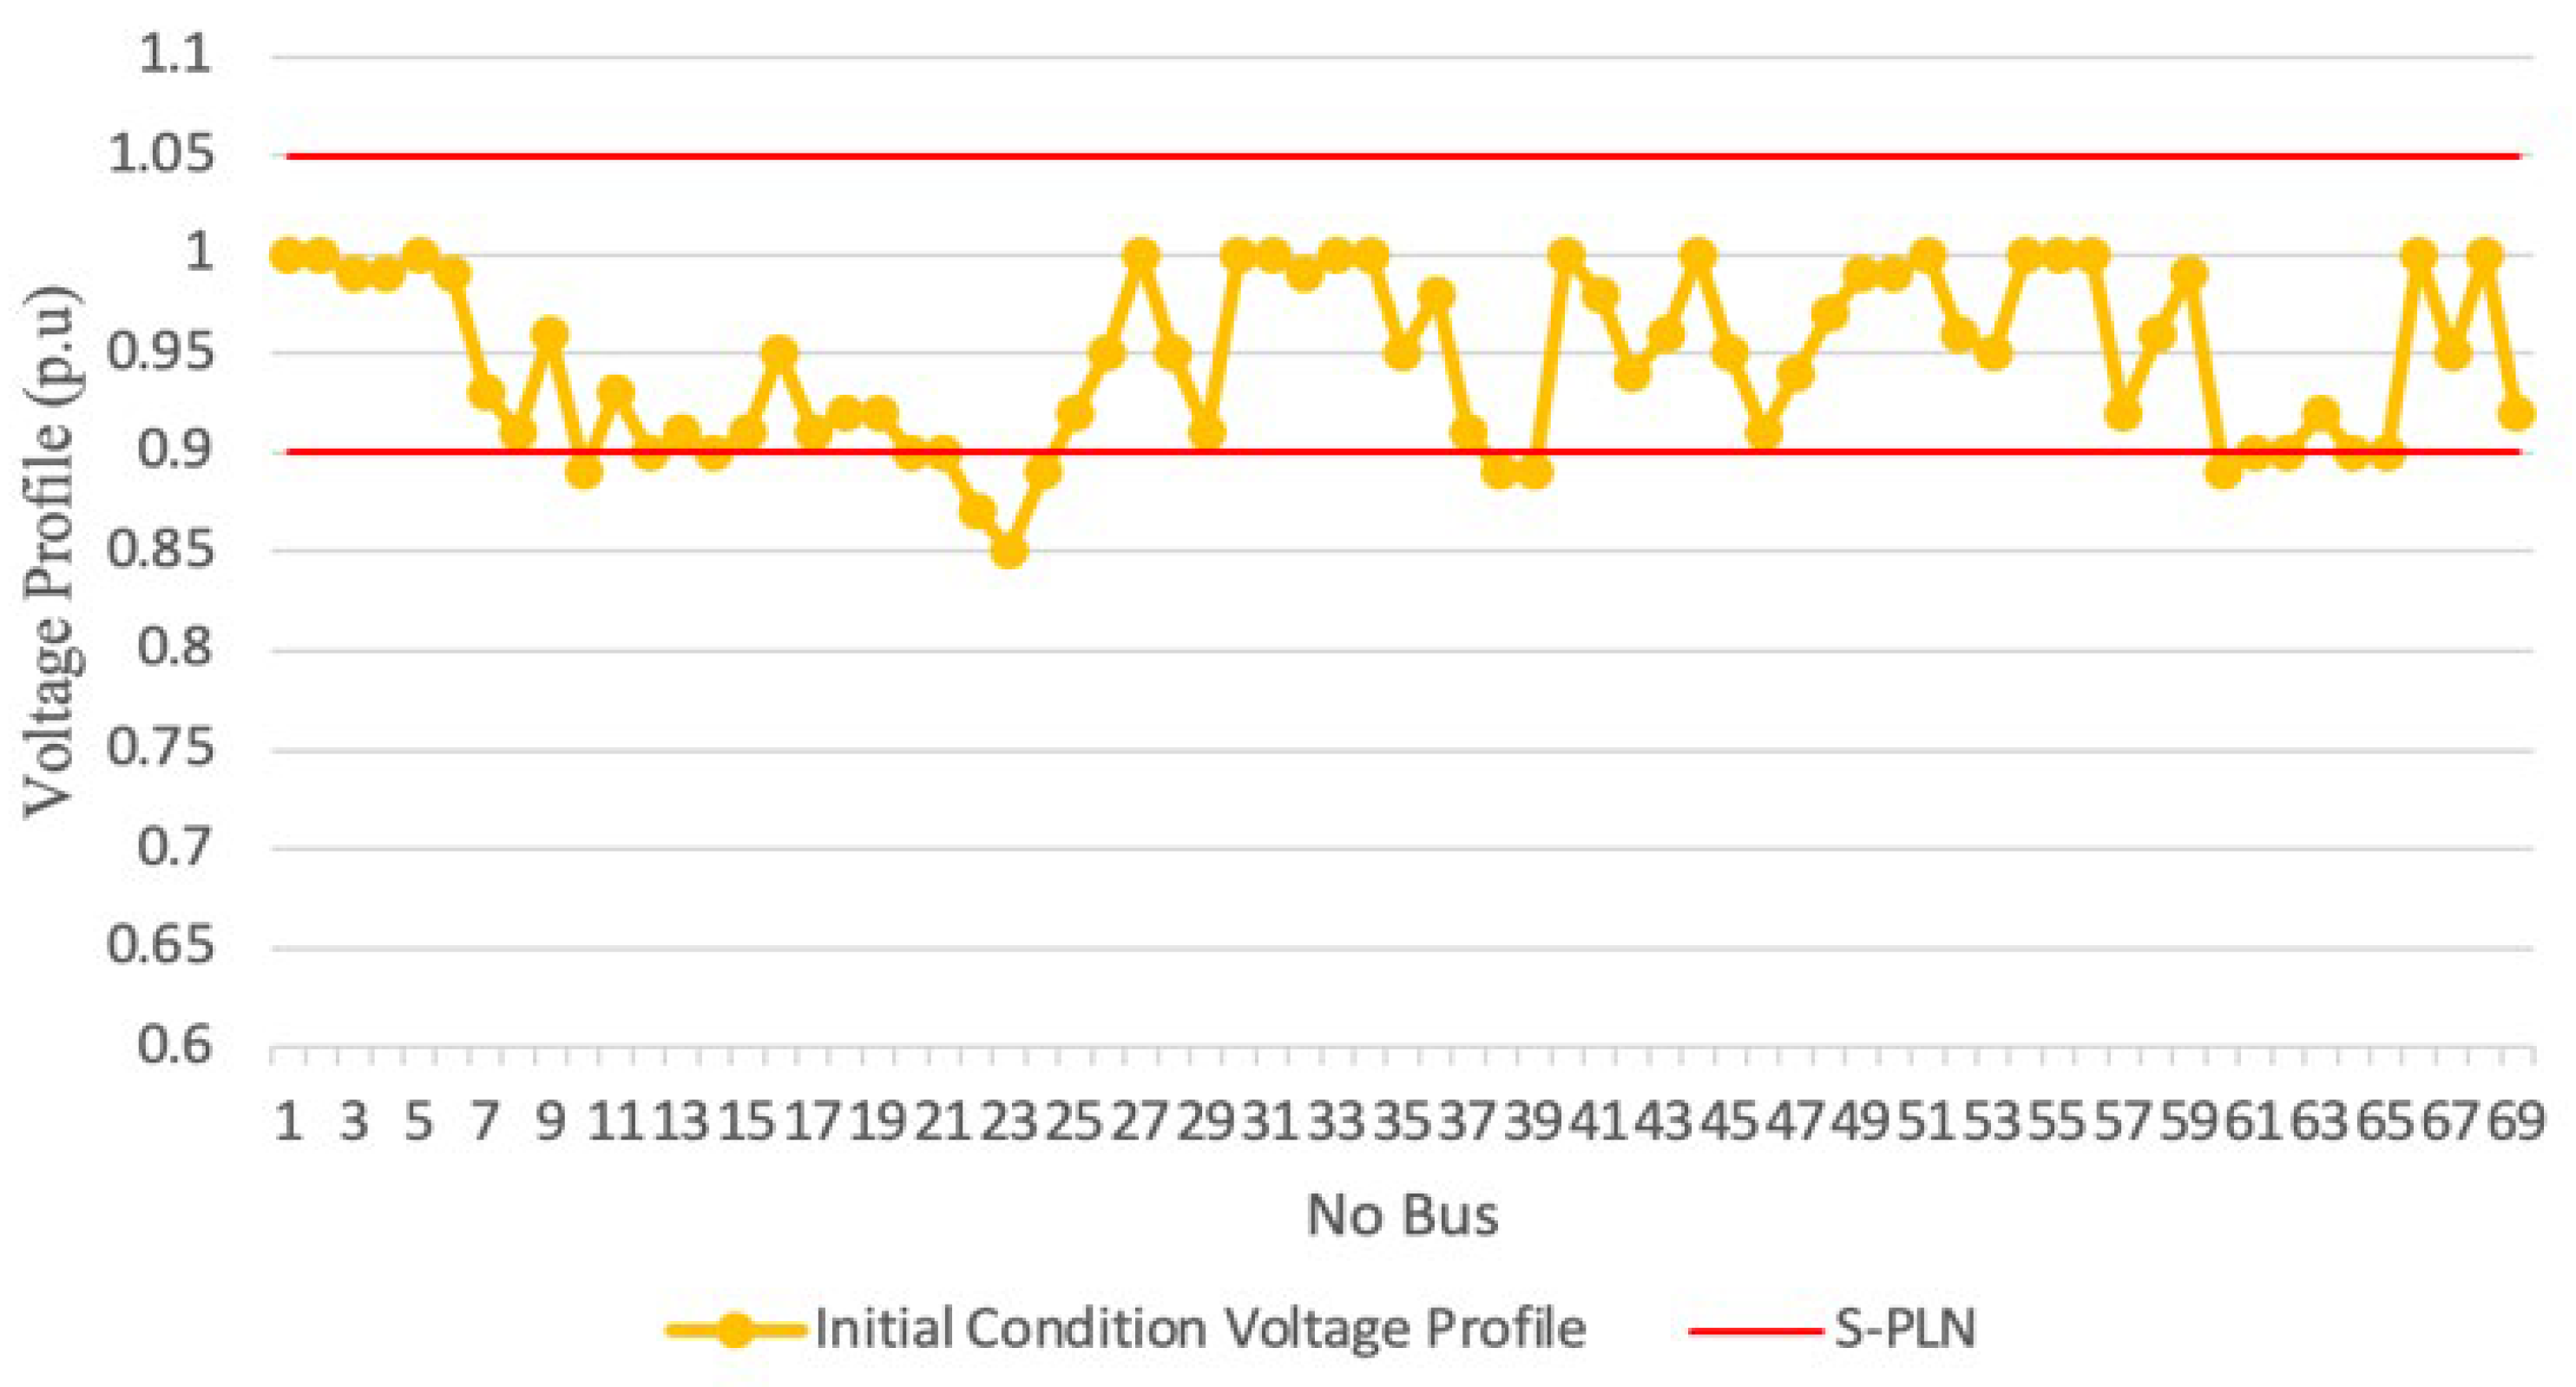
3.1. Transmission System Power Flow SUMBAGUT 150 kV (HVAC)

The value of power losses in the SUMBAGUT 150 kV transmission system without changing the HVAC/HVDC hybrid transmission system was 68.41 MW. Eight voltage profiles were outside the SPLN standard (0.9–1.05 pu). These were in buses 11, 23, 24, 25, 38, 39, and 40, as shown in Figure 3. The results indicate that a method is needed to reduce losses and improve the voltage profile. Many methods have been developed to overcome these problems, and one of the solutions is to change the transmission from HVAC to HVDC.

3.2. Determination and Placement of HVDC Transmission Locations

After analyzing the power flow and running the Particle Swarm Optimization (PSO) program, we determined the three best transmission locations to convert HVAC transmission into hybrid HVAC/HVDC. These transmission locations were the 150 kV Paya Pasir (Bus 5)–Paya Geli (Bus 7) transmission line (21 km), the 150 kV Paya Pasir (bus 5)–Sei Rotan (Bus 11) transmission line (24 km), and the 150 kV Renun (Bus 66)–Sidikalang (Bus 63) transmission line (25 km), which had transmission losses of 5462 kW, 5348 kW, and 5098 kW, respectively. The data above show that the Paya Geli (Bus 7) bus has a total load of 114.84 MVA, the Sei Rotan (Bus 11) bus has a total load of 50.69 MVA, and the Sidikalang (Bus 63) bus has a total load of 49.39 MVA. Here, the HVAC/HVDC hybrid system plays an important role as it is a better power conductor than HVAC.
Previously, to determine the power of the rectifier-inverter transformer, we used Equations (1) and (2). To calculate the rectifier-inverter transformer rating on the 150 kV Paya Pasir (Bus 5)–Paya Geli (Bus 7) line, we used the following calculation:
S transformer   rectifier = 2   ×   In   × V in   rectifier
S transformer   rectifier = 2   ×   0.85   ×   150 = 179.77   MVA
S transformer   inverter = 2   ×   In   × V in   inverter
S transformer   inverter = 2   ×   0.85   ×   150 = 179.77   MVA
The rectifier-inverter transformer rating on the 150 kV Paya Pasir (Bus 5)–Paya Geli (Bus 7) line was found to be 179.77 MVA, as shown in Figure 4.
The calculation of the rectifier-inverter transformer rating on the 150 kV Paya Pasir (Bus 5)–Sei Rotan (Bus 11) line was performed as follows:
S   transformer   rectifier = 2   ×   In   ×   V sec   R ec
S   transformer   rectifier = 2   ×   0.96   ×   150 = 203.4   MVA
S   transformer   inverter = 2   ×   In   ×   V sec   In v
S   transformer   inverter = 2   ×   0.96   ×   150 = 203.4   MVA
The rating of the rectifier-inverter transformer on the 150 kV Paya Pasir (Bus 5)–Sei Rotan (Bus 11) line was calculated as 203.4 MVA, as shown in Figure 5.
The calculation of the rectifier-inverter transformer rating on the 150 kV Paya Pasir (Bus 5)-Sidikalang (Bus 63) line was performed as follows:
S   transformer   rectifier = 2   ×   In   ×   V sec   R ec
S   transformer   rectifier = 2   ×   0.63   ×   150   =   133.64   MVA
S   transformer   inverter = 2   ×   In   ×   V sec   In v
S   transformer   inverter = 2   ×   0.63   ×   150   =   133.64   MVA
The rating of the rectifier-inverter transformer on the 150 kV Paya Pasir (Bus 5)–Sei Rotan (Bus 11) line was calculated to be 133.64 MVA, as described in Figure 6.
After determining the rectifier-inverter transformer ratings, the transmission line voltage was lowered to 20 kV on the HVDC line through the rectifier and returned to 150 kV again after passing through the inverter.

3.3. Transmission HVDC of the Power Flow SUMBAGUT 150 kV

Three channels were converted to hybrid HVAC/HVDC in the SUMBAGUT transmission system, which produced seven combinations for comparison.

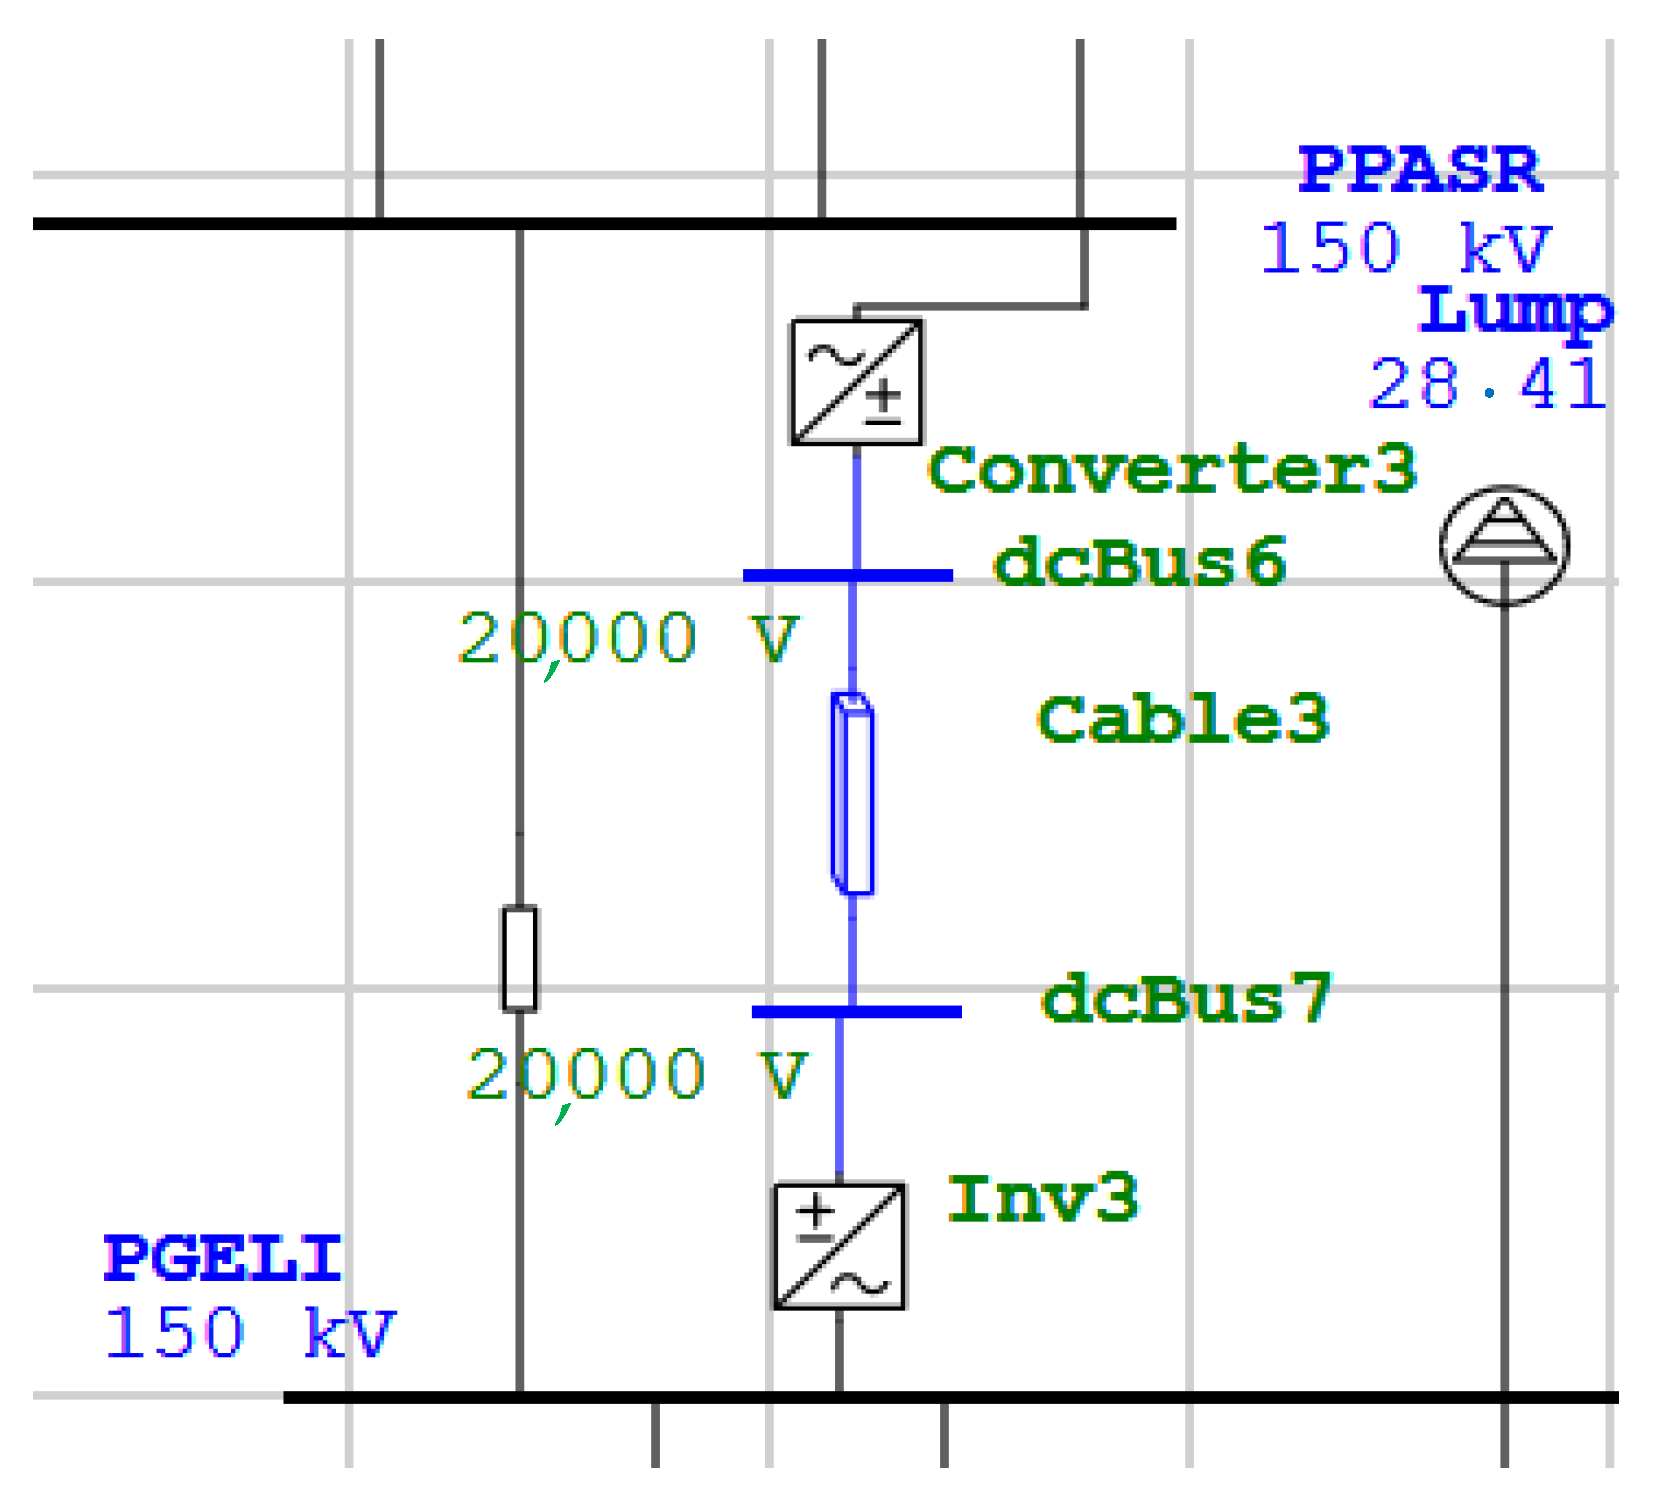
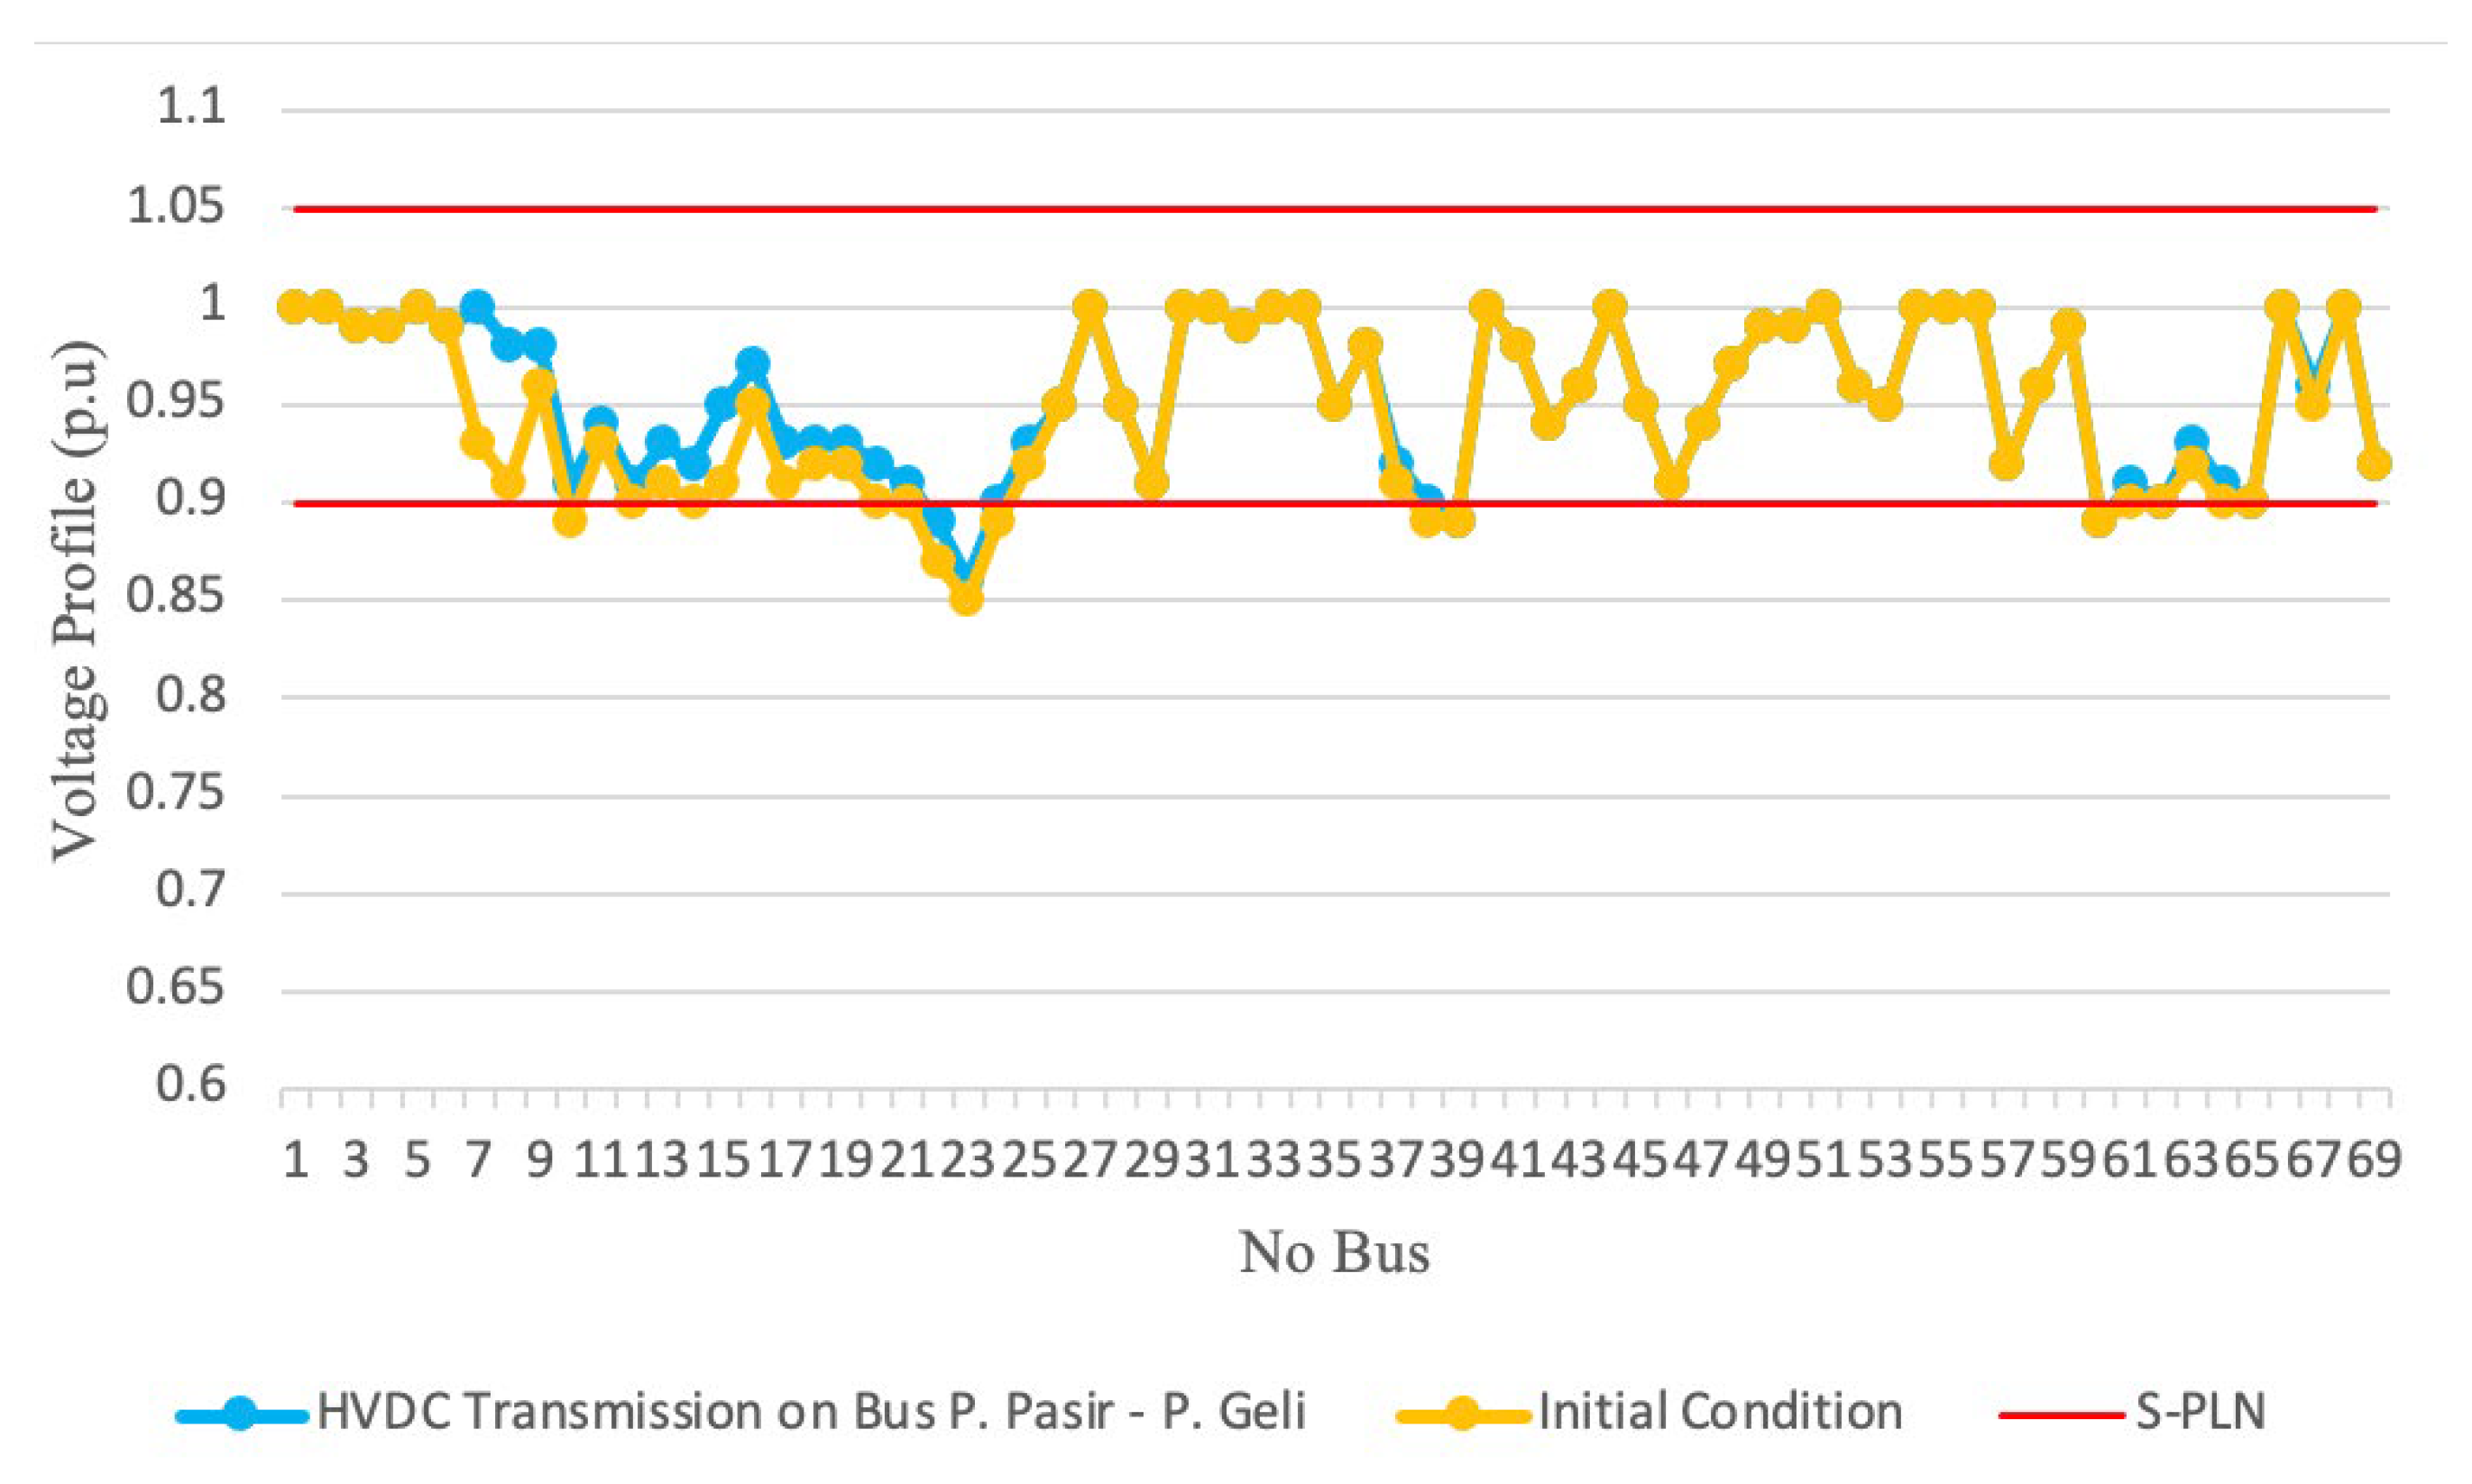
3.3.1. Paya Pasir (Bus 5)–Paya Geli (Bus 7)

The conversion of the 150 kV Paya Pasir (Bus 5)–Paya Geli (Bus 7) line into HVDC transmission led to a SUMBAGUT transmission loss of 57.31 MW. The efficiency of the power losses before and after the conversion was obtained with Equation (5).
% P L = 68.41 57.31 68.41 × 100 % = 16.22 %
The conversion of the 150 kV SUMBAGUT Paya Pasir (Bus 5)–Paya Geli (Bus 7) line led to an overall power loss reduction efficiency of 16.22%. Meanwhile, the results of the voltage profile obtained after changing the Paya Pasir (Bus 5)–Paya Geli (Bus 7) transmission system HVDC show that several buses were not included in the SPLN standard category (0.9–1.05 pu), as seen in Figure 7.

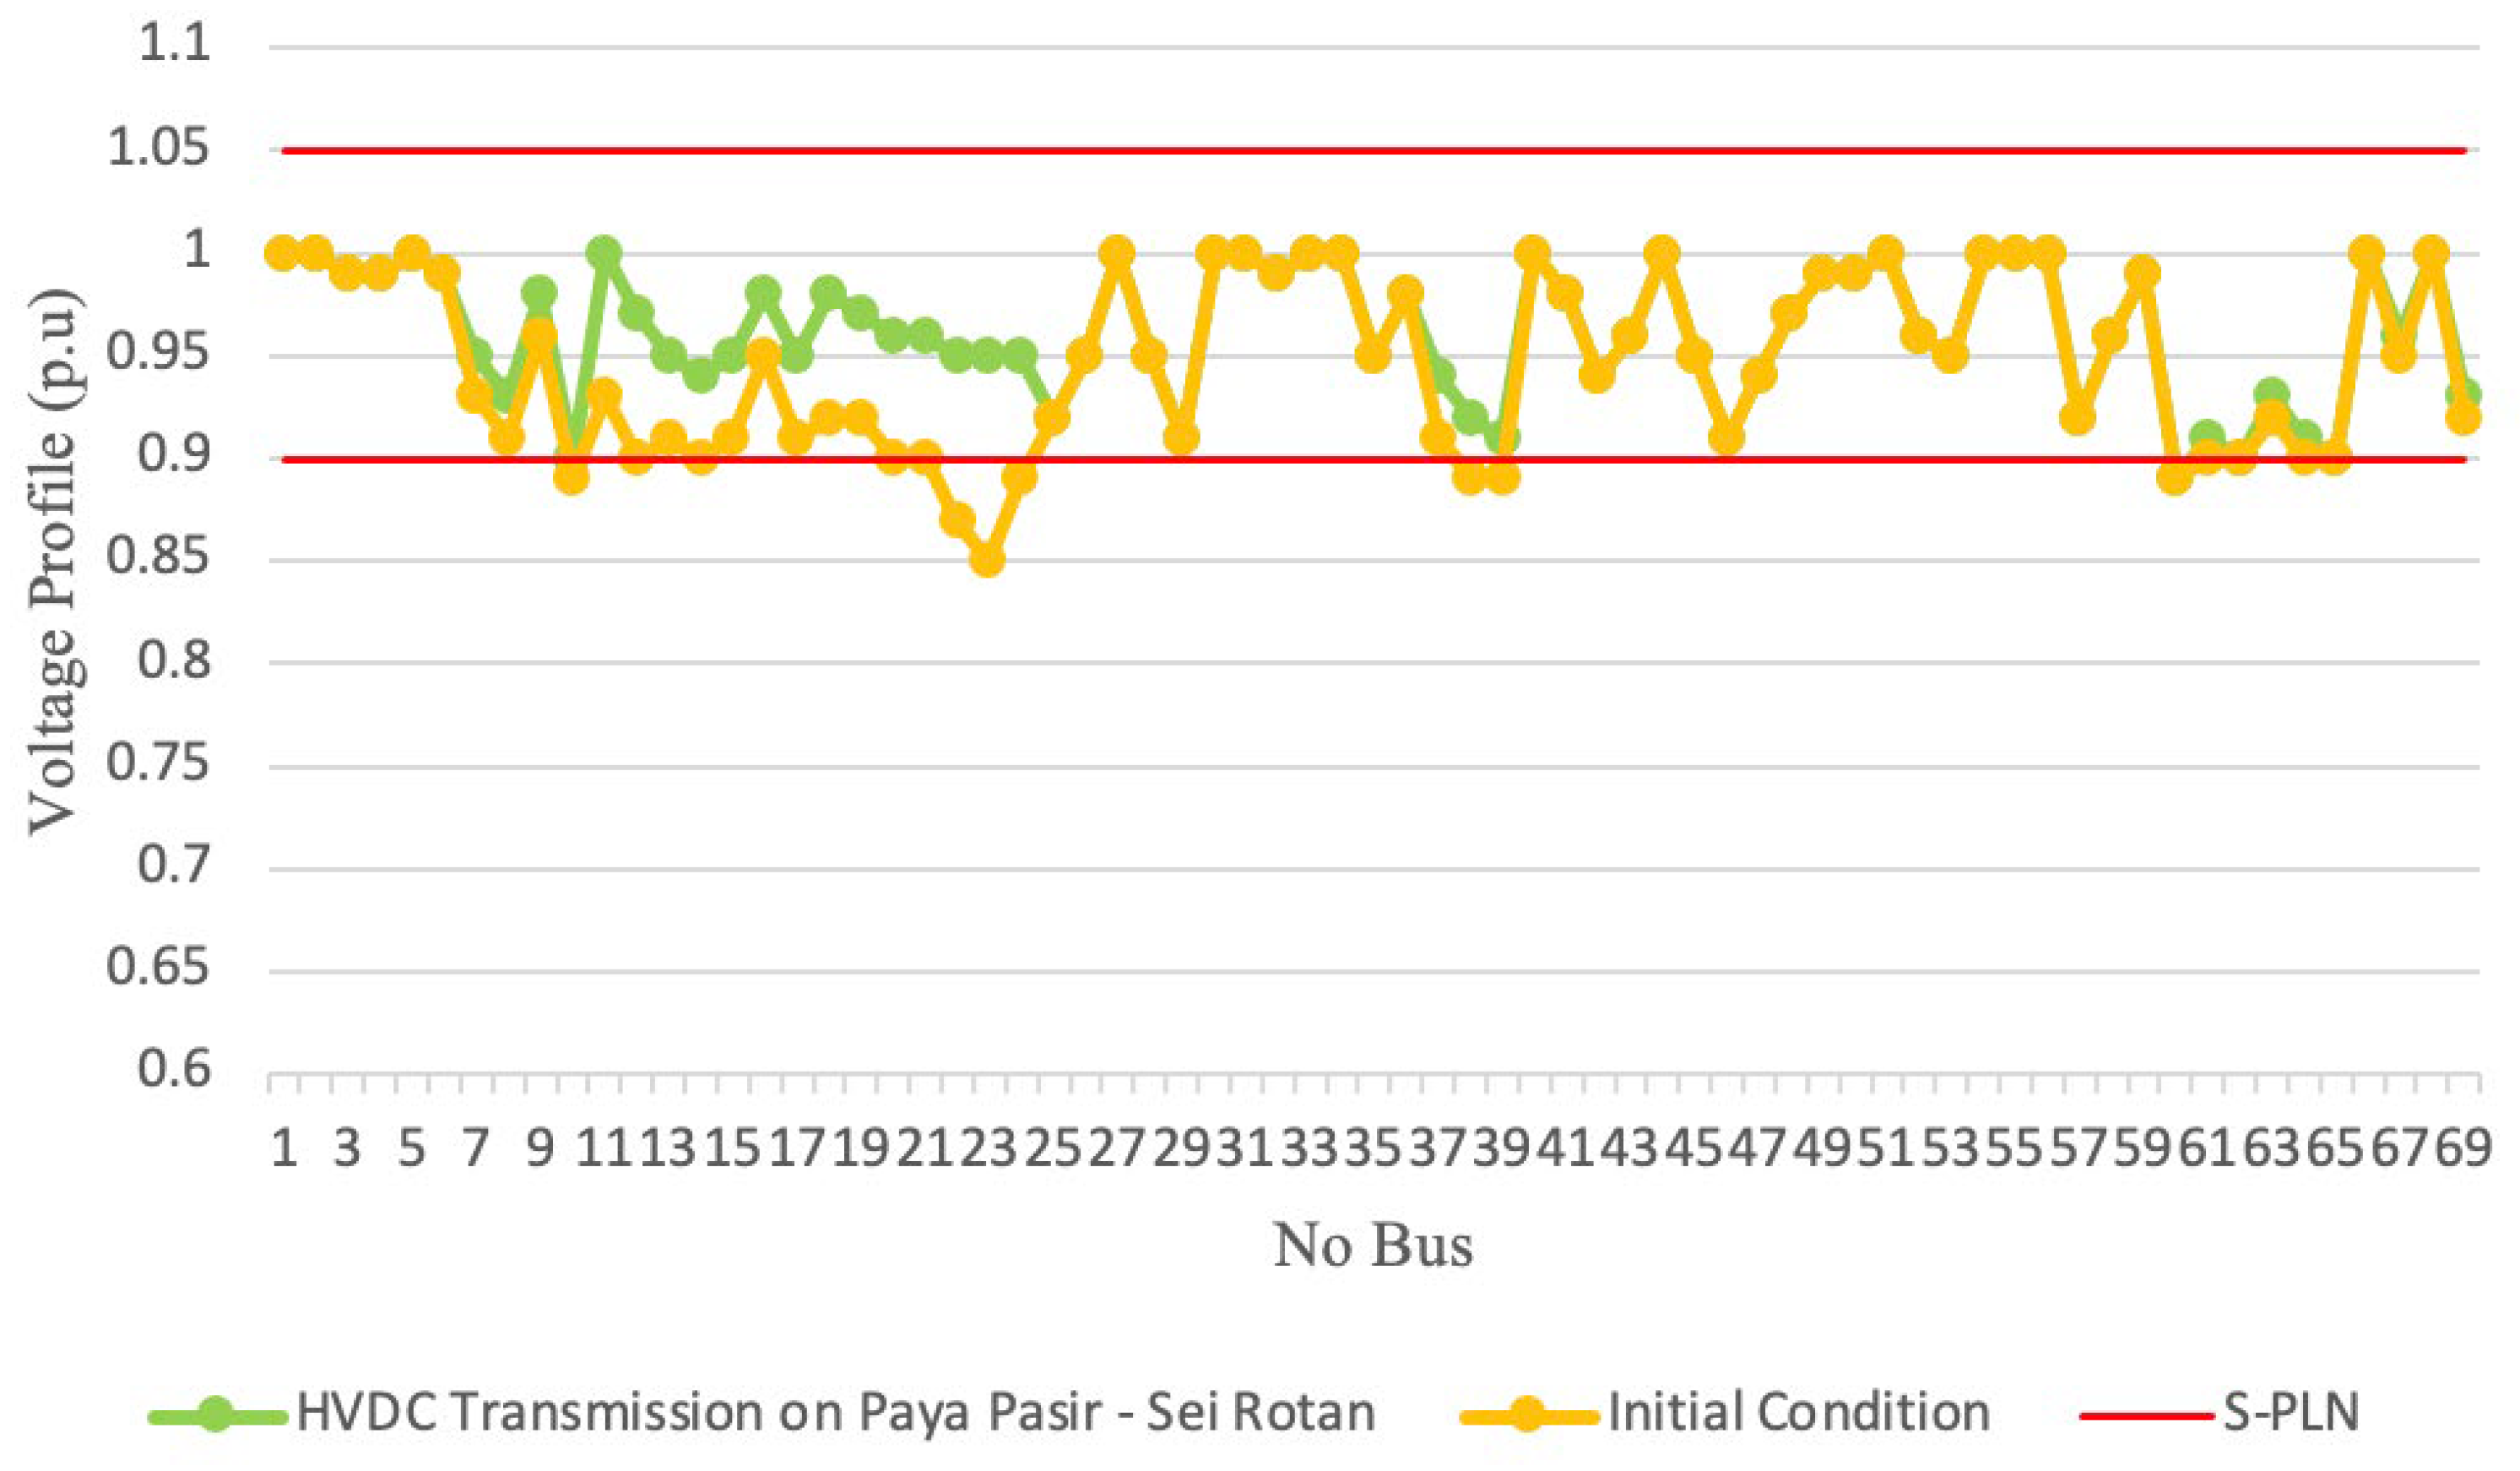
3.3.2. Paya Pasir (Bus 5)–Sei Rotan (Bus 11)

The conversion of the 150 kV Paya Pasir (Bus 5)–Sei Rotan (Bus 11) line into HVDC transmission led to a SUMBAGUT transmission loss of 51.79 MW.
The efficiency of the power losses before and after the conversion was obtained with Equation (5).
% P L = 68.41 57.79 68.41 × 100 % = 24.29 %
Thus, the conversion of the 150 kV SUMBAGUT Paya Pasir (Bus 5)–Sei Rotan (Bus 11) led to an overall power loss reduction efficiency of 24.29%. Meanwhile, the results of the voltage profile after the conversion of the Paya Pasir (bus 5)–Sei Rattan (bus 11) transmission system to HVDC were better than those obtained for the Paya Pasir (Bus 5)–Paya Geli (Bus 7) line, and all values were included in the standard category SPLN (0.9–1.05 pu), as shown in Figure 8.

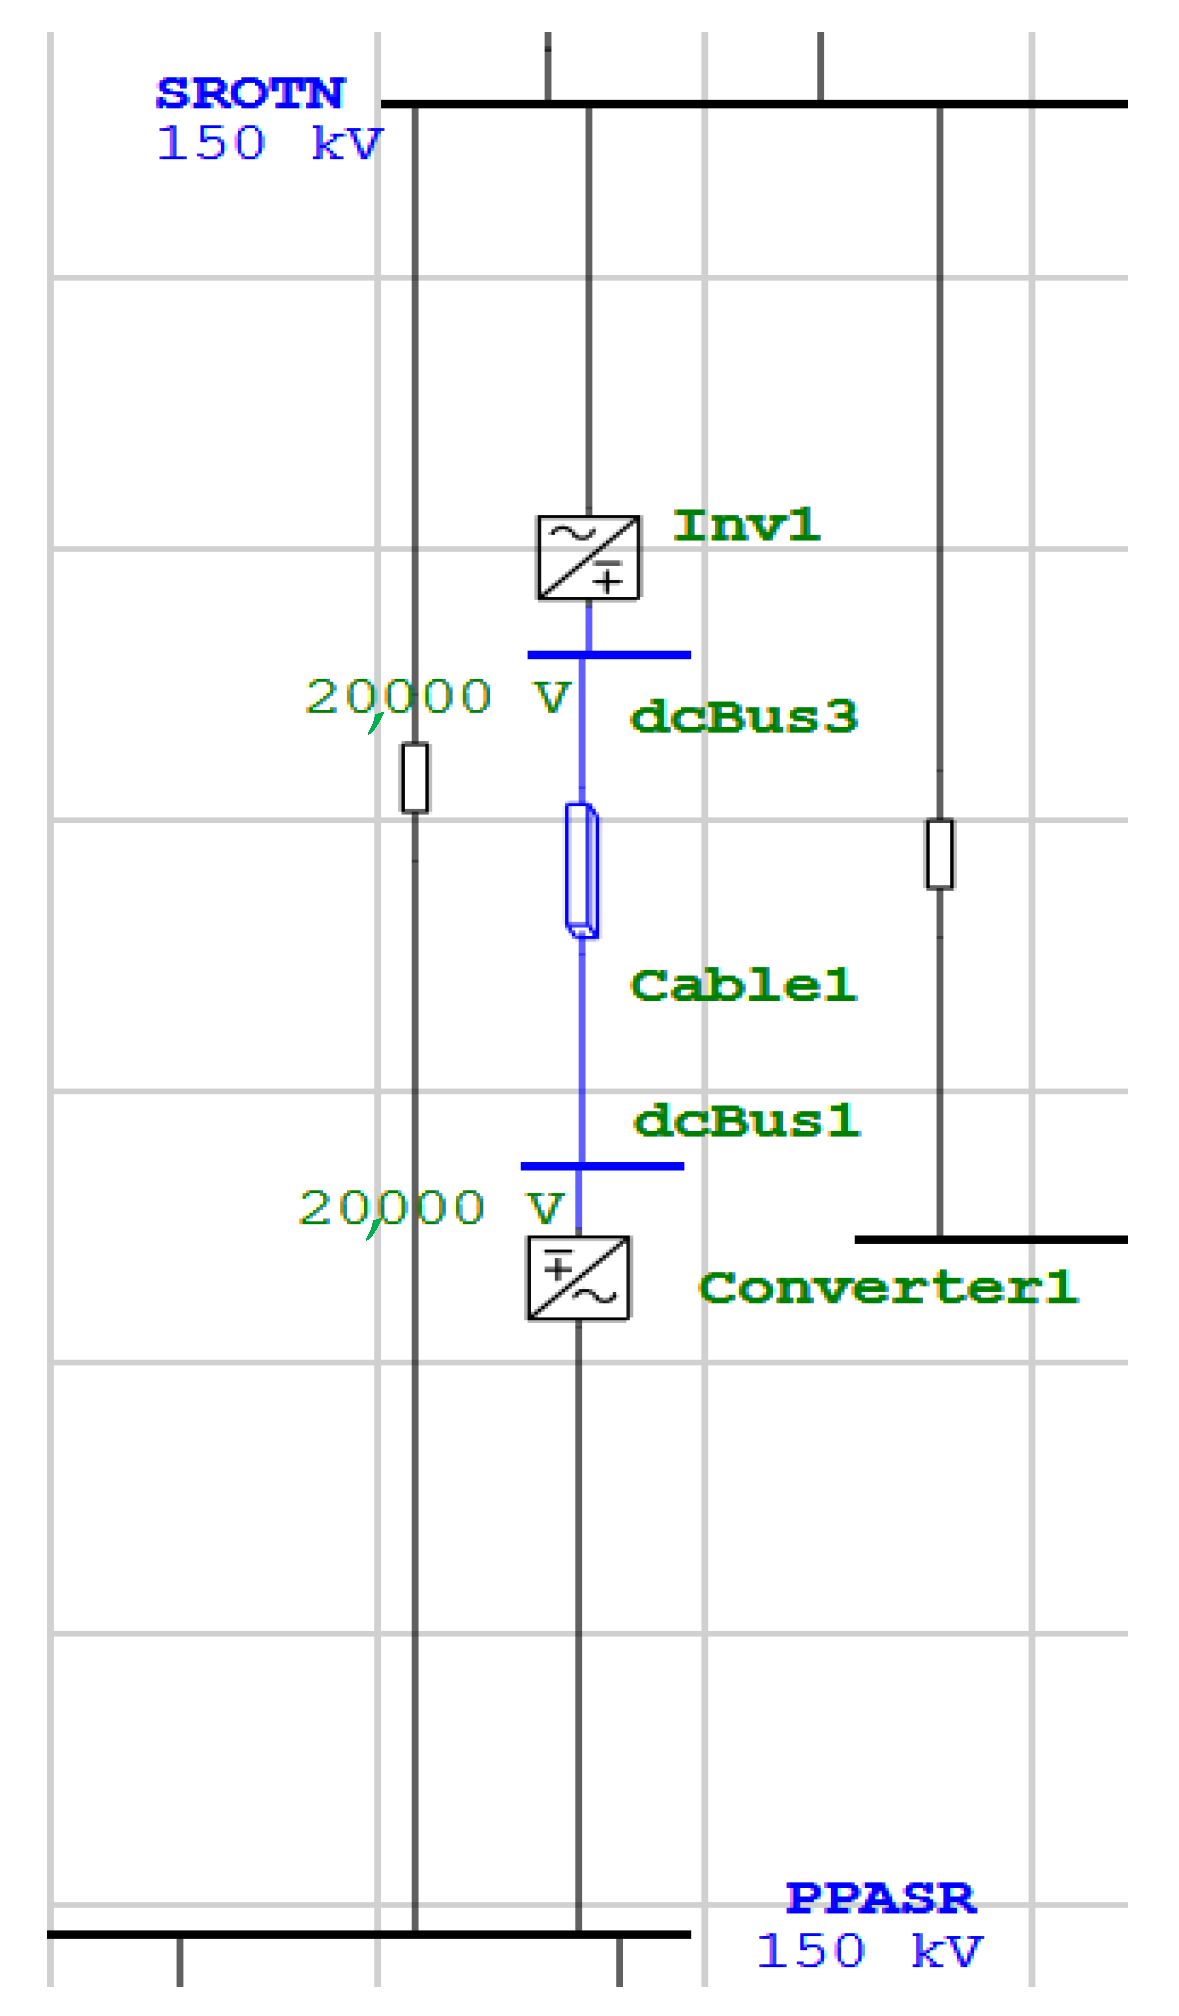
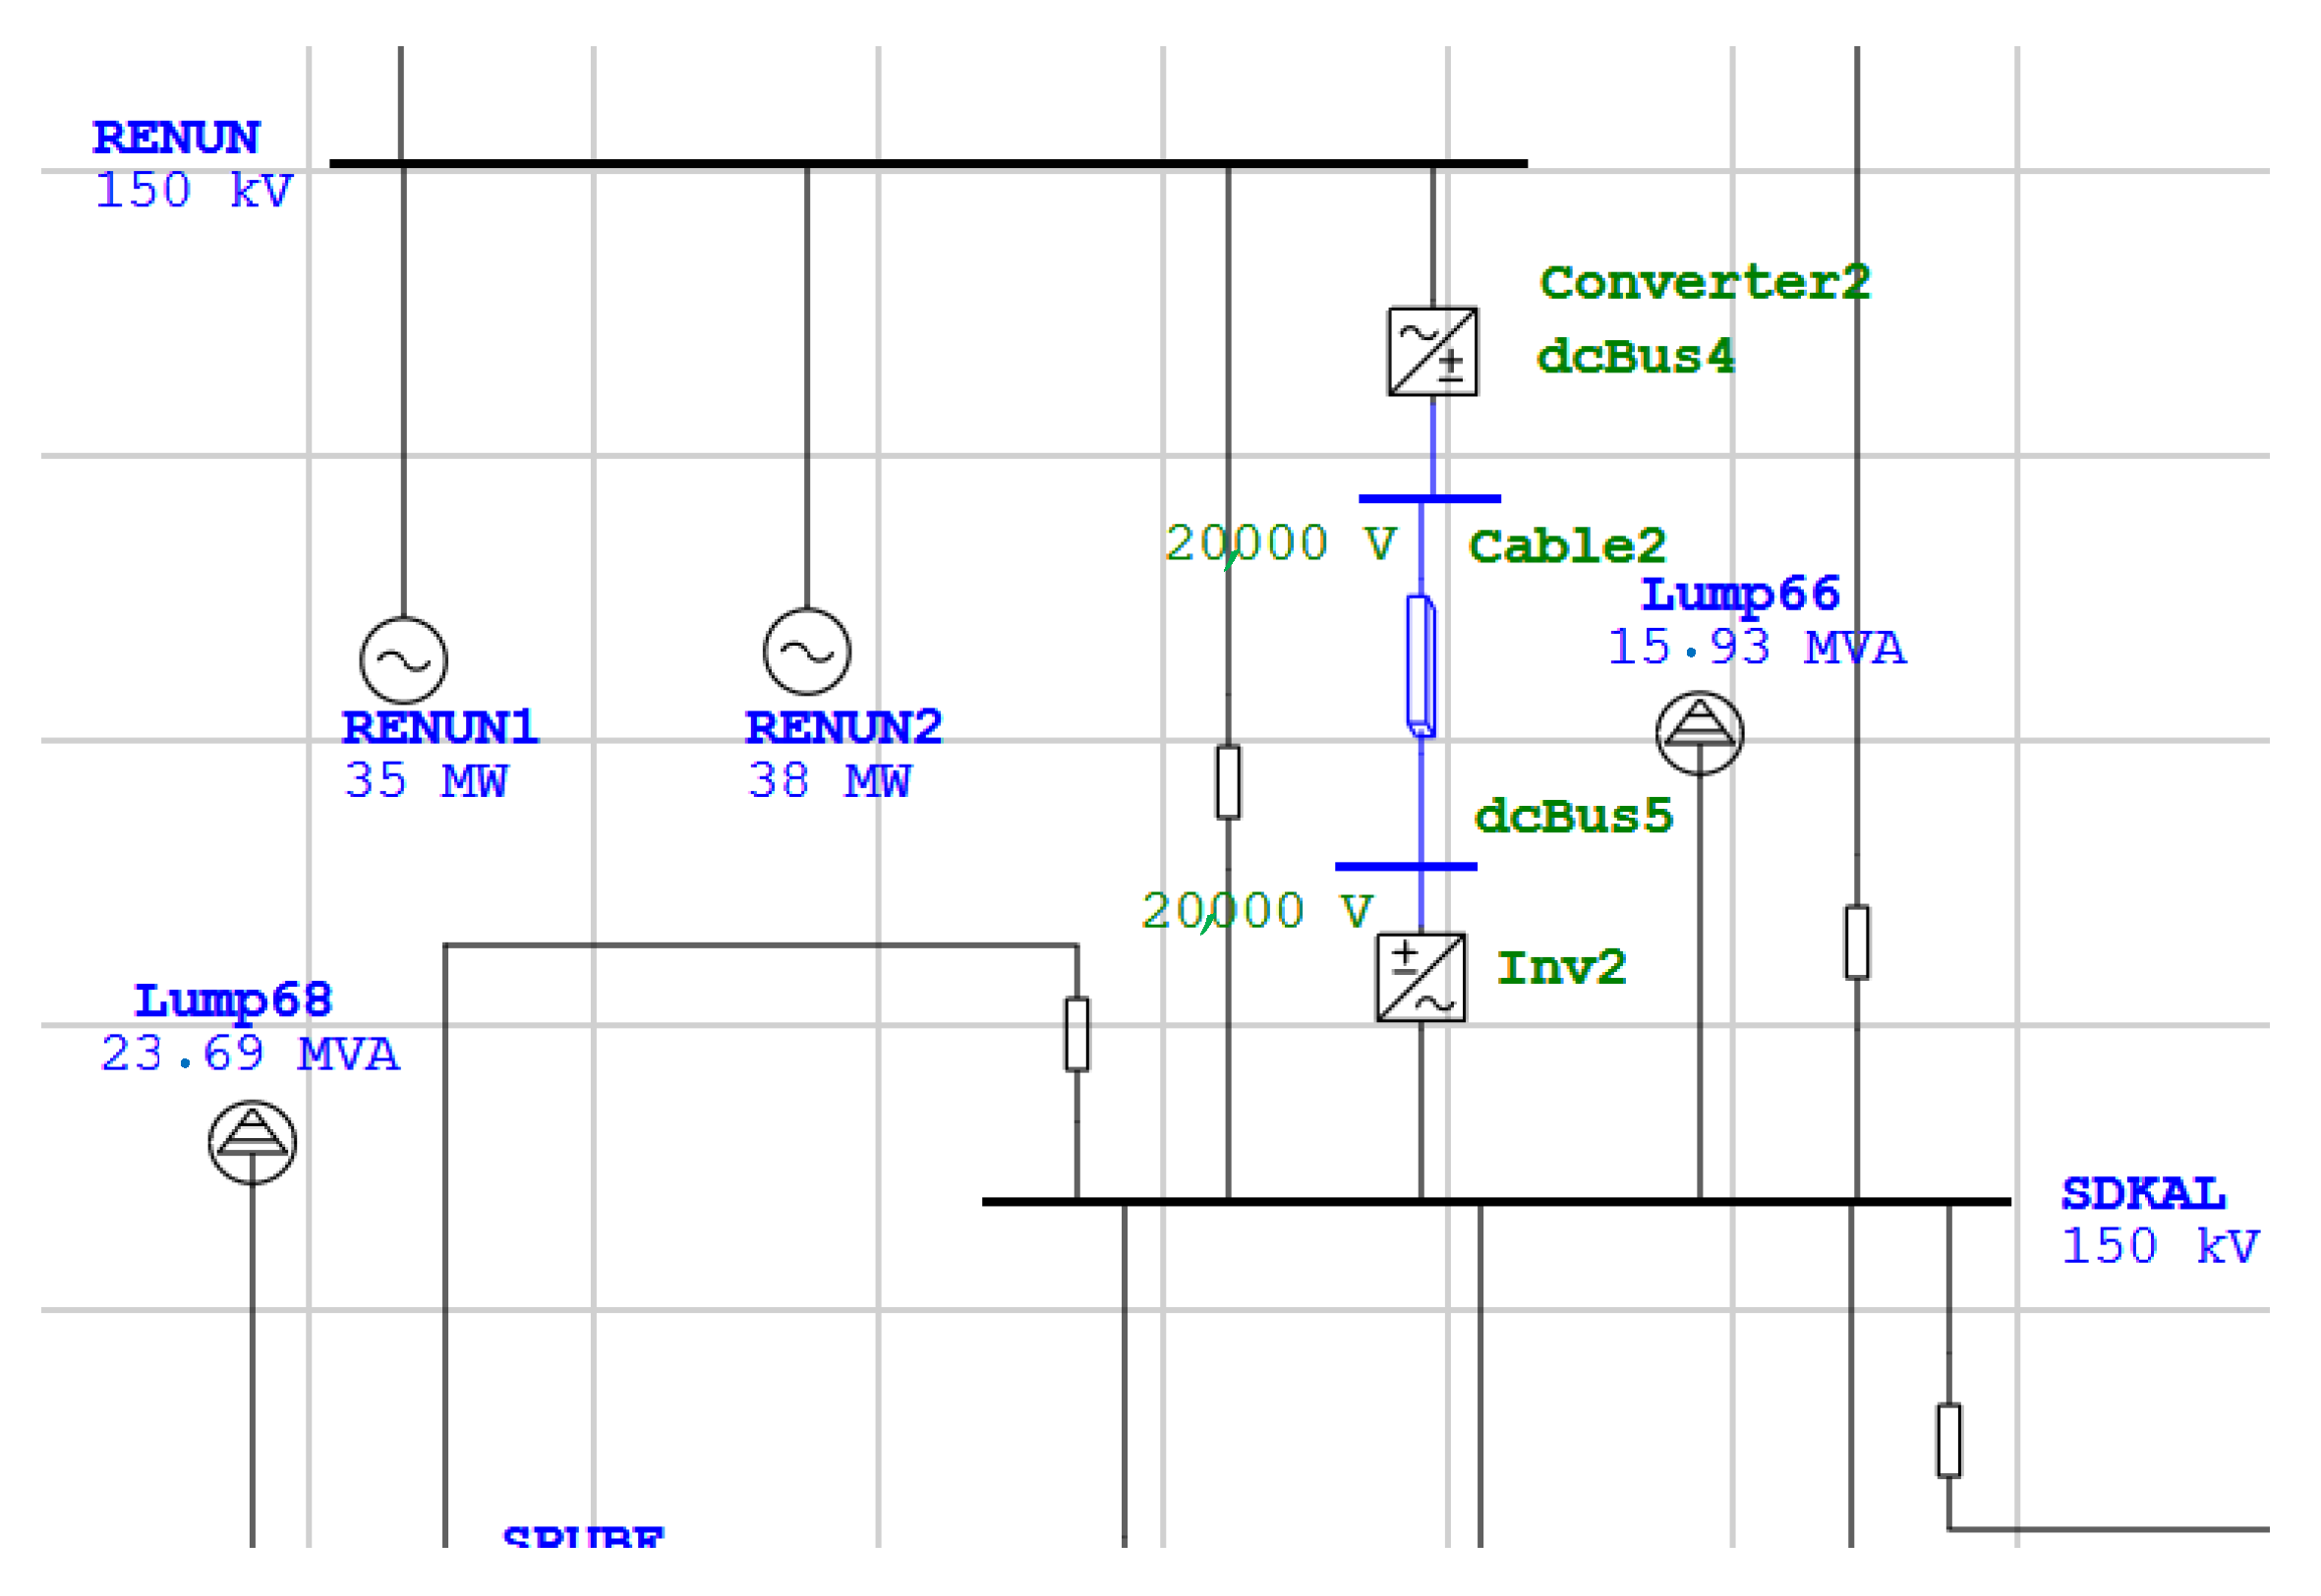
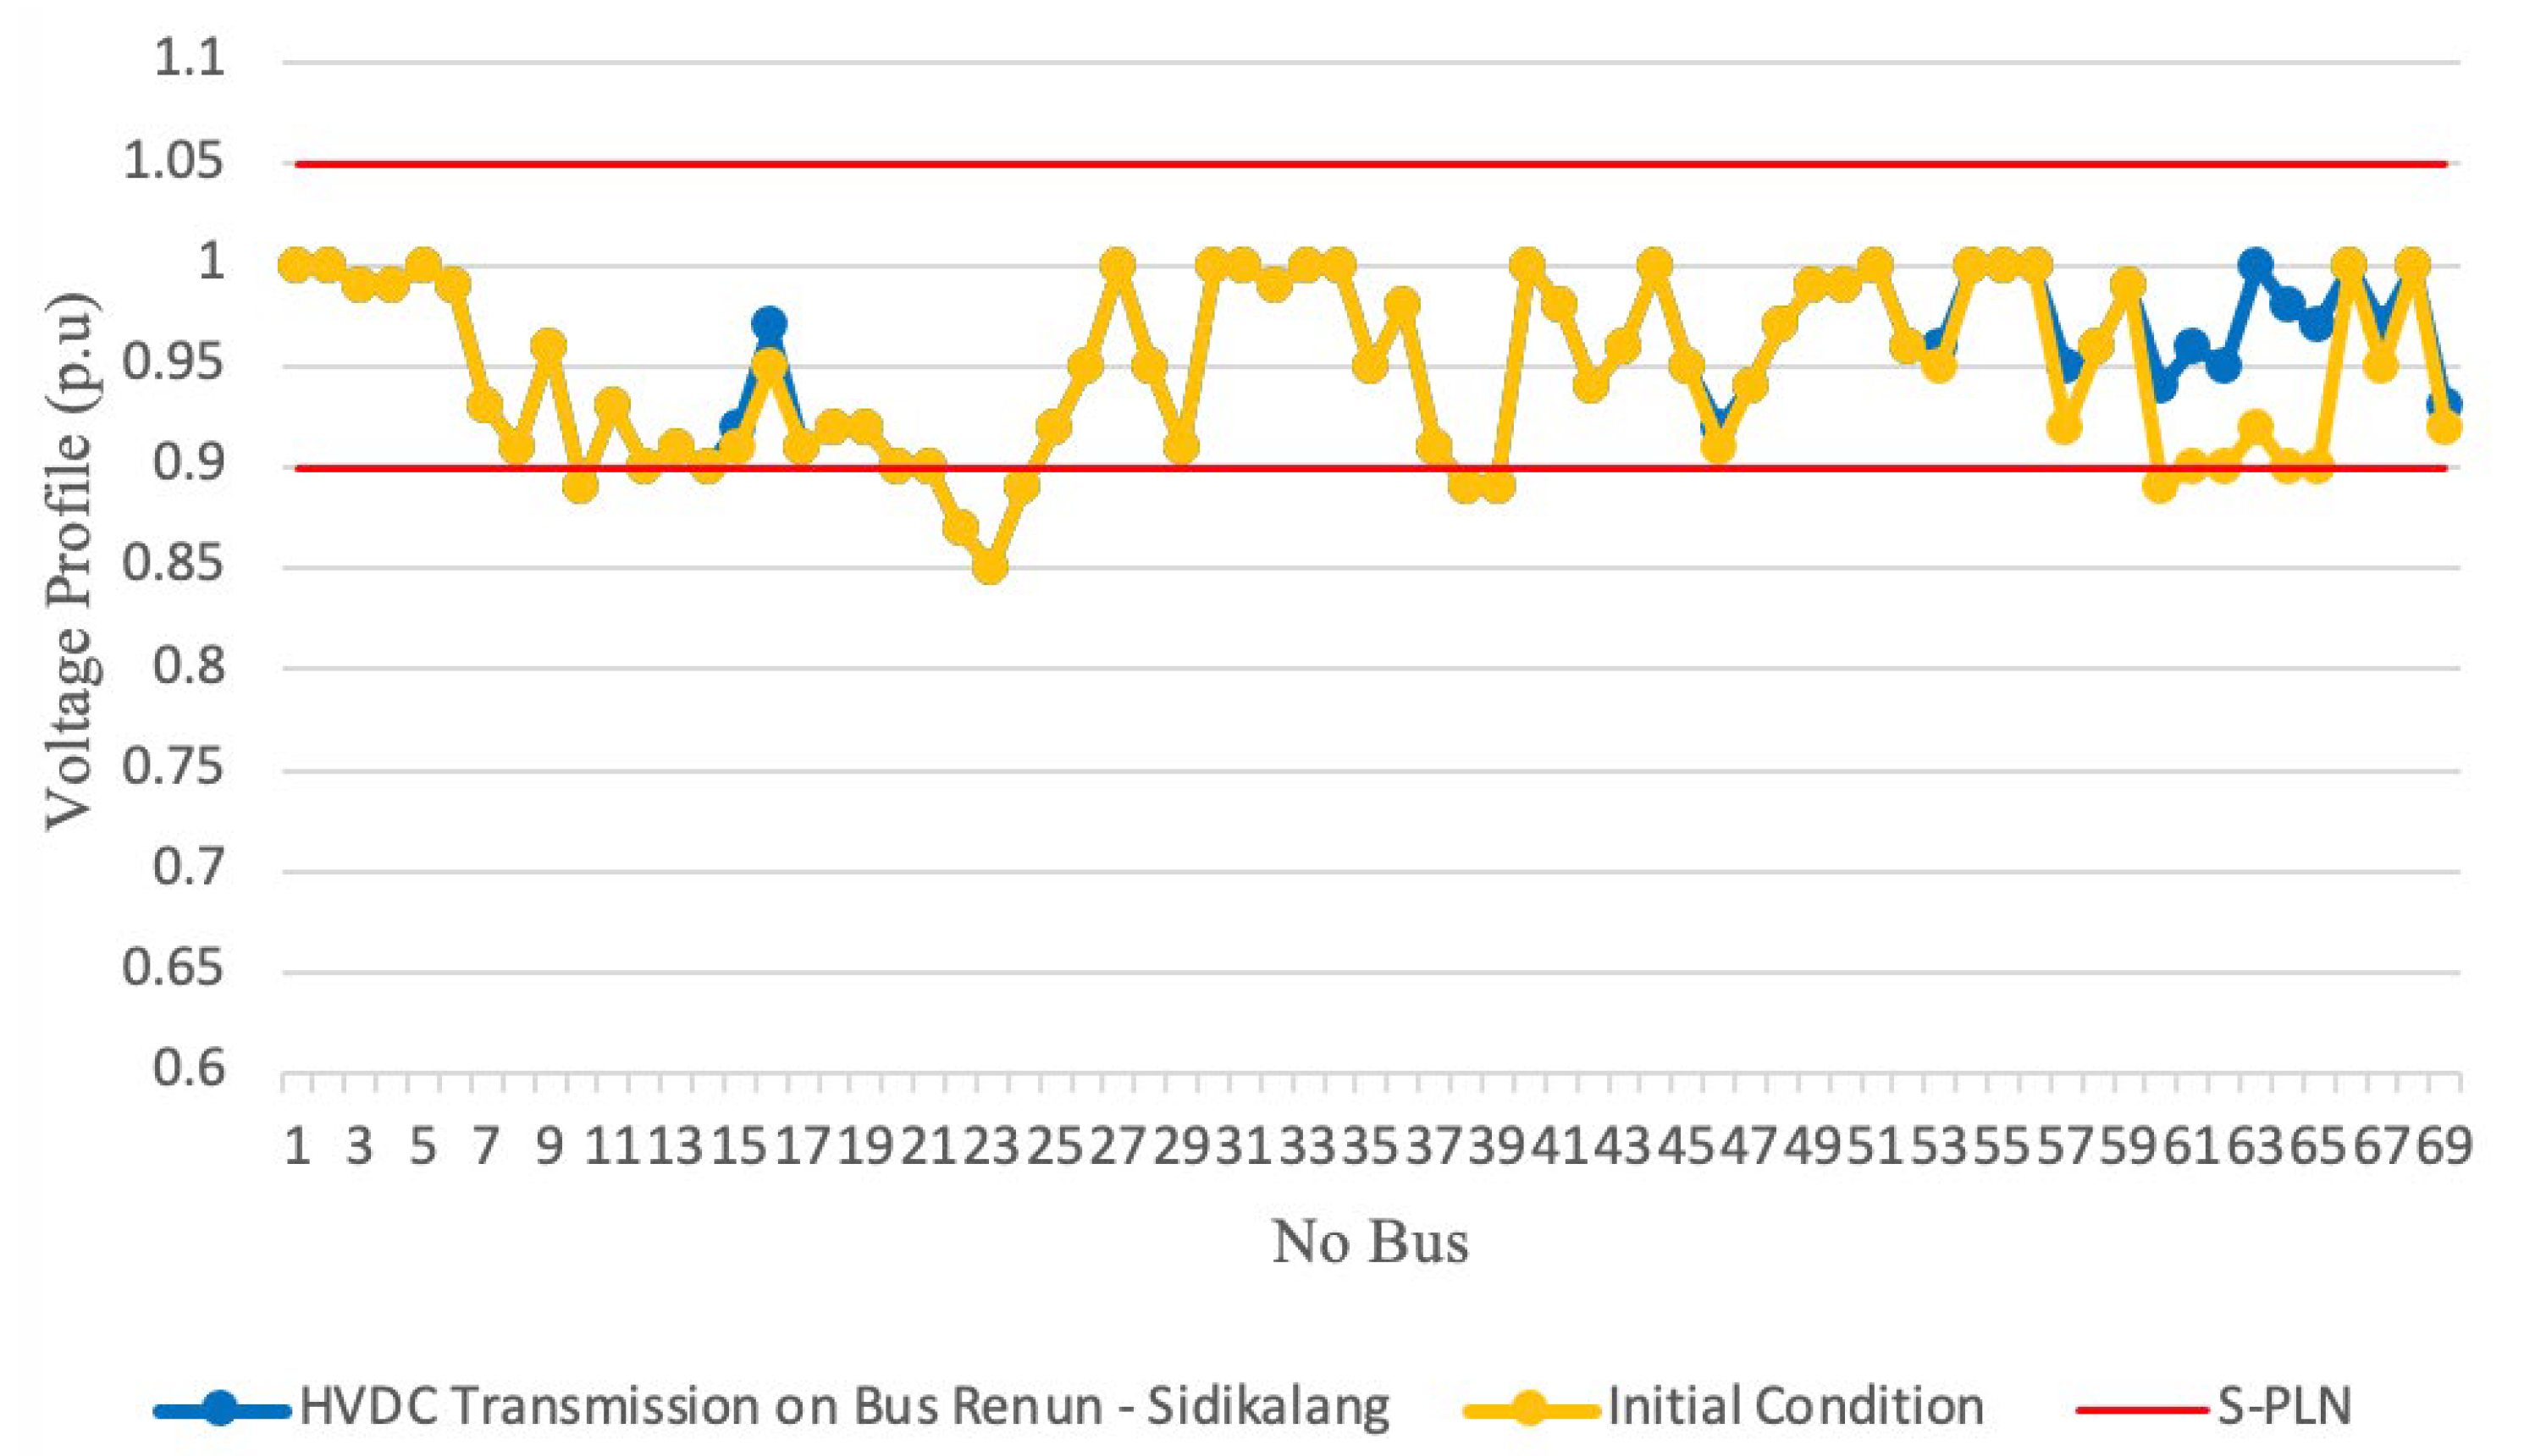
3.3.3. Renun (Bus 66)–Sidikalang (Bus 63)

The conversion of the 150 kV Renun (Bus 66)–Sidikalang (Bus 63) line into HVDC transmission led to a SUMBAGUT transmission loss of 60.80 MW.
The efficiency of the power losses before and after the conversion was obtained with Equation (5).
% P L = 68.41 60.8 68.41 × 100 % = 11.12 %
Thus, the conversion of the 150 kV SUMBAGUT Renun (Bus 66)–Sidikalang (Bus 63) led to an overall power loss reduction efficiency of 11.12%. Meanwhile, the results of the voltage profile after the conversion of the Renun (bus 66)-Sidikalang (bus 63) transmission system into HVDC were included in the standard category SPLN (0.9–1.05 pu), as shown in Figure 9.

3.3.4. Paya Pasir (Bus 5)–Paya Geli (Bus 7) and Paya Pasir (Bus 5)–Sei Rotan (Bus 11)

The conversion of the 150 kV Paya Pasir (Bus 5)–Paya Geli (Bus 7) and Paya Pasir (Bus 5)–Sei Rotan (bus 11) lines into HVDC transmission led to a SUMBAGUT transmission loss of 45.70 MW.
The efficiency of the power losses before and after the conversion was obtained with Equation (5).
% P L = 68.41 45.7 68.41 × 100 % = 33.19 %
Thus, the conversion of the 150 kV SUMBAGUT Paya Pasir (Bus 5)–Paya Geli (Bus 7) and Paya Pasir (Bus 5)–Sei Rotan (Bus 11) lines resulted in an overall power loss reduction efficiency of 33.19%. Meanwhile, the results of the voltage profile after changing two transmission lines, Paya Pasir (Bus 5)–Paya Geli (Bus 7) and Paya Pasir (Bus 5)–Sei Rattan (Bus11), to HVDC were better than those obtained after changing one HVDC transmission line, and the entire voltage profile was included in the SPLN standard category (0.9–1.05 pu), as shown in Figure 10.

3.3.5. Paya Pasir (Bus 5)–Paya Geli (Bus 7) and Renun (Bus 66)–Sidikalang (Bus 63)

The conversion of the 150 kV Paya Pasir (Bus 5)–Paya Geli (Bus 7) and Renun (Bus 66)–Sidikalang (Bus 63) lines into HVDC transmission led to a SUMBAGUT transmission loss of 49.95 MW.
The efficiency of the power losses before and after the conversion was obtained with Equation (5).
% P L = 68.41 49.95 68.41 · 100 % = 26.98 %
Thus, the conversion of the 150 kV SUMBAGUT Paya Pasir (Bus 5)–Paya Geli (Bus 7) and Renun (Bus 66)–Sidikalang (Bus 63) lines resulted in an overall power loss reduction efficiency of 26.98%. Meanwhile, the results of the voltage profile following the conversion of the Paya Pasir (Bus 5)–Paya Geli (Bus7) and Renun (Bus 66)–Sidikalang (Bus 63) lines to HVDC were better than those obtained from the conversion of Paya Pasir (Bus 5)–Paya Geli (Bus 7) and Paya Pasir (Bus 5)–Sei Rotan (Bus11). The entire voltage profile was included in the SPLN standard category (0.9–1.05 pu), as shown in Figure 11.

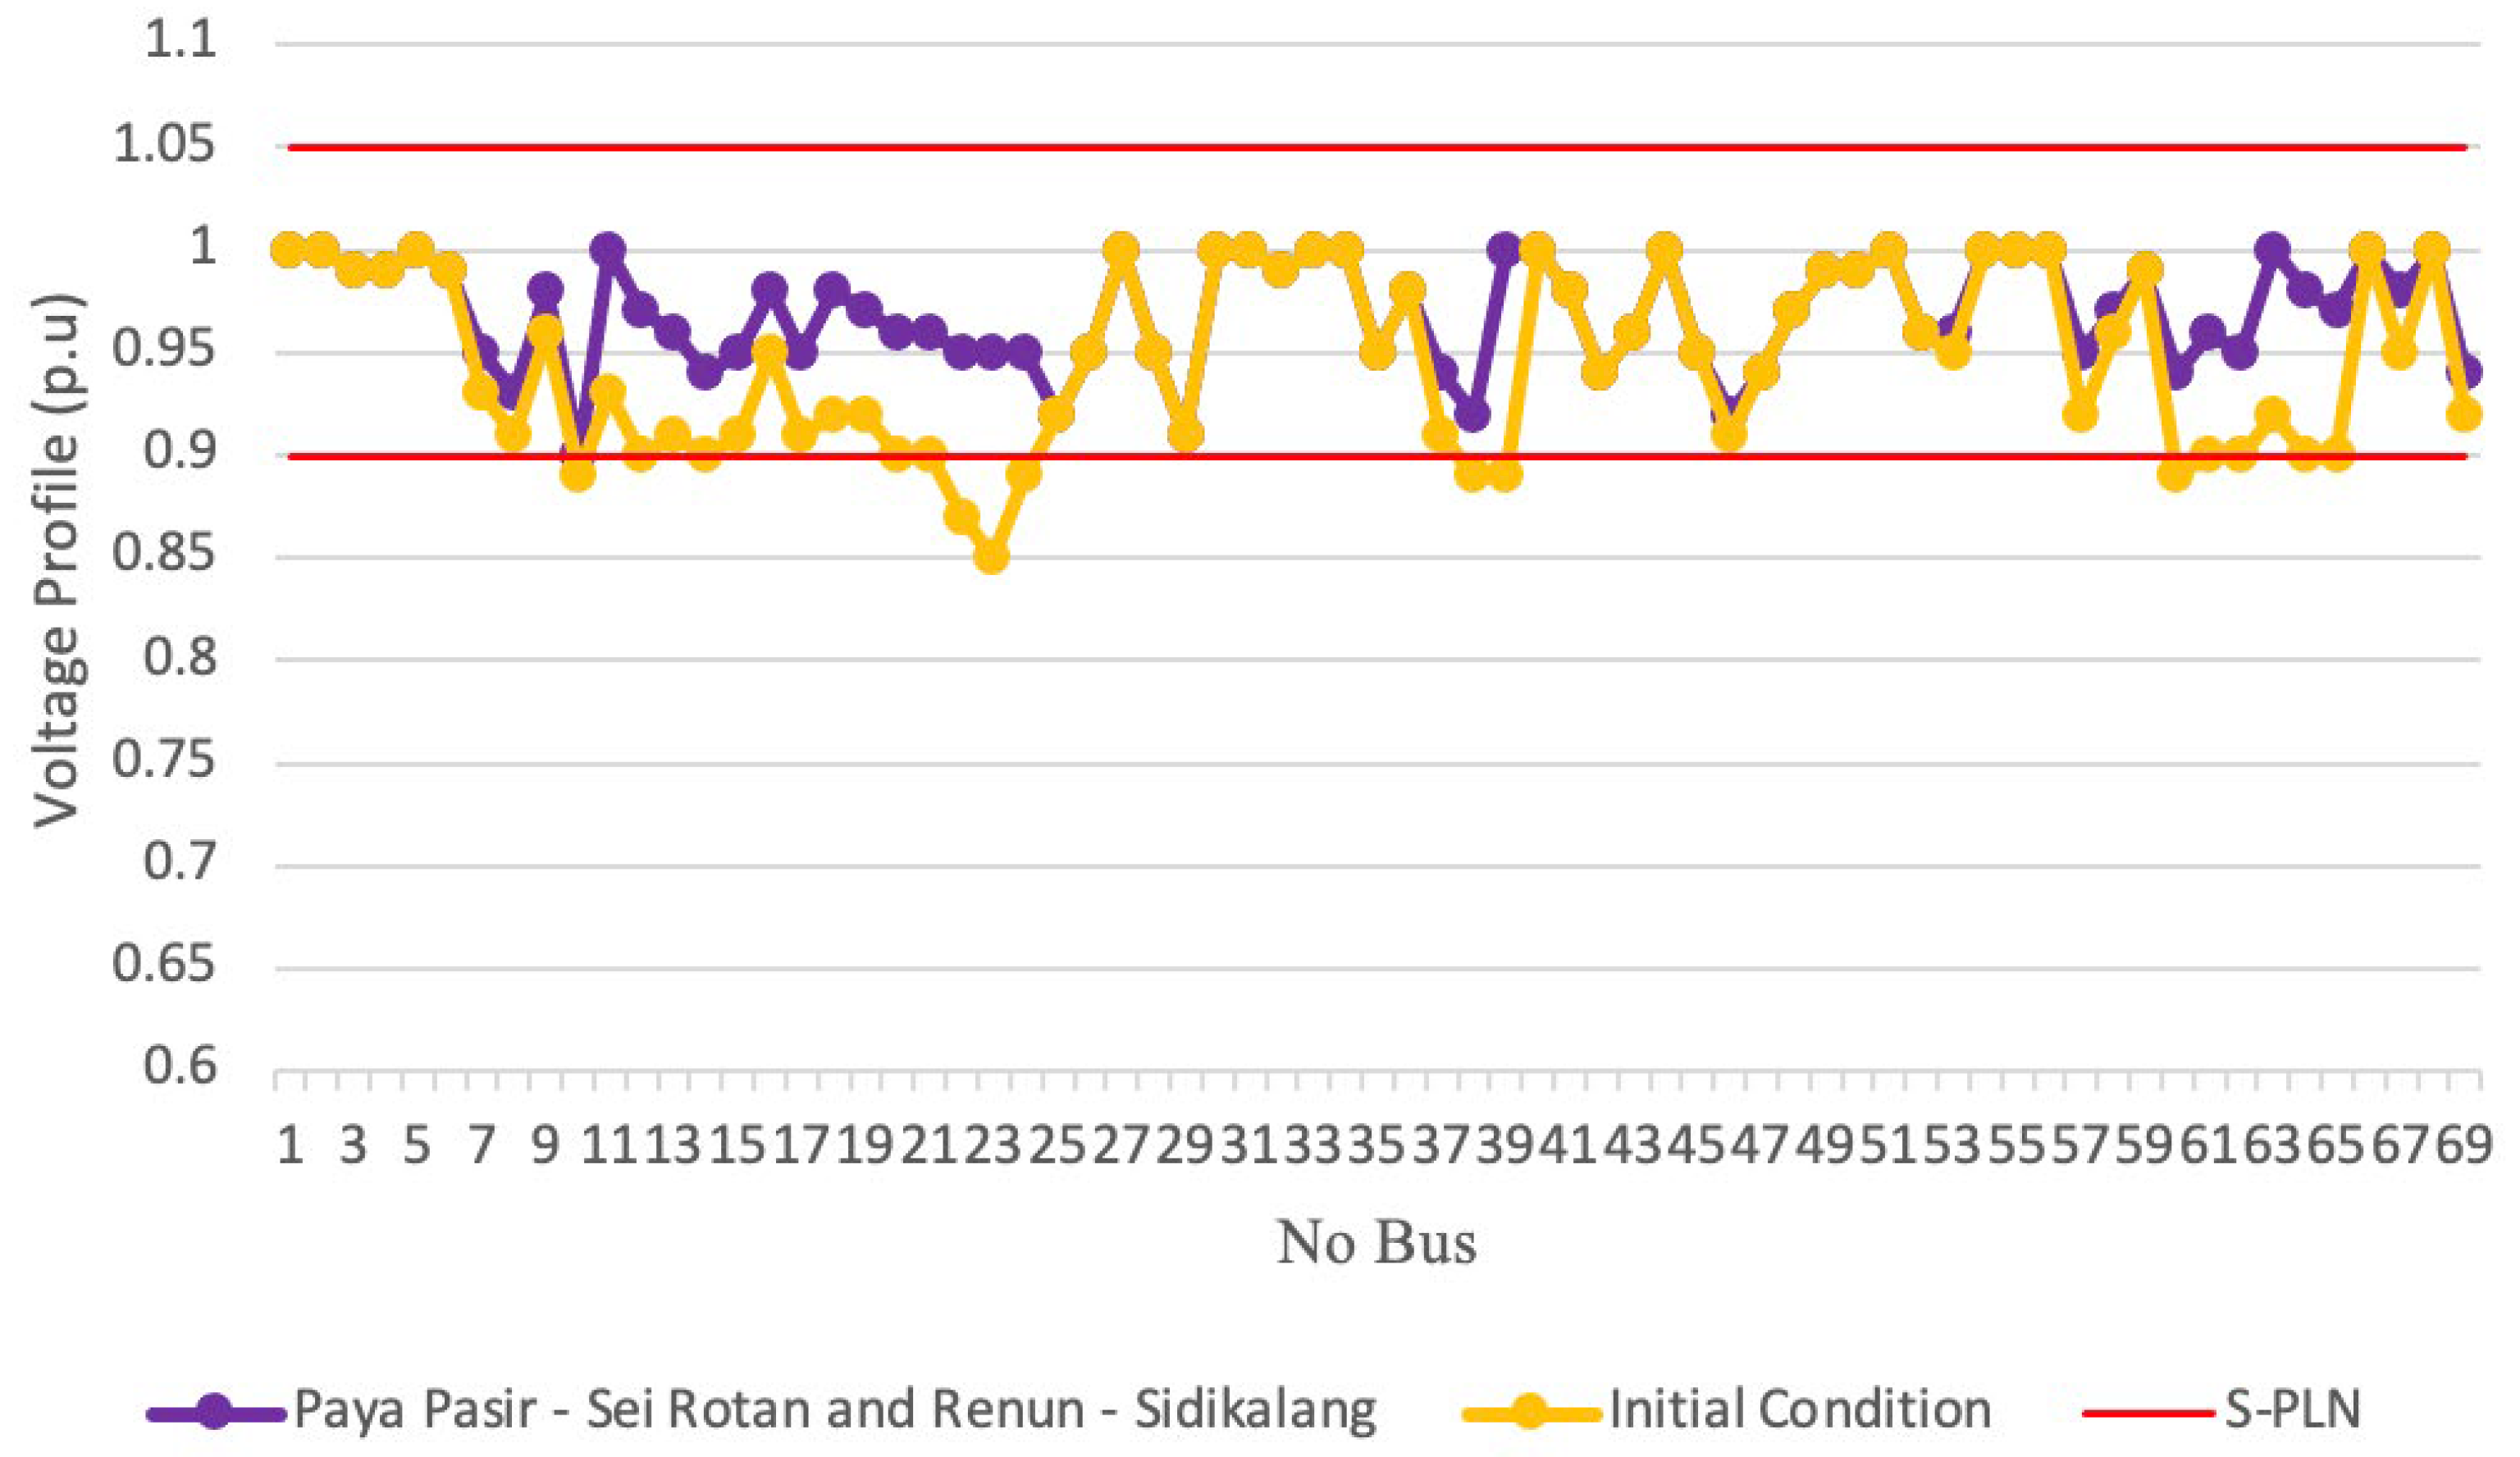
3.3.6. Paya Pasir (Bus 5)–Sei Rotan (Bus 11) and Renun (Bus 66)–Sidikalang (Bus 63)

The conversion of the 150 kV Paya Pasir (Bus 5)–Sei Rotan (Bus 11) and Renun (Bus 66)–Sidikalang (Bus 63) lines into HVDC transmission led to a SUMBAGUT transmission loss of 44.69 MW.
The value of the efficiency of the power losses before and after the conversion was obtained with Equation (5).
% P L = 68.41 44.69 68.41 × 100 % = 34.67 %
Thus, the conversion of the 150 kV SUMBAGUT Paya Pasir (Bus 5)–Sei Rotan (Bus 11) and Renun (Bus 66)–Sidikalang (Bus 63) lines resulted in an overall power loss reduction efficiency of 34.67%. Moreover, the conversion of the 150 kV SUMBAGUT Paya Pasir (Bus 5)–Paya Geli (Bus 7) and Renun (Bus 66)–Sidikalang (Bus 63) led to an overall power loss reduction efficiency of 26.98%. Meanwhile, the results of the voltage profile following the conversion of the Paya Pasir (Bus 5)–Sei Rotan (Bus 11) and Renun (Bus 66)–Sidikalang (Bus 63) lines to HVDC were better than those of the other lines. All voltage profiles were included in the SPLN standard category (0.9–1.05 pu), as shown in Figure 12.

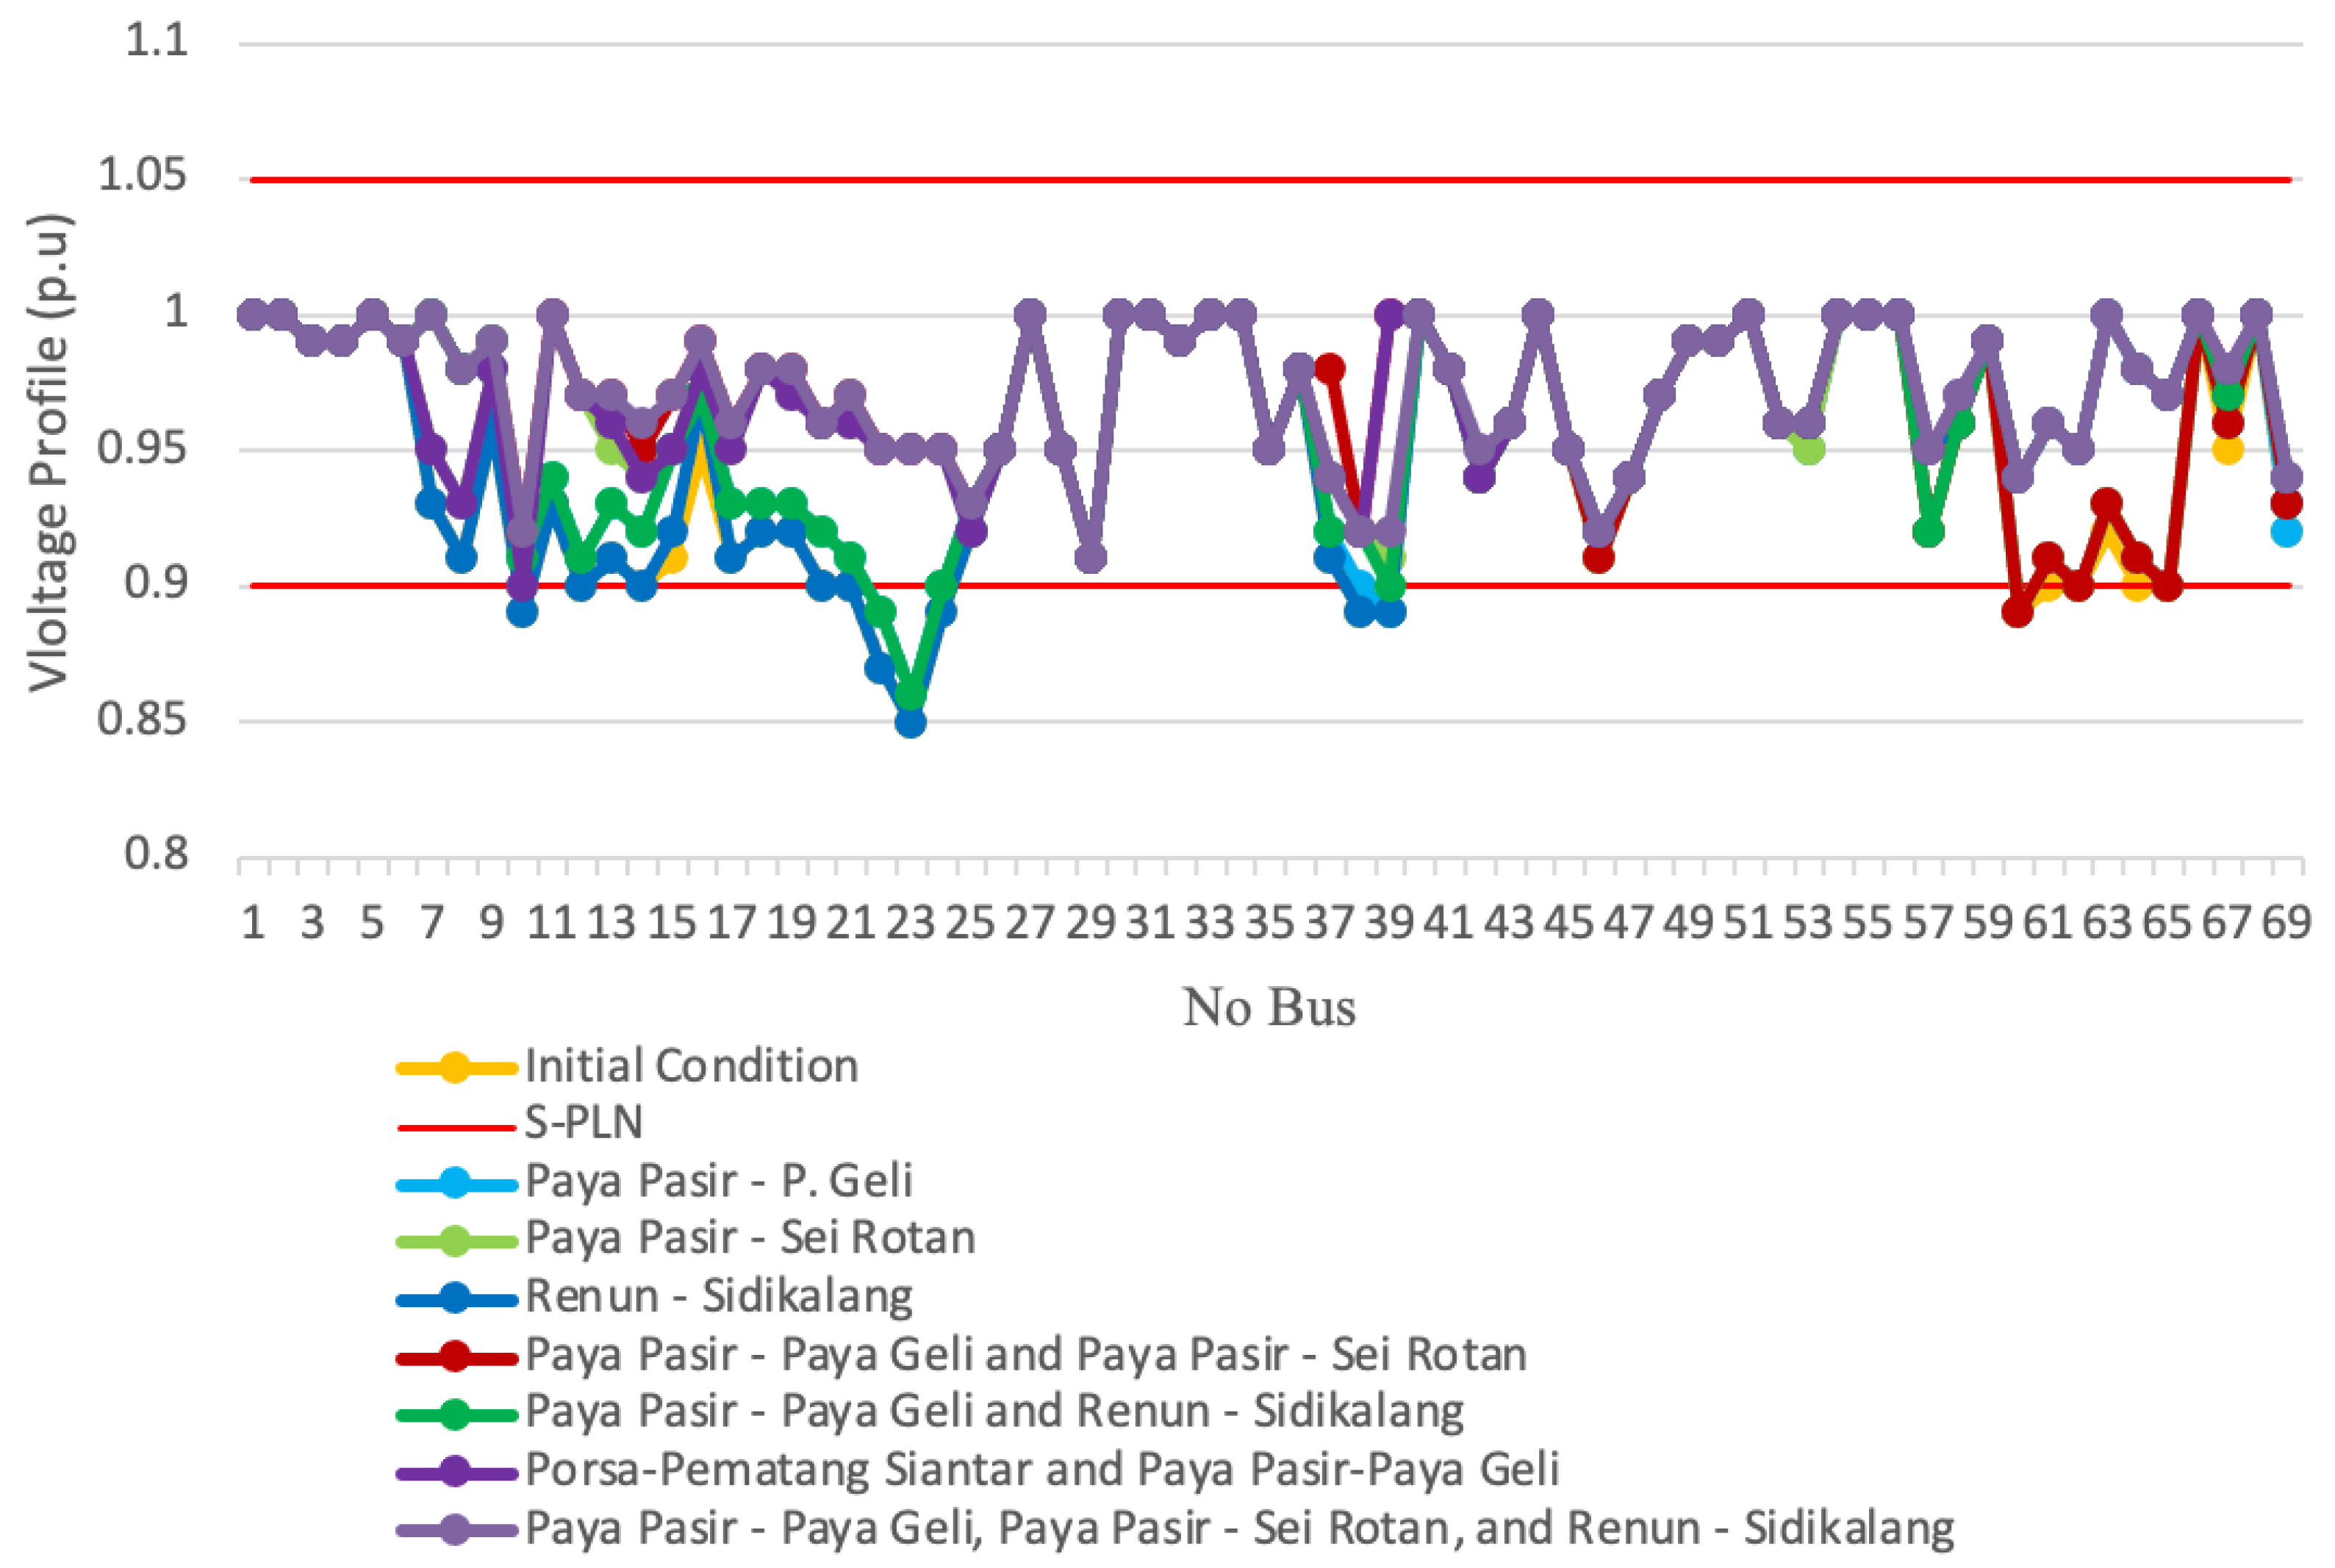
3.3.7. Paya Pasir (Bus 5)–Paya Geli (Bus 7), Paya Pasir (Bus 5)–Sei Rotan (Bus 11), and Renun (Bus 66)–Sidikalang (Bus 63)

The conversion of the 150 kV Paya Pasir (Bus 5)–Paya Geli (Bus 7), Paya Pasir (Bus 5)–Sei Rotan (Bus 11), and Renun (Bus 66)–Sidikalang (Bus 63) lines into HVDC transmission led to a SUMBAGUT transmission loss of 38.71 MW.
The value of the efficiency of the power losses before and after the conversion was obtained with Equation (5).
% P L = 68.41 38.71 68.41 × 100 % = 43.41 %
Thus, the conversion of the 150 kV SUMBAGUT Paya Pasir (Bus 5)–Paya Geli (Bus 7), Paya Pasir (Bus 5)–Sei Rotan (Bus 11), and Renun (Bus 66)–Sidikalang (Bus 63) lines led to an overall power loss reduction efficiency of 43.41%.

4. Discussion

Based on the results presented above, changing the HVDC transmission is a good option, especially in the Paya Pasir (Bus 5)–Paya Geli (Bus 7), Paya Pasir (Bus 5)–Sei Rattan (Bus 11), and Renun (bus 66)–Sidikalang (Bus 63) transmission lines, as seen in Table 2.
Based on the information presented in Table 2 and Figure 13, the best HVDC transmission system involves changing three transmission lines to HVDC, namely Paya Pasir–Paya Geli, Paya Pasir–Sei Rattan, and Renun–Sidikalang. This was shown to produce a power loss reduction efficiency of 43.41%, and all voltage profiles were included in the standards of SPLN Indonesia (+5, −10% pu). Furthermore, the experiment results prove that the power loss is small enough to improve the voltage profile, as shown in Equations (8) and (9).

5. Conclusions

Based on our results, the following conclusions were obtained:
  • The best line locations for conversion to hybrid HVAC/HVDC are the 150 kV Paya Pasir (Bus 5)–Paya Geli (Bus 7) transmission line (21 km), the 150 kV Paya Pasir (Bus 5)–Sei Rotan (Bus 11) transmission line (24 km), and the Renun (Bus 66)–Sidikalang (bus 63) transmission line (25 km), which were shown to have transmission losses of 5731 kW, 5179 kW, and 6080 kW, respectively. The network loss before HVAC was 68.41 MW. This shows that the transmission loss decreased after HVDC installation.
  • The best combination of channels was the combination of these three transmission lines into a hybrid HVAC/HVDC. The 150 kV transmission conversion of Paya Pasir (Bus 5)–Paya Geli (Bus 7), Paya Pasir (Bus 5)–Sei Rotan (Bus 11), and Renun (Bus 66)–Sidikalang (Bus 63) gave the best channel conversion results with a total power loss of 38.71 MW for the entire SUMBAGUT transmission system, which represents a decrease of 43.41%. It was also shown that HVDC network losses experienced a very large decrease with the conversion of three transmission lines to HVDC compared with two transmission lines. Not only were network losses improved in the HVDC transmission system, but the voltage profile also improved.
  • The HVDC transmission system is the most efficient transmission system for delivering power, not only in terms of its ability to overcome power losses based on the line length but also due to its ability to efficiently conduct power when the transmission end has a very large load.
  • Particle swarm optimization was used to optimize the HVDC system, and the objective functions for the rectifier and inverter were evaluated individually. It was noted that the step change optimization solution had met the requirements for the stability and dynamic performance of the HVDC system.

Author Contributions

Conceptualization, C.P. and Y.S.; methodology, Y.S.; software, C.P.; validation, Y.S.; formal analysis, C.P.; investigation, C.P. and Y.S.; resources, C.P.; data curation, C.P.; writing—original draft preparation, C.P.; writing—review and editing, Y.S. All authors have read and agreed to the published version of the manuscript.

Funding

This research received no external funding.

Data Availability Statement

The data are available from the corresponding author upon request.

Acknowledgments

The authors are very grateful to PT. PLN (Persero) UP2B SUMBAGUT for the data transmission and distribution in SUMBAGUT 150 kV.

Conflicts of Interest

The authors declare no conflict of interest.

References

  1. Quan, N.; Surya, S. Optimal Planning and Operation of Multi-Frequency HVAC Transmission Systems. IEEE Trans. Power Syst. 2021, 36, 689–698. [Google Scholar] [CrossRef]
  2. Ashoke, K.B.; Sina, I.A.; Shravan, K.A.; Hossein, S. High Voltage AC (HVAC) and High Voltage DC (HVDC) Transmission Topologies of Offshore Wind Power and Reliability Analysis. In Proceedings of the IEEE Green Technologies Conference (GreenTech), Denver, CO, USA, 7–9 April 2021. [Google Scholar]
  3. Ognjen, S.; Jared, G.; Sören, H.; Christian, M.F.; Turhan, D. Benefit Analysis of a Hybrid HVAC/HVDC Transmission Line: A Swiss Case Study. In Proceedings of the IEEE Milan PowerTech, Milan, Italy, 23–27 June 2019. [Google Scholar]
  4. Amit, K.; Subhasis, J.; Rajesh, S. HVDC Converter Stations Design for LCC Based HVDC Transmission System-Key Consideration. In Proceedings of the 14th IEEE India Council International Conference (INDICON), Roorkee, India, 15–17 December 2017. [Google Scholar] [CrossRef]
  5. Paul, M.A.; Charles, H.; Rasheek, R.; Brian, J.; Sakis, M. Line Commutated Converter HVDC Protection. In Power System Protection, 2nd ed.; Wiley-IEEE Press: Hoboken, NJ, USA, 2022; pp. 973–1019. [Google Scholar] [CrossRef]
  6. Oluwafemi, E.O.; Innocent, E.D.; Kamati, N.I.M. A review of LCC-HVDC and VSC-HVDC technologies and applications. In Proceedings of the IEEE 16th International Conference on Environment and Electrical Engineering (EEEIC), Florence, Italy, 7–10 June 2016. [Google Scholar] [CrossRef]
  7. Nsofwa, M.K.; Chitra, V.; Innocent, E.D. A review of the performance of VSC-HVDC and MTDC systems. In Proceedings of the IEEE PES Power Africa, Accra, Ghana, 27–30 June 2017. [Google Scholar]
  8. Sungchul, H.; Sungyoon, S.; Gilsoo, J.; Minhan, Y. An Operation Strategy of the Hybrid Multi-Terminal HVDC for Contingency. Energies 2019, 12, 2042. [Google Scholar] [CrossRef] [Green Version]
  9. Abdulate, A.M.E. The Corona Effect on High Voltage Transmission Lines. IJSETR Int. J. Sci. Eng. Technol. Res. 2019, 8, 29–31. [Google Scholar]
  10. Assefa, A. Study on Conversion of Existing HVAC Lines to Hybrid HVAC/HVDC Transmission Line to Increase Transmission Capacity and Efficiency. Master’s Thesis, School of Electrical and Computer Engineering, Addis Ababa University, Addis Ababa, Ethiopia, 2015. [Google Scholar]
  11. Kizilcay, M.; Agdemir, A.; Losing, M. Interaction of a HVDC System with 400-kV AC Systems on the Same Tower. In Proceedings of the International Conference on Power System Transient, Kyoto, Japan, 3–6 June 2009. [Google Scholar]
  12. Oyedokun, D.T.; Folly, K.A.; Ubisse, A.V.; Azimoh, L.C. Interaction between HVAC-HVDC system: Impact of line length on transient stability. In Proceedings of the 45th International Universities Power Engineering Conference UPEC2010, Cardiff, UK, 31 August–3 September 2010. [Google Scholar]
  13. Peter, A.G.; Saha, A.K. Loss Assessment of Key Equipment on LCC-Based HVDC Converter Stations. In Proceedings of the IEEE PES/IAS Power Africa, Cape Town, South Africa, 28–29 June 2018. [Google Scholar] [CrossRef]
  14. Ricky, F.; Muhammad, N.; Nanang, H.; Stephan, P.; Jürgen, P. Sumatra-Java HVDC transmission system modelling and system impact analysis. In Proceedings of the IEEE Eindhoven PowerTech, 29 June–2 July 2015. [Google Scholar] [CrossRef]
  15. Prasetyo, E.; Crossley, P. Impact of LCC HVDC transmission on distance protection in IEC 61850 environment as applied to sumatera-java 500 kV interconnection. In Proceedings of the 16th International Conference on Developments in Power System Protection (DPSP 2022), Hybrid Conference, Newcastle, UK, 7–10 March 2022. [Google Scholar]
  16. Yulianta, S.; Zulkarnen, P.; Riovan, S. Optimization of Distributed Generating Power Placement and Capacity on The Distribution Network for Voltage Stability Improvement. In Proceedings of the 5th International Conference on Electrical, Telecommunication and Computer Engineering (ELTICOM), Johor Bahru, Malaysia, 15–16 September 2021. [Google Scholar]
  17. Yulianta, S.; Popy, N.A.; Zulkarnaen, P. Optimization Placement of SVC and TCSC in Power Transmission Network 150 kV SUMBAGUT using Artificial Bee Colony Algorithm. In Proceedings of the 4th International Seminar on Research of Information Technology and Intelligent Systems (ISRITI), Yogyakarta, Indonesia, 16–17 December 2021. [Google Scholar]
  18. Yulianta, S.; Zulkarnen, P.; Ferry, R.A.B.; Enda, G.S. Network Reconfiguration of Distributed Generation for Reduced Power Loss, and Increasing Voltage Profile by Using Artificial Bee Colony. In Proceedings of the IEEE 5th International Conference on Information Technology, Information Systems and Electrical Engineering (ICITISEE), Purwokerto, Indonesia, 24–25 November 2021. [Google Scholar]
  19. Sheylin, W.L.T.; Zulkarnaen, P.; Yulianta, S. Optimization of Hydro Turbine Governor in a Stand-Alone Hydro Plant using PID Control. In Proceedings of the 5th International Conference on Electrical, Telecommunication and Computer Engineering (ELTICOM), Medan, Indonesia, 15–16 September 2021. [Google Scholar]
  20. Chou, C.-J.; Wu, Y.-K.; Han, G.-Y.; Lee, C.-Y. Comparative evaluation of the HVDC and HVAC links integrated in a large offshore wind farm—An actual case study in Taiwan. In Proceedings of the IEEE Industry Applications Society Annual Meeting, Orlando, FL, USA, 9–13 October 2011. [Google Scholar] [CrossRef]
  21. Mohammad, B.P.; Mehdi, M. New Adaptive Controller in a Two Area HVAC/HVDC Power System. In Proceedings of the 11th International Conference on Optimization of Electrical and Electronic Equipment, Brasov, Romania, 22–24 May 2008. [Google Scholar] [CrossRef]
  22. Dragan, J.; Nalin, P.; Mohamed, Z. Analytical modelling of HVDC-HVAC systems. IEEE Trans. Power Deliv. 1999, 14, 506–511. [Google Scholar] [CrossRef]
  23. Kalair, A.; Abas, N.; Khan, N. Comparative study of HVAC and HVDC transmission systems. Renew. Sustain. Energy Rev. 2016, 59, 1653–1675. [Google Scholar] [CrossRef]
  24. Hakan, A.; Fausto, P.D.M. A life-cycle cost analysis of High Voltage Direct Current utilization for solar energy systems: The case study in Turkey. J. Clean. Prod. 2022, 360, 132128. [Google Scholar] [CrossRef]
  25. Florian, T.; Spyros, C.; Robert, E. DC voltage droop control structures and its impact on the interaction modes in interconnected AC-HVDC systems. In Proceedings of the IEEE Innovative Smart Grid Technologies—Asia (ISGT-Asia), Auckland, New Zealand, 1–5 November 2017. [Google Scholar]
  26. John, F.; Robin, P.; Mike, B. VSC-HVDC for frequency support (a review). In Proceedings of the 13th IET International Conference on AC and DC Power Transmission (ACDC 2017), Manchester, UK, 14–16 February 2017. [Google Scholar]
  27. Khaled, A.; Hasan, A.A.; Ramadan, E.S. Optimal Power Flow in Multi-Terminal HVDC Systems. In Proceedings of the IEEE Electrical Power and Energy Conference (EPEC), Toronto, ON, Canada, 10–11 October 2018. [Google Scholar]
  28. Mir, N.A.; Ke, M.; Wiedong, X.; Ahmed, A.; Zhao, Y.D. Adaptive Droop Control of Multi-Terminal HVDC Network for Frequency Regulation and Power Sharing. IEEE Trans. Power Syst. 2021, 36, 566–3578. [Google Scholar]
  29. Changjiang, W.; Yi, Y.; Xiangsong, Z.; Yilang, J. Influence of VSC-HVDC Reactive Power Support on Hybrid Dual-infeed HVDC System. In Proceedings of the IEEE Sustainable Power and Energy Conference (iSPEC), Perth, Australia, 4–7 December 2021. [Google Scholar]
  30. Hassan, A.; Alan, J.; Mohamed, D. Simulation of HVAC Transmission Line. In Proceedings of the 54th International Universities Power Engineering Conference (UPEC), Bucharest, Romania, 3–6 September 2019. [Google Scholar] [CrossRef]
  31. Thu, W.M.; Yew, M.Y.; Abhisek, U. Comparative evaluation of power loss in HVAC and HVDC transmission systems. In Proceedings of the IEEE Region 10 Conference (TENCON), Singapore, 22–25 November 2016. [Google Scholar] [CrossRef]
  32. Andres, H.D.; Antonio, H.E.Z.; Leonardo, H.M.; Rubén, R. Transmission network expansion planning considering HVAC/HVDC lines and technical losses. In Proceedings of the IEEE PES Transmission & Distribution Conference and Exposition-Latin America (PES T&D-LA), Morelia, Mexico, 20–24 September 2016. [Google Scholar] [CrossRef]
  33. Kasangala, F.M.; Atkinson, H.G. Electrical energy losses and costs evaluation of HVDC and UHVDC transmission lines. In Proceedings of the 10th Industrial and Commercial Use of Energy Conference, Frankfurt, Germany, 20–21 August 2013. [Google Scholar]
  34. Prashant, S.; Anil, K.K. HVDC based Power Loss Reduction and Estimation of Power Transmission. In Proceedings of the Fourth International Conference on Computing Methodologies and Communication (ICCMC), Erode, India, 11–13 March 2020. [Google Scholar] [CrossRef]
  35. Balaji, D.; Ganesh, A.; Srinivas, B.; Siva, K.P. Power Flow Control in High Voltage DC Link using ANN and PI Controllers. Int. J. Mod. Trends Sci. Technol 2021, 7, 50–56. [Google Scholar]
  36. Rouzbehi, K.; Yazdi, S.S.H.; Moghadam, N.S. Power Flow Control in Multi-Terminal HVDC Grids Using a Serial-Parallel DC Power Flow Controller. IEEE Access 2018, 6, 56934–56944. [Google Scholar]
  37. Zhuang, X. Power Flow Control of High Voltage DC Networks for Grid Integration of Offshore Wind Power. Energy Procedia 2015, 75, 1698–1704. [Google Scholar]
  38. Abbas, Z.N.; Tuaimah, F.M. Optimal Location of High Voltage Direct Current (HVDC) Transmission Line using Genetic Algorithm. In Proceedings of the 2nd International Scientific Conference of Engineering Sciences (ISCES 2020), Bristol, UK, 16–17 December 2020. [Google Scholar]
  39. Ramzi, K.; Linda, S.; Tarek, B.; Ismail, M. Optimal Power Flow Solution for Wind Integrated Power in presence of VSC-HVDC Using Ant Lion Optimization. Indones. J. Electr. Eng. Comput. Sci. 2018, 12, 625633. [Google Scholar]
  40. Ulaş, K.; Kürşat, A. Optimizing power flow of AC–DC power systems using artificial bee colony algorithm. Int. J. Electr. Power Energy Syst. 2013, 53, 592–602. [Google Scholar]
  41. Haripriya, A.; Sreedevi, J. Optimization of HVDC controls with PSO algorithm developed in MATLAB/SIMULINK. In Proceedings of the 2013 International Conference on Circuits, Controls and Communications (CCUBE), Bengaluru, India, 27–28 December 2013. [Google Scholar]
  42. Paul, M.N.; Gordon, L. PSO optimized PID parameters for coupled HVDC control. In Proceedings of the IET Irish Signals and Systems Conference (ISSC 2010), Cork, Ireland, 23–24 June 2010. [Google Scholar]
  43. Nayak, N.; Mishra, S.; Choudhury, S.; Rout, P.K. Optimal design of VSC based HVDC using Particle Swarm Optimization technique. In Proceedings of the 2nd International Conference on Power, Control and Embedded Systems, Allahabad, India, 17–19 December 2012. [Google Scholar]
Figure 1. Single line diagram of the SUMBAGUT 150 kV.
Energies 15 07638 g001
Figure 2. HVDC Transmission Network.
Energies 15 07638 g002
Figure 3. Voltage profile of the SUMBAGUT 150 kV transmission system without changing to the HVAC/HVDC hybrid transmission system.
Energies 15 07638 g003
Figure 4. Placement of the HVDC Transmission System at Paya Pasir (Bus 5)–Paya Geli (Bus 7).
Energies 15 07638 g004
Figure 5. Placement of the HVDC Transmission System at Paya Pasir (Bus 5)–Sei Rotan (Bus 11).
Energies 15 07638 g005
Figure 6. Placement of the HVDC Transmission System at Renun (Bus 66)–Sidikalang (Bus 63).
Energies 15 07638 g006
Figure 7. Voltage profile of the SUMBAGUT 150 kV transmission system after changing the Paya Pasir (Bus 5)–Paya Geli (Bus 7) line to the HVDC transmission system.
Energies 15 07638 g007
Figure 8. Voltage profile of the SUMBAGUT 150 kV transmission system after changing the Paya Pasir (Bus 5)–Sei Rotan (Bus 11) line to the HVDC transmission system.
Energies 15 07638 g008
Figure 9. Voltage profile of the SUMBAGUT 150 kV transmission system after changing the Renun (Bus 66)–Sidikalang (Bus 63) to the HVDC transmission system.
Energies 15 07638 g009
Figure 10. Voltage profile of the SUMBAGUT 150 kV transmission system after changing the Paya Pasir (Bus 5)–Paya Geli (Bus 7) and Paya Pasir (Bus 5)–Sei Rotan (Bus 11) lines to the HVDC transmission system.
Energies 15 07638 g010
Figure 11. Voltage profile of the SUMBAGUT 150 kV transmission system after changing the Paya Pasir (Bus 5)–Paya Geli (bus 7) and Renun (Bus 66)–Sidikalang (Bus 63) lines to the HVDC transmission system.
Energies 15 07638 g011
Figure 12. Voltage profile of the SUMBAGUT 150 kV transmission system after changing the Paya Pasir (Bus 5)–Sei Rotan (Bus 11) and Renun (Bus 66)–Sidikalang (Bus 63) lines to the HVDC transmission system.
Energies 15 07638 g012
Figure 13. Voltage profile of the SUMBAGUT 150 kV transmission system for all conditions.
Energies 15 07638 g013
Table 1. Classification of Bus Types in the SUMBAGUT 150 kV.
Bus TypeBus NameNumber of Buses
Slack BusBLWCC1
Bus GeneratorBLWTU, PPASR, ARUMG, SIGLI, BACEH, NAGAN, KTJNG, HASANG, LBAGN, SPAN1, SPAN2, RENUN, WAMPU, TPSIL dan TPNIL.15
Bus BebanLBHAN, LHTMA, MABAR, PGELI, GLUGR, BNJAI, PBDN, SROTN, GIKIM, TTKNG, GISLS, NRMBE, GLANG, N.DOLOK, DENAI, TMORA, KLNMU, PBUNG, LNGSA, TLCUT, IDIE, PLTBU, LSMWE, BIRUN, TKGON, SMNGA, JNTHO, BLGPD, MLBOH, TBING, GPARA, PSTAR, SMKEI, KSRAN, AKNPN, RTPAT, KTPNG, GNTUA, PSDEM, NPSDM, PYBGN, SORIK MERAPI, MRTBE, SBOGA, TRTUG, PORSA, SMKUK, GDOSA, TELE, PGRUN, SDKAL, SRUBE, SBLSM, BTAGI, SRULA dan KTCNE.56
Amount72
Table 2. Power Loss in the Hybrid HVAC/HVDC system.
TransmissionPower Loss (MW)Efficiency (%)
Initial Conditions68.41-
Paya Pasir (Bus 5)–Paya Geli (Bus 7)57.3116.22
Paya Pasir (Bus 5)–Sei Rotan (Bus 11)51.7924.29
Renun (Bus 66)–Sidikalang (Bus 63)60.811.12
Paya Pasir (Bus 5)–Paya Geli (Bus 7) and Paya Pasir (Bus 5)–Sei Rotan (Bus 11)45.733.19
Paya Pasir (Bus 5)–Paya Geli (Bus 7) and Renun (Bus 66)–Sidikalang (Bus 63)49.9526.98
Paya Pasir (Bus 5)–Sei Rotan (Bus 11) and Renun (Bus 66)–Sidikalang (Bus 63)44.6934.67
Paya Pasir (Bus 5)–Paya Geli (Bus 7), Paya Pasir (Bus 5)–Sei Rotan (Bus 11), and Renun (Bus 66)–Sidikalang (Bus 63)38.7143.41
Publisher’s Note: MDPI stays neutral with regard to jurisdictional claims in published maps and institutional affiliations.

