Article

Influence of Variable Blocking Ratio on DDT Process

School of Power and Energy, Northwestern Polytechnical University, Xi’an 710129, China
*
Author to whom correspondence should be addressed.
Energies 2022, 15(20), 7706; https://doi.org/10.3390/en15207706
Submission received: 26 September 2022 / Revised: 14 October 2022 / Accepted: 14 October 2022 / Published: 18 October 2022

Abstract

:
The influence of a variable blocking ratio on the DDT process is investigated through numerical simulation and experiment. Two dimensionless parameters, the average blocking ratio ( B R ¯ ) and the blocking ratio change rate (α), are specified to characterize the blocking ratio of obstacles. Four arrangements are utilized to describe the variation trend of the blocking ratio in a combustor. The main results are as follows: The obstacles can stretch the flame surface and facilitate reflection and diffraction of shock waves, which causes the acceleration of the flame front. The “hot spot” plays a vital role in the formation process of detonation waves. The overdriven detonation waves generated from “hot spots” promote the energy in the primary reaction zone, stimulating the formation of self-sustaining detonation. Compared with the fixed blocking ratio arrangement, the variable blocking ratio of obstacles can shorten the DDT distance. When B R ¯ = 0.43 , |α| = 0.03, and the variation trend (0.52–0.34–0.49) is adopted, the minimum DDT distance is obtained in numerical and experimental results. This paper can help with the design of detonation combustors in the future.

1. Introduction

Powered by the detonation wave, the pulse detonation engine (PDE) is expected to be the next generation of propulsion power [1]. It is widely recognized that the thermal efficiency of the pulse detonation cycle (PDC) is higher than the Brayton cycle at the same pressure ratio [2,3]. Two methods have been taken into consideration to generate detonation waves. The first is to trigger the detonation wave directive by a high-energy igniter [4,5], and the other is to obtain the detonation wave by deflagration to detonation transition (DDT) [6]. The DDT method is often adopted due to the limitation of engineering application.
The DDT process occurs in a channel with obstacles starting with an ignition flame kernel [7]. The flame is stretched while the deflagration flame passes through obstacles [8], resulting in a continuous increase in the chemical reaction rate [9]. Then, as the flame front accelerates, a shock wave, which preheats the unburned gas, gradually forms in front of the flame. The shock wave causes a further increase in reaction rate [10]. The “hot spots” are generated due to the interaction between the flame, shock wave, and obstacle surface [11,12].
DDT is a very complex process that is influenced by many factors. The DDT phenomenon in a channel with obstacles was firstly studied by experiment [13]. The experimental results showed that adding the obstacles can significantly promote flame acceleration. The flame velocity was increased dozens of times compared with the smooth detonation combustion chamber. Thus, the DDT distance was shortened. After that, Shchelkin [14,15,16] started a series of studies on DDT in 1940. He found that the turbulent flow of unburned gas changed the flame surface’s shape and increased the area of the flame surface, which increased the chemical reaction rate and promoted the flame propagation velocity.
In a rough pipe with obstacles, the occurrence of DDT requires that the pipe diameter satisfies λ/d≈1, where λ is the cell size and d is the characteristic diameter of the pipe [17]. The flame propagation velocity should first reach the order of sound velocity under the burning condition before detonation occurs. In addition, the flame propagation velocity must accelerate by obstacles to about half of the Chapman–Jouguet (C-J) speed for the detonation wave to be observed [18]. Obstacles could generate large-scale turbulence and increase the chemical reaction rate [19]. In addition, through reflection and diffraction on the surface of obstacle, the shock wave could influence the reaction rate to some extent through the interaction between the shock wave and the flame [20,21,22].
Due to the importance of obstacles in the DDT process, the propagation characteristics of detonation waves in rough tubes have been studied in recent years. The distribution of obstacles had a significant impact on the DDT process. Both large and small obstacle spacing would prevent the formation of a detonation wave. The more obstacles per unit length, the more disturbances would be generated so that the surface area of the flame front and the flame propagation velocity would increase faster. The DDT process was more likely to occur when the obstacle spacing was large enough, and the Mach stem was formed between obstacles [23,24]. For small obstacle spacing, flame acceleration mainly depended on the restricted channels. For large obstacle spacing, flame acceleration was attributed to the turbulence generated by obstacles. Two different propagation modes were observed in smooth and rough tubes, namely the fast flame regime and the steady detonation regime, respectively [25]. The critical condition appeared in a tube with orifice plates, while the super-critical condition and sub-critical condition were observed in a smooth tube [26]. The “hot spots” generated by the interaction of decoupled shock wave and the tube wall were found to cause the re-initiation of the detonation wave [27,28]. In addition, the effects of obstacles on the propagation of detonation waves were greater on a square orifice than on a triangular orifice or a round hole [29]. The thickness and the shape of the obstacle were also found to affect the re-ignition mechanism of detonation waves [30,31]. The effects of two obstacles with different shapes and blocking ratios on the detonation process were comparatively studied [32]. The results showed that the blocking ratio of the second obstacle was the critical parameter affecting the generation of detonation, while the shape of the obstacle only had a slight influence.
As mentioned above, most current investigations focus on the DDT process with a fixed blocking ratio, and investigations on obstacles with a variable blocking ratio are lacking. Therefore, the effect of the average blocking ratio ( B R ¯ ), blocking ratio change rate (α), and four obstacle arrangements with different variation trends on the flame propagation process in a rectangular combustor are studied through numerical simulation and experiment.

2. Numerical Methods and Physical Models

2.1. Numerical Methods

The effect of variable blocking ratio obstacles on the DDT process is investigated through the RANS method. Pressure-implicit split-operator (PISO), a dual prediction–correction method, is adopted to solve the pressure–velocity coupling problem [33]. Compared with other methods, PISO achieves better robustness but is more time-consuming under the same convergence conditions. The standard k-ε turbulence model is adopted to predict the turbulent flow in a combustor with acceptable accuracy and relatively low computational cost. The governing equations are as follows:
U t + A A v x + B B v y = S
Among them, U is the variable to be solved, A and B are inviscid flux in two coordinate directions, A v and B v are viscid flux in two coordinate directions, and S is the source term. More detailed definitions are as follows:
U = ρ ρ u ρ v ρ e ρ Y i       A = ρ u ρ u 2 + p ρ u v u ρ e + p ρ u Y i         B = ρ u ρ v 2 + p ρ u v v ρ e + p ρ v Y i
A q = 0 τ x x τ x y u τ x x + v τ x y + k T x ρ D Y i x     B q = 0 τ y y τ y x u τ y x + v τ y y + k T y ρ D Y i y     S = 0 0 0 0 m ˙ i
ρ = i = 1 N ρ i
τ x x = 2 μ u x 2 3 μ u x + v y
τ x y = μ u y + v x
τ y y = 2 μ v y 2 3 μ u x + v y
where i = 1, 2,⋯, N − 1 (N = 12). ρ is the density of the mixture. u and v are the velocities in the x and y directions, respectively. p is the pressure. m ˙ is the mass change rate. N is the number of species. k = 0.0454 is the thermal conductivity. D = 2.88 × 10⁻⁵ is the mass diffusion coefficient. μ = 1.72 × 10⁻⁵ is the viscosity coefficient.
A 12-species 24-step reaction mechanism is coupled into the numerical simulation to obtain the accurate detonation wave parameters as CEA [34]. This reaction mechanism is based on the 75-species 529-step comprehensive reaction model of ethylene and acetylene, developed by the University of Southern California [35].
As shown in Table 1, the detonation wave’s temperature, pressure, and velocity achieve great agreement with CEA results.

2.2. Physical Model of Detonation Tube

The numerical simulation is carried out in a 60 mm × 60 mm × 1000 mm rectangular combustor, where 12–13 obstacles are arranged, as shown in Figure 1. The first obstacle is 100 mm away from the head of the detonation chamber. The distance between obstacles is 60 mm.

2.3. Boundary Conditions

(1)
Due to the axisymmetric structure of the model combustor, an axis boundary is set to save computational resources.
(2)
The slide adiabatic walls are adopted where T n = 0 .
(3)
The inlet boundary of the detonation tube is set as the adiabatic wall to provide thrust.
(4)
The pressure-outlet boundary specifies the backflow pressure as atmospheric pressure.

2.4. Mesh Resolution Test

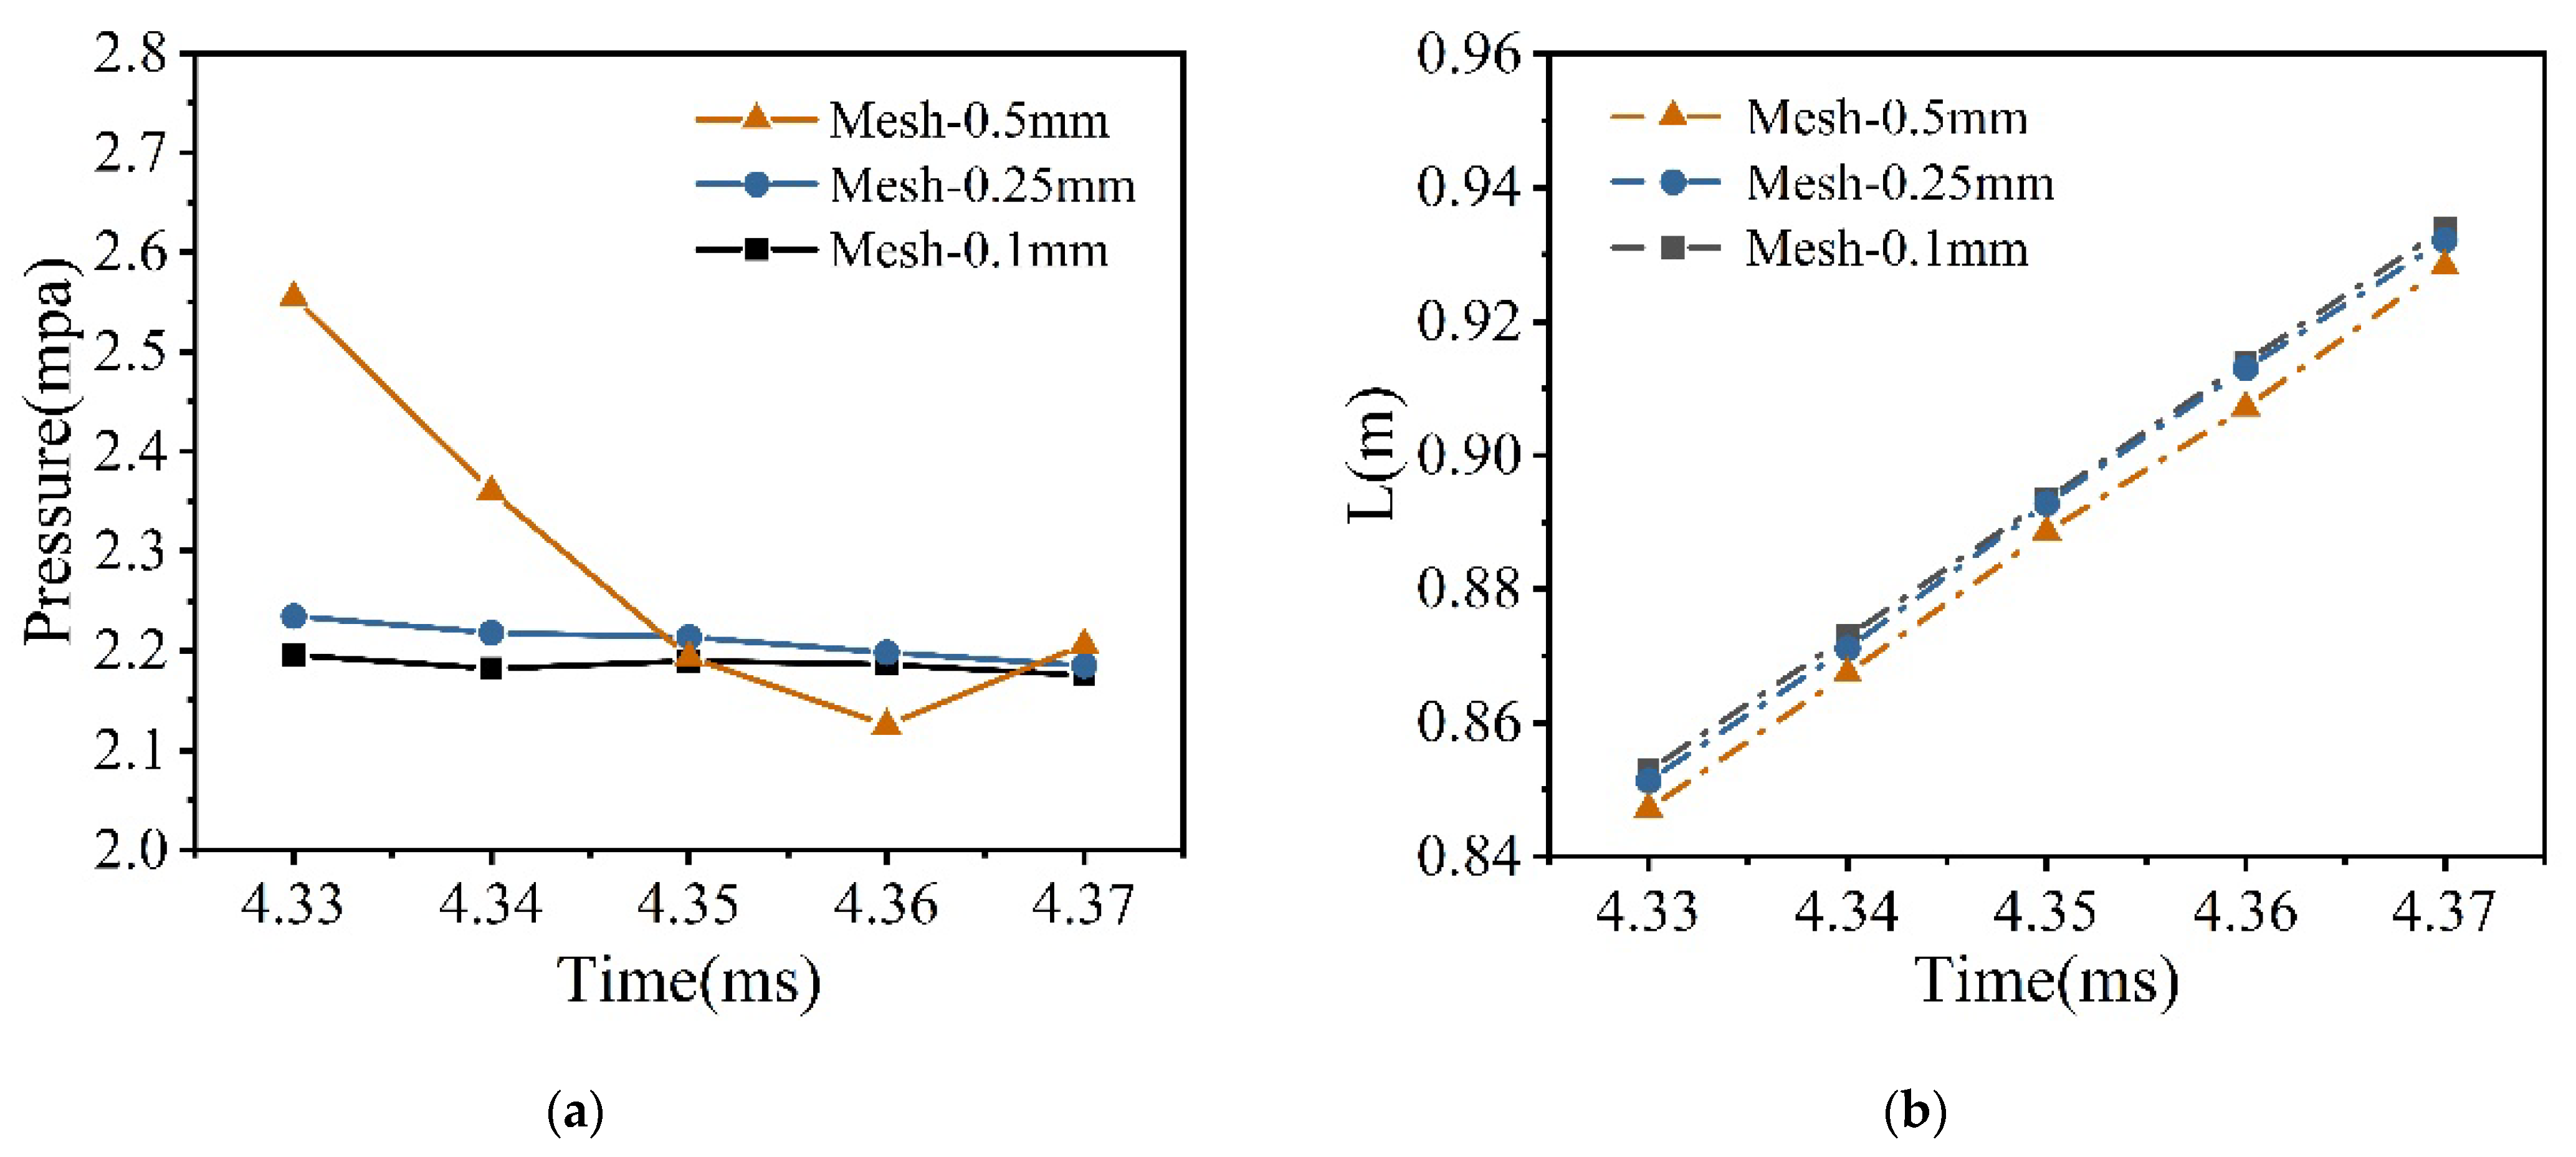
The detonation tube is divided by quadrilateral mesh. A resolution test is carried out by comparing the numerical simulation results of 0.5 mm, 0.25 mm, and 0.1 mm meshes under the premise of keeping the physical model, initial conditions, and boundary conditions unchanged. The self-sustaining detonation waves can be identified by all three scale meshes. The change in peak pressure on the central axis when the detonation wave propagates in the smooth section of the detonation tube is shown in Figure 2a. When the mesh is 0.5 mm, the peak pressure changes greatly, and the peak pressure fluctuation decreases with further refinement of the mesh and is closer to the CJ pressure. The position variation of the detonation wave propagating in the smooth section of the detonation tube is shown in Figure 2b. With the refinement of the mesh, the curves gradually tend to coincide. Considering the accuracy of calculation results and computation cost, 0.25 mm mesh is adopted in numerical simulations.
The resolution tests are further carried out as performed by Lutsenko [36] to verify the rate of convergence of the numerical method. The deviation of total time ttot (time when flame front reaches the detonation tube exit) and the deviation of maximum temperature Td and pressure pd at the tube axis are proposed. The definitions are as follows:
δ t t o t n = t t o t h n t t o t h n 1 δ T d n = max T d h n T d h n 1 δ p d n = max p d h n p d h n 1
where h0 = 1 mm, h1 = 0.5 mm, h2 = 0.25 mm, and h3 = 0.1 mm. Based on the convergence theory, the deviations should obey Equation (9):
δ n = A 0 h n A 1
where A0 is the preexponential factor and A1 is the power of convergence. The results of resolution tests are presented in Table 2; they indicate that the rate of convergence of the numerical method is close to the first-order approximation.

2.5. Arrangement of Obstacles

The blocking ratio of obstacles is not fixed but varies in four changing rules, which are “Increasing”, “Decreasing”, “First Increasing and then Decreasing (I-D)”, and “First Decreasing and then Increasing (D-I)”, respectively. In order to study the impact of variable blocking ratio obstacles on the DDT process, two dimensionless parameters are specified, “the average blocking ratio” and “the blocking ratio change rate”, which are defined as follows:
B R ¯ = B R 1 + B R 2 + B R n n
α = B R n B R n 1  
The baseline model is selected as the structure of B R ¯ = 0.43 ,   α = 0 .

3. Numerical Research of the DDT Process

3.1. Verification of the Numerical Method

The numerical method is verified by comparing it with the experiment data of Zhang [37]. In his investigation, eight obstacles (BR = 0.3) were arranged in a 2 m long square tube filled with a stoichiometric acetylene–air mixture. The ignition plug was located 180 mm away from the closed end. The spacing between the first four obstacles was 120 mm, and the spacing between the last four obstacles was 240 mm. Experiments were carried out at 302 K and atmospheric pressure.
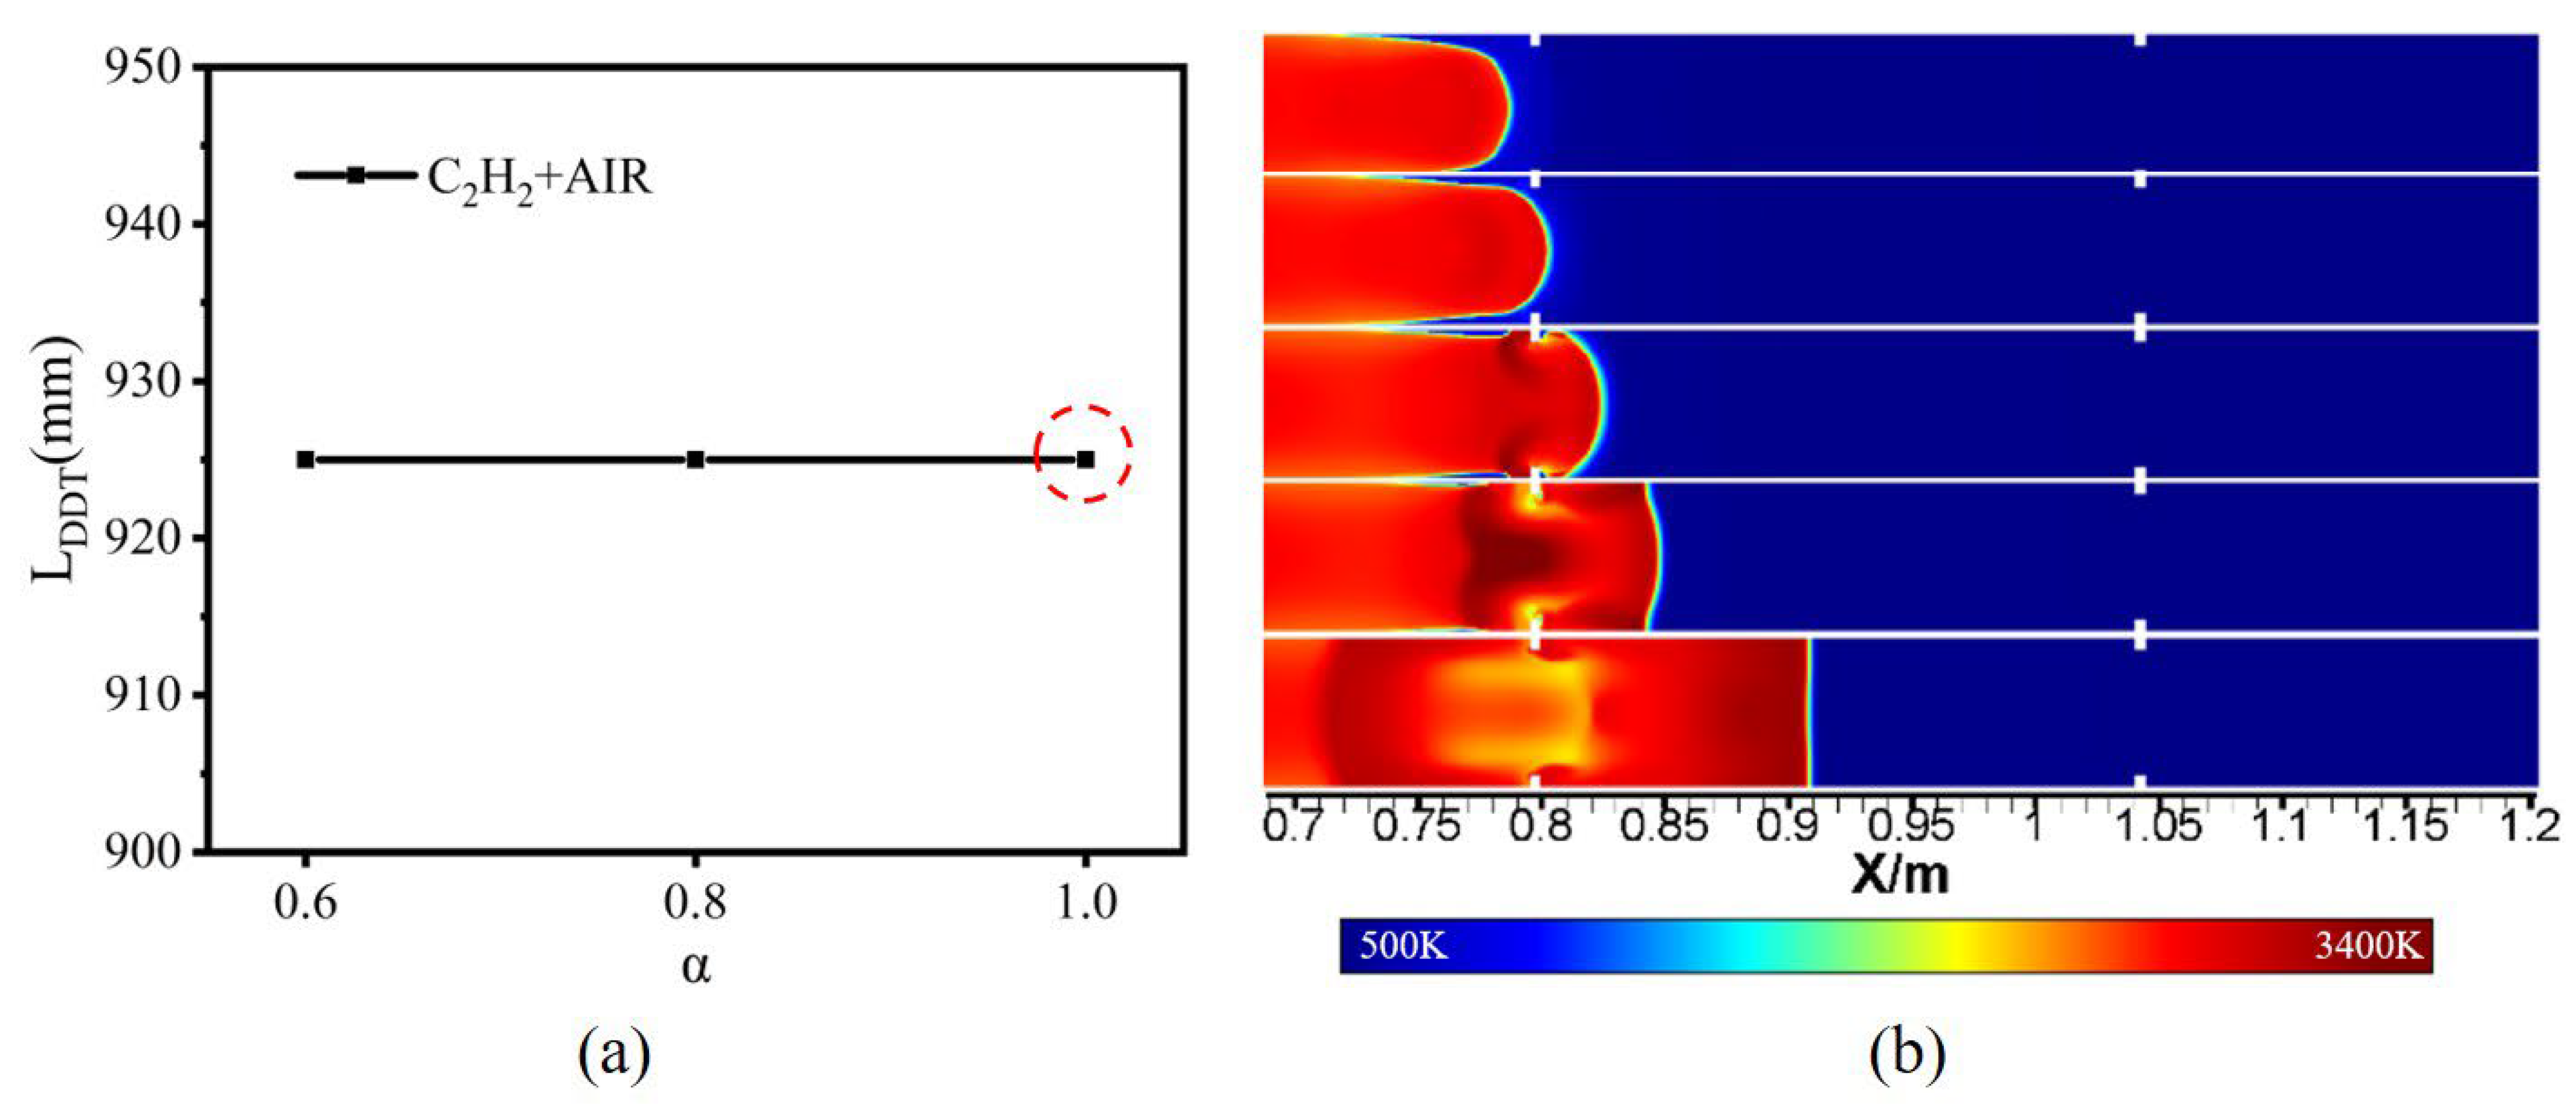
As shown in Figure 3, the DDT distance from the experiment is 925 mm. A 2-D numerical simulation was accomplished, and the experimental condition was referred to verify the numerical method. The DDT distance from the numerical simulation is 910 mm, which achieves excellent consistency with the experimental result.

3.2. The Influence of Variable Blocking Ratio Obstacles on the Propagation Process of the Deflagration Flame

The temperature contour and streamlines of the first four obstacles in the detonation combustor are shown in Figure 4. The chemical reaction rate on the flame front is relatively slow initially. The recirculation zones of different sizes positively related to the blocking ratio are formed behind obstacles. The stretch of the flame front mainly characterizes the impact of obstacles on the flame. When the blocking ratio of the obstacle is relatively large, the flame will be squeezed to the axis of the combustor, leading to an increase in the flame front area and the reaction rate. The burned material brought back by the recirculation flow will ignite the mixture behind obstacles. The effect of the obstacle on the flame front is gradually reduced when the blocking ratio decreases.
The effect of four obstacle arrangements on flame propagation velocity when B R ¯ = 0.43 and   α = 0.03 is presented in Figure 5. The blocking ratio of the first obstacle in four cases is 0.61, 0.52, 0.34, and 0.25, respectively. The growth trends of axial velocity are similar in the smooth tube at the beginning. When passing through the obstacle, the flame front is squeezed and stretched by the recirculation flow around the obstacle. The larger the blocking ratio, the greater the acceleration effect of the flame front. The flame front will maintain the propagation velocity until approaching the next obstacle. Four distinct acceleration processes corresponding to four obstacles are observed. Among the four arrangements of blocking ratio, α = −0.03 has the best acceleration effect, with a final propagation velocity of 452 m/s. In contrast, α = +0.03 has the worst effect, with a final propagation velocity of 287 m/s.
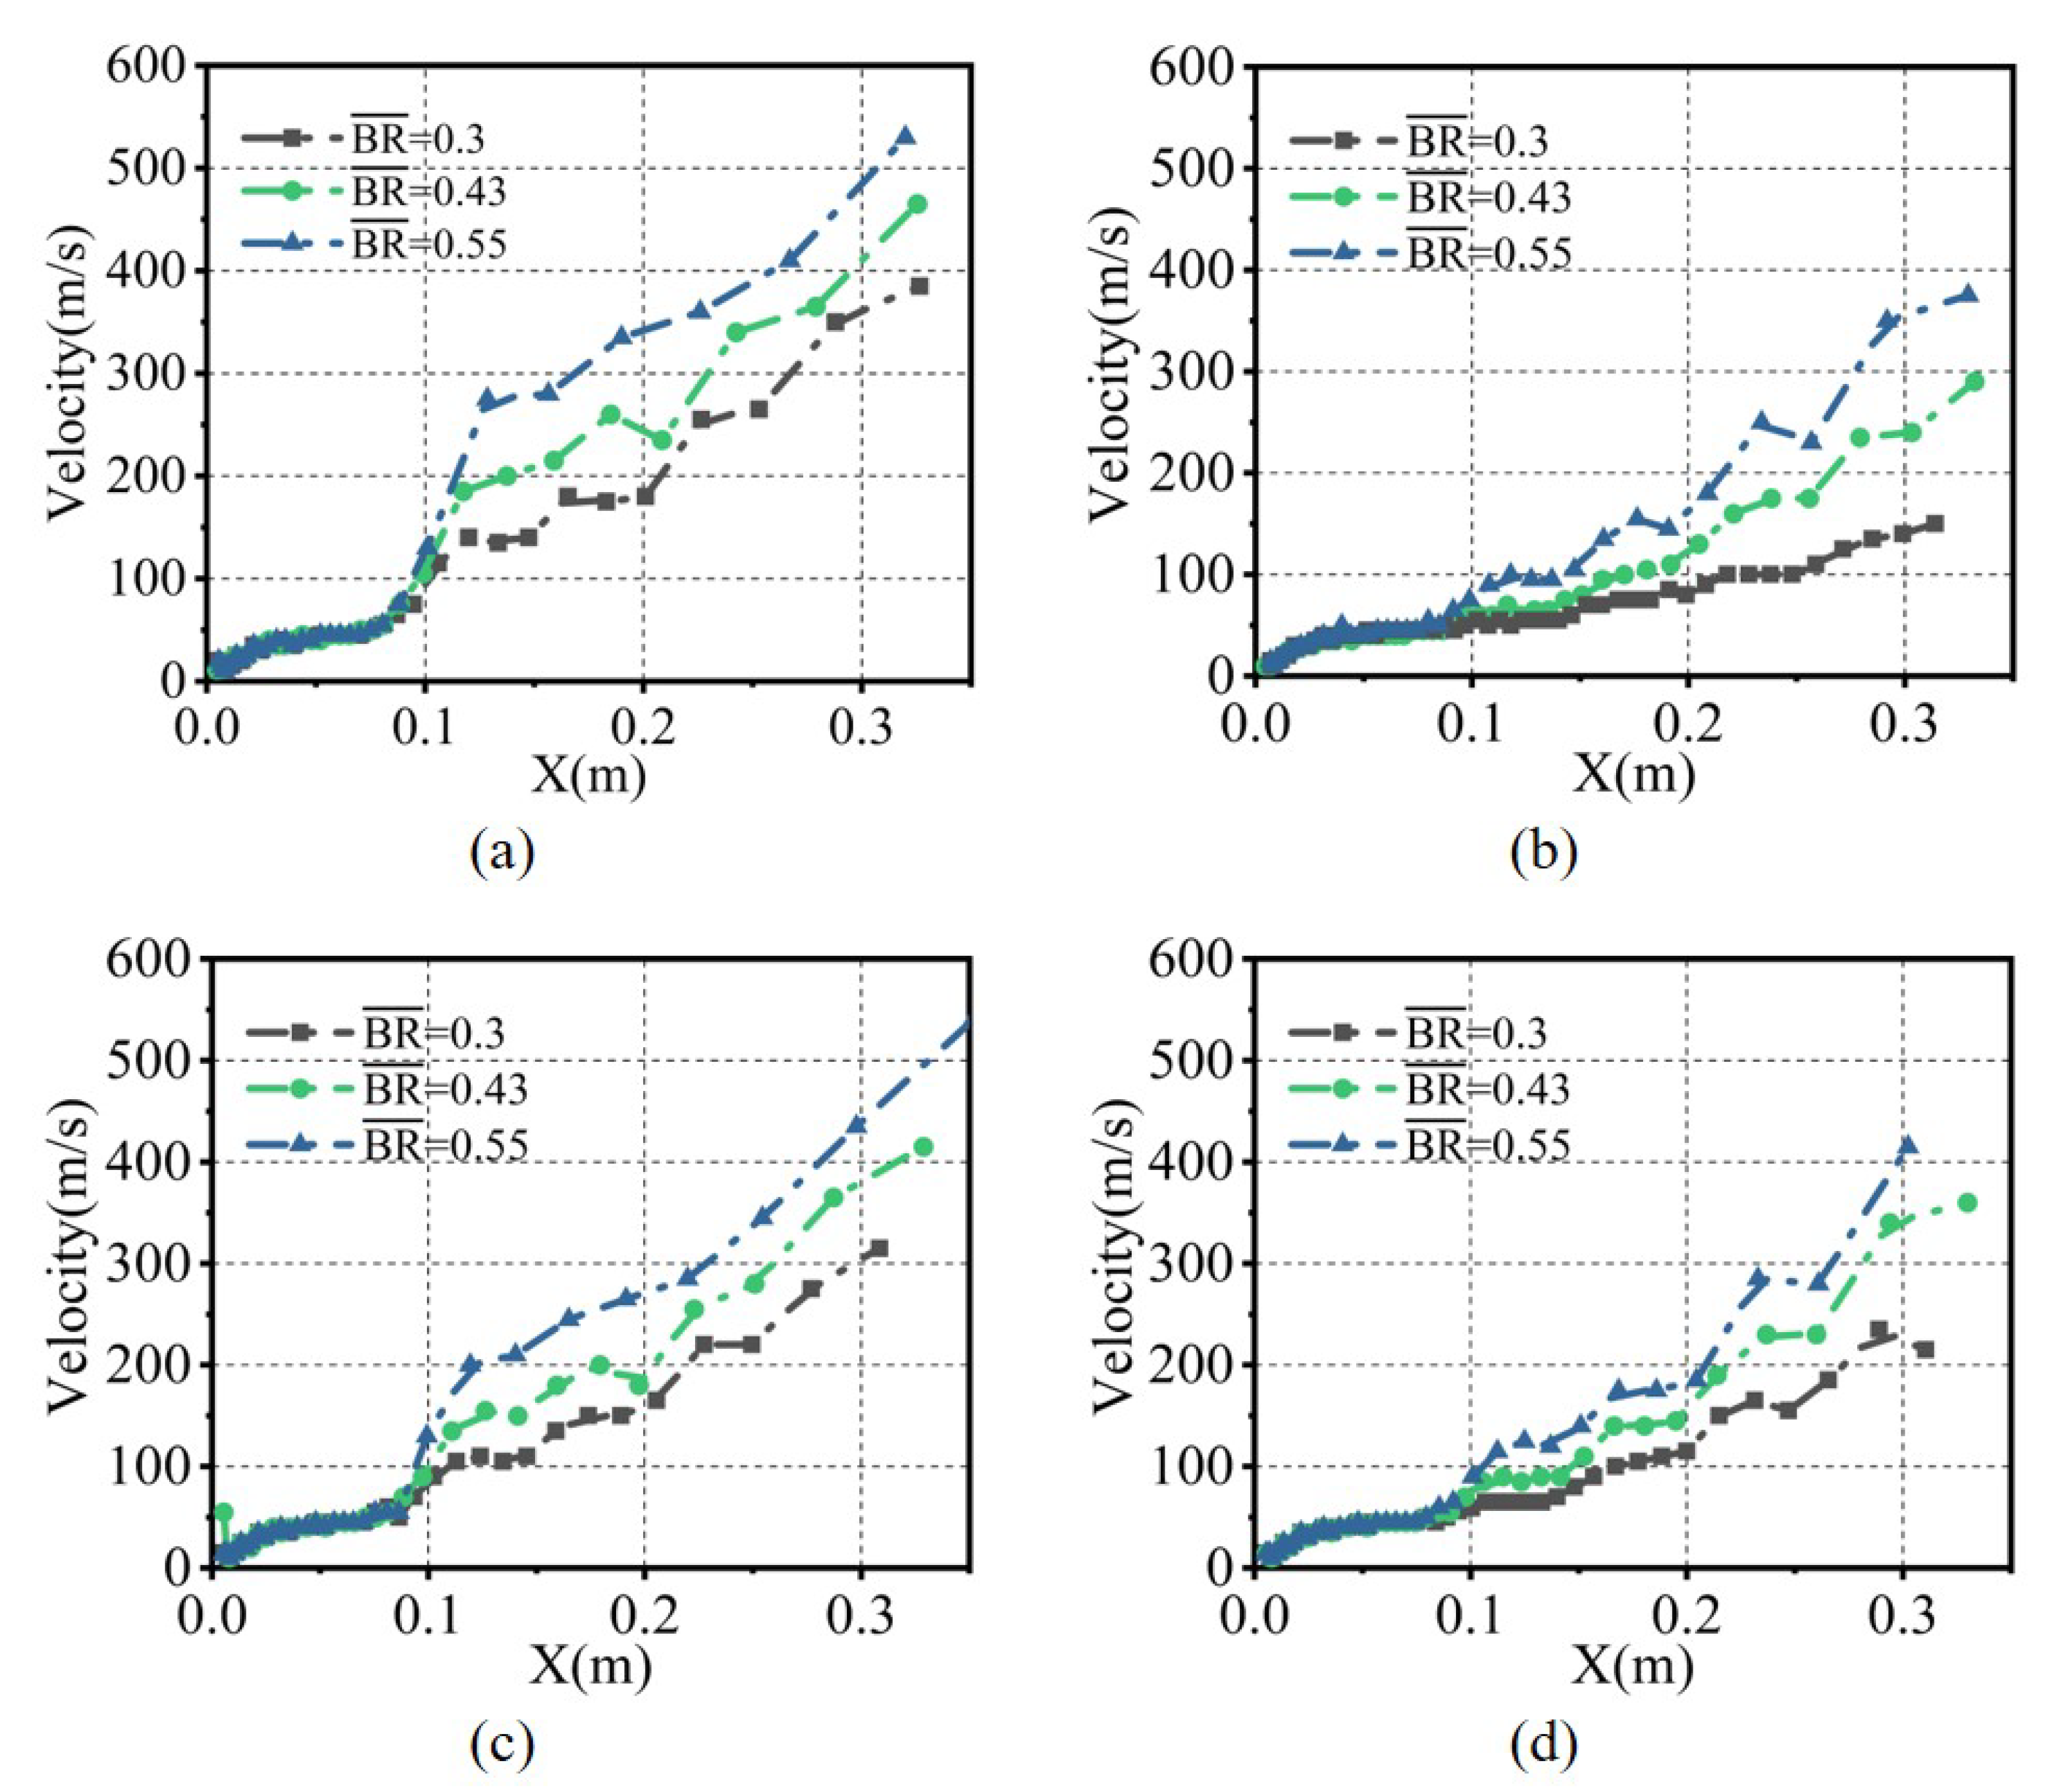
The effect of B R ¯ on flame propagation velocity with four obstacle arrangements when|α| = 0.03 is presented in Figure 6. With the increase in B R ¯ , the acceleration effect on the flame front is enhanced. In Figure 6a,c, the flame propagation velocity significantly rises when passing the first obstacle. After that, the variation of propagation velocity curves with different B R ¯ values are similar. Thus, the effect of different B R ¯ values on the flame-spreading processes with “Decreasing” and “D-I” arrangements is mainly through the first obstacle. Conversely, the acceleration of the flame front increases when passing each obstacle, as shown in Figure 6b,d. In other words, the BR affects the flame-spreading process through every obstacle with “Increasing” and “I-D” arrangements.
The effect of |α| on flame propagation velocity with four obstacle arrangements when B R ¯   = 0.43 is shown in Figure 7. When the mean deviation of the blocking ratio is small, |α| has little influence on the flame propagation process. As shown in Figure 3, Figure 4, Figure 5 and Figure 6c,d, the propagation velocity curves are almost coincident. However, with the increase in the blocking ratio deviation, the effect of |α| on flame propagation becomes larger. Figure 3, Figure 4, Figure 5 and Figure 6a,b show that the propagation velocity grows faster when α decreases.

3.3. Impact of Obstacles with Variable Blocking Ratio on DDT Distance and the Generation of “Hot Spots”

The previous section investigated the impact of B R ¯ and|α|with four different obstacle arrangements on the flame acceleration process at the first four obstacles. However, as the flame reaches downstream of the combustor, the temperature, propagation velocity, and pressure of the flame front are already elevated. Thus, it is significant to investigate the effect of obstacles with variable blocking ratio when flame propagation velocity is high.
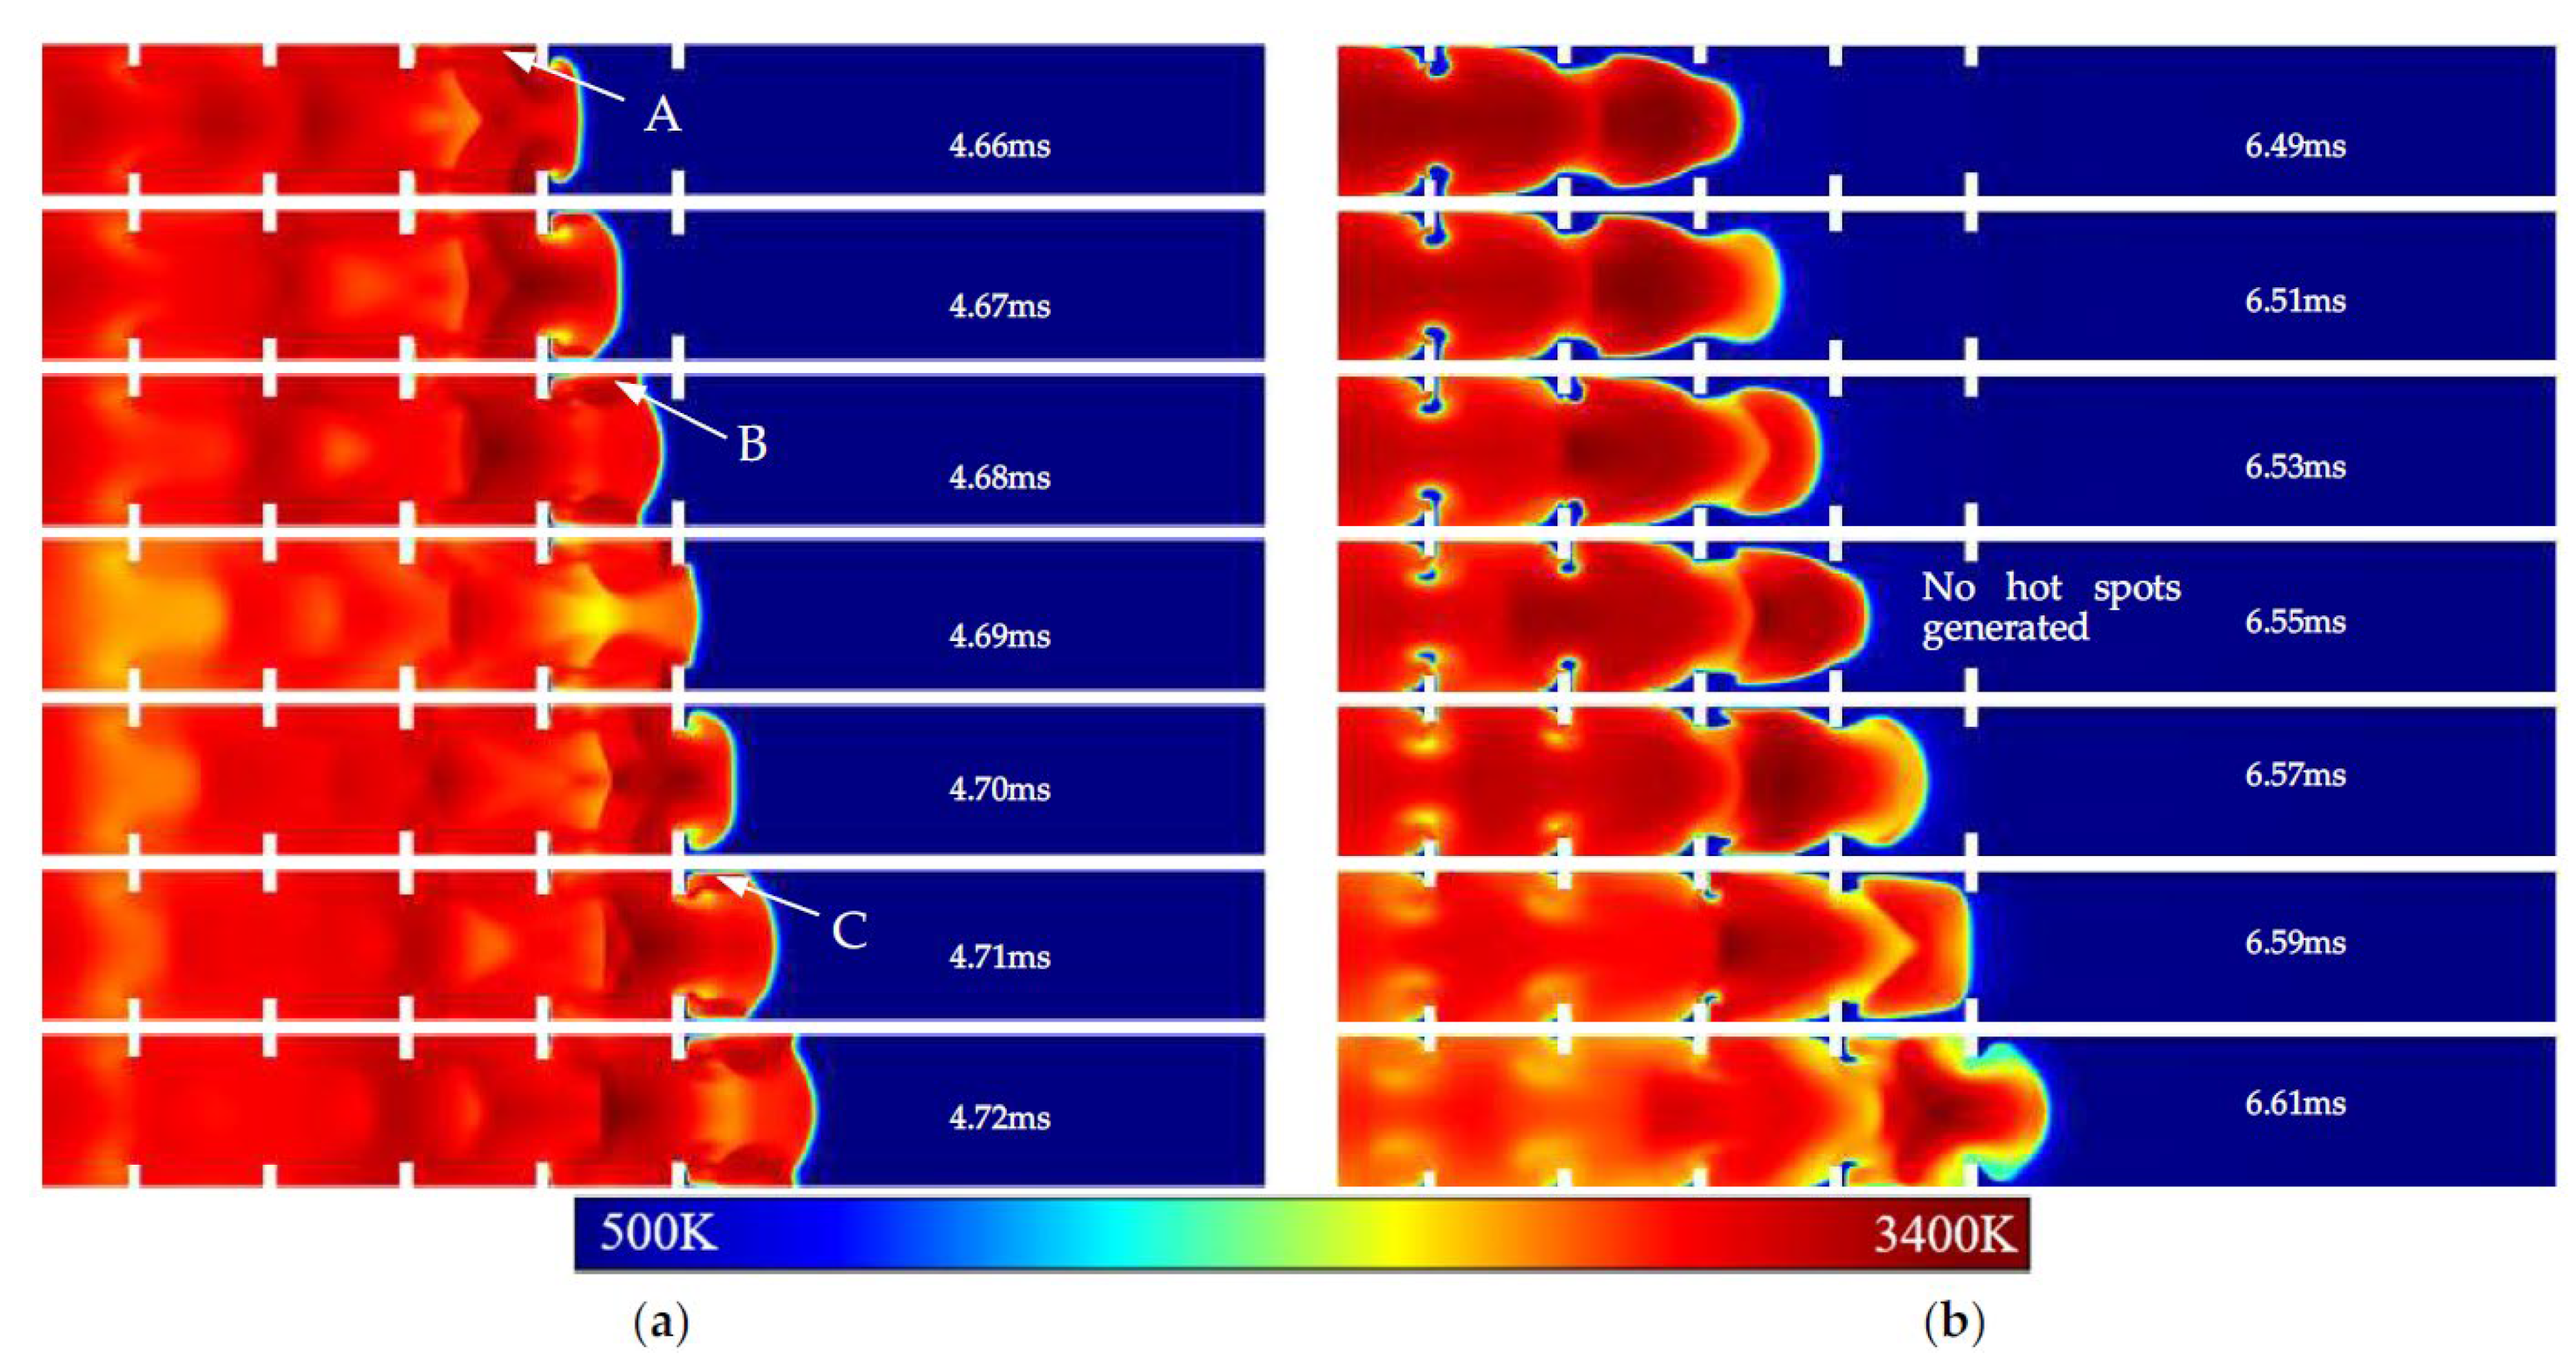
Flame propagation processes with or without “hot spots” are presented in Figure 8a,b, respectively. Since the pressure in the reacting zone is high, the flame front propagates towards the combustor wall as soon as it passes through the obstacles, which is different from the flame propagation process at a low speed. In this high-speed propagation region, the role of the obstacle is to provide a plane for shock reflection and diffraction rather than to stretch the flame front. The “hot spots” are divided into two categories depending on whether a self-sustained detonation wave is formed: “effective hot spots” and “noneffective hot spots”. The “noneffective hot spots” always appear on the corner of the obstacle. Since the overdriven detonation wave from “noneffective hot spots” is blocked by obstacles when propagating downstream, it is difficult for it to catch up with the main flame front and form a C-J detonation wave. The formation of “effective hot spots” relies on shock waves and combustor walls. Without the blocking effect of the obstacle, the overdriven detonation waves can overtake the main flame front and continue providing energy. Thereupon, a self-sustained detonation wave is generated. The flame propagation process without “hot spots” is presented in Figure 8b. The blocking ratio is relatively small compared to the case in Figure 8a. The “hot spot” is not generated due to the lack of turbulence intensity. Thus, the flame propagation remains in the deflagration mode and is the same as the process in Figure 4.
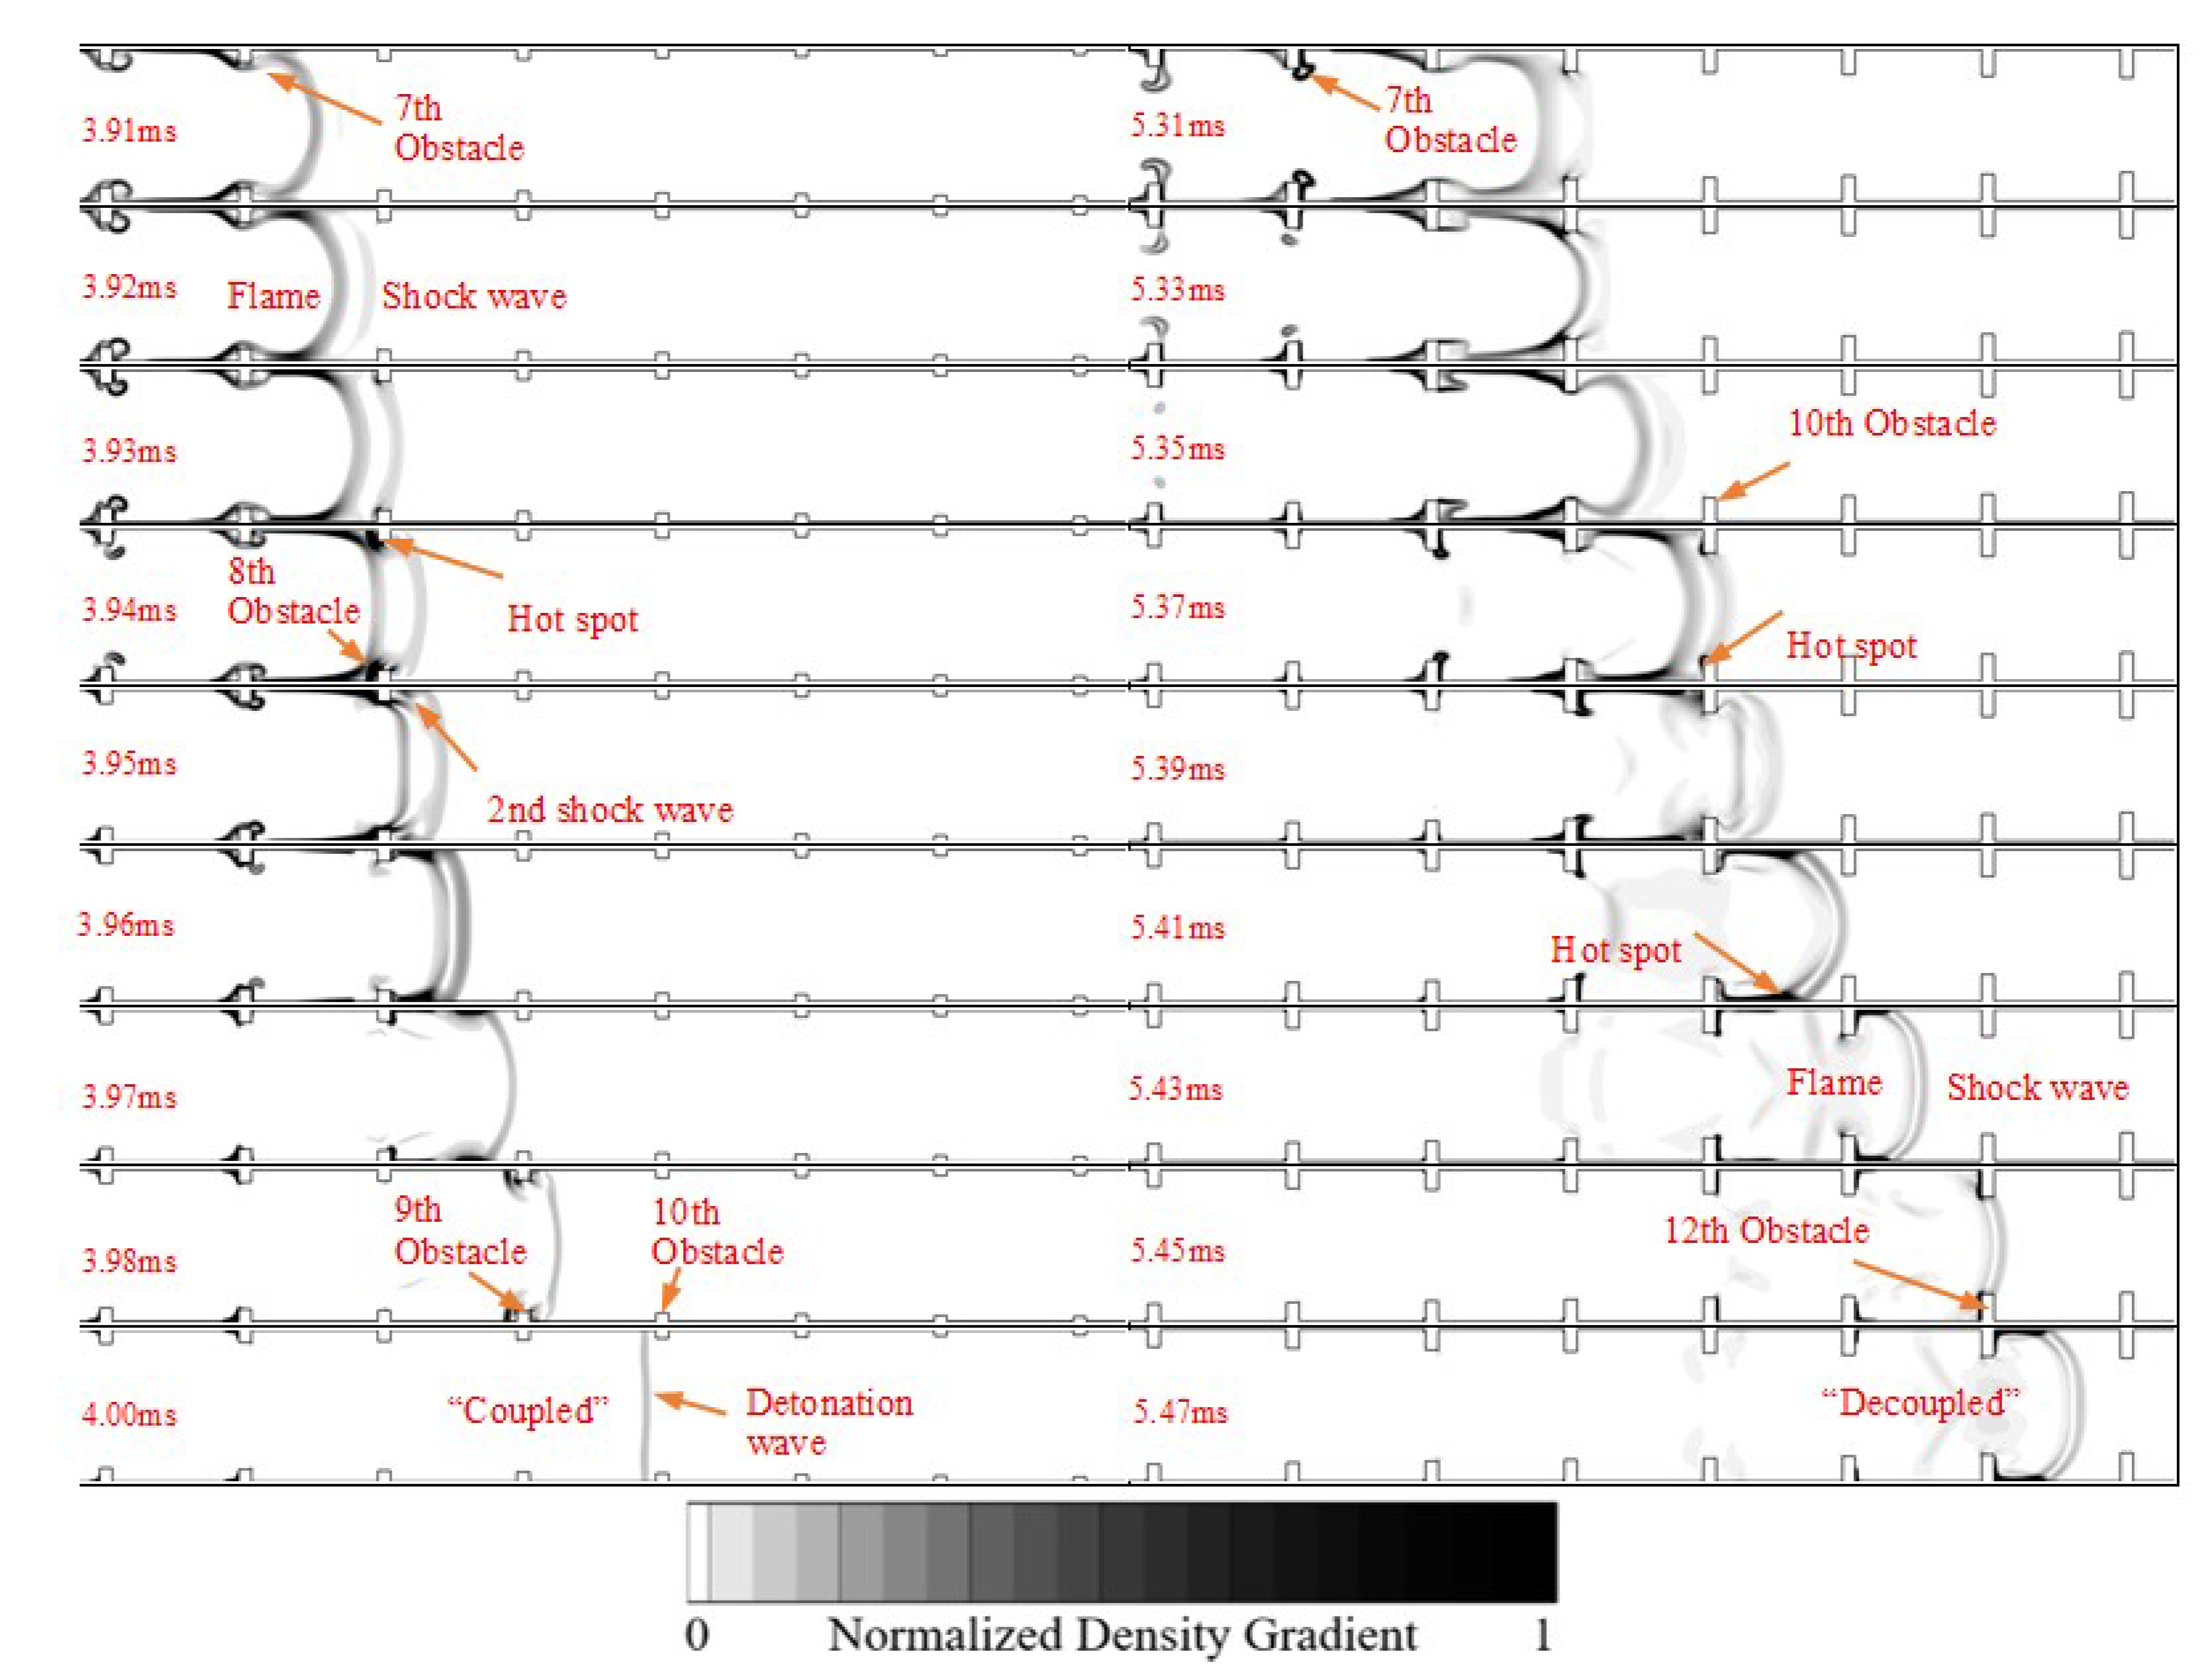
The influence of obstacles with different α on the flame front and leading shock wave is investigated through a density gradient contour, as shown in Figure 9. Due to different obstacle arrangements, the blocking ratios of last six obstacles are 0.28, 0.26, 0.24, 0.22, 0.2, and 0.18 in Figure 9 (left) and 0.33, 0.36, 0.39, 0.42, 0.45, and 0.48 in Figure 9 (right), respectively. Since the initial propagation velocity of the flame front is relatively low, the intensity of the leading shock wave in front of the flame front is also weak. With the increase in flame propagation velocity, the intensity of the leading shock wave gradually increases too. When the shock wave sweeps over the obstacle, reflection and diffraction will occur on the surface of obstacle, forming a second shock wave. The newly generated shock wave propagates downstream at a higher speed and catches up with the leading one. On the one hand, the strength of the leading shock wave is enhanced. On the other, the flame front behind the shock wave is accelerated. Compared with stretching the flame front to increase the flame propagation velocity, providing a reflection and diffraction surface for shock waves is proved to be the leading cause of the flame acceleration at this stage again. In Figure 9 (left), a leading shock wave appears between the seventh and eighth obstacles. Subsequently, a “hot spot” is formed at the corner of the eighth obstacle, generating a second shock wave propagating downstream. Then the flame front and the leading shock wave are coupled between the 9th and 10th obstacles, and the detonation wave propagates through the obstacles without decoupling. In Figure 9 (right), since the blocking ratios of the last six obstacles are relatively large, the flame front and leading shock wave are not coupled even though the pressure and temperature in the reaction zone have reached the C-J level. This “decoupled” mode is maintained until the flame reaches the smooth wall region (without obstacles), forming a self-sustained detonation wave.
The effect of B R ¯ on the evolution process of pressure at the flame front with four obstacle arrangements when |α| = 0.03 is presented in Figure 10. In the initial stage of the flame propagation process, the pressure increases gradually, which is the same as the velocity acceleration process described above. When the flame spreads to the intermediate region of the detonation combustor, under the influence of the local detonation wave generated by the” hot spot”, the pressure value rises rapidly to the C-J level. Then, the pressure curve oscillates up and down, corresponding to the “detonation–extinction–re-detonation” process. During this period, the self-sustained detonation wave is hard to form due to the large blocking ratio of obstacles. According to the rising location of the pressure curves, the combustor with obstacles of a smaller average blocking ratio needs a longer “preparation distance” before the generation of “hot spots”.
Nevertheless, it is not necessarily that the larger the values of B R ¯ , the better the DDT performance. The position of the first “hot spot” is the same when B R ¯ = 0.43 and 0.55, according to Figure 10a,c. Increasing the B R ¯ does not necessarily advance the position of “hot spots”. On the other hand, the pressure at the flame front with a higher average blocking ratio is gradually reduced in an oscillatory manner at the intermediate region of the detonation combustor, as shown in Figure 10b,c.
The effect of |α| on the evolution process of pressure at the flame front with four obstacle arrangements when   B R ¯ = 0.43 is presented in Figure 11. The rise of the pressure curves has been analyzed above since the energy brought by “hot spots”, including internal energy, pressure potential energy, and kinetic energy, is only related to the fuel’s inherent properties. The slope of pressure curves with various B R ¯ and obstacle arrangements are consistent when “hot spot” occurs. The formation of the first “hot spot” with “Decreasing” and “Increasing” arrangements is more sensitive to |α|, as shown in Figure 11a,b, respectively. Raising the value of α leads to a “delay” of the first “hot spot”. As shown in Figure 11c, the increase in |α| causes the elevation of mean pressure in the intermediate region of the detonation combustor with the “D-I” arrangement. However, |α| does not influence the evolution process of pressure with the “I-D” arrangement according to Figure 11d.
The partial numerical simulation results with B R ¯ = 0.43 are listed in Table 3. Variable blocking ratio cases can effectively reduce the axial location of the first hot spot and the DDT distance compared with the fixed blocking ratio obstacle arrangement. When B R ¯ = 0.43 , |α| = 0.03, and the “D-I” obstacle arrangement is adopted, the detonation combustor achieves the best DDT distance performance.

4. Experiment Investigation Results

According to the numerical results, the detonation combustor will achieve better performance in the generation of “hot spots” and DDT distance when B R ¯ = 0.43 and |α| = 0.03. An experimental investigation was further carried out to verify the influence of four obstacle arrangements on the DDT process.

4.1. Experiment System

As shown in Figure 12, the experiment was conducted in a 60 mm × 60 mm × 1000 mm cube model combustor. The spacings of adjacent pressure sensors and obstacles were 65 mm and 60 mm, respectively. Two acrylic glass side walls were adopted for photography using a high-speed camera. The obstacles with different blocking ratios were arranged in the reserved slot.
The experimental test system is presented in Figure 13, including the gas mixing system, synchronous trigger system, and data acquisition system. The gas mixing system included an acetylene cylinder, air cylinder, gas mixing tank, pressure gauge, and vacuum pump. The vacuum pump pumped out the air in the gas mixing tank. By monitoring the pressure in the gas mixing tank, the equivalence ratio of mixing gas could be adjusted. The synchronous trigger system consisted of a signal generator and two BNC cables. One BNC cable was connected to the high-energy igniter, and the other was connected to the high-speed camera. The data acquisition system mainly included piezoelectric pressure sensors, a charge amplifier, a data acquisition instrument, and a Phantom V7.2 high-speed camera. The camera resolution was set to 512 × 64, the sampling rate was 50,000 fps, and the exposure time was 18 μs.

4.2. Experiment Results

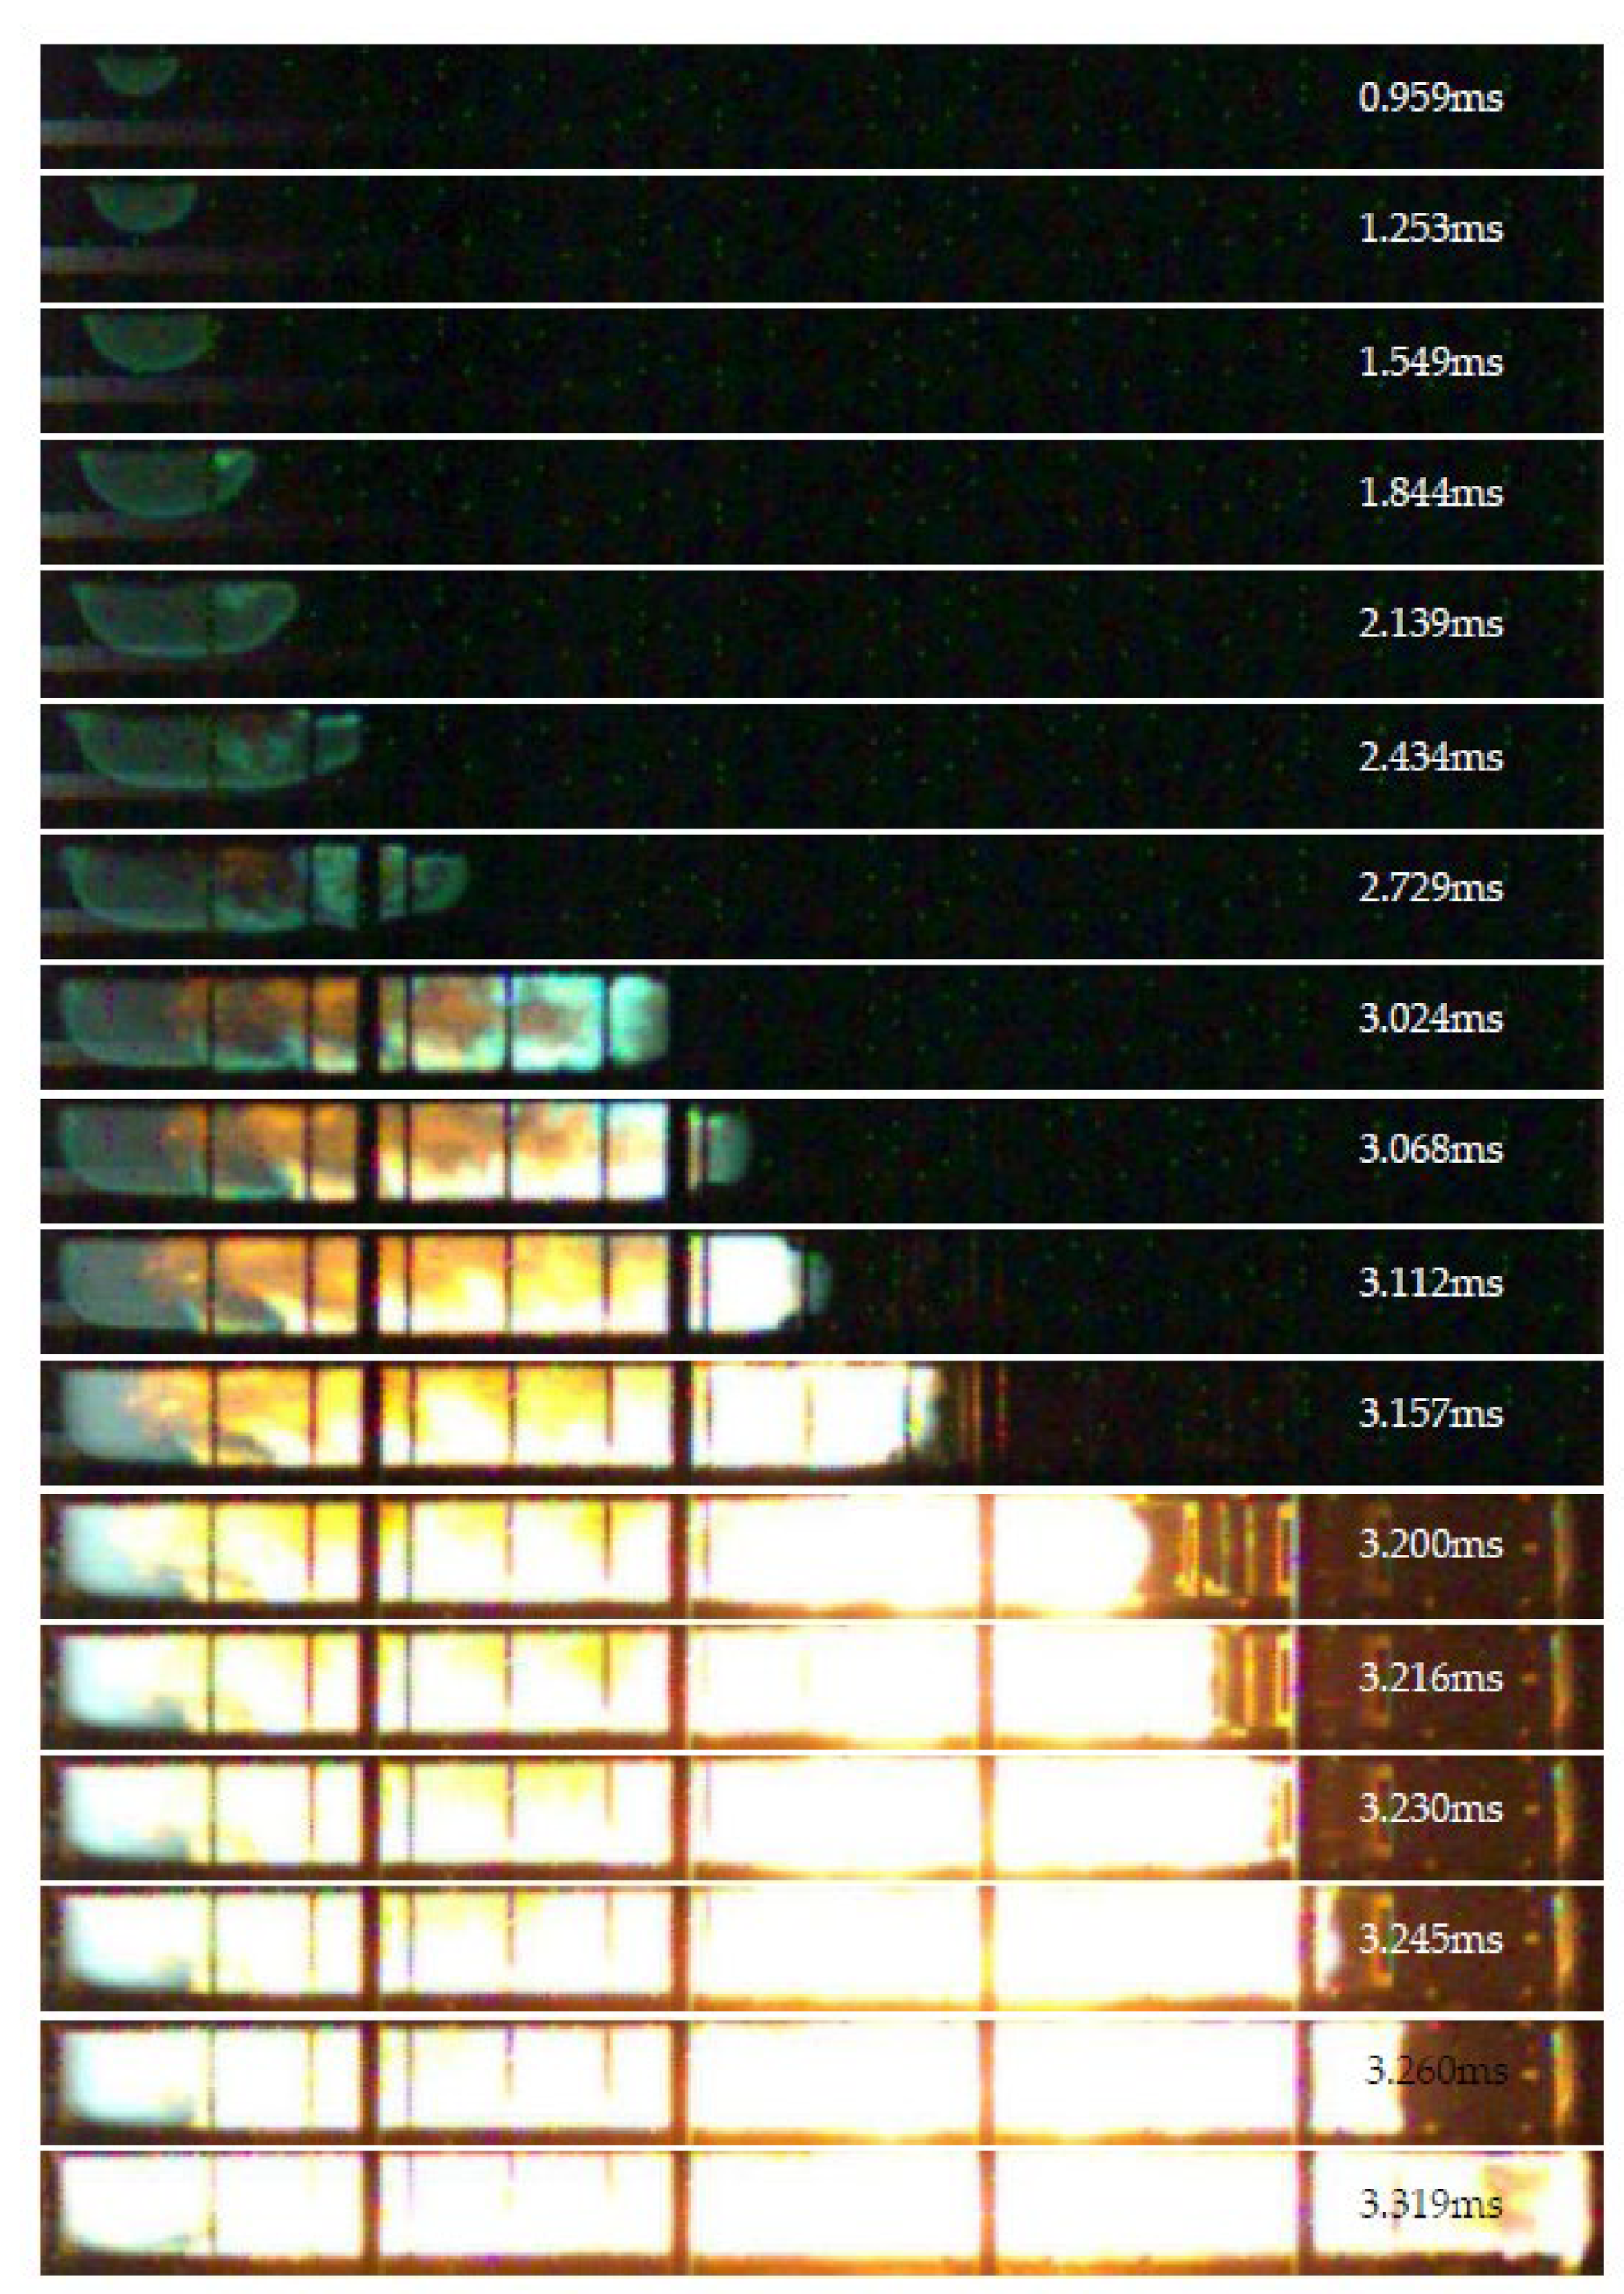
The high-speed snapshots of DDT process when B R ¯ = 0.43 and α = +0.03 are presented in Figure 14. At 0.959 ms, the deflagration flame spreads from the ignition position to the surroundings. Due to the low temperature in the reaction zone, the color in the picture is dark. At 1.844 ms, the deflagration flame’s morphological characteristics change when passing obstacles. The flame front close to the obstacle is stretched by the recirculation zone and obstacle itself, rolling upstream and igniting the unburned mixing gas at the corner of the obstacle. The temperature in the reaction zone gradually increases as the flame propagates downstream based on the color of the flame. Near the top of the obstacle, a sloping “pocket” flame appeared, similar to that observed in the numerical simulation. Two “hot spot” types are discovered at 3.157 ms and 3.200 ms, respectively. At 3.157 ms, a “hot spot” is formed inside the flame brush after sweeping over the detonation combustor wall. Later, two symmetrical bright spots are observed ahead of the flame front in the unburned gas mixture near the detonation combustor wall. Then, the overdrive detonation wave is combined with the main flame front, causing a vertical flame surface, which is an important characteristic of a detonation wave.
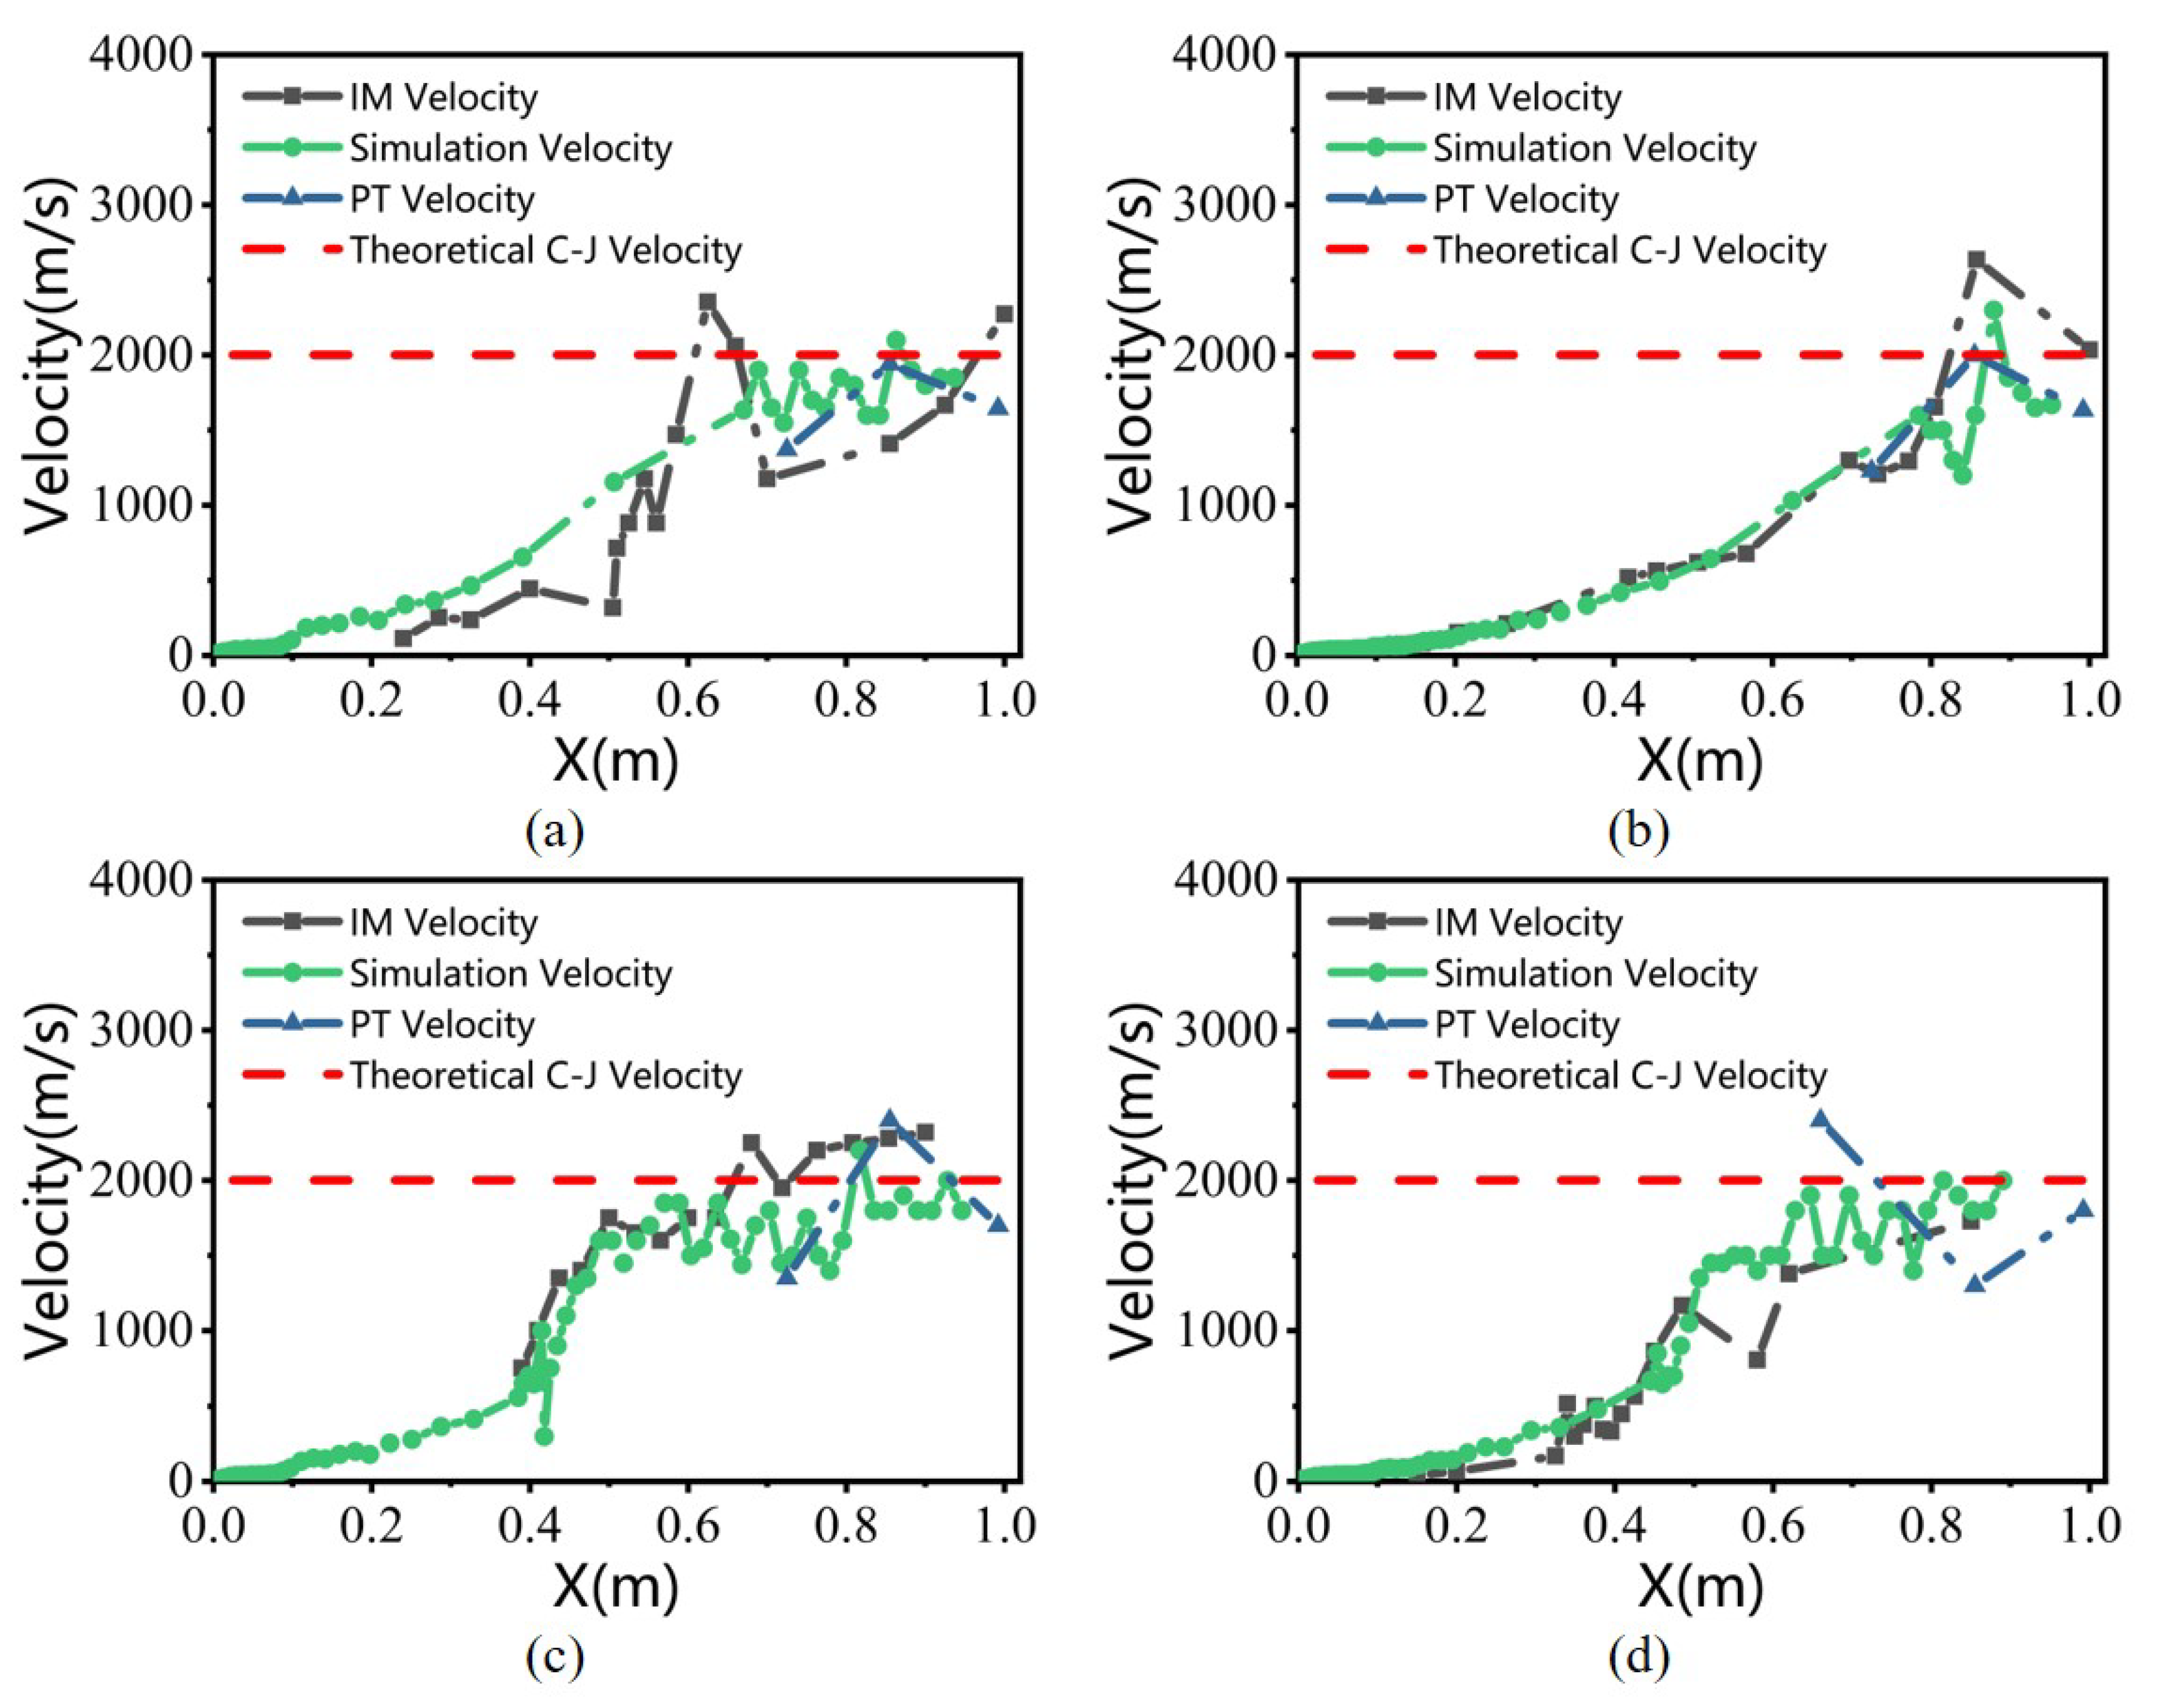
The numerical and experimental results of flame propagation velocity with four obstacle arrangements are presented in Figure 15. The image measurement (IM) curve represents the flame propagation velocity estimated from snapshots of the DDT process. The pressure transmitter (PT) velocity is calculated from the pressure sensor signal. Both numerical and experimental curves present the velocity oscillations due to the “detonation–extinction–re-detonation” process. The “D-I” arrangement achieves the shortest distance of the first “hot spot” and DDT, the same as the conclusion of numerical simulation.

5. Conclusions

The effect of variable blocking ratio obstacles on the flame propagation process is investigated numerically and experimentally. Two dimensionless parameters, B R ¯ and α, are specified to characterize obstacle arrangements in the combustor. The flame propagation process is divided into two stages based on the propagation velocity. In the first stage, the flame propagation velocity is relatively low. The flame front is stretched by obstacles and recirculation zones, causing the acceleration of the propagation process. Regarding the second stage, the reaction zone’s temperature, pressure, and propagation velocity are promoted. The effect of the recirculation zone on the flame front is weakened. The presence of obstacles increases the number of inner walls, resulting in the reflection and diffraction of shock waves. “Hot spots”, located inside or in front of the flame brush, play a vital role in the formation of detonation waves. The overdriven detonation wave generated from “hot spots” provides energy to the primary reaction zone, promoting the formation of a self-sustained detonation wave. Compared with the fixed blocking ratio obstacles, the variable blocking ratio obstacles can shorten the DDT distance. Among all cases, when BR = 0.43, |α| = 0.03, and the “D-I” obstacle arrangement is adopted, the minimum DDT distance is achieved. The research in this paper can provide a reference for further investigation on shortening the detonation combustor distance.

Author Contributions

Conceptualization, X.H.; Methodology, X.H. and X.F.; Software, X.F.; Validation, X.F.; Formal Analysis, X.F.; Investigation, X.F.; Resources, X.F.; Data Curation, X.F.; Writing—Original Draft Preparation, X.F.; Writing—Review and Editing, X.F.; Visualization, X.F.; Supervision, X.H.; Project Administration, X.H. All authors have read and agreed to the published version of the manuscript.

Funding

This research was funded by the National Natural Science Foundation of China (grant number 51476135), Aeronautical Science Foundation of China (grant number 2015ZB53026), and Natural Science Foundation of Shaanxi Province of China (2020JM-149).

Conflicts of Interest

The authors declare no conflict of interest.

References

  1. Wu, Y.; Ma, F.; Yang, V. System Performance and Thermodynamic Cycle Analysis of Airbreathing Pulse Detonation Engines. J. Propuls. Power 2002, 34, 1–11. [Google Scholar] [CrossRef]
  2. Ma, F.; Choi, J.-Y.; Yang, V. Propulsive Performance of Airbreathing Pulse Detonation Engines. J. Propuls. Power 2006, 22, 1188–1203. [Google Scholar] [CrossRef]
  3. Kailasanath, K.; Patnaik, G. Pulsed Detonation Engines-What is its performance? In Proceedings of the JANINAF 24th Air breathing Propulsion Subcommittee and 36th Combustion Subcommittee Joint Meeting, CPIA Publication 692, NASA Kennedy Space Center. Cocoa Beach, FL, USA, 18–21 October 1999; Volume 1, pp. 131–140. [Google Scholar]
  4. Wang, D.; Yan, Y.; Zhang, F. Numerical simulation of shock wave imploding detonation initiation in two-stage pulse detonation engine. Hangkong Dongli Xuebao/J. Aerosp. Power 2017, 32, 942–948. [Google Scholar]
  5. Chen, X.; Tan, S.; Rong, K. Experimental and Computational Studies of Radial Incident Shock Wave Focusing. Tuijin Jishu/J. Propuls. Technol. 2017, 38, 489–497. [Google Scholar]
  6. Oran, E.S.; Gamezo, V.N. Origins of the deflagration-to-detonation transition in gas-phase combustion. Combust. Flame 2007, 148, 4. [Google Scholar] [CrossRef]
  7. Chen, Z.; Ju, Y. Theoretical analysis of the evolution from ignition kernel to flame ball and planar flame. Combust. Theory Model. 2007, 11, 427–453. [Google Scholar] [CrossRef]
  8. Daniele, S.; Mantzaras, J.; Jansohn, P. Flame front/turbulence interaction for syngas fuels in the thin reaction zones regime: Turbulent and stretched laminar flame speeds at elevated pressures and temperatures. J. Fluid Mech. 2013, 724, 36–68. [Google Scholar] [CrossRef] [Green Version]
  9. Suenaga, Y.; Yanaoka, H.; Kitano, M. Thermal and Scalar Dissipation Rates of Stretched Cylindrical Diffusion Flame. Trans. Jpn. Soc. Mech. Eng. Ser. B 2013, 79, 1685–1693. [Google Scholar] [CrossRef] [Green Version]
  10. Achasov, O.V.; Penyazkov, O.G. Dynamics study of detonation-wave cellular structure 1. Statistical properties of detonation wave front. Shock. Waves 2002, 11, 297–308. [Google Scholar] [CrossRef]
  11. Nichols, A.L. Statistical Hot Spot Model for Explosive Detonation. In Proceedings of the AIP Conference Proceedings 845, 465, College Park, MA, USA, 15–18 October 2006. [Google Scholar]
  12. Akiki, M.; Gallagher, T.P.; Menon, S. Mechanistic Approach for Simulating Hot-Spot Formations and Detonation in Polymer-Bonded Explosives. AIAA J. 2017, 55, 585–598. [Google Scholar] [CrossRef]
  13. Chapman, W.R.; Wheeler, R.V. VI.—The propagation of flame in mixtures of methane and air. Part V. The movement of the medium in which the flame travels. J. Chem. Soc. 1927, 12, 309–312. [Google Scholar] [CrossRef]
  14. Shchelkin, K.I. Instability of combustion and detonation of gases. Sov. Phys. Uspekhi 1966, 8, 780–797. [Google Scholar] [CrossRef]
  15. Shchelkin, K.I.; Troshin, Y.K. Non-stationary phenomena in the gaseous detonation front. Combust. Flame 1963, 7, 143–151. [Google Scholar] [CrossRef]
  16. Shchelkin, K.I. Two cases of unstable combustion. Sov. Phys. JETP 1959, 36, 416–420. [Google Scholar]
  17. Peraldi, O.; Knystautas, R.; Lee, J.H.S. Criterion for Transition to Detonation in Tubes. In Proceedings of the 21st Symposium (International) on Combustion, Munich, F.R. Germany, 3 August 1986. [Google Scholar]
  18. Lee, J.H.S. The Detonation Phenomenon; Cambridge University Press: Cambridge, UK, 2008; pp. 286–292. ISBN 9780511754708. [Google Scholar]
  19. Lee, J.H.; Knystautas, R.; Chan, C.K. Turbulent flame propagation in obstacle-filled tubes. Symp. Combust. 1985, 20, 1663–1672. [Google Scholar] [CrossRef]
  20. Zhao, Y.; Wang, C.; Bi, Y. LES of flame acceleration and DDT in small-scale channels. J. Loss Prev. Process Ind. 2017, 49, 745–752. [Google Scholar] [CrossRef]
  21. Kessler, D.A.; Gamezo, V.N.; Oran, E.S. Simulations of flame acceleration and deflagration-to-detonation transitions in methane–air systems. Combust. Flame 2010, 157, 2063–2077. [Google Scholar] [CrossRef]
  22. Wang, C.; Zhao, Y.; Han, W. Effect of Heat-Loss Boundary on Flame Acceleration and Deflagration-to-Detonation Transition in Narrow Channels. Combust. Sci. Technol. 2017, 189, 1605–1623. [Google Scholar] [CrossRef]
  23. Gamezo, V.N.; Ogawa, T.; Oran, E.S. Flame acceleration and DDT in channels with obstacles: Effect of obstacle spacing. Combust. Flame 2008, 155, 302–315. [Google Scholar] [CrossRef]
  24. Na’Inna, A.M.; Phylaktou, H.N.; Andrews, G.E. Effects of Obstacle Separation Distance on Gas Explosions: The Influence of Obstacle Blockage Ratio. Procedia Eng. 2014, 84, 306–319. [Google Scholar] [CrossRef] [Green Version]
  25. Sun, X.; Lu, S. Effect of orifice plate on the transmission mechanism of a detonation wave in hydrogen-oxygen mixtures. Int. J. Hydrogen Energy 2020, 45, 12593–12603. [Google Scholar] [CrossRef]
  26. Sun, X.; Li, Q.; Xu, M.; Wang, L.; Guo, J.; Lu, S. Experimental study on the detonation propagation behaviors through a small-bore orifice plate in hydrogen-air mixtures. Int. J. Hydrogen Energy 2019, 44, 15523–15535. [Google Scholar] [CrossRef]
  27. Wang, L.Q.; Ma, H.H.; Shen, Z.W.; Lin, M.J.; Li, X.J. Experimental study of detonation propagation in a square tube filled with orifice plates. Int. J. Hydrogen Energy 2018, 43, 4645–4656. [Google Scholar] [CrossRef]
  28. Rainsford, G.; Aulakh DJ, S.; Ciccarelli, G. Visualization of detonation propagation in a round tube equipped with repeating orifice plates. Combust. Flame 2018, 198, 205–221. [Google Scholar] [CrossRef] [Green Version]
  29. Sun, X.; Li, Q.; Li, C.; Lu, S. Detonation propagation characteristics for CH4-2H2-3O2 mixtures in a tube filled with orifice plates. Int. J. Hydrogen Energy 2019, 44, 7616–7627. [Google Scholar] [CrossRef]
  30. Sun, X.; Lu, S. Effect of orifice shapes on the detonation transmission in 2H2–O2 mixture. Int. J. Hydrogen Energy 2020, 45, 2360–2367. [Google Scholar] [CrossRef]
  31. Sun, X.; Lu, S. Effect of obstacle thickness on the propagation mechanisms of a detonation wave. Energy 2020, 198, 117186. [Google Scholar] [CrossRef]
  32. Ahumada, C.B.; Mannan, M.S.; Wang, Q.; Petersen, E.L. Hydrogen detonation onset behind two obstructions with unequal blockage ratio and opening geometry. Int. J. Hydrogen Energy 2022, 47, 31468–31480. [Google Scholar] [CrossRef]
  33. Issa, R.I. Solution of the implicitly discretised fluid flow equations by operator-splitting. J. Comput. Phys. 1991, 62, 40–65. [Google Scholar] [CrossRef]
  34. Gordon, S.; McBride, B.J. Computer Program for Calculation of Complex Chemical Equilibrium Compositions and Applications. Part 1: Analysis, NASA Reference Publication 1311. Available online: https://ntrs.nasa.gov/citations/19950013764 (accessed on 1 October 1994).
  35. Wang, H.; You, X.; Joshi, A.V.; Davis, S.G.; Laskin, A.; Egolfopoulos, F.; Law, C.K. USC Mech Version II. High-Temperature Combustion Reaction Model of H2/CO/C1-C4 Compounds. Available online: http://ignis.usc.edu/USC_Mech_II.htm (accessed on 1 May 2007).
  36. Lutsenko, N.A.; Fetsov, S.S. Numerical Model of Time-Dependent Gas Flows through Bed of Granular Phase Change Material. Int. J. Comput. Methods 2020, 17, 1950010. [Google Scholar] [CrossRef]
  37. Zhang, P. An Investigation on Characteristic of the Deflagration to Detonation Transition; Nanjing University of Aeronautics and Astronautics: Nanjing, China, 2009. [Google Scholar]
Figure 1. The detonation model combustor.
Energies 15 07706 g001
Figure 2. The results of mesh resolution test. (a) The change in peak pressure on the central axis; (b) the position variation of the detonation wave.
Energies 15 07706 g002
Figure 3. Comparison between experimental and numerical results. (a) Experimental results [37]; (b) numerical results.
Energies 15 07706 g003
Figure 4. The temperature contour and streamlines between the first four obstacles. (a) B R ¯ = 0.43 ,   α = 0.02 ; (b) B R ¯ = 0.43 ,   α = + 0.02 .
Energies 15 07706 g004
Figure 5. B R ¯ = 0.43 , α = 0.03 , the evolution process of flame propagation velocity with four obstacle arrangements.
Energies 15 07706 g005
Figure 6. |α| = 0.03, the effect of B R ¯ on the evolution process of flame propagation velocity with different obstacle arrangements. (a) “Decreasing”; (b) “Increasing”; (c) “D-I”; (d) “I-D”.
Energies 15 07706 g006
Figure 7. B R ¯ = 0.43, the effect of |α| on the evolution process of flame propagation velocity with different obstacle arrangements. (a) “Decreasing”; (b) “Increasing”; (c) “D-I”; (d) “I-D”.
Energies 15 07706 g007
Figure 8. Two typical flame propagation processes. (a) Flame propagation with “hot spots”; (b) flame propagation without “hot spots”.
Energies 15 07706 g008
Figure 9. Density gradient contour at different times. (left) B R ¯ = 0.3 ,   α = 0.02 ; (right) B R ¯ = 0.3 ,   α = + 0.03 .
Energies 15 07706 g009
Figure 10. |α| = 0.03, the effect of B R ¯ on the evolution process of pressure at the flame front with different obstacle arrangements. (a) “Decreasing”; (b) “Increasing”; (c) “D-I”; (d) “I-D”.
Energies 15 07706 g010
Figure 11. B R ¯ = 0.43 , the effect of |α| on the evolution process of pressure at the flame front with different obstacle arrangements. (a) “Decreasing”; (b) “Increasing”; (c) “D-I”; (d) “I-D”.
Energies 15 07706 g011
Figure 12. Arrangement of the test rig.
Energies 15 07706 g012
Figure 13. Arrangement of the experiment test system.
Energies 15 07706 g013
Figure 14. B R ¯ = 0.43 , α = +0.03, snapshots of DDT process.
Energies 15 07706 g014
Figure 15. B R ¯ = 0.43 , |α| = 0.03, numerical and experimental results of flame front axial propagation rate with different obstacle arrangements. (a) “Decreasing”; (b) “Increasing”; (c) “D-I”; (d) “I-D”.
Energies 15 07706 g015
Table 1. The reduced mechanism and CEA results of detonation wave parameters.
Model ParameterCEA12-Species 24-Step Reaction Mechanism
Temperature (K)31973200
Pressure (atm)20.8621
Velocity (m/s)20011950
Table 2. The results of resolution tests.
δ t t o t δ T d δ p d
h1 = 0.5 mm0.0038 ms182 K0.543 mpa
h2 = 0.25 mm0.00338 ms87 K0.142 mpa
h3 = 0.1 mm0.00324 ms43 K0.036 mpa
A011.6261.6453.666
A11.0341.0550.978
Table 3. Summary of numerical results.
Case No. B R ¯ αBR Changing TrendHot SpotDDT Distance
Case1-00.430 (0.43–0.43)0.573 m0.87 m
Case1-10.02(0.55–0.31)0.841 m0.919 m
Case1-2(0.31–0.55)0.566 m0.886 m
Case1-3 (0.49–0.37–0.47)0.508 m0.811 m
Case1-4 (0.37–0.49–0.39)0.557 m0.813 m
Case1-50.03(0.61–0.25)0.550 m0.848 m
Case1-6(0.25–0.61)0.613 m0.884 m
Case1-7(0.52–0.34–0.49)0501 m0.806 m
Case1-8(0.34–0.55–0.37)0.551 m0.808 m
Case1-90.04(0.67–0.19)0.515 m0.819 m
Case1-10(0.19–0.67)0.815 m0.861 m
Case1-11(0.55–0.31–0.51)0.498 m0.825 m
Case1-12(0.31–0.55–0.35)0.618 m0.783 m
Publisher’s Note: MDPI stays neutral with regard to jurisdictional claims in published maps and institutional affiliations.