Article

Investigation on Flowback Behavior of Imbibition Fracturing Fluid in Gas–Shale Multiscale Pore Structure

1
State Key Laboratory of Shale Oil and Gas Enrichment Mechanisms and Effective Development, Beijing 100083, China
2
College of Petroleum Engineering, Changzhou University, Changzhou 213164, China
*
Author to whom correspondence should be addressed.
Energies 2022, 15(20), 7802; https://doi.org/10.3390/en15207802
Submission received: 1 September 2022 / Revised: 25 September 2022 / Accepted: 27 September 2022 / Published: 21 October 2022
(This article belongs to the Special Issue Reservoir Formation Damage Analysis)

Abstract

:
To investigate the influence of flowback time and flowback difference on flowback behavior of shale fracturing fluid, we carried out the permeability test experiment of Longmaxi Formation shale under different flowback pressure gradients and analyzed the retention characteristics of water phase in shale pores and fractures after flowback by nuclear magnetic resonance (NMR) instrument. The results indicate that after flowback under the pressure gradient ranges of 0.06~0.18 MPa/cm, the content of retained water phase in shale samples ranges from 9.68% to 16.97% and the retention of fracturing fluid in shale does not decrease with the increase of flowback pressure difference. Additionally, increasing the flowback pressure difference will reduce the shale permeability damage rate, but the permeability damage rate is still above 80%. After the flowback, the water phase mainly stays in the pore space with D < 100 nm, especially in the pore space with 2~10 nm and 10~50 nm. It is extremely difficult for the water phase in the pores with D < 100 nm to flow back out. The experimental results show that the critical flowback pressure gradient for particle migration of rock powder in shale fracture surface is 0.09 MPa/cm. The research results have important guiding significance for shale gas well flowback.

1. Introduction

The successful exploitation of shale has changed the world’s energy patterns [1,2,3]. The shale oil and gas revolution in the United States directly changed the United States from an oil importer to an oil exporter [4,5]. To speed up the exploration and development of shale gas, China has established two national shale gas development demonstration zones, “Chongqing Fuling” and “Changning-weiyuan” [6]. Hydraulic fracturing technology is the most successful technology for developing shale gas at present. More than 10,000 square meters of fracturing fluid is pumped into shale reservoir, but the flowback rate is usually lower than 50% and a large amount of fracturing fluid still remains in shale reservoirs [7,8,9,10]. The production practice shows that some of the same shale gas blocks have a high flowback rate, while others have a low flowback rate, and there is no obvious correlation between them and a single well production of shale gas wells [11,12,13]. So, it is of great significance to investigate the flowback behavior of the imbibed fracturing fluid in shale reservoirs and its influence on gas permeability for formulating a reasonable flowback system.
The distribution of fracturing fluid in shale is multiscale. During the shut-in time of a shale gas well, the fracturing fluid would enter micro-nano pores and matrix nano pores from the fracture network on account of bottom hole positive pressure difference, capillary force, and ionic osmotic pressure [14]. There are several mainstream views on the reasons for low flowback rate of fracturing fluid in shale gas reservoirs: (1) The fracture closed during well shut-in, blocking the connection with the mainstream seepage channel, and the fracturing fluid could not flow out of the reservoir smoothly [15,16]. Liu et al. [17] constructed a series of 3D numerical models based on the petrophysical parameters, fluid characteristics, and operational constraints of the Horn River shale gas reservoir. As the pressure in the fracture decreases, the water in the fracture closed is replaced into the matrix and gravity segregation may lead to water accumulating near the bottom of a vertical planar fracture. The water in the matrix and vertical planar fracture would not be flowback. The high capillary force and complex pore structure of shale prevent the fracturing fluid from the shale [9,18,19]. Ghanbari et al. interpret the flowback data of an 18-well pad completed in the Horn River Basin and proposed that the complexity of fracture network created during the hydraulic fracturing process has a great effect on fluid recovery and gas production [20]. Liu et al. [21] analyzed the reasons for the low flowback rate of Fuling shale gas fracturing fluid through imbibition and nuclear magnetic resonance (NMR) experiments, and the results indicated that highly developed bedding fractures play key roles.
The pressure difference, timing, and rate of fracturing fluid would all affect the production of shale gas wells [22]. Yang et al. demonstrated that even if the pressure gradient reaches 22.1~62.6 MPa/m, a large amount of fracturing fluid still remains in the shale reservoir. Appropriately increasing the shut-in time will make more fracturing fluid sealed in the shale reservoir in situ, which is beneficial for increasing the production of shale gas well [13]. Liu et al. [11] carried out a statistical analysis on the production and flowback rate of shale gas wells in the Changning gas field in China and showed that the higher the flowback rate of fracturing fluid, the lower the production of shale gas wells. You et al. put forward the concept of zero flowback of fracturing fluid in a shale gas reservoir and pointed out that more fracturing fluid can stay in shale gas reservoir by increasing the soaking time and changing the properties of fracturing fluid [22].
Although scholars have carried out significant research on shale fracturing fluid flowback, there are few investigations on the distribution characteristics of fracturing fluid in shale pore structures after flowback and the response characteristics of shale permeability to flowback pressure difference. In this paper, we carried out the permeability test experiment on Longmaxi Formation shale under different flowback pressure gradients and analyzed the retention characteristics of the water phase in shale pores and fractures after flowback using NMR methods. The paper consists of three main parts. The next section is the introduction of the experimental samples and the process. The third part is the response characteristics of shale gas permeability to fracturing fluid flowback behavior and the distribution characteristics of water phase in shale pore structure after flowback. The conclusions are given in the last section.

2. Materials and Methods

2.1. Characterization of Shale Samples

The shale samples were selected from the Longmaxi Formation of Well WY-1. The XRD results demonstrate that the mineral components of the experimental samples are mainly quartz and clay minerals, with a small amount of feldspar, calcite, and pyrite. The content of quartz is between 30.6% and 72.8%, and the content of clay minerals is between 12.2% and 48.9%. The total organic carbon content (TOC) of the samples ranged from 2.14% to 3.85%, with an average of 2.67%. Table 1 shows the basic physical properties of the experimental samples. The porosity of five shale samples ranges from 5.63% to 7.16%. The NMR results after pressurized distilled water show (Figure 1) that the T2 (lateral relaxation time) map of five shale samples show double-peak distribution, with the left peak T2 ranging from 0.01 to 10.72 ms and the right peak T2 ranging from 10.72 to 200.92 ms. There is no obvious difference in the T2 spectra, indicating that the pore and slit structures of the experimental samples are basically the same.

2.2. Experimental Procedures

There are four production systems in Well WY-1 after fracturing operation, which are 7 mm nozzle × 16.00 mm orifice plate, 8 mm nozzle × 16.00 mm orifice plate, 10 mm nozzle × 26.00 mm orifice plate, and 9 mm nozzle × 22.00 mm orifice plate, respectively (Table 2). The corresponding bottom-hole flowing pressures of the target layer with a vertical depth of 3607.49 m under four flowback systems are 57.42 MPa, 51.40 MPa, 42.58 MPa, and 40.39 MPa, respectively. The formation pressure coefficient in the middle of the target formation is 1.99 and the pore pressure is 70.35 Mpa. According to Equation (1), the pressure gradient of the flowback pressure under four production systems should be calculated.
Δ P = ( P P P f ) / l
where Δ P is pressure gradient, MPa/m; P P is formation pore pressure, MPa; P f is bottom hole flowing pressure, MPa; and l is the width of pressure drop funnel formed after shale reservoir is opened, which is 2 m here [24]. The calculation results show that the flowback pressure gradient of shale gas wells under four production systems is between 0.06 MPa/cm and 0.14 MPa/cm (Table 2).
During the experimental simulation of shale gas well flowback, the same pressure gradient as the four production systems was selected for flowback. At the same time, NMR was used to analyze the distribution characteristics of water phase in shale pore space before and after flowback. Distilled water was used in the experiment instead of fracturing fluid. There are two main reasons: First, to avoid the ions in the solution staying in shale pores and causing the fractures to interfere with NMR signals during repeated displacement; second, the actual salinity of fracturing fluid is low, at only 238.8900 mg/L [9]. Therefore, distilled water can be selected as the experimental fluid.

2.2.1. Influence of Flowback Time on Flowback Behavior of Shale Fracturing Fluid

The experiment is mainly divided into four steps. The details are as follows:
(1) Pretreatment of shale samples. The shale samples were vacuumed for 4 h, dried at 65 °C for 24 h, and the dry samples were weighed.
(2) The distribution characteristics of water phase in saturated distilled water shale were analyzed by NMR. Shale samples were pressurized with saturated distilled water under 15 MPa pressure for 24 h, the mass was weighed, and the distribution characteristics of distilled water in shale pore space were analyzed by NMR.
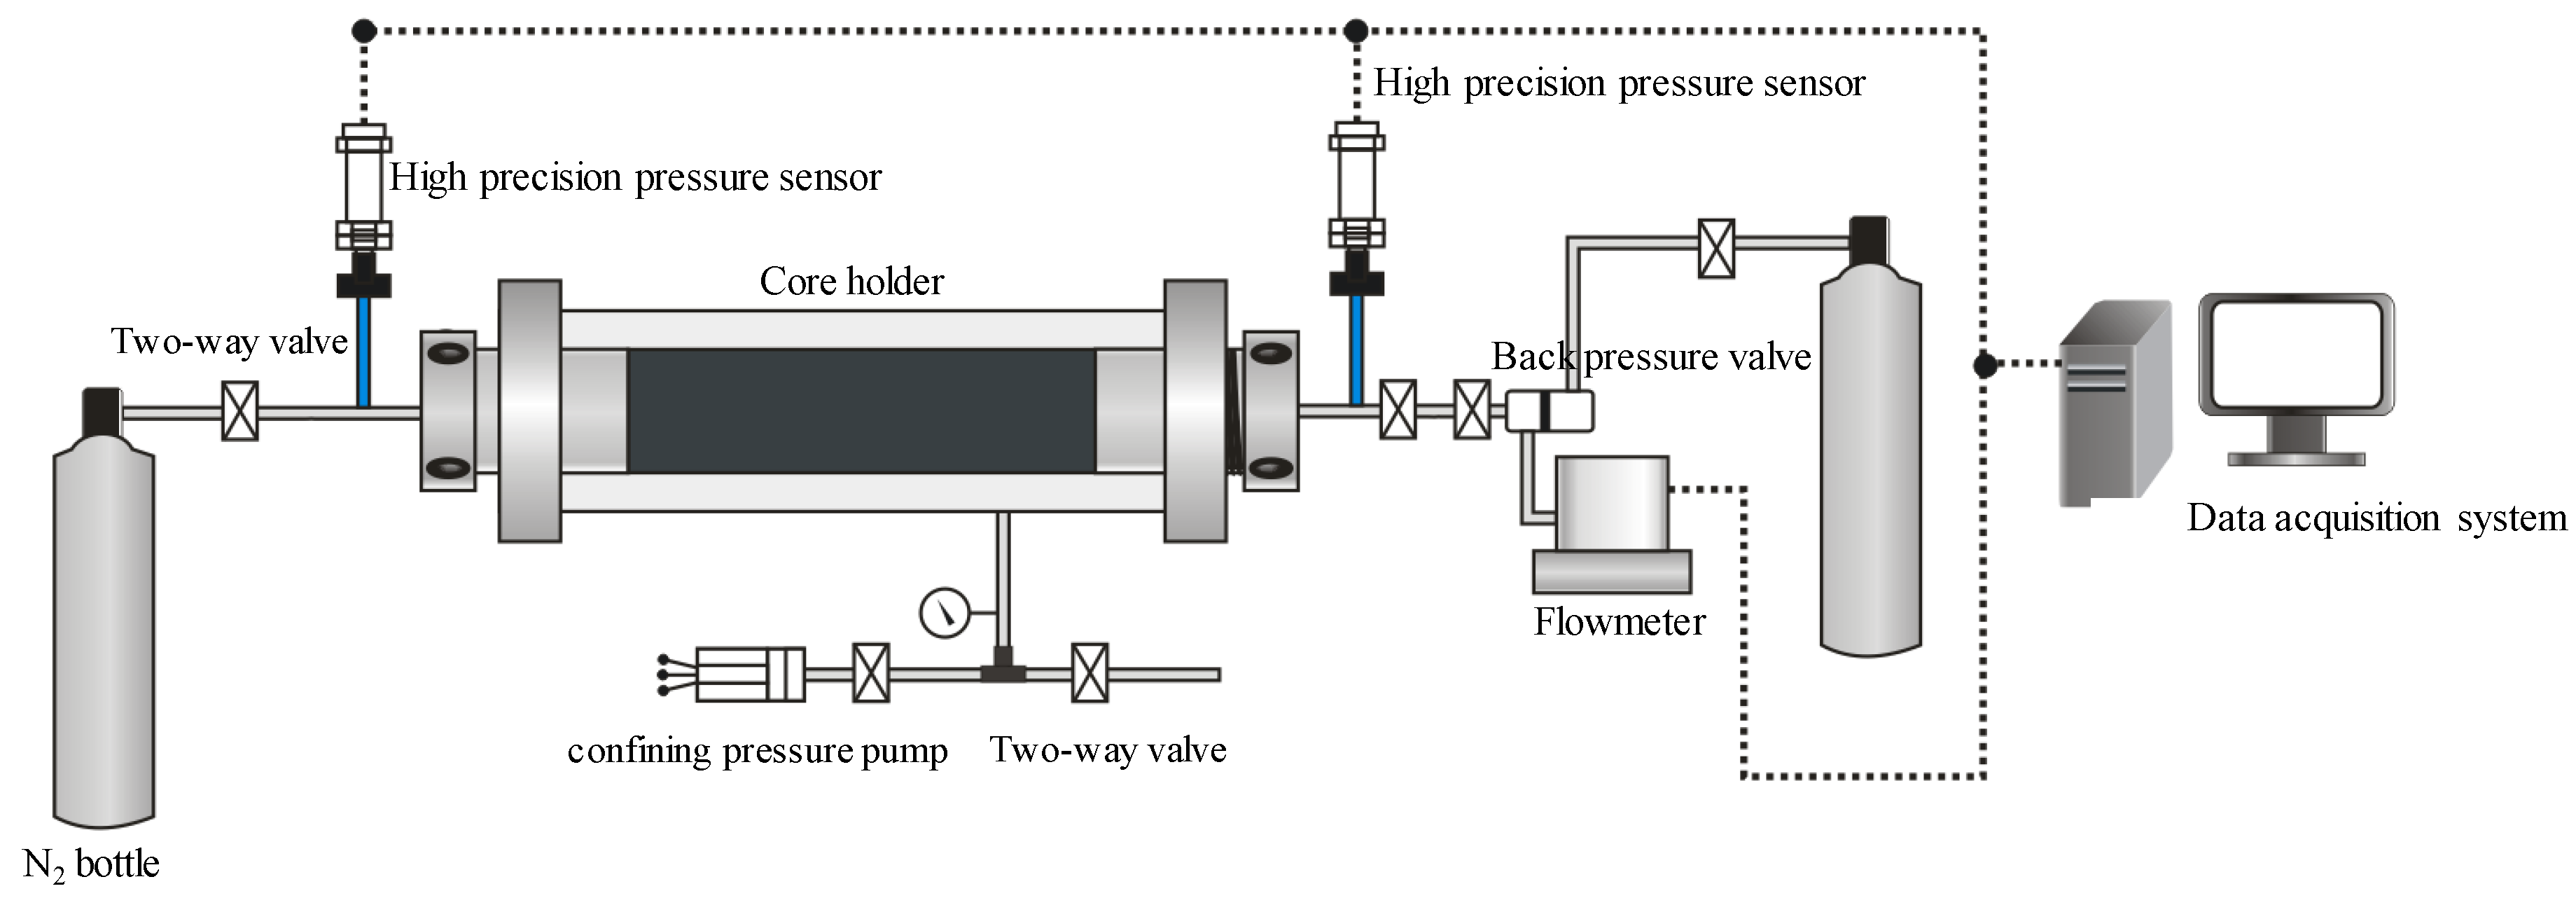
(3) The shale sample was placed into the core holder and the gas permeability under different flowback pressure differences was tested (Figure 2). The test medium was high purity N2, the back pressure was set at 1.20 MPa, and the inlet pressure was the sum of the back pressure and the backflow pressure difference. To avoid the interference of stress-sensitive damage to the experimental results, it was necessary to ensure that the effective stress of shale samples was always 2 MPa during the experiment. The samples were reflowed under the corresponding backflow pressure difference (Table 3), and the shale gas phase permeability was calculated.
(4) The distribution characteristics of water phase in shale pores and fractures after flowback was analyzed by NMR. The shale sample was removed from the core holder and the shale mass was weighed. The flowback time was more than 7 hours, and the distribution characteristics of water phase in shale pores and fractures after flowback were analyzed by NMR.

2.2.2. Influence of Flowback Pressure Difference on Flowback Behavior of Shale Fracturing Fluid

The experiment was divided into three main steps. Specifically, as follows:
(1) Shale samples were first pretreated. Shale samples were vacuumed for 4 h, dried at 65 °C for 24 h, and the mass of dry samples was weighed.
(2) The shale sample was pumped into a vacuum, pressurized, and saturated. After shale samples were vacuumed for 4 hours, they were saturated in distilled water at 20 MPa for 12 h.
(3) Backflow under variable pressure difference. Shale samples were aged for 12 h under the confining pressure of 5 MPa, and then the displacement flowback experiment was carried out. The back pressure was set to 1.25 MPa, the inlet pressure was the sum of the back pressure and the pressure difference of the back discharge, and the pressure gradient setting range is 0.030~0.180 MPa/cm. The backflow pressure difference was the product of the length of the sample and the pressure gradient. The test medium was high purity N2, and the test instrument is shown in Figure 2. Each pressure point needed to test the permeability when the flow rate at the outlet was stable.
It should be noted that the confining pressure was not static during the experiment. When the input pressure increased, the confining pressure was adjusted to keep the effective stress at 2 MPa all the time, so as to avoid the stress-sensitive damage caused by the change of the effective stress from affecting the experimental results. The experimental temperature is 25 °C.

3. Results and Discussion

3.1. Response Characteristics of Shale Gas Permeability to Fracturing Fluid Flowback Time

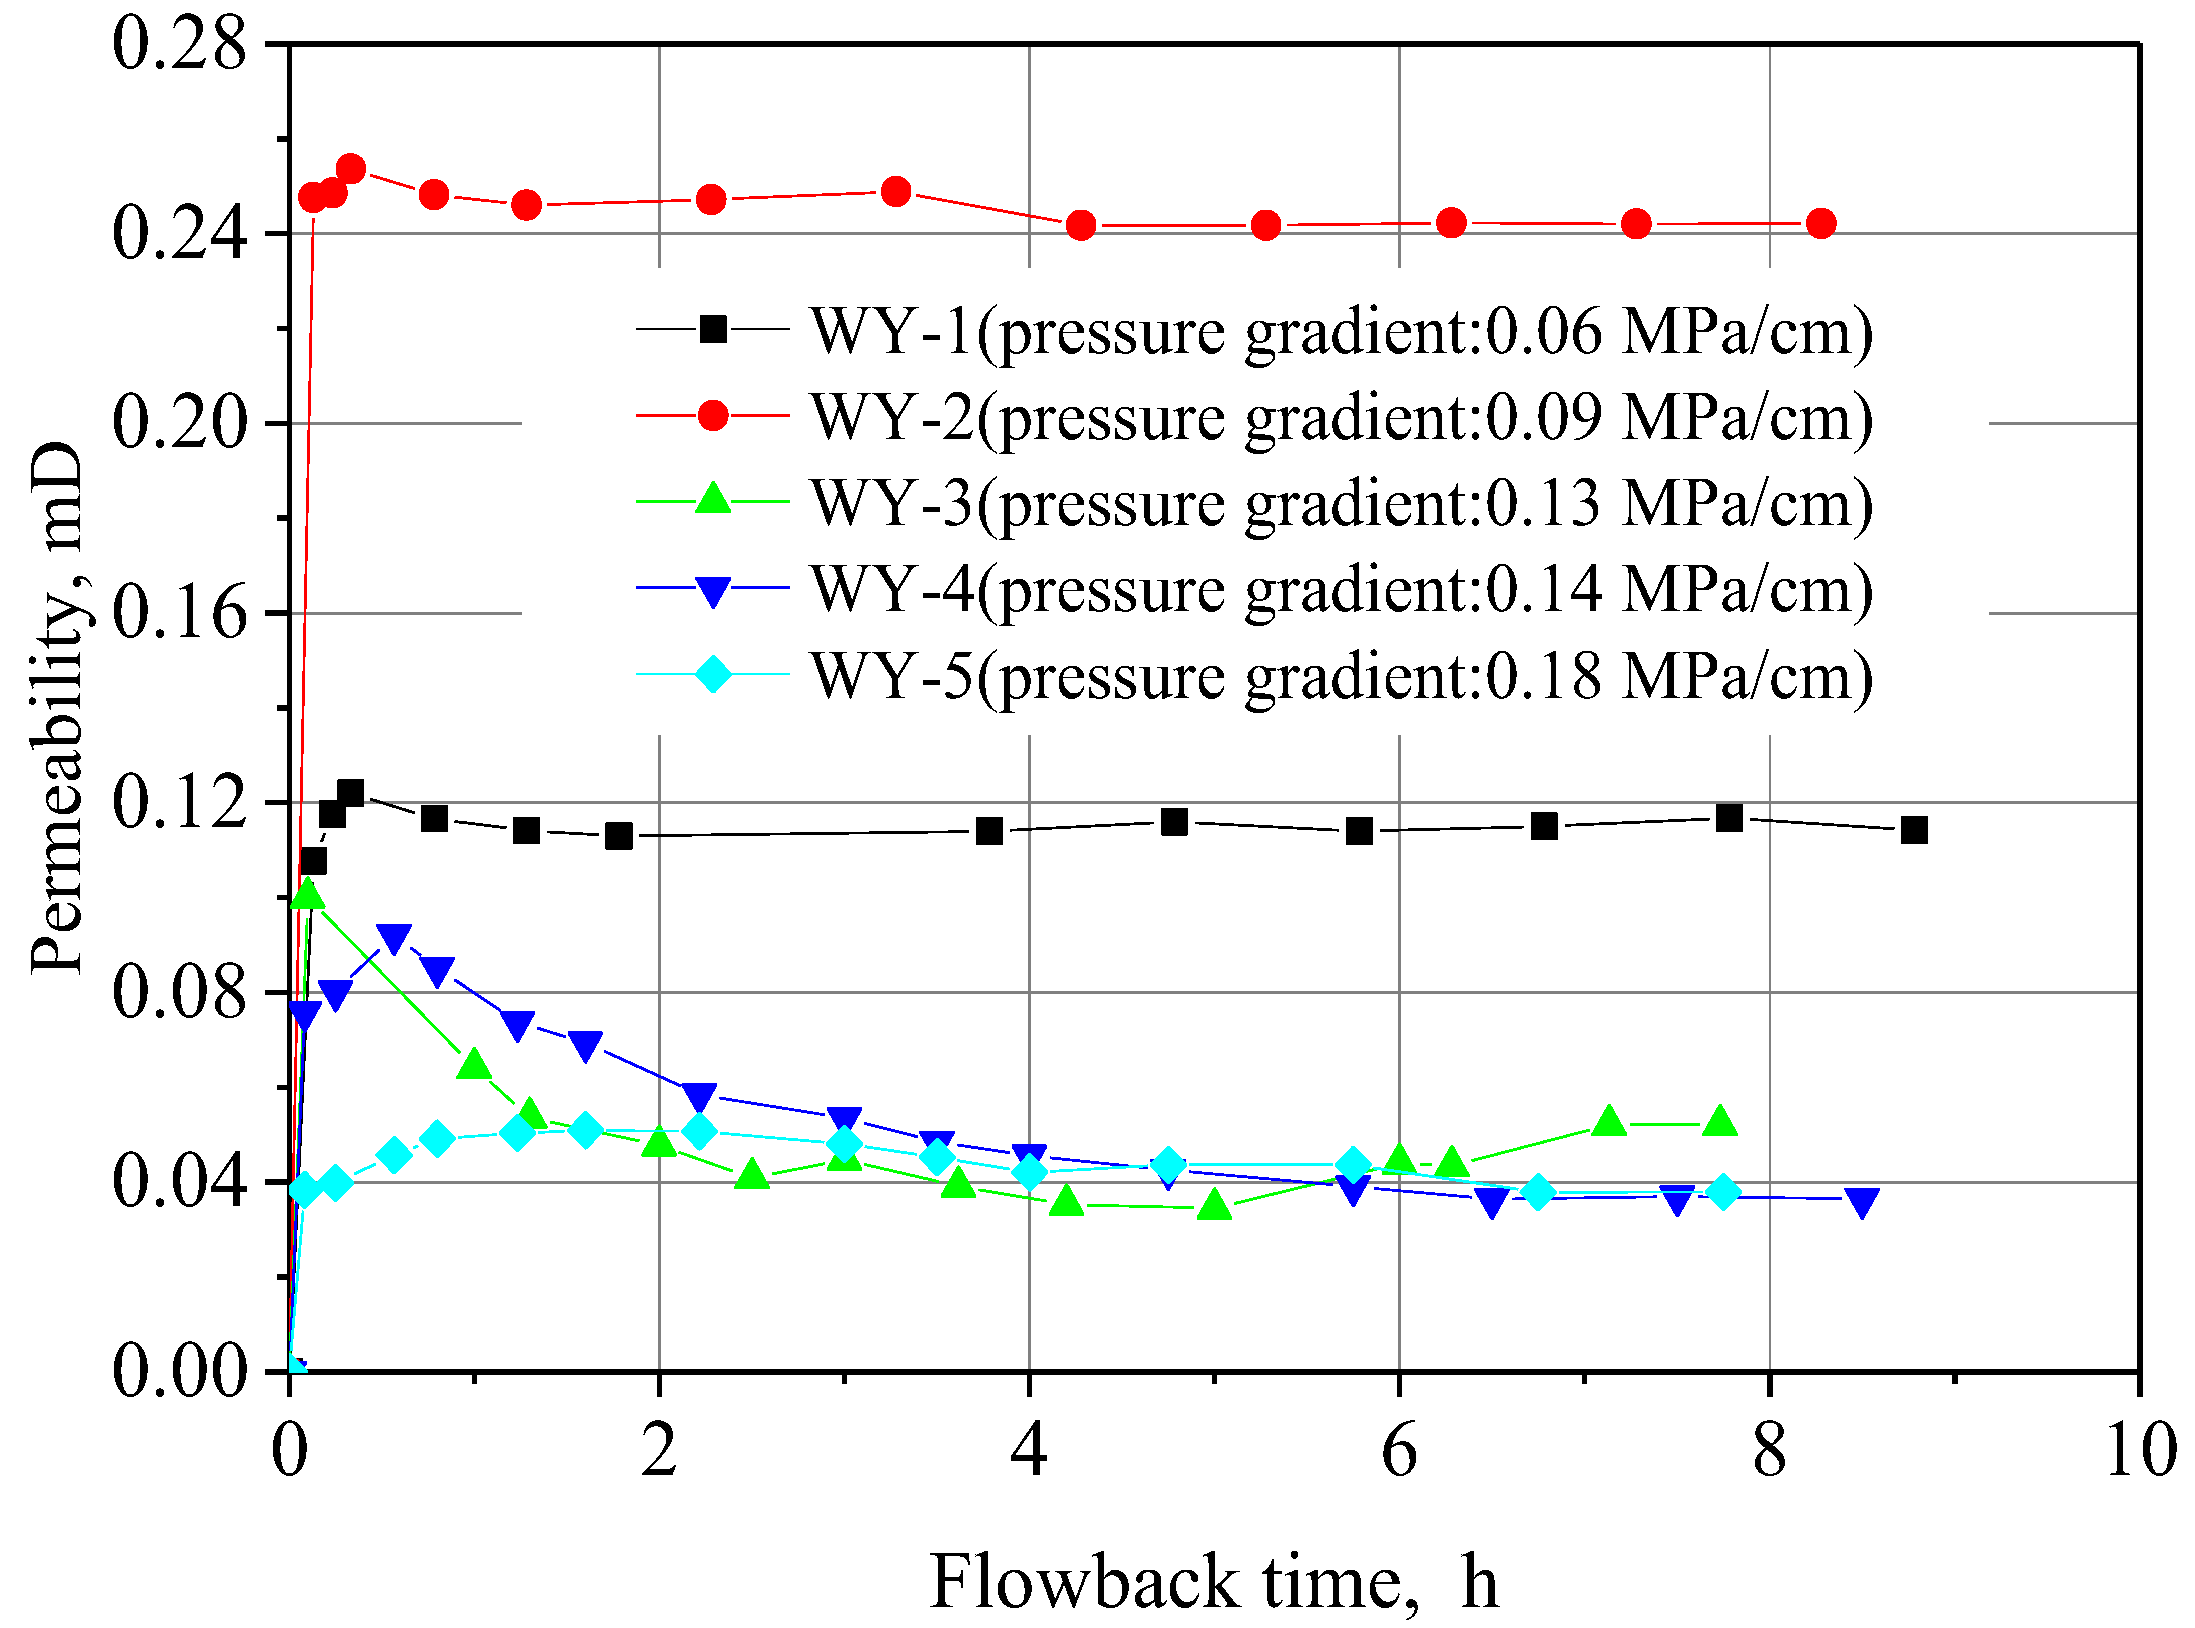
Figure 3 shows the relationship between the flowback time and permeability of five shale samples under the corresponding flowback pressure difference. It can be seen that the permeability of five shale samples shows the same trend with time. At the initial stage of flowback, with the increase of flowback time, the permeability first increases and then decreases. With the further increase of flowback time, the permeability tends to be stable.
When the predetermined back pressure value is not reached, the pressure at the outlet continuously increases. When the predetermined back pressure is reached, the outlet pressure tends to be stable (Figure 4). At the initial stage of flowback, the permeability gradually increased, which indicated that the water phase in shale pores and fractures was continuously flowback, and the gas phase continuous channel increased. When the dominant gas-phase channels were formed, more gas-phase channels could not be formed by increasing the flowback time. On the contrary, the gas seepage channels were blocked by particle migration during flowback, which reduced the permeability. At this point, the pressure at the inlet and outlet ports was constant, but the gas flow rate was changing.
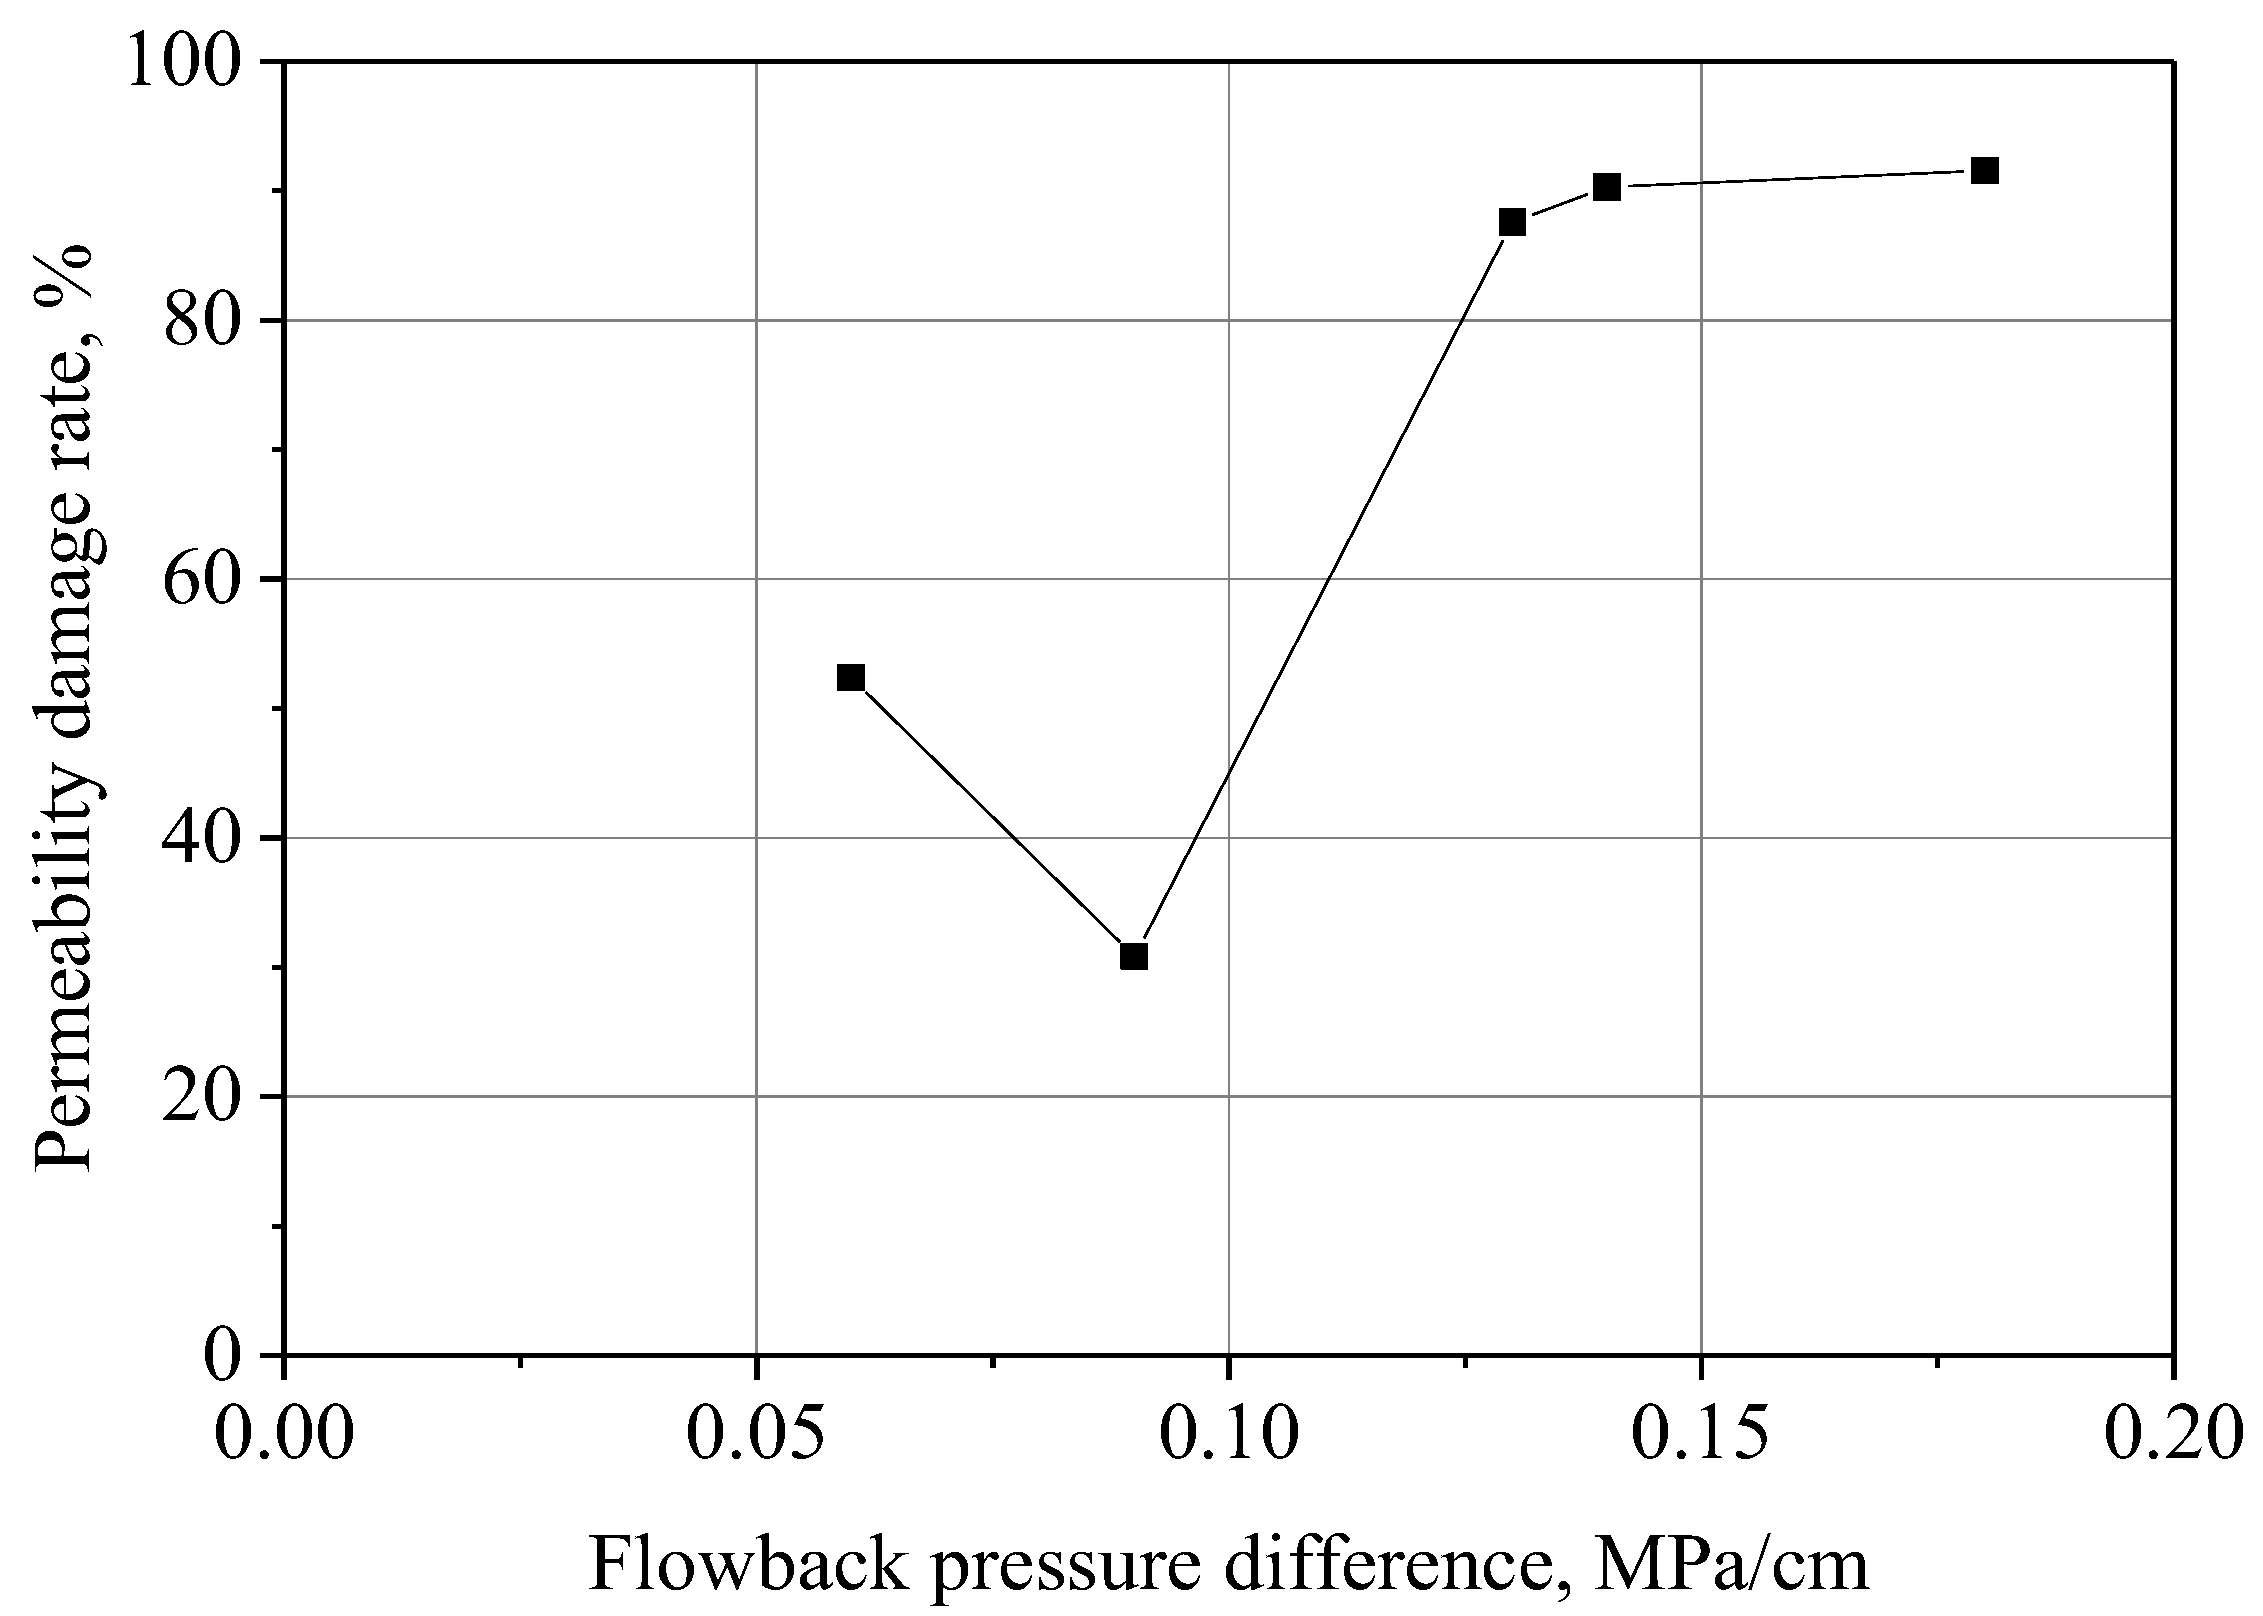
We used Equation (2) to calculate the permeability damage rate (Dk) of shale after flowback with different pressure differences (Figure 5). It can be seen that with the increase of flowback pressure difference, the shale permeability damage rate first decreases and then increases. It shows that under the condition of low backflow pressure difference, with the increase in backflow time, increasing backflow pressure difference is beneficial to the recovery of gas permeability, but when backflow pressure difference exceeds the critical backflow pressure difference, it further increases the backflow pressure difference reduces gas permeability.
D k = ( K 0 K i ) / K 0 × 100
where D k is the permeability damage rate,%; K 0 is the initial permeability, mD; and K i is the gas-phase permeability of shale at a stable state after flowing back under different pressure differences, mD.

3.2. Response Characteristics of Shale Gas Phase Permeability to Pressure Difference of Fracturing Fluid Flowback

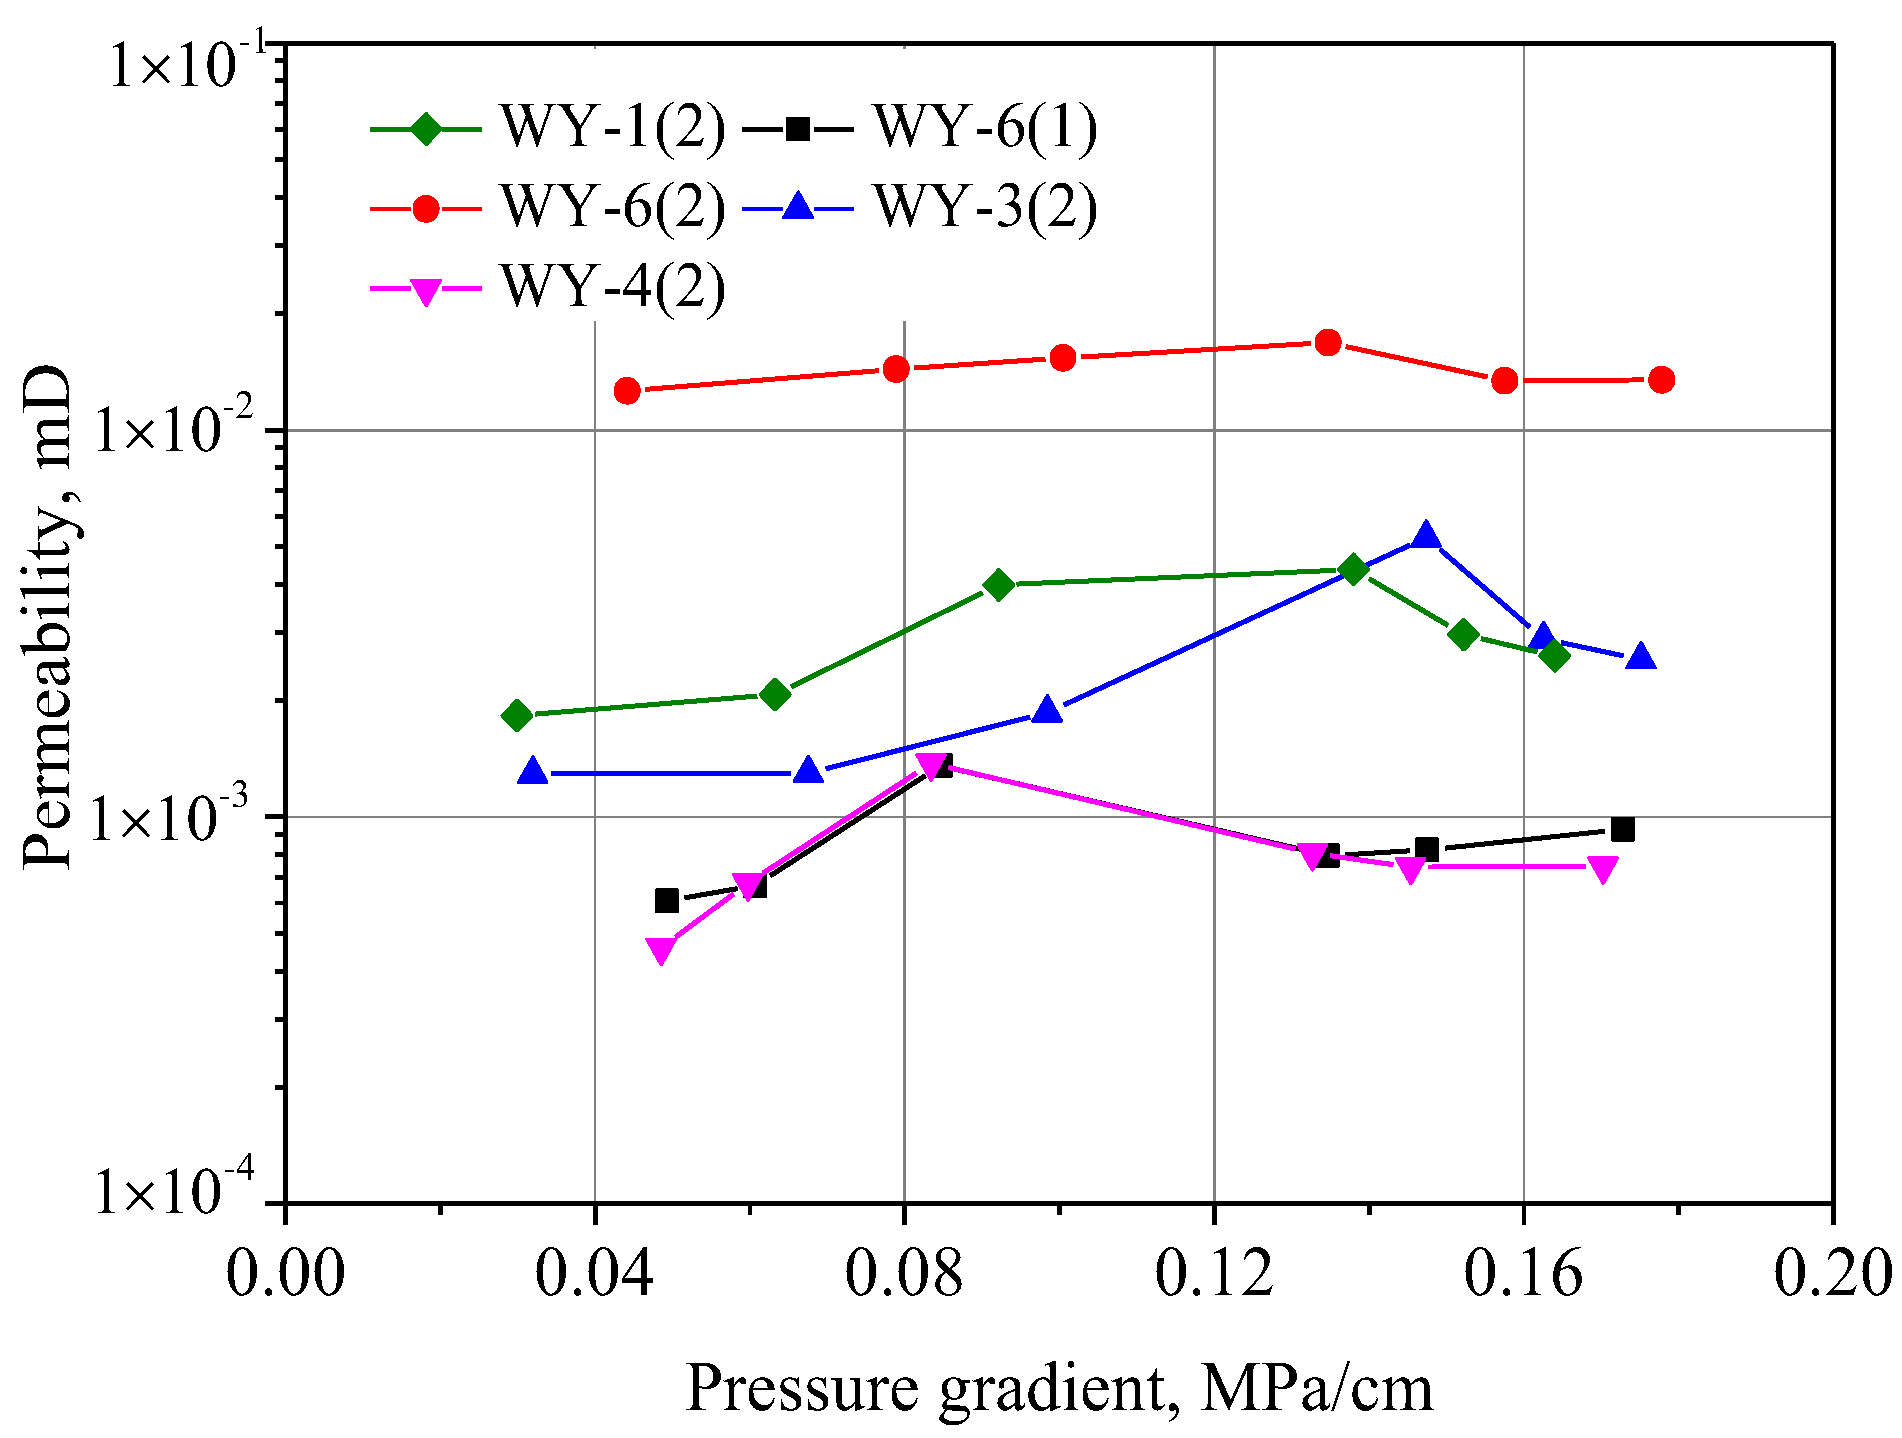
Figure 6 is the relationship between gas permeability and the pressure gradient of five shale samples under different flowback pressure differences. It can be seen that the permeability of five shale samples increases first and then decreases with the increase of flowback pressure difference. There is a critical flowback pressure gradient. When the flowback pressure gradient is less than the critical pressure gradient, the permeability increases with the increase of flowback pressure difference. When the pressure gradient of backflow is greater than the critical pressure gradient, the permeability decreases with the increase of backflow pressure difference.
Figure 7 is the relationship between the permeability damage rate of shale samples and the flowback pressure difference. With the increase of the backflow pressure difference, the permeability damage decreases firstly and then increases. With the increase of the flowback pressure difference, the permeability of shale sample increases, which indicates that for the same shale sample, increasing flowback pressure difference is beneficial to the flowback of water phase. Increasing the flowback pressure difference will cause the particles on the shale fracture surface to fall off and migrate, thus reducing the gas permeability. It is worth noting that increasing the flowback pressure difference will reduce the shale permeability damage rate, but the permeability damage rate is still above 80%.

3.3. Distribution Characteristics of Water in Shale before and after Fracturing Fluid Flowback

Figure 8 is a T2 map of shale samples after pressurized saturated water and water phase flowback. The experimental results show that the peak value of the left peak of the sample decreases slightly after flowback, and the time corresponding to the peak value moves to the left or does not change. The height of the right peak obviously decreased or even disappeared. In addition, the right peak shifted to the left, relative to the saturated water sample. The height of the right peak obviously decreased or even disappeared. In addition, the right peak shifted to the left, relative to the saturated water sample.
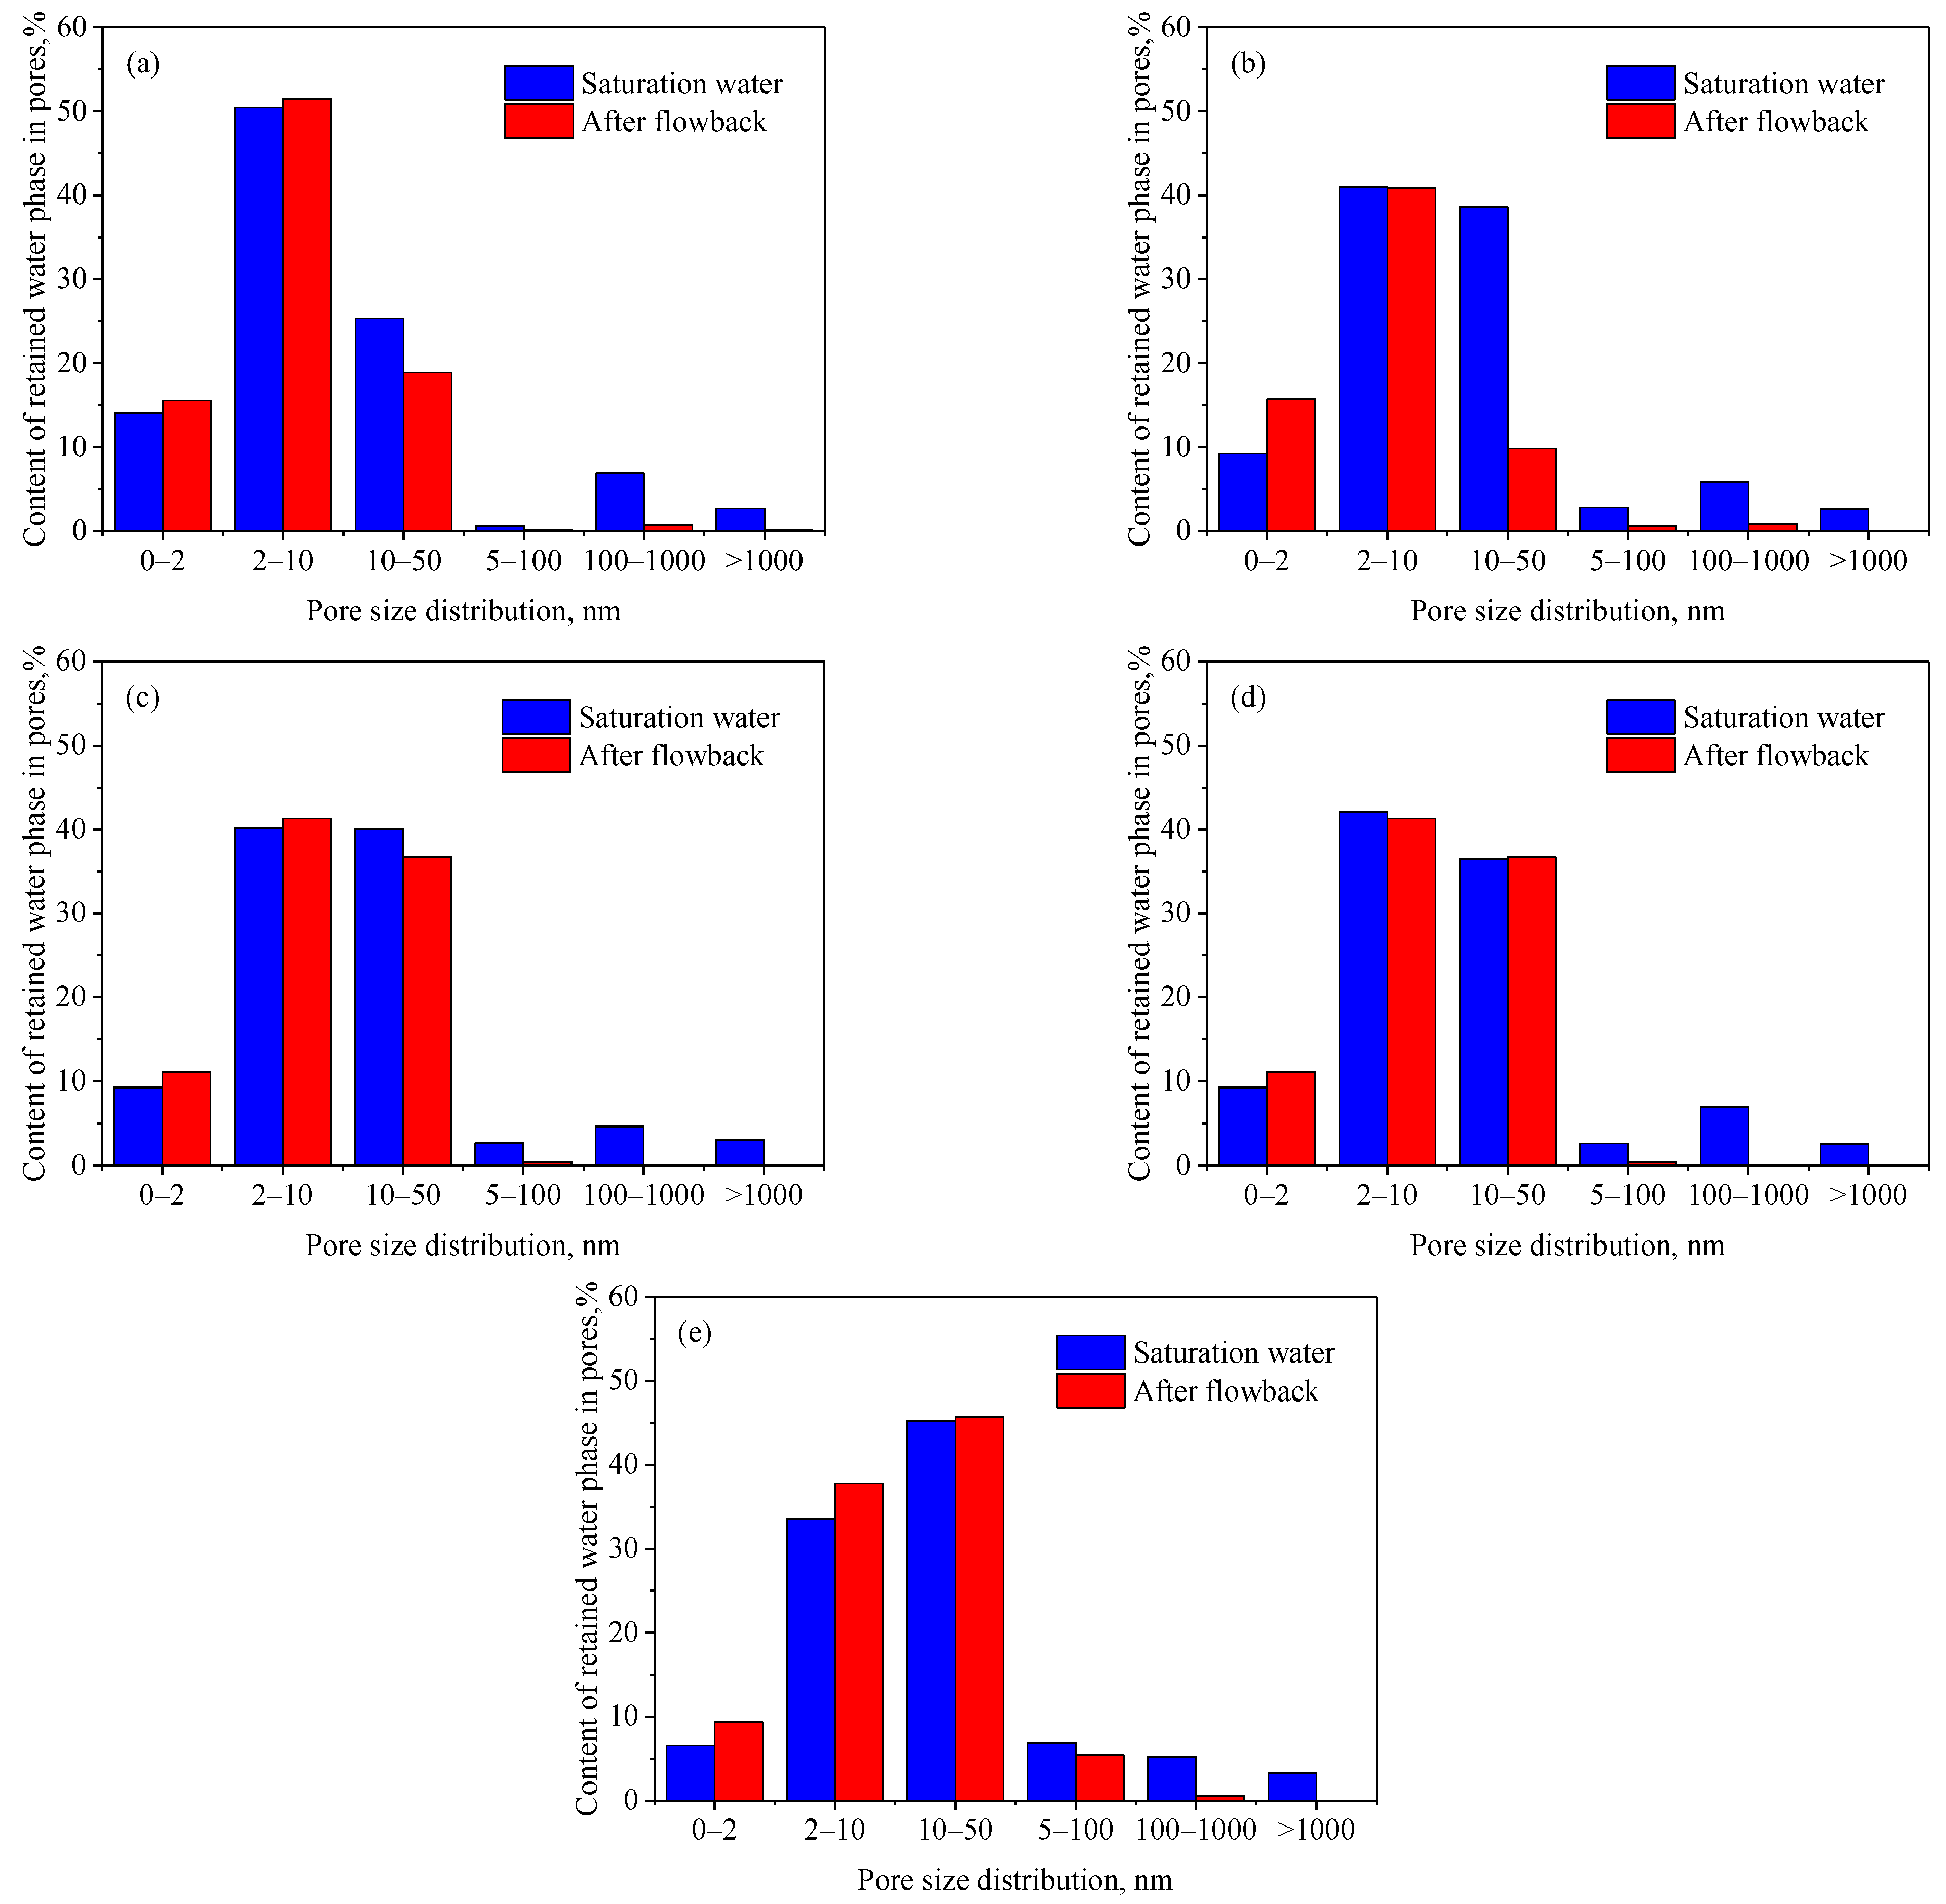
According to Equations (3)–(5), calculate the distribution characteristics of water phase in shale multi-scale pore space (Figure 9). Here, the shale pore structure is divided into six categories according to size: D < 2 nm, 2~10 nm, 10~50 nm, 50~100 nm, 100~1000 nm, and D > 1000 nm. The distribution of shale-saturated water and the water phase after drainage in the shale pore structure is investigated.
1 T 2 = 1 ρ 2 S V
S V = 2 F s D
D = F s ρ 2 T 2 = 2 ρ 2 T 2
where T2 is relaxation time, ms, and ρ 2 is surface relation characteristic, μs/ms. Here, we take the value of 0.01; S/V is the ratio of pore surface area to volume, μm−1; and Fs is shape factor. Fs is 3 when spherical, 2 when circular, and here we choose Fs as 2. D is the pore diameter, μm.
There is still a large amount of water in the pore spaces with D < 100 nm after the flowback of five shale samples, but there is relatively little of the water phase in the pore spaces with D > 100 nm (Figure 10). The content of retained water in five shale samples after flowback ranges from 9.68% to 16.97%. It is worth noting that the retained water content in shale samples does not decrease with the increase of flowback pressure difference (Table 4). This shows that when the pressure gradient is in the range of 0.06~0.18 MPa/cm, the retention of the water phase does not decrease with the increase in the pressure gradient of flowback. After the dominant gas channel is formed in the process of water phase flowback, more water will not flow back when the flowback pressure difference is increased. On the contrary, long-term water–shale interactions will reduce the mechanical strength of shale, which will cause the particles on the shale fractures surface to fall off, and the particles will migrate with the gas–water interface, blocking the gas channel and causing shale permeability to decrease.
The quantitative characterization of the content of water phase in shale pore space after flowback is shown in Figure 10 and Table 5. The results show that pores of 0~2 nm increase after flowback, which indicates that water phase cannot be flowback when it enters into pores of this scale, but instead, water–shale interaction will generate new pore space. The water content in the pore of 2~10 nm after flowback remains unchanged or slightly increases, which indicates that the water phase in this scale is also extremely difficult for flowback, and the water phase remaining in this scale also generates new pores and cracks. The water content in the pore space of 10~50 nm decreases or remains unchanged. The change rate of water content of sample WY-2 in the pore structure of this scale is much higher than that of the other four shale samples, the main reason is that the sample WY-2 is seriously reduced, which leads to the partial loss of fracture. The content of water phase retained in 50~100 nm pore structure after flowback is less than that in 0~2 nm, 2~10 nm, and 10~50 nm pore space. The water phase in this scale can be partially discharged during flowback, and the content of the water phase retained after backflow is relatively small. The content of the water phase in the pore structure of 100~1000 nm after flowback is far less than that in the pore space of 0~2 nm, 2~10 nm, and 10~50 nm, which indicates that most of the water phase in the pore structure of this scale can be flowback. Similarly, the water phase in pore space corresponding to D > 1000 nm can be drained back under the action of backflow pressure difference.
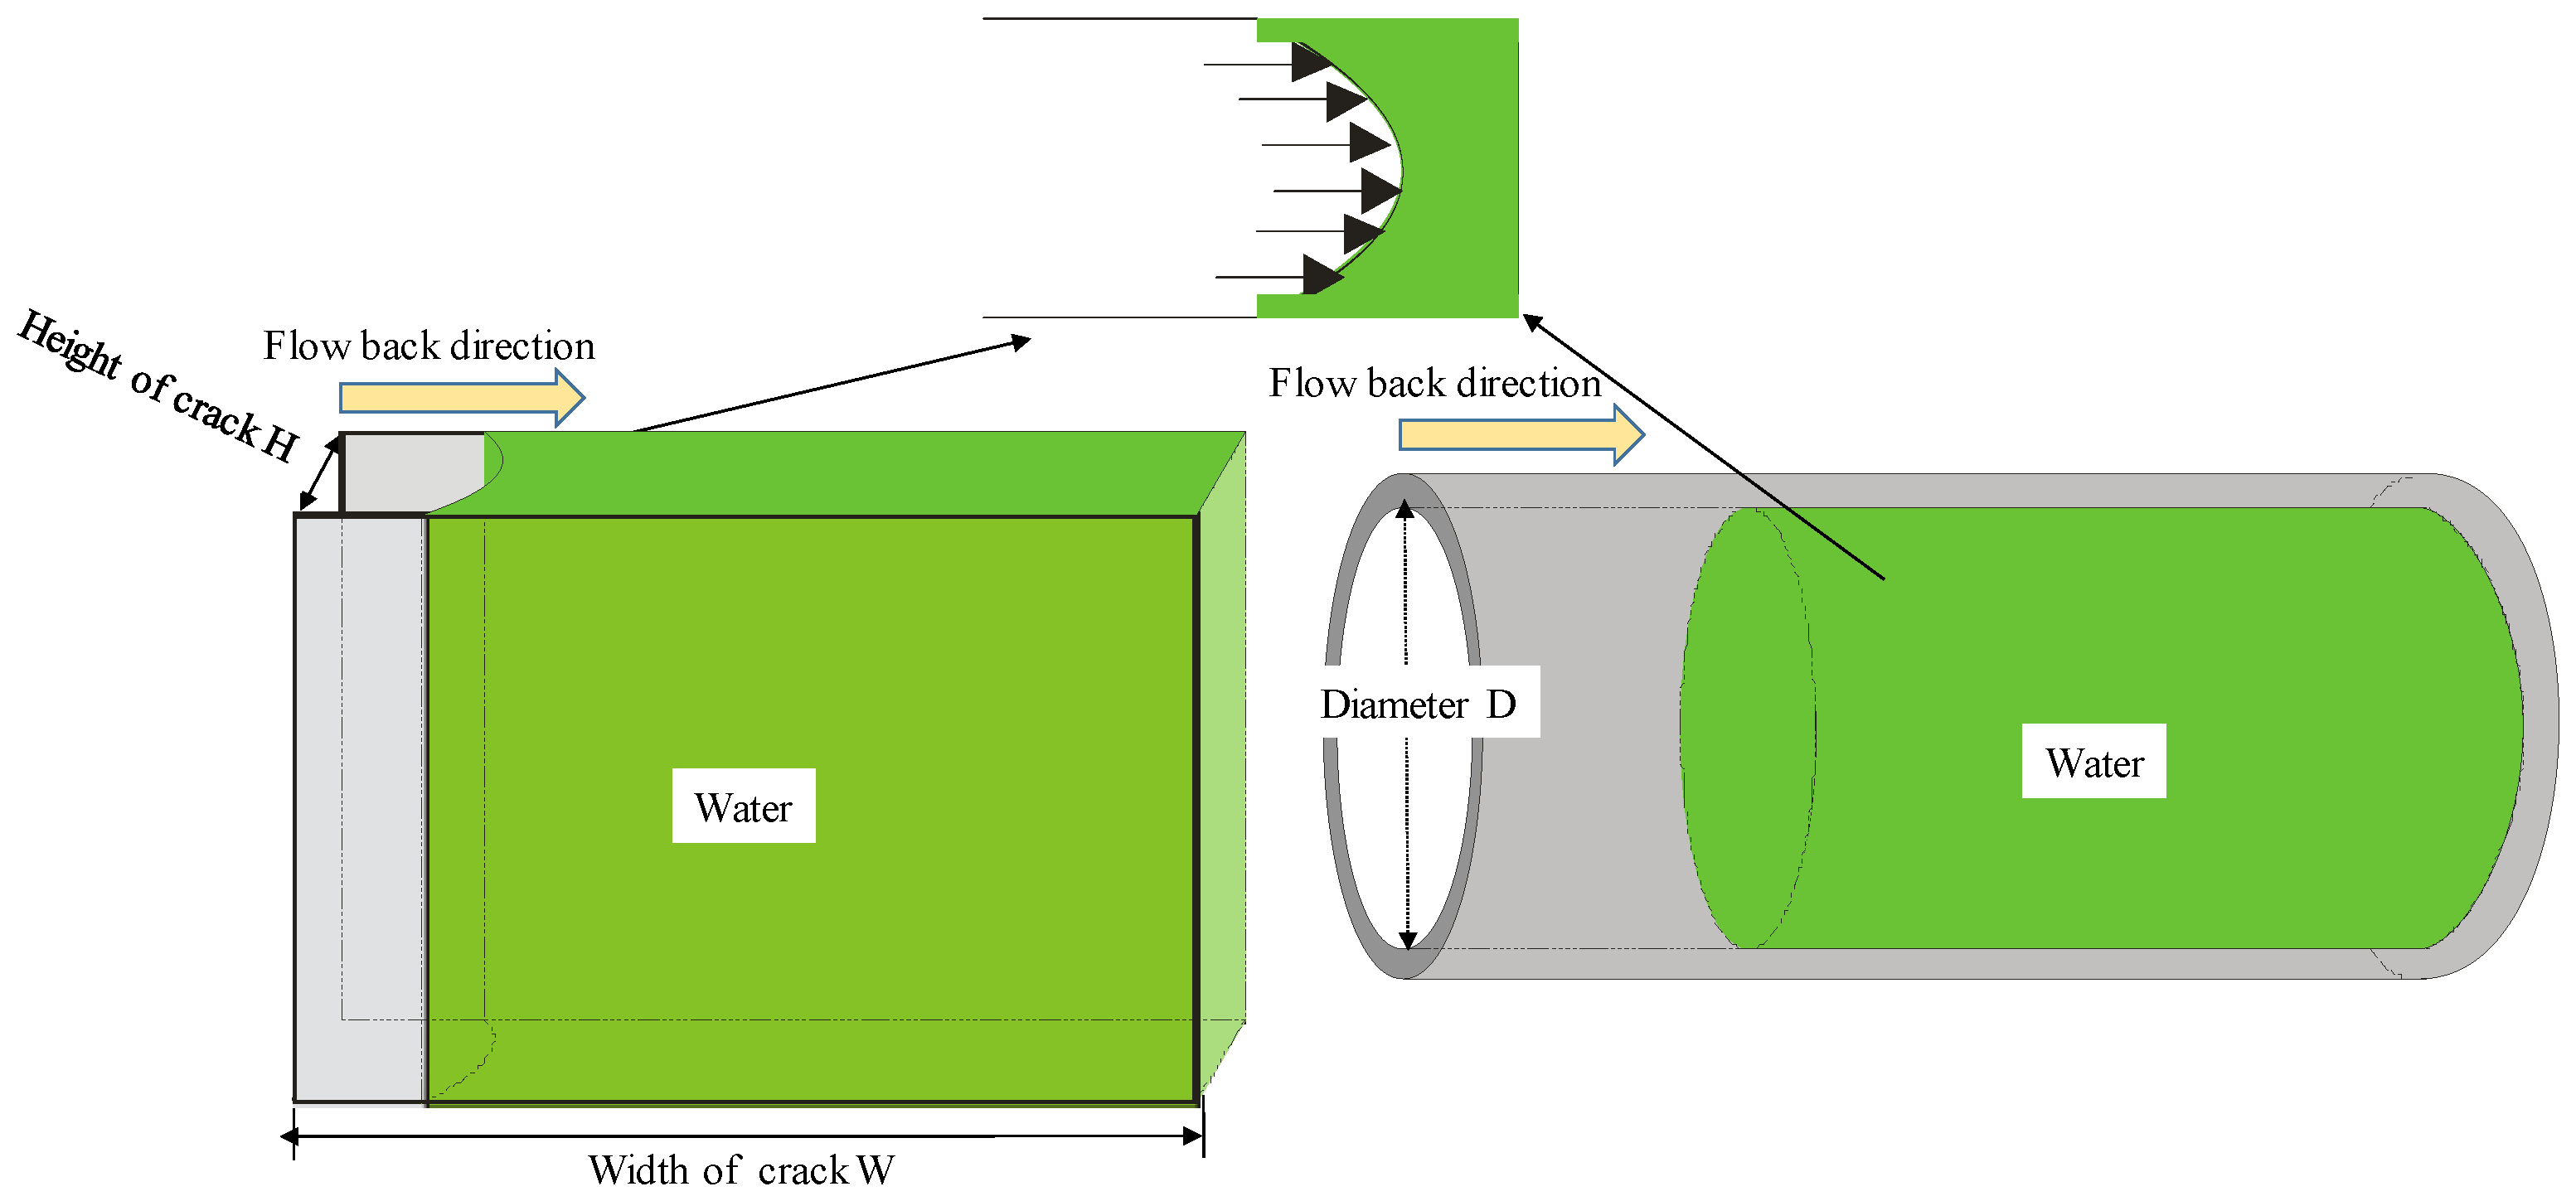
The capillary force is the driving force in the process of water phase imbibition, and the capillary force is the resistance in the process of flowback. Slit and cylindrical shapes are the main shapes of shale pore structure (Figure 11). According to Equations (6) and (7), the capillary forces when the pore structure shapes are slit and cylindrical can be calculated, respectively.
P c 1 = 2 γ L V cos θ ( 1 H + 1 W ) 2 γ L V cos θ H
P c 2 = 4 γ L V cos θ D
where P c 1 is the capillary force of slit, MPa; P c 2 is cylindrical capillary force, MPa; γ L V is surface tension, N/m; θ is contact angle, °; H is the seam height of slit, μm; W is the seam width of slit, μm; and D is diameter of cylinder, μm.
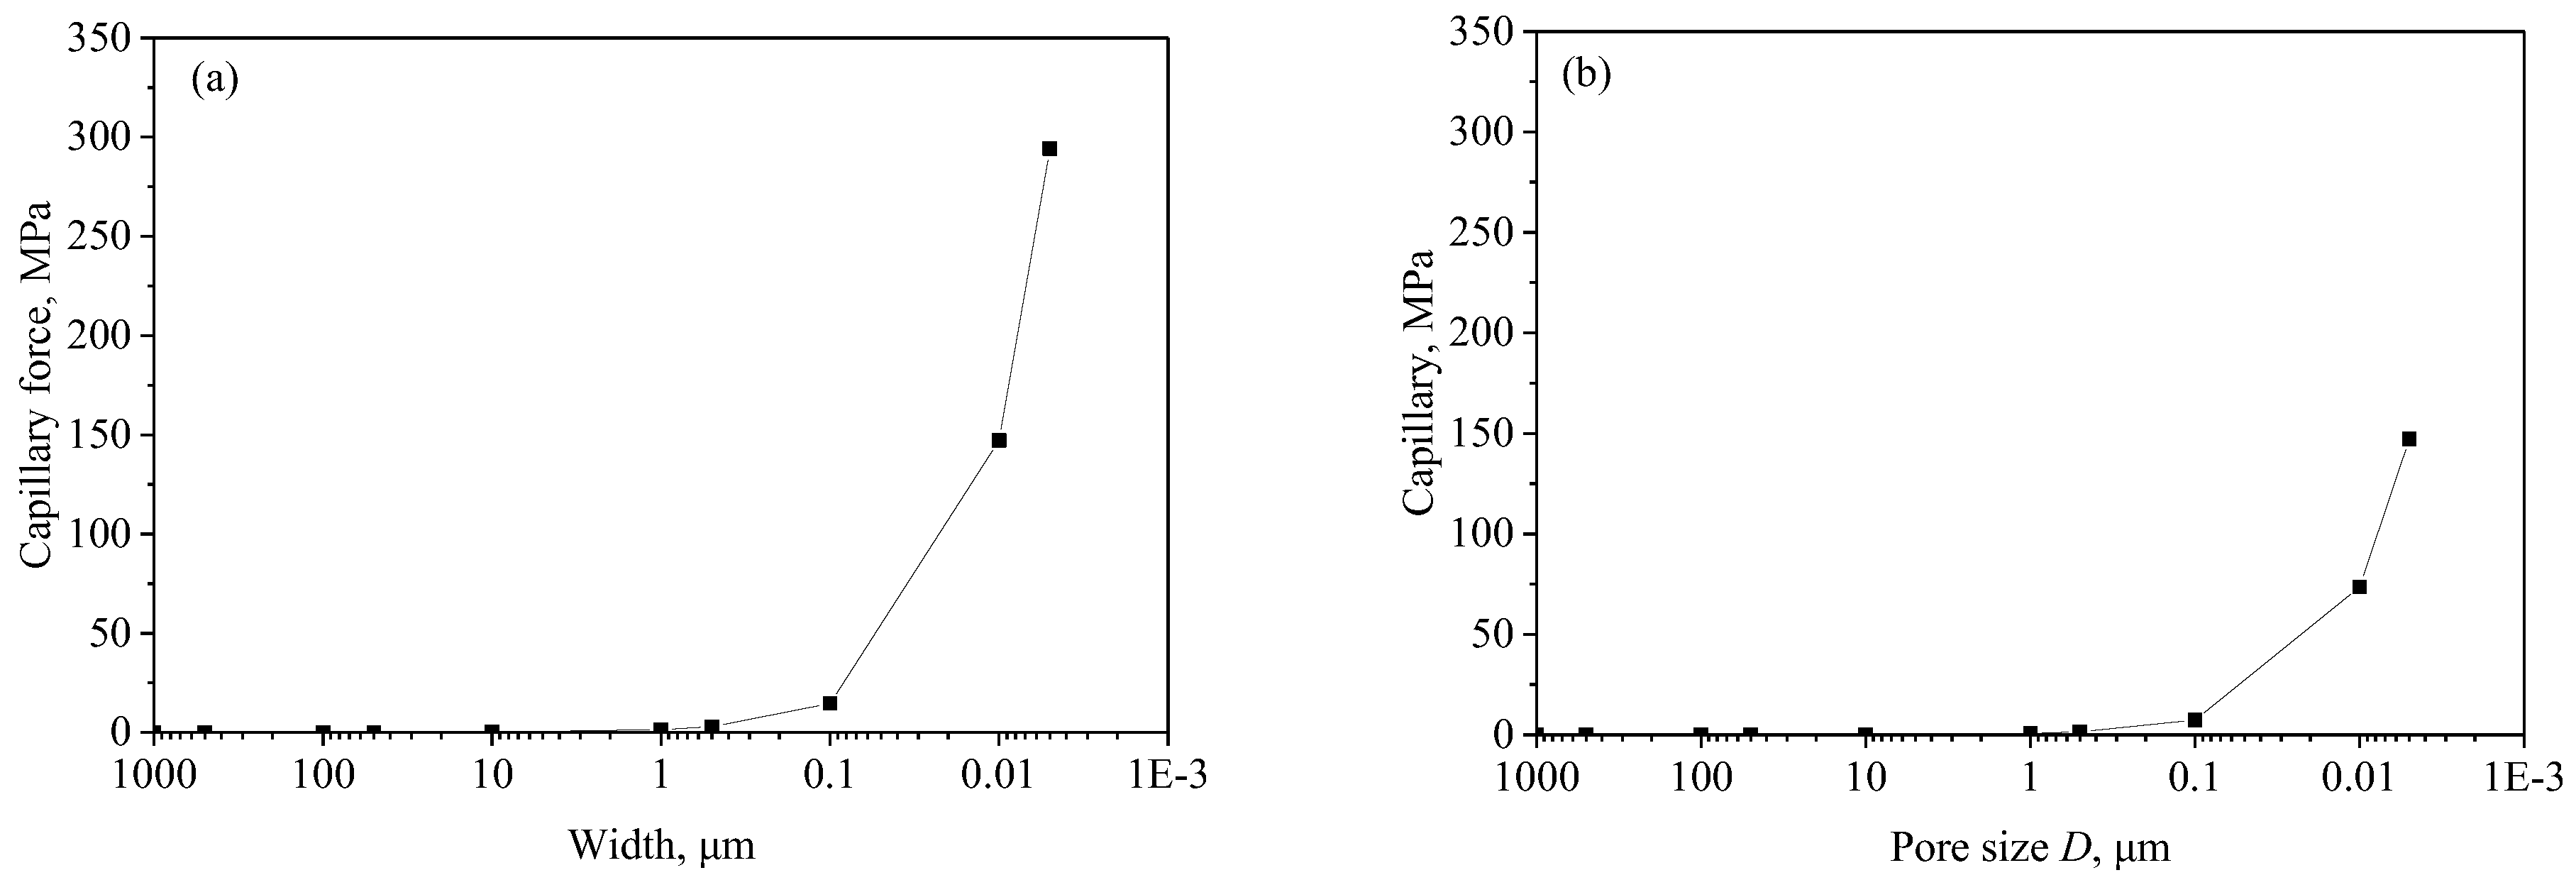
According to Equations (6) and (7), the capillary force when the aperture or slit height is from 5 nm to 1000 μm is calculated. As can be seen from Figure 12, the capillary force increases exponentially with the increase of aperture. Here, the capillary forces of slit pores and cylindrical pores are calculated when the contact angle is 52°. The surface tension of water and methane is 0.579 N/m [25]. The capillary resistance of the slit-shaped slot is 147.13 MPa, 7.35 MPa, and 0.73 MPa, when the slot height is 5 nm, 100 nm, and 1000 nm, respectively. The capillary forces corresponding to cylindrical pore diameters of 5 nm, 100 nm, and 1000 nm are 294.26 MPa, 14.71 MPa, and 1.47 MPa, respectively. When D < 100 nm, the high capillary force in the process of water phase flowback is an important reason for the difficulty of water phase flowback. When D > 100 nm, the retained water phase can be drained back on account of the backflow pressure difference.
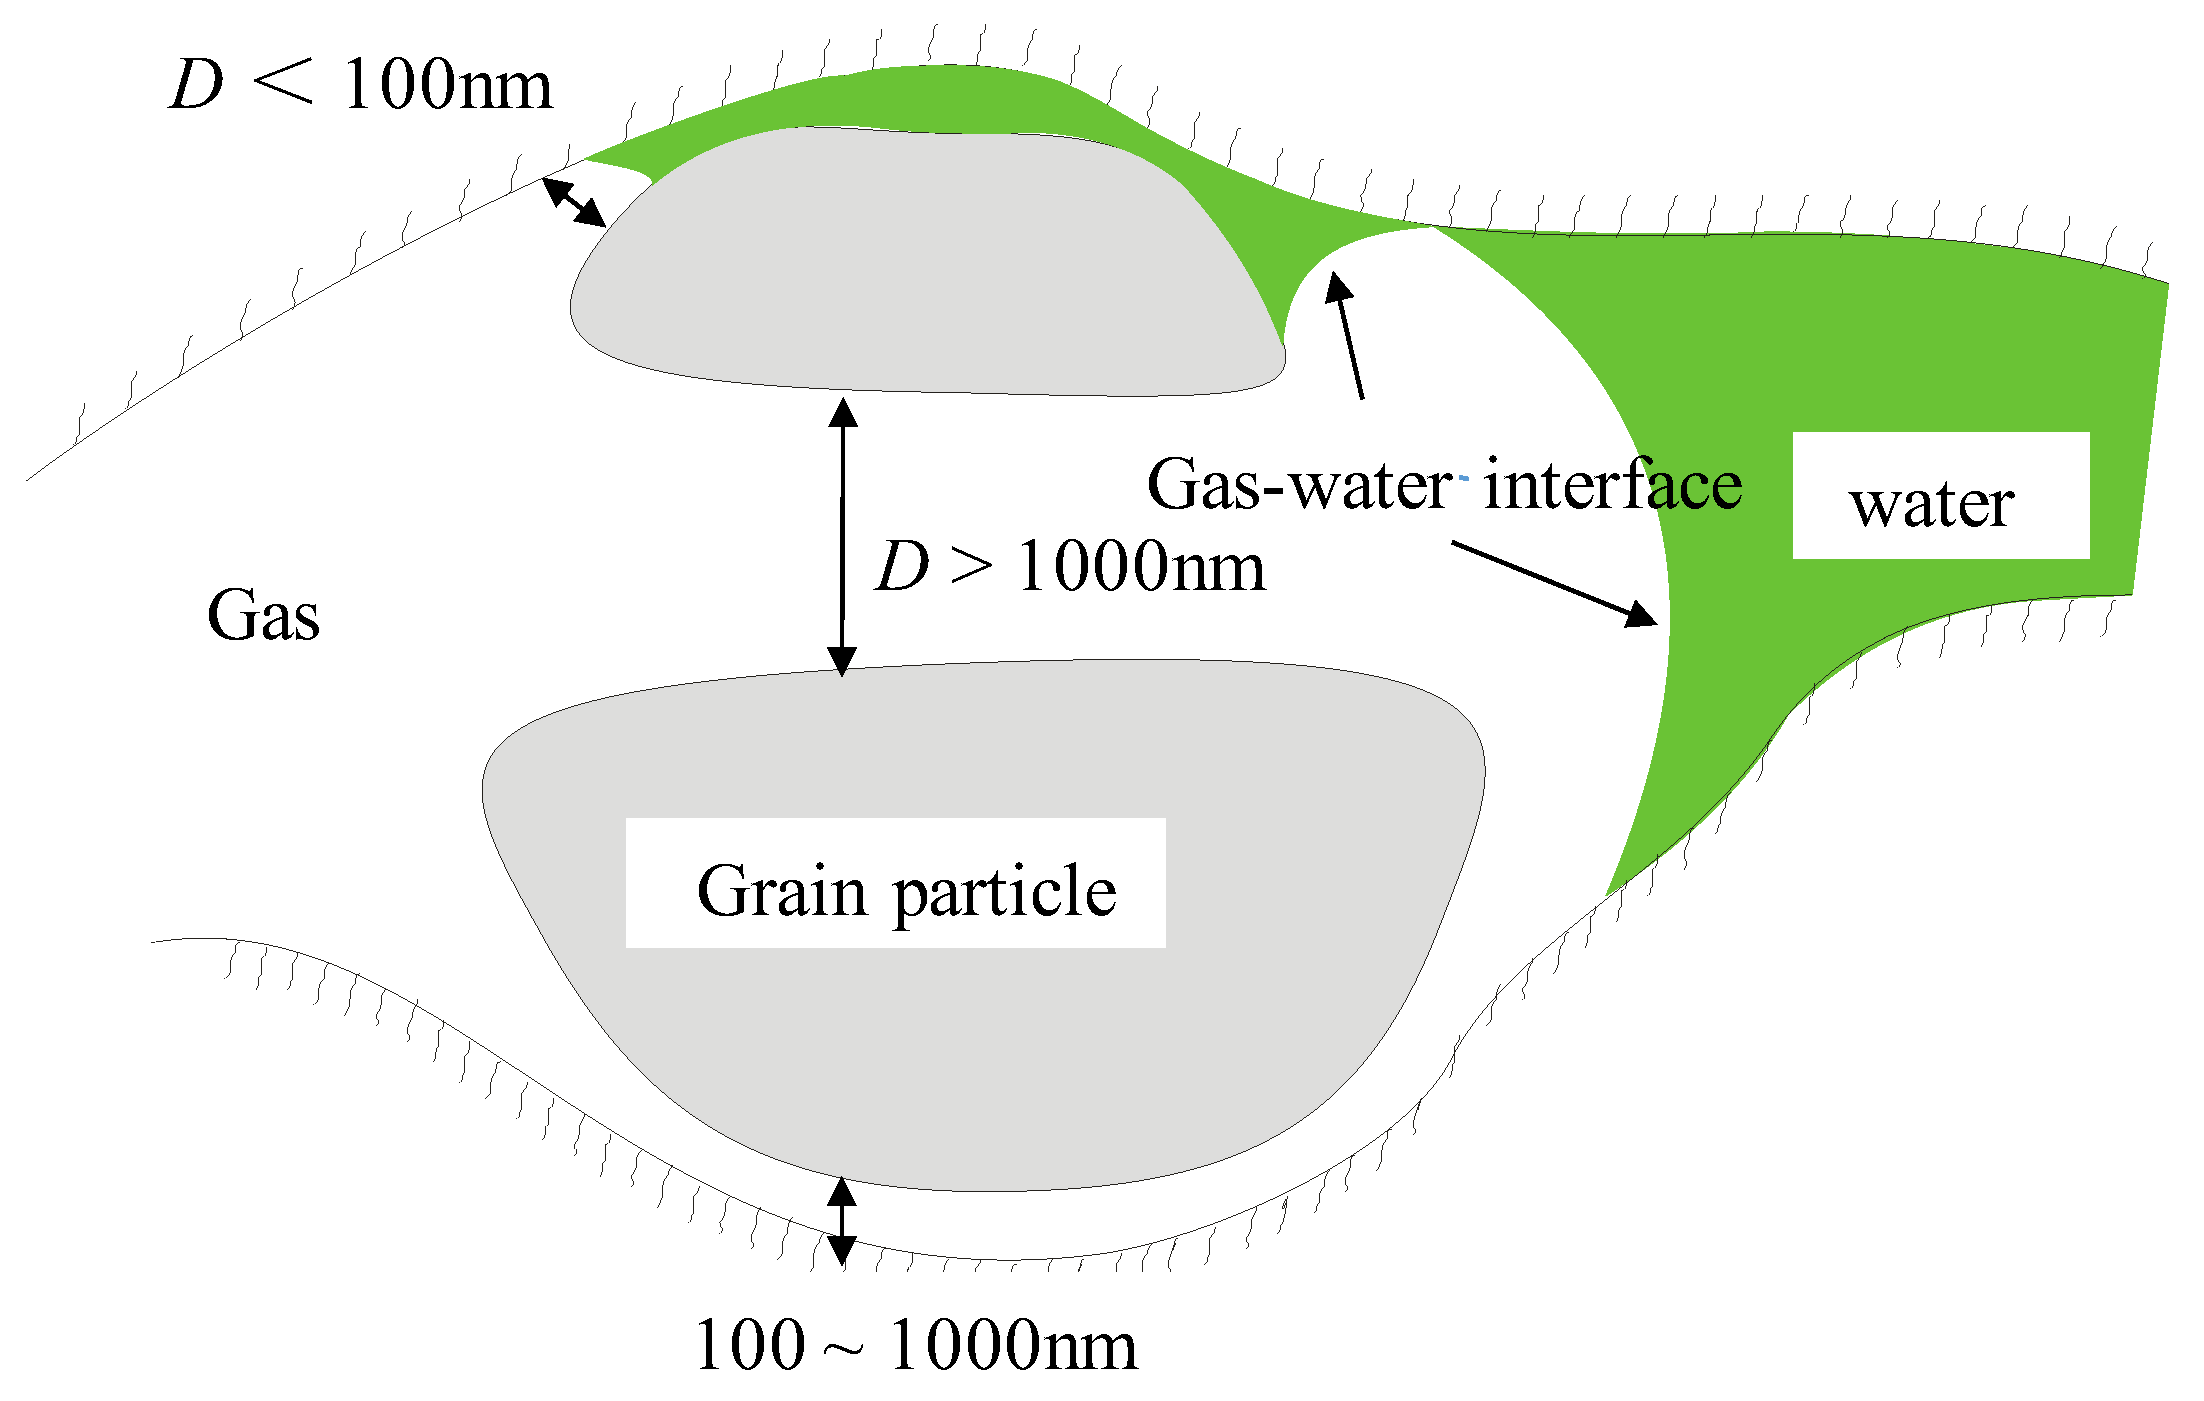
Figure 13 shows the distribution of water phase in shale multiscale pores structure after flowback. At the initial stage of flowback, the water phase in D > 1000 nm pore structure can be flowback. With the increase in flowback time, more gas seepage channels participate in the gas seepage and the gas permeability increases. When the flowback pressure difference increases, more gas–liquid interfaces are broken in the 100~1000 nm pore-gap structure. Because of the high capillary resistance of D < 100 nm pores, the water phase sucked into the pores of this pores can hardly be discharged back. However, increasing the flowback pressure difference will cause the particles on the fracture surface to fall off and migrate. Particle migration will block some pores and micro-cracks and reduce the gas permeability.

3.4. Influence of Particle Migration in Shale Fracture Surface on Shale Gas Phase Permeability

At the end of the experiment, take the sample out of the holder and weigh the shale powder scattered from the core (Figure 14). Moreover, the larger the flowback pressure difference is, the more the shale powder falls off per unit mass of shale (Figure 15).
Figure 16a shows the initial distribution characteristics of fracturing fluid in shale pores and fractures. At a low flowback pressure difference, increasing backflow pressure difference can increase gas seepage channels, more pores (D > 100 nm) participate in gas transportation, and gas permeability increases with the increase in flowback pressure difference (Figure 16b). On the other hand, under high flowback pressure difference, a large number of particles in shale with increased flowback pressure difference migrate, thus blocking the gas seepage channel in shale (D < 1000 nm) and reducing the permeability (Figure 16c). At the same time, combined with the relationship between the flowback pressure difference and permeability of five shale samples in Figure 6 and Figure 7, it can be concluded that when the flowback pressure gradient is greater than 0.09 MPa/cm, the damage of particle migration to permeability is greater than the contribution of the increase of seepage channels to permeability, thus reducing the permeability.

4. Conclusions

Based on field working conditions, the flowback experiment of imbibition fracturing fluid in a shale multiscale pore structure was carried out, and the influence mechanism of flowback time and flowback pressure difference of fracturing fluid on shale gas phase permeability was revealed. The operating conditions of imbibition fracturing fluid in the flowback process were clarified. The main knowledge gained includes the following three points:
(1) After flowback under the pressure gradient of 0.06~0.18 MPa/cm, the content of the retained water phase in shale samples ranges from 9.68% to 16.97%, and the retention of fracturing fluid in shale does not decrease with the increase of flowback pressure difference. During the flowback process, once the dominant gas channel is formed, increasing the flowback pressure difference is not beneficial to the recovery of the shale gas phase permeability. On the contrary, when the flowback pressure difference is greater than the critical flowback pressure difference, the shale gas phase permeability decreases.
(2) After the flowback water phase primarily stays in the pore space with D < 100 nm, especially in the pore space with 2~10 nm and 10~50 nm. The water-phase shale pores exist in the form of a bulk phase and adsorbed water film. The water phase in pores with D > 100 nm exists in the bulk phase and can be drained back under the action of flowback pressure difference. However, for the pore space with D < 100 nm, the adsorbed water film and bulk phase coexist. It is extremely difficult for the water phase in the pores with D < 100 nm to flow back out.
(3) The experimental results show that the critical flowback pressure gradient for the particle migration of rock powder in a shale fracture surface is 0.09 MPa/cm. When the backflow pressure gradient is greater than 0.09 MPa/cm, the damage of particle migration to gas permeability is greater than the increase of the contribution of seepage channel to gas permeability.

Author Contributions

J.B.: Conceptualization, Methodology, Software, Investigation, Writing—original draft. G.W.: Conceptualization, Methodology. Q.Z.: Writing—review & editing. L.T.: Writing—review & editing. W.S.: Writing—review & editing. All authors have read and agreed to the published version of the manuscript.

Funding

This research was funded by [State Key Laboratory of Shale Oil and Gas Enrichment Mechanism and Effective Development] grant number [No.33550000-22-ZC0613-0004]. And The APC was funded by State Key Laboratory of Shale Oil and Gas Enrichment Mechanism and Effective Development (No.33550000-22-ZC0613-0004) and the Fourth Batch of Leading Innovative Talent’s Introduction and Cultivation Projects of Changzhou (No. CQ20210109).

Data Availability Statement

Data will be provided if anyone needs it.

Acknowledgments

The authors would like to acknowledge the financial support from the Foundation of State Key Laboratory of Shale Oil and Gas Enrichment Mechanism and Effective Development (No.33550000-22-ZC0613-0004) and the Fourth Batch of Leading Innovative Talent’s Introduction and Cultivation Projects of Changzhou (No. CQ20210109). The authors gratefully thank the anonymous reviewers for their constructive and valuable opinions. The authors would like to thank Liu Li, Analysis and Testing Center, NERC Biomass of Changzhou University.

Conflicts of Interest

The authors declare no conflict of interest.

References

  1. Zhao, X.; Kang, J.; Lan, B. Focus on the Development of Shale Gas in China—Based on SWOT Analysis.21. Available online: https://www.sciencedirect.com/science/article/pii/S1364032112007496 (accessed on 12 February 2013).
  2. Yang, H.; Han, X.; Wang, L. Is there a bubble in the shale gas market? Energy 2021, 215, 119101. Available online: https://linkinghub.elsevier.com/retrieve/pii/S0360544220322088 (accessed on 27 October 2020). [CrossRef]
  3. Gao, S.; Dong, D.; Tao, K.; Guo, W.; Li, X.; Zhang, S. Experiences and lessons learned from China’s shale gas development: 2005–2019. J. Nat. Gas Sci. Eng. 2021, 85, 103648. Available online: https://linkinghub.elsevier.com/retrieve/pii/S1875510020305023 (accessed on 4 November 2020). [CrossRef]
  4. Kilian, L. The Impact of the Shale Oil Revolution on U.S. Oil and Gasoline Prices. Rev. Environ. Econ. Policy 2016, 10, 185–205. [Google Scholar] [CrossRef] [Green Version]
  5. Trainor, A.M.; McDonald, R.I.; Fargione, J. Energy Sprawl Is the Largest Driver of Land Use Change in United States. PLoS ONE 2016, 11, e0162269. [Google Scholar] [CrossRef] [Green Version]
  6. Wei, J.; Duan, H.; Yan, Q. Shale gas: Will it become a new type of clean energy in China?—A perspective of development potential. J. Clean. Prod. 2021, 294, 126257. Available online: https://www.sciencedirect.com/science/article/pii/S0959652621004777 (accessed on 8 February 2021). [CrossRef]
  7. Wang, Q.; Lyu, C.; Cole, D.R. Effects of hydration on fractures and shale permeability under different confining pressures: An experimental study. J. Pet. Sci. Eng. 2019, 176, 745–753. Available online: https://linkinghub.elsevier.com/retrieve/pii/S0920410519300750 (accessed on 25 January 2019). [CrossRef]
  8. Wang, Q.; Hu, Q.; Larsen, C.; Zhao, C.; Sun, M.; Zhang, Y.; Zhang, T. Microfracture-pore structure characterization and water-rock interaction in three lithofacies of the Lower Eagle Ford Formation. Eng. Geol. 2021, 292, 106276. Available online: https://www.sciencedirect.com/science/article/pii/S0013795221002878 (accessed on 15 July 2021). [CrossRef]
  9. Bai, J.; Kang, Y.; Chen, Z.; You, L.; Chen, M.; Li, X. Changes in retained fracturing fluid properties and their effect on shale mechanical properties. J. Nat. Gas Sci. Eng. 2020, 75, 103163. Available online: https://linkinghub.elsevier.com/retrieve/pii/S1875510020300172 (accessed on 13 January 2020). [CrossRef]
  10. Zhong, C.; Zolfaghari, A.; Hou, D.; Goss, G.G.; Lanoil, B.D.; Gehman, J.; Tsang, D.C.W.; He, Y.; Alessi, D.S. Comparison of the Hydraulic Fracturing Water Cycle in China and North America: A Critical Review. Environ. Sci. Technol. 2021, 55, 7167–7185. [Google Scholar] [CrossRef] [PubMed]
  11. Liu, D.; Li, J.; Zou, C.; Cui, H.; Ni, Y.; Liu, J.; Wu, W.; Zhang, L.; Coyte, R.; Kondash, A.; et al. Recycling flowback water for hydraulic fracturing in Sichuan Basin, China: Implications for gas production, water footprint, and water quality of regenerated flowback water. Fuel 2020, 272, 117621. Available online: https://linkinghub.elsevier.com/retrieve/pii/S0016236120306165 (accessed on 3 April 2020). [CrossRef]
  12. Lin, B.; Guo, J.; Liu, X.; Xiang, J.; Zhong, H. Prediction of flowback ratio and production in Sichuan shale gas reservoirs and their relationships with stimulated reservoir volume. J. Pet. Sci. Eng. 2020, 184, 106529. Available online: https://www.sciencedirect.com/science/article/pii/S0920410519309507 (accessed on 25 September 2019). [CrossRef]
  13. Yang, B.; Zhang, H.; Kang, Y.; You, L.; She, J.; Wang, K.; Chen, Z. In Situ Sequestration of a Hydraulic Fracturing Fluid in Longmaxi Shale Gas Formation in the Sichuan Basin. Energy Fuels 2019, 33, 6983–6994. Available online: https://pubs.acs.org/doi/10.1021/acs.energyfuels.9b00712 (accessed on 9 July 2019). [CrossRef]
  14. Luo, L.; Cheng, S.; Lee, J. Characterization of refracture orientation in poorly propped fractured wells by pressure transient analysis: Model, pitfall, and application. J. Nat. Gas Sci. Eng. 2020, 79, 103332. Available online: https://www.sciencedirect.com/science/article/abs/pii/S1875510020301864 (accessed on 6 May 2020). [CrossRef]
  15. Hun, L.; Bing, Y.; Xixiang, S.; Xinyi, S.; Lifei, D. Fracturing fluid retention in shale gas reservoir from the perspective of pore size based on nuclear magnetic resonance. J. Hydrol. 2021, 601, 126590. Available online: https://www.sciencedirect.com/science/article/pii/S0022169421006387 (accessed on 29 June 2021). [CrossRef]
  16. Mahadevan, J.; Le, D.; Hoang, H. Impact of Capillary Suction on Fracture Face Skin Evolution in Waterblocked Wells. In Proceedings of the SPE Hydraulic Fracturing Technology Conference and Exhibition, Woodlands, TX, USA, 19–21 January 2009. [Google Scholar]
  17. Liu, Y.; Leung, J.Y.; Chalaturnyk, R.; Virues, C.J. Fracturing Fluid Distribution in Shale Gas Reservoirs Due to Fracture Closure, Proppant Distribution and Gravity Segregation. In Proceedings of the SPE Canada Unconventional Resources Conference, Calgary, AB, Canada, 15 February 2017. [Google Scholar]
  18. Chen, M.; Bai, J.; Kang, Y.; Chen, Z.; You, L.; Li, X.; Zhang, Y. Redistribution of fracturing fluid in shales and its impact on gas transport capacity. J. Nat. Gas Sci. Eng. 2021, 86, 103747. Available online: https://www.sciencedirect.com/science/article/pii/S1875510020306016 (accessed on 9 December 2020). [CrossRef]
  19. Liu, H.; Hu, X.; Guo, Y.; Ma, X.; Wang, F.; Chen, Q. Fracture Characterization Using Flowback Water Transients from Hydraulically Fractured Shale Gas Wells. ACS Omega 2019, 4, 14688–14698. Available online: https://pubs.acs.org/doi/10.1021/acsomega.9b01117 (accessed on 9 September 2019). [CrossRef] [Green Version]
  20. Ghanbari, E.; Dehghanpour, H. The fate of fracturing water: A field and simulation study. Fuel 2016, 163, 282–294. Available online: https://linkinghub.elsevier.com/retrieve/pii/S0016236115009370 (accessed on 28 September 2015). [CrossRef]
  21. Liu, D.; Ge, H.; Shen, Y.; Liu, H.; Zhang, Y. Experimental investigation on imbibition characteristics of shale with highly developed bedding fractures. J. Nat. Gas Sci. Eng. 2021, 96, 104244. Available online: https://linkinghub.elsevier.com/retrieve/pii/S187551002100442X (accessed on 14 September 2021). [CrossRef]
  22. You, L.; Zhang, N.; Kang, Y.; Xu, J.; Cheng, Q.; Zhou, Y. Zero Flowback Rate of Hydraulic Fracturing Fluid in Shale Gas Reservoirs: Concept, Feasibility, and Significance. Energy Fuels 2021, 35, 5671–5682. [Google Scholar] [CrossRef]
  23. Chen, M.; Kang, Y.; Li, X.; Wang, W.; Yang, B.; Liu, H. Investigation of multi-scale gas transport behavior in organic-rich shale. J. Nat. Gas Sci. Eng. 2016, 36, 1188–1198. Available online: https://www.sciencedirect.com/science/article/pii/S1875510016301688 (accessed on 19 April 2016). [CrossRef]
  24. Zhu, W.; Qi, Q.; Ma, Q.; Deng, J.; Yue, M.; Liu, Y. Unstable seepage modeling and pressure propagation of shale gas reservoirs. Pet. Explor. Dev. 2016, 43, 285–292. Available online: https://www.sciencedirect.com/science/article/pii/S1876380416300325 (accessed on 18 April 2016). [CrossRef]
  25. Ren, Q.-Y.; Chen, G.-J.; Yan, W.; Guo, T.-M. Interfacial Tension of (CO2 + CH4) + Water from 298 K to 373 K and Pressures up to 30 MPa. J. Chem. Eng. Data 2000, 45, 610–612. [Google Scholar] [CrossRef]
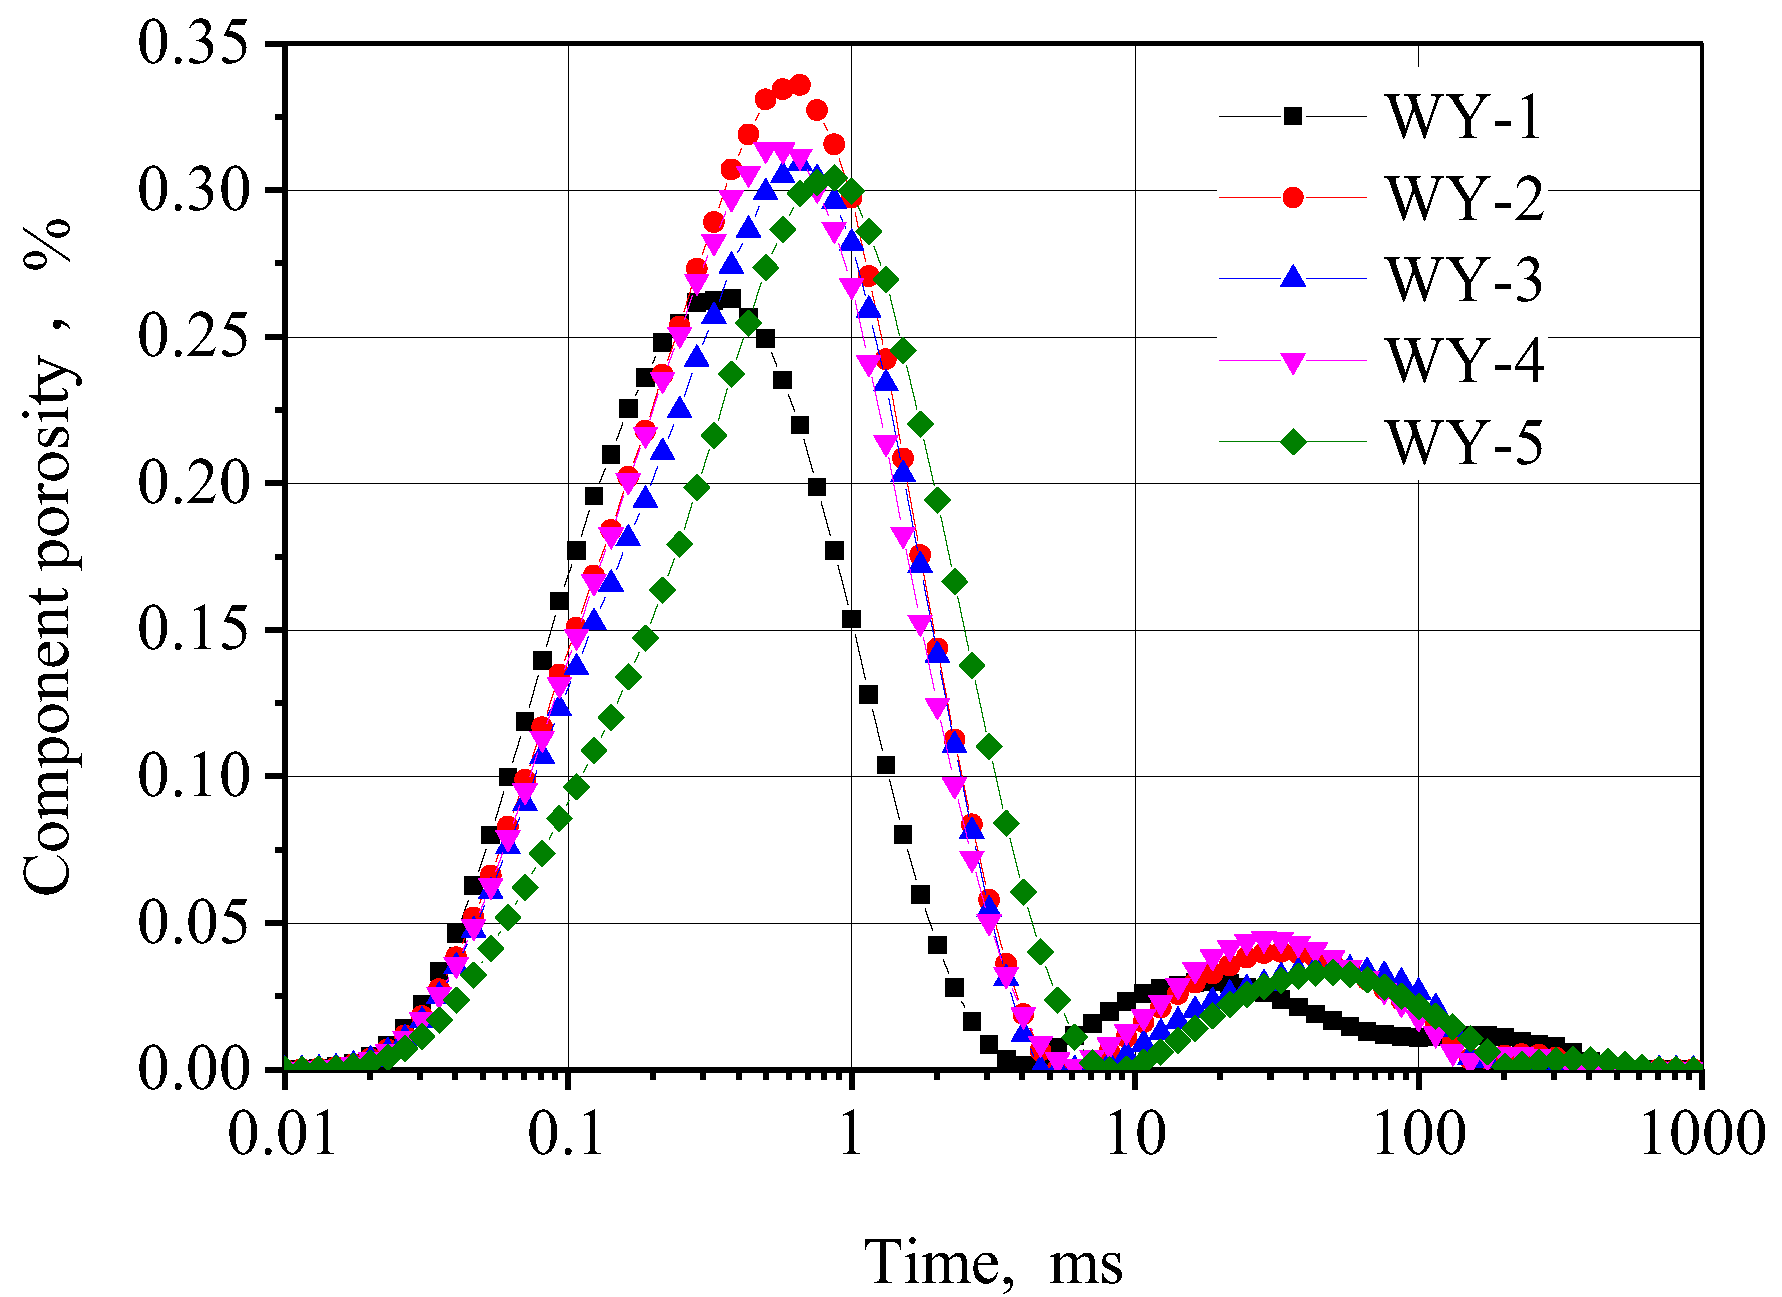
Figure 1. T2 map of 5 shale samples.
Energies 15 07802 g001
Figure 2. Schematic diagram of experimental device.
Energies 15 07802 g002
Figure 3. Relationship between permeability and flowback time of five shale samples under different flowback pressure differences.
Energies 15 07802 g003
Figure 4. Relationship between outlet pressure and flowback time of five shale samples.
Energies 15 07802 g004
Figure 5. Relationship between flowback pressure difference and permeability of five shale samples.
Energies 15 07802 g005
Figure 6. Relationship between pressure gradient and permeability of five shale samples.
Energies 15 07802 g006
Figure 7. Relationship between pressure gradient and permeability damage rate of five shale samples.
Energies 15 07802 g007
Figure 8. Comparison map of T2 spectra of five shale samples after saturated water and flowback (After flowback of 5 samples, the right peak disappeared obviously and the leaf peak moved down or left).
Energies 15 07802 g008
Figure 9. Distribution of distilled water in multiscale pore spaces of five shale samples after saturated water and water flow back (The content of water phase larger than 100nm pore diameter decreased obviously, while in pores smaller than 100 nm did not change obviously).
Energies 15 07802 g009
Figure 10. Distribution of saturated water and water phase after flowback in multiscale pores and fractures of shale samples (ae, respectively, correspond to samples WY-1~WY-5; The water content in the pore of 2~10 nm after flowback remains unchanged or slightly increases. The water content in the pore space of 10~50 nm decreases or remains unchanged).
Energies 15 07802 g010
Figure 11. Schematic of flowback of water phase in slit pores and cylindrical pores (green is water phase).
Energies 15 07802 g011
Figure 12. Capillary forces of slit-type and cylindrical pores with different sizes ((a) refers to slit-type pore; (b) a cylindrical pore).
Energies 15 07802 g012
Figure 13. Schematic of flowback of water phase in shale multiscale pore structure.
Energies 15 07802 g013
Figure 14. Dropped particles of the WY-1 shale sample.
Energies 15 07802 g014
Figure 15. Flowback pressure difference and amount of shale particles dropped per unit mass shale.
Energies 15 07802 g015
Figure 16. Schematic of water distribution and shale particle migration under low backflow pressure difference and high backflow pressure difference.
Energies 15 07802 g016
Table 1. Basic information of the experimental sample.
Sample IDLength, mmDiameter, mmMass, gHe Porosity,%Initial Gas Permeability, mD
WY-139.2425.3051.92714.320.24
WY-238.2425.3050.12074.500.35
WY-331.8925.3041.60263.900.42
WY-438.2425.3049.74095.000.37
WY-539.8025.3050.95804.900.45
Note: The test medium used for initial permeability is N2, with the experimental confining pressure of 5 MPa, the inlet pressure of 1.6 MPa, and the back pressure of 1.0 MPa. The permeability of the sample adopts the Darcy formula of gas [23]. The gas porosity testing instrument is SCMS-300.
Table 2. Corresponding flowback pressure gradient under four production systems.
Production SystemPore Pressure, MPaBottom Hole Flowing Pressure, MPaPressure Gradient, MPa/cm
7 mm nozzle × 16.00 mm pore plate70.3557.420.06
8 mm nozzle × 16.00 mm pore plate51.400.09
10 mm nozzle × 26.00 mm pore plate42.580.13
9 mm nozzle × 22.00 mm pore plate40.390.14
Table 3. Corresponding table between shale sample and backflow pressure difference.
Sample IDPressure Gradient, MPa/cmPressure Difference, MPa
WY-10.060.24
WY-20.090.34
WY-30.130.41
WY-40.140.54
WY-50.180.72
Table 4. Water content in shale pore space after flowback.
Sample IDFlowback Pressure Gradient, MPa/cmWater Content after Pressure Saturation, %Water Content after Flowback, %
WY-10.061009.68
WY-20.0910011.25
WY-30.1310012.76
WY-40.1410014.91
WY-50.1810016.97
Table 5. Distribution characteristics of saturated water and after flowback water phase in shale multiscale pore structure.
Sample IDTreatmentPore Volume, cm30~2
nm
2~10
nm
10~50
nm
50~100
nm
100~1000 nmD > 1000
nm
Water Content,%Water Content,%Water Content,%Water Content,%Water Content,%Water Content,%
WY-1Saturation water1.1114.0850.4425.340.606.892.72
After flowback15.5451.5018.890.080.730.11
WY-2Saturation water1.389.2240.9738.612.835.832.63
After flowback15.7040.839.830.620.840.02
WY-3Saturation water1.059.2640.2040.072.744.673.05
After flowback11.1041.3436.750.410.070.09
WY-4Saturation water1.319.2642.0836.542.687.002.58
After flowback11.1041.3436.750.410.070.09
WY-5Saturation water1.276.5233.5445.266.825.243.26
After flowback9.3337.7945.735.420.560.00
Publisher’s Note: MDPI stays neutral with regard to jurisdictional claims in published maps and institutional affiliations.