Article

Performance and Economic Analysis of the Multi-Energy Complementary Heating System under Different Control Strategies in Cold Regions

1
College of Water Conservancy and Architecture Engineering, Shihezi University, Shihezi 832000, China
2
Engineering Research Center of Forestry Biomass Materials and Bioenergy, Beijing Key Laboratory of Lignocellulosic Chemistry, College of Materials Science and Technology, Beijing Forestry University, Beijing 100083, China
*
Author to whom correspondence should be addressed.
Energies 2022, 15(21), 8140; https://doi.org/10.3390/en15218140
Submission received: 5 October 2022 / Revised: 26 October 2022 / Accepted: 27 October 2022 / Published: 1 November 2022

Abstract

:
Multi-energy complementary heating (MECH) is the most promising and potential heating technology of the future. However, owing to the increase in energy types, the system is complex, and the operation procedure cumbersome. In addition, due to the uncertainty of climate conditions, it is difficult to develop a general control strategy suitable for all heating systems. In order to study the optimal control strategy of MECH systems with solar, biomass, and electric energy as three heat sources in cold regions, the system heating was tested over different periods during the entire heating season for rural residential buildings in cold regions, and the operating performance of the system was evaluated. The MECH experiment, based on the optimal control strategy, was compared with other different heating systems, and the economic and environmental benefits of the system were further evaluated. The results showed that, compared with room temperature control strategy (RS-CON), the control strategy of the heat storage tank (HST-CON) with sufficient solar energy (SE) can afford a higher solar fraction by 10%, more HST heating hours, and lower operating costs and CO2 emissions. During heating operation, Mode 3 [biomass boiler (BB) + heat storage tank (HST) heating] was the best heating mode. At the end of the heating period, Mode 5 (HST heating) met the indoor heat demand and had a significant energy-saving effect. From the perspective of the whole heating season, HST-CON heating operation can generate lower energy consumption costs and achieve almost zero CO2 emissions. This study is of great significance because it provides an engineering reference for the rational the utilization of MECH systems in cold regions.

1. Introduction

In recent years, energy shortages and environmental problems have become increasingly prominent, which has become a serious challenge for global sustainable development [1,2]. Countries around the world have introduced low-carbon policies to protect the environment. China has also proposed carbon peaking and carbon neutralization as its development strategy [3]. The energy consumption share of space heating in the building field is large, accounting for 21% of the total building energy consumption in China [4]. Therefore, improving heating systems and reducing heating energy consumption are important measures for achieving energy conservation and emission reduction [5].
In order to respond positively to this measure, China has begun to promote solar heating [6], biomass heating [7], natural gas heating [8], and other clean heating methods. However, because most clean energies are unstable, a single energy source cannot fully satisfy the thermal demand of buildings. Therefore, using various forms of energy coupling to form a MECH mode can effectively provide the advantages of various energy systems and simultaneously improve energy utilization rates and heating stability [9,10].
For MECH technology, scholars worldwide have garnered extensive attention. Zhang et al. experimentally investigated complementary heating involving SE and biomass energy (BE), whose contribution rates were 63.31% and 36.69%, respectively [11]. Liu et al. discovered that, compared with the single-air source heat pump system, the solar-air source heat pump system can reduce energy consumption by 55.38% and carbon emissions by 55.48% [12]. Zhang et al. analyzed the operation of a hybrid solar ground source heat pump system comprising a ground source heat pump system and a solar-assisted ground source heat pump system and discovered that using SE significantly affects the performance of the entire system [13]. Gao et al. constructed an experimental platform for a solar-combined gas heating system in Tianjin and comprehensively evaluated the performance of the system. The results showed that the heating system operated stably; in fact, the better the solar radiation, the higher was the renewable energy output of the system and the better was the operating performance [14]. Huang et al. investigated the combination of single-family solar thermal and air-source heat pumps, gas boilers, electric heaters, and storage electric boilers with four different types of auxiliary heat sources for heating to determine the optimal solar collector area and solar fraction based on different auxiliary heat sources [15].
Owing to an increase in the number of heat sources, the operation of MECH systems has become more complex, and their operation modes more diversified, which makes the use of each energy efficiency is not high [16,17]. Therefore, a reasonable control strategy is the key to coordinating the stable operation of all components of the system and improving the system’s performance [18,19]. Li et al. analyzed the effects of different control strategies on system performance during a non-heating season via experiments and simulations, and the results showed that adopting an appropriate control strategy improved the operating performance of solar collectors [20]. Liu et al. proposed a time and spatial partition heating mode and confirmed its superiority in terms of heating performance, thus providing a better operating option for rural houses [21]. Li et al. compared three control strategies: the heating storage priority control mode, electro-thermally assisted priority control mode, and hybrid control mode using an electric auxiliary cross-season solar heat storage heating system. The results indicated that the hybrid control mode effectively reduced power consumption during the heating season [22]. Qiu et al. proposed a time-share heating strategy applicable to commercial buildings that effectively reduced the cost of system operation while satisfying the heating demand [23].
From the above studies, MECH technology is developing rapidly and relatively mature, but a well-matched control strategy is still a key factor affecting the system’s performance. At present, owing to the different climate conditions and energy types, it is difficult to establish a general control strategy suitable for all heating systems, therefore, it has essential application value to formulate a well-matched control strategy that matches the actual situation in the field of heating.
In this paper, the testing house in Tumxuk City in southern Xinjiang was selected as the research object, to explore the control strategy of the MECH system that matches the coupling of solar energy, biomass energy, and electric energy in the cold region. The main contents of this study aim to (1) determine the optimal control strategy in the middle period of heating: (i) RS-CON and (ii) HST-CON; (2) further explore the system’s operating performance at the end of the heating period; (3) analyze the advantages of HST-CON in the entire heating season.

2. Description of Experimental System

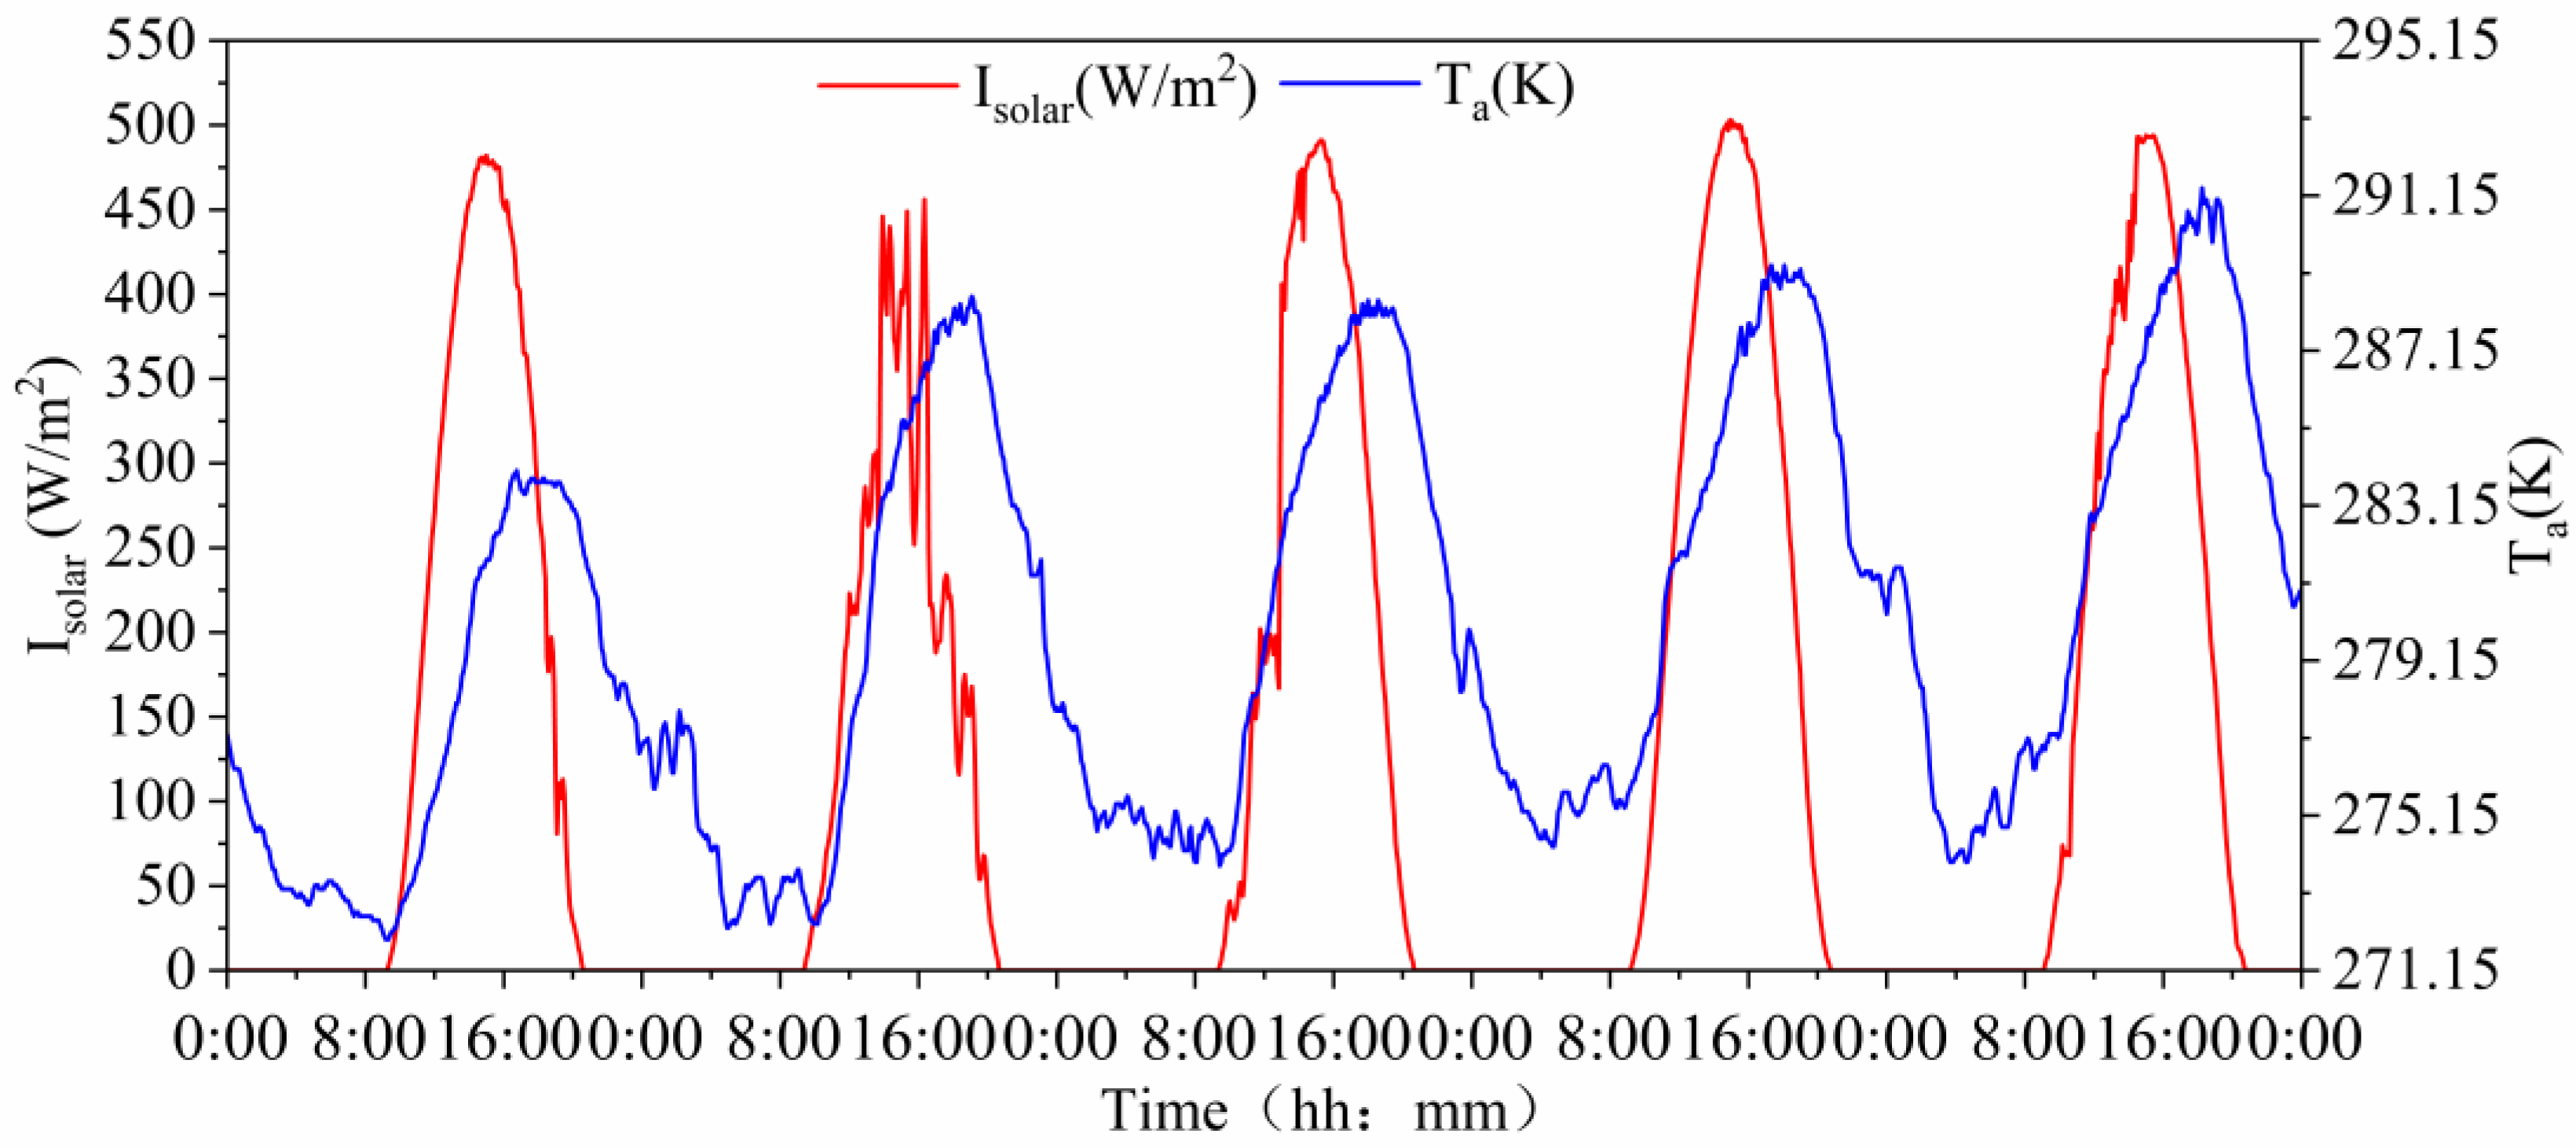
2.1. Testing House Information and Climate Condition

The testing house was a rural residence, located in Tumxuk City in southern Xinjiang (latitude N 39.97°, longitude E 79.09°), which is in a cold region. The heating period was from 15 November to 15 March during 2021–2022. The total area of the house was 125.89 m2 with 7 rooms. The building envelope information of the test house is provided in Supplementary Material, Table S1. The dynamic heat load of the building calculated using DeST2.0 software is shown in Supplementary Material, Figure S1. The heating heat load of the house was 3.45 kW, the heating index per unit area was 27.40 W/m2, and the total heat consumption during the heating period was 19.88 GJ.
In the heating season, the minimum temperature in this region can reach 256.05 K, and the maximum temperature can reach 288.95 K. The average temperature was 271.26 K. The SE resources are abundant. The total radiation can reach 290,040.31 W/m2; the heating days were 170 days, including 157 sunny days and 13 cloudy days. Supplementary Material, Figure S2 shows the dry bulb temperature and solar radiation (Isolar).

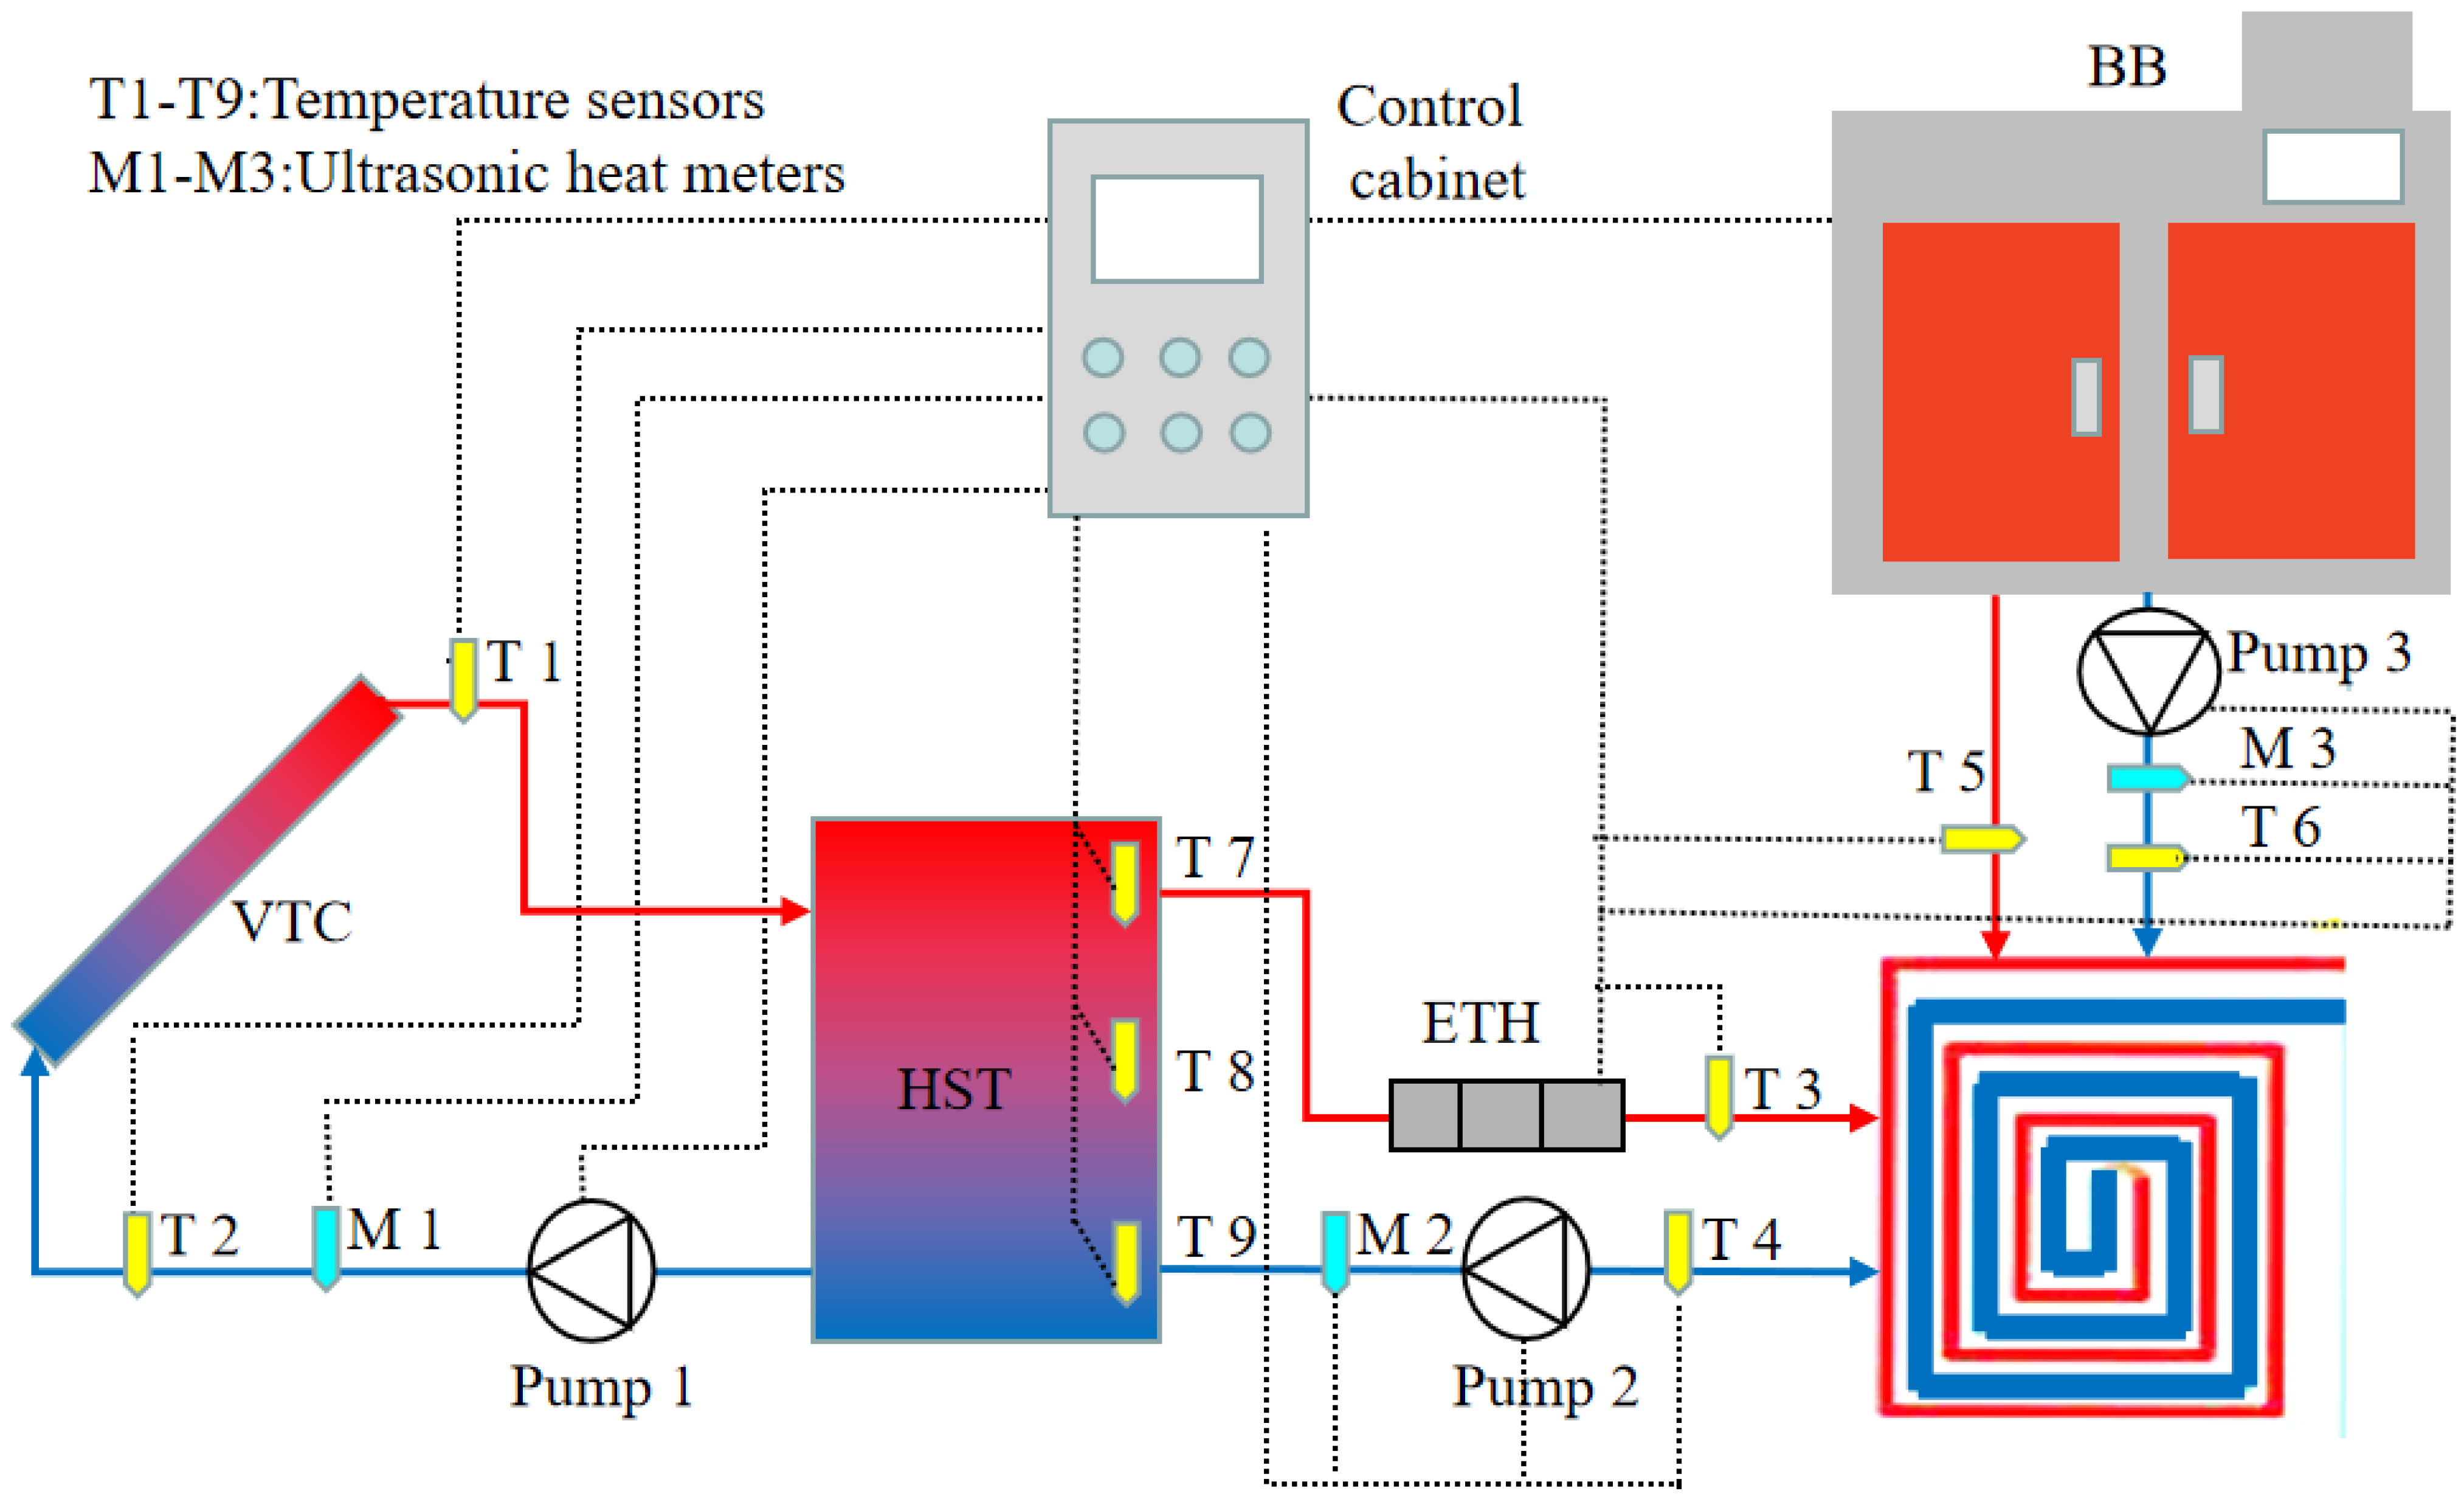
2.2. Component of MECH System

The MECH system was composed of a SE heating unit, a BE heating unit, an electric energy heating unit, and a control unit. Figure 1 shows a diagram of the system, and Figure 2 shows photographs of the system equipment. Eight sets of vacuum tube collectors (VTCs) with a total area of 24.32 m2 (3.04 m2 for each) were used for the solar loop. The HST was constructed using stainless steel, featured a volume of 3 m3, and was connected in series with the VTC. The BB, with a rated power of 15 kW, and the electric heating heater (EHT), with a rated power of 10 kW, were used as auxiliary heat sources installed in series and parallel with the VTC, respectively.

2.3. Testing Instrument

In the MECH system, YNRC-DN25 ultrasonic heat meters were used to measure the flow rates, temperature, and accumulated heat quantities of the fluid in the heating system loop. Additionally, the testing temperature range of the ultrasonic heat meters was 277.15–368.15 K, the testing mass flow range was 0.07–7 m3/h, and the testing accuracy was ±5%. The upper, middle, and lower temperatures of HST (Ttop, Tmiddle, and Tlower, respectively) as well as the least favorable room temperature (Troom) were measured by HYC-WA3 temperature sensors with the temperature range from 223.15 K to 373.15 K and testing accuracy of ±1%. The temperature and flow rate of the working fluid were measured at different monitoring points, as shown in Figure 1. An LU-193 electricity monitoring meter was used to measure the power consumption of each device. The electricity monitoring meter had ±0.5% testing accuracy in the range of AC85-265 V and DC85-330 V. All the test devices were monitored using a control cabinet-based data acquisition system, and data were recorded by the acquisition system every minute. The weather station Vantage Pro2 was installed on the roof to measure the ambient temperature (Ta) and solar radiation (Isolar). The weather station had ±0.5% temperature accuracy with a range from 228.15 K to 338.15 K and had ±5% with a range of 0–1800 W/m2. The main parameters of the test instruments are listed in Supplementary Material, Table S2.

2.4. Control Strategy

The starting and stopping times of the pump for the solar-collecting circulation were affected by the temperature difference between the outlet fluid temperature of the VTC (Tvtc,out) and the average temperature of the HST (Taverage). The default start and stop temperature differences were 279.15 and 275.15 K, respectively. At the early stage of the experiment, we conducted a pre-test on 7 rooms in the testing house, and determined the room with the lowest temperature, which was named the least favorable room. During the heating experiment, we took the least favorable room as the test object for experiment and analysis.
Two different MECH system control strategies were investigated. To determine the optimal control strategy, the two control strategies were first compared by evaluating the operating performance of the system during the middle heating period. Subsequently, owing to the significant Ta difference between the middle and end heating periods, an optimal control strategy was used to test the system in the end heating period. The performance of the system was investigated using an optimal control strategy in different spatial and temporal dimensions. The heating control strategies were formulated to meet the principle of energy priority. When SE was abundant, the heat stored in the HST was used first, followed by BB or ETH. When SE was not abundant, BB and ETH were used as auxiliary energy for heating. The operating conditions for each control strategy were as follows:
RS-CON [24]: The Troom for the heat supply was set to 291.15 K and 295.15 K for starting and stopping the heat supply system, respectively. Notably, the heat storage for the HST was completed the previous day. Subsequently, the HST began operating the next day when Taverage was greater than or equal to 308.15 K and Troom was less than or equal to 291.15 K. When Taverage was less than or equal to 303.15 K the BB or ETH operated until Troom reached 295.15 K, at which heating was terminated. The control strategy can be categorized into two operating conditions: Mode 1 (HST + BB heating) and Mode 2 (HST + ETH heating).
HST-CON: The HST can be used immediately after heat accumulation. At night, when Troom was less than or equal to 291.15 K and the heat from the HST was insufficient, the BB or ETH was turned on for heating until Troom reached 295.15 K. When Taverage reached 308.15 K during the operation, the BB or ETH was switched to the HST for heating until the temperature in the HST decreased to 303.15 K or Troom reached 295.15 K, at which point heating was terminated. The control strategy can be categorized into two operating conditions: Mode 3 (BB + HST heating) and Mode 4 (ETH + HST heating).

3. Evaluation Methodology

3.1. Energy Analysis

The heat accumulated by the VTC is determined as follows [25]:
Q vtc = C p m vtc ( T vtc , out     T vtc , in ) ,
where Cp is the specific heat capacity of the working fluid [J/(kg∙K)]; mvtc is the mass flow rate of the circulating fluid in the VTC (kg/s); Tvtc,out and Tvtc,in are the outlet and inlet fluid temperatures of the VTC, respectively (K).
The heat supplied by the HST can be calculated as follows [26]:
Q st = C pt m st ( T st , out     T st , in ) ,
where Cpt is the specific heat capacity of water [J/(kg∙K)]; mst is the mass flow rate of the circulating fluid in the HST (kg/s); Tst,out and Tst,in are the outlet and inlet fluid temperatures of the HST, respectively (K).
The heat supplied by the BB is determined as follows [27]:
Q b = C pt m b ( T b , out     T b , in ) ,
where mb denotes the mass flow rate of the circulating fluid in the BB (kg/s); Tb,out and Tb,in are the outlet and inlet fluid temperatures of the BB, respectively (K).
The heat supplied by the ETH can be expressed as follows [21]:
Q eth = C pt m eth ( T eth , out     T eth , in ) ,
where meth denotes the mass flow rate of the circulating fluid in the ETH (kg/s); Teth,out and Teth,in are the outlet and inlet fluid temperatures of the ETH, respectively (K).
The solar fraction of the MECH system can be written as follows [28]:
f = Q vtc Q vtc + Q b   + Q eth

3.2. Operation Cost Analysis

The operating cost of the MECH system is measured by the price of electricity and biomass fuel, as follows:
C = P e   E + P b   M b
where C is the cost incurred by the operation of the MECH system (RMB/USD); Pe is the price of electricity, which is 0.39 RMB/kWh (0.05 USD/kWh) in this study; E is the electricity consumption (kWh); Pb is the price of biomass fuel, which is 0.75 RMB/kg (0.10 USD/kg) in this study; Mb is the biomass fuel consumption (kg).

4. Results and Discussion

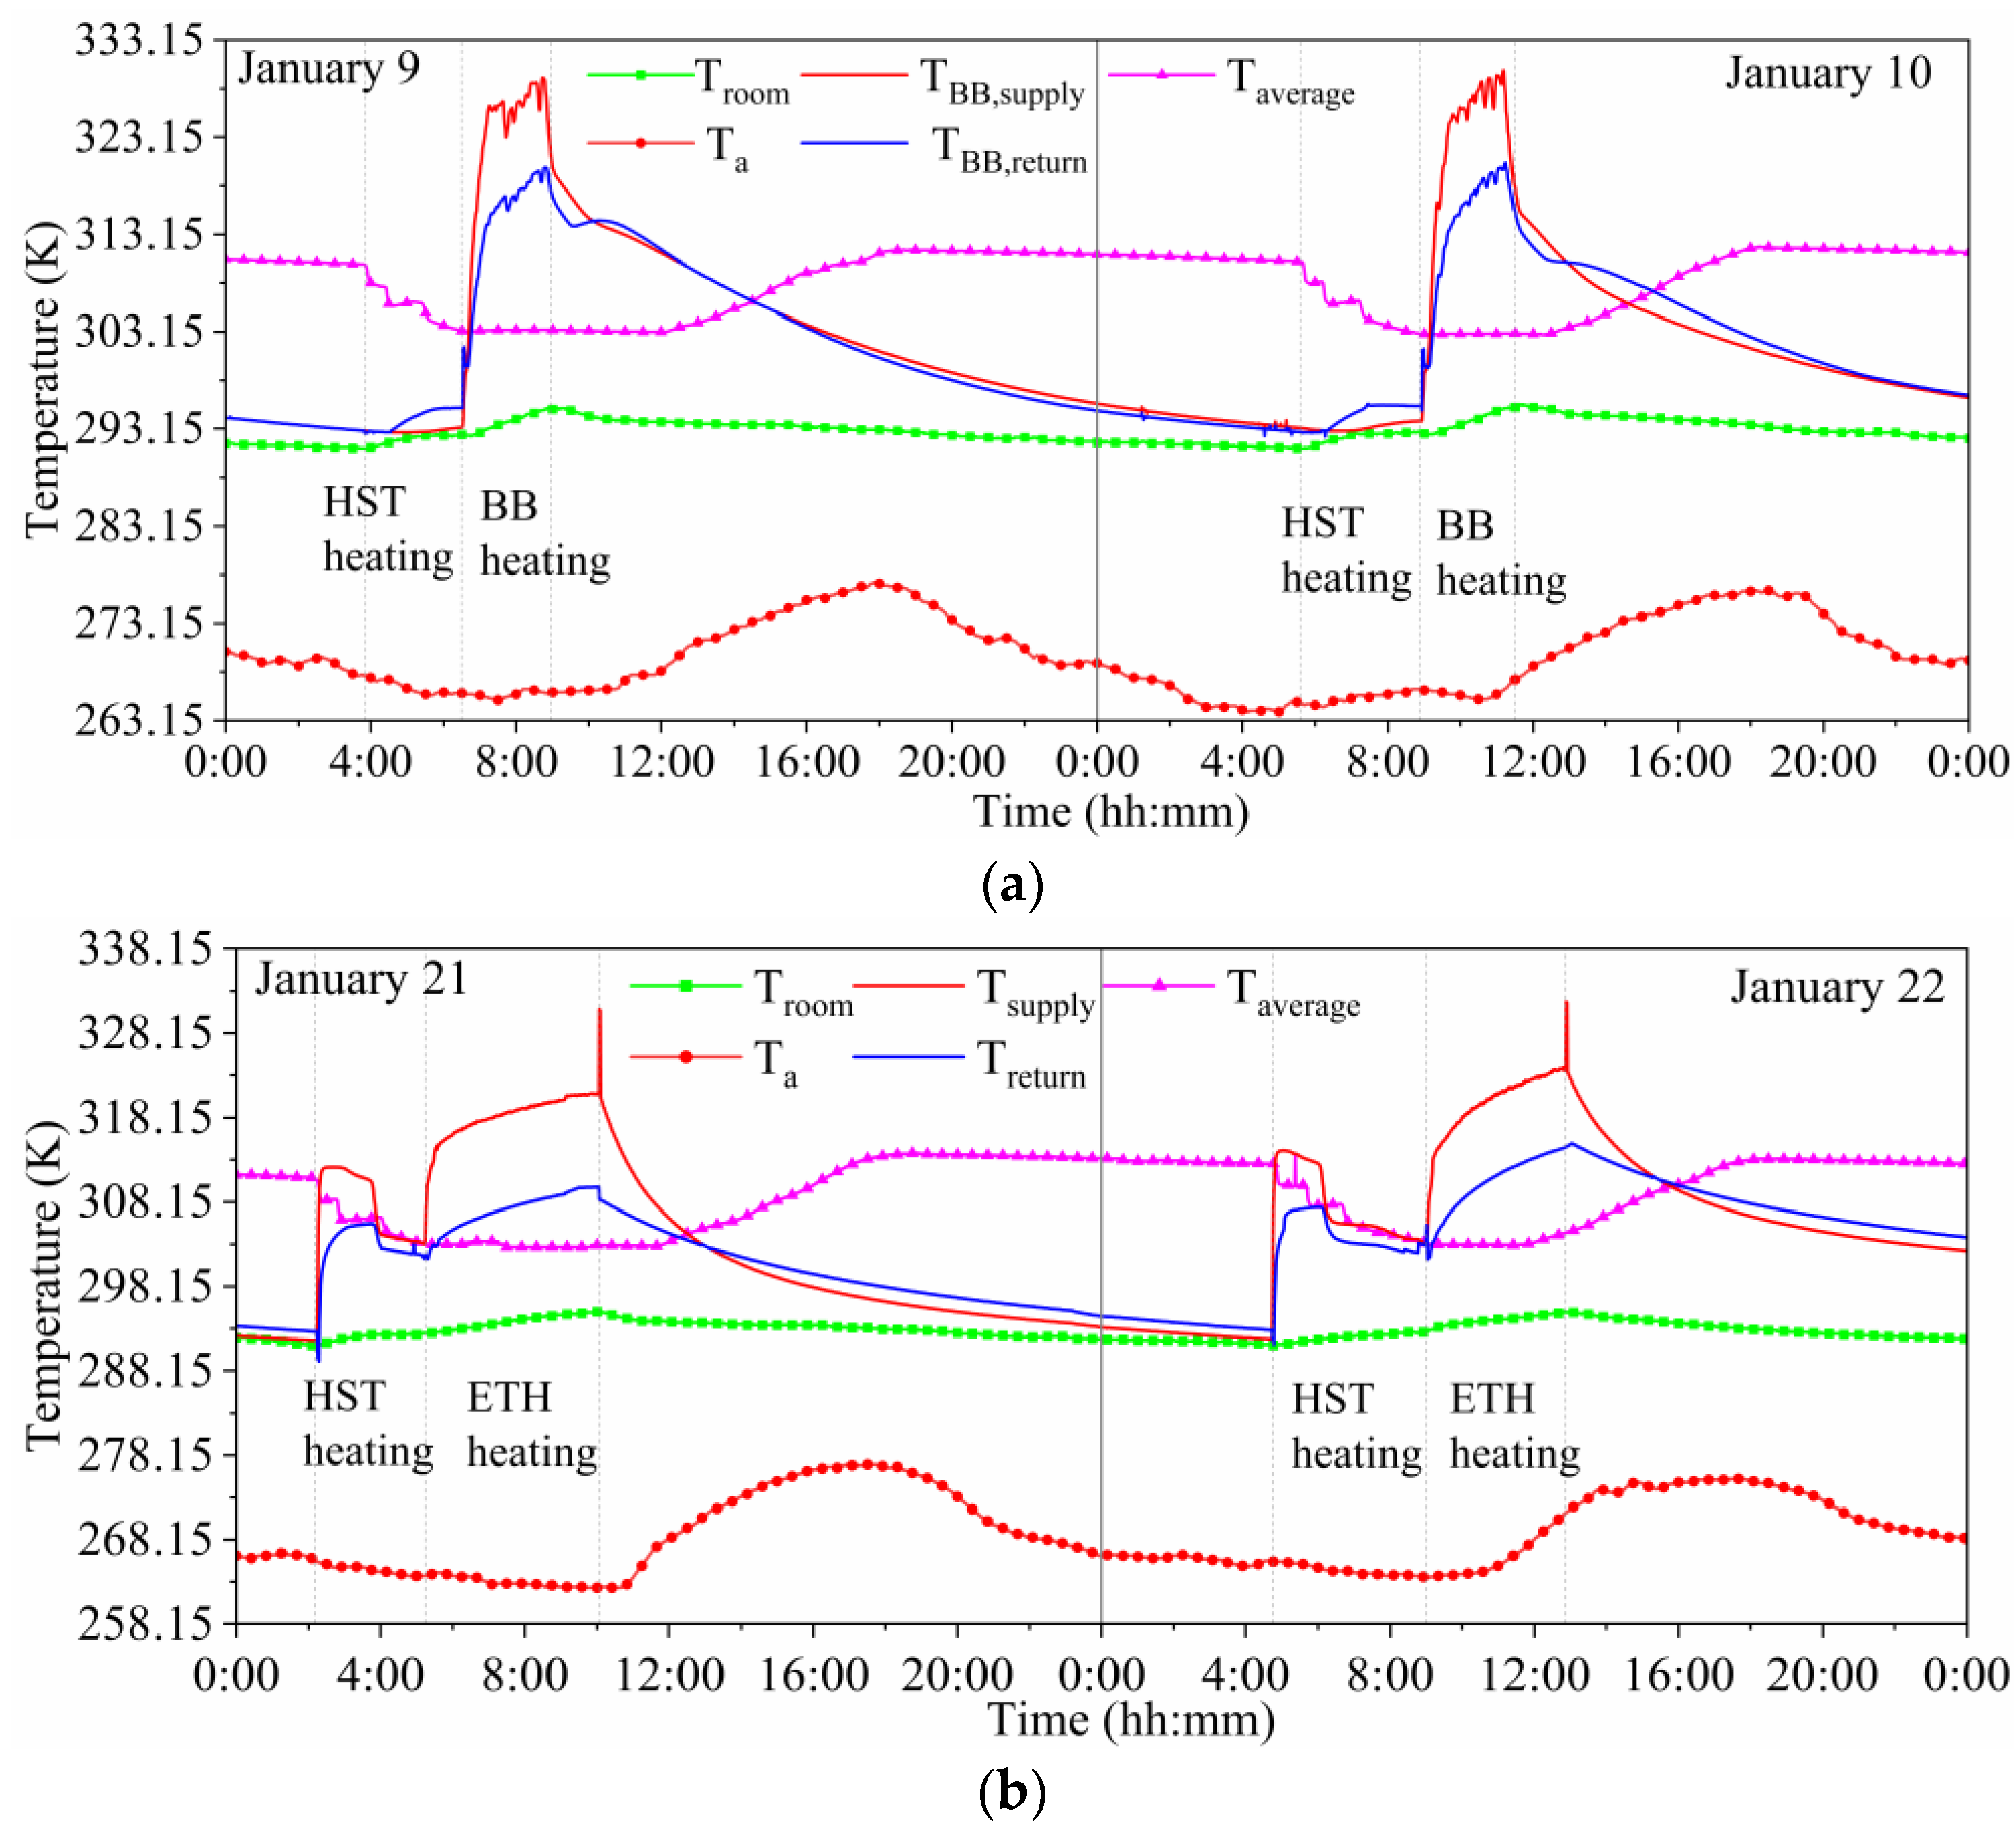
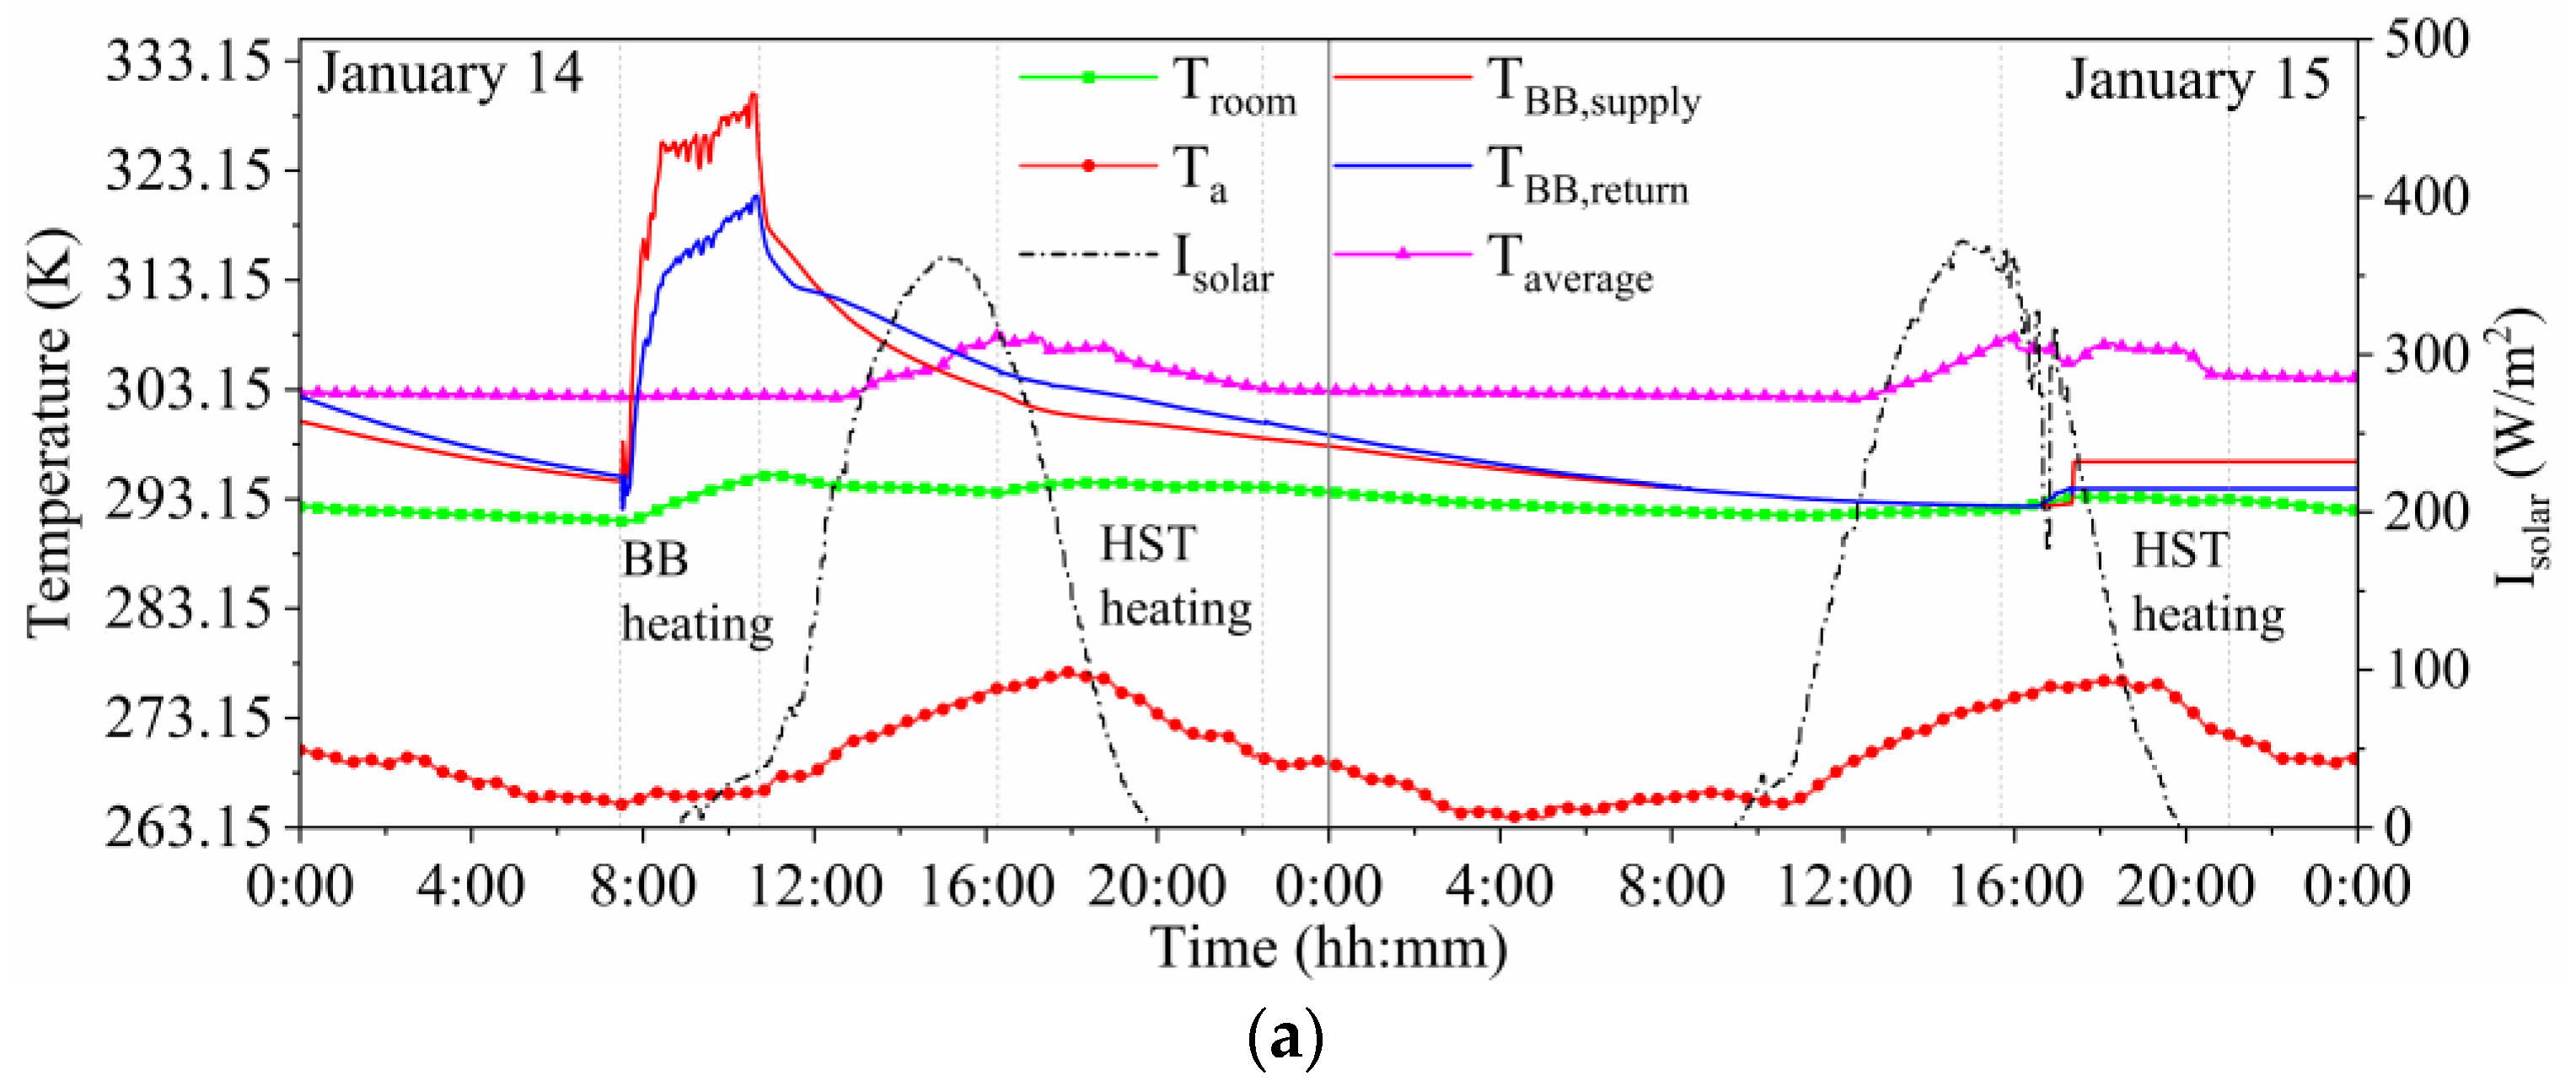
4.1. Analysis of RS-CON Test Results

The operation of the VTC was carried out from 8 to 9 January, and 20 to 21 January. The Isolar, Tvtc,out, Tvtc,in and heat accumulated(Qvtc) are shown in Figure 3. During the test, I exceeded 200 W/m2 and reached 400 W/m2. The operating time of the VTC was 12:00–18:00. Tvtc,out and Tvtc,in was between 275.15 K to 280.15 K. The maximum Qvtc was 7.7 kW. Clearly, Tvtc,out,Tvtc,in and Qvtc were affected by Isolar. Additionally, the test results show that the VTC accumulated more than 117.1 MJ of heat, which is sufficient for heating by the system.
Mode 1: The experimental test data for Mode 1 are presented in Figure 4a. On 9 January, the HST was operated at night for 2.65 h from 3:50 until 6:29. Immediately thereafter, the BB was operated until the end of operation at 8:57. By contrast, on 10 January, the HST supplied a higher amount of heat; thus, its night-time operation was extended. In addition, owing to the lower Ta on that day, to increase the room temperature by 275.65 K, the operating time of the BB was increased accordingly. Table S3 in Supplementary Material shows the statistics of the key operational data for Mode 1.
Mode 2: The test lasted for two days from 21 to 22 January. The operation of Mode 2 is shown in Figure 4b. The ETH was operated for 4.8 h and 3.87 h on the two days of the test, respectively. The low Ta between 5 a.m. and 10 a.m. resulted in a higher heat dissipation from the system and a longer heating time required to achieve a Troom of 295.15 K. Table S4 in Supplementary Material shows the statistics of the key operational data for Mode 2.

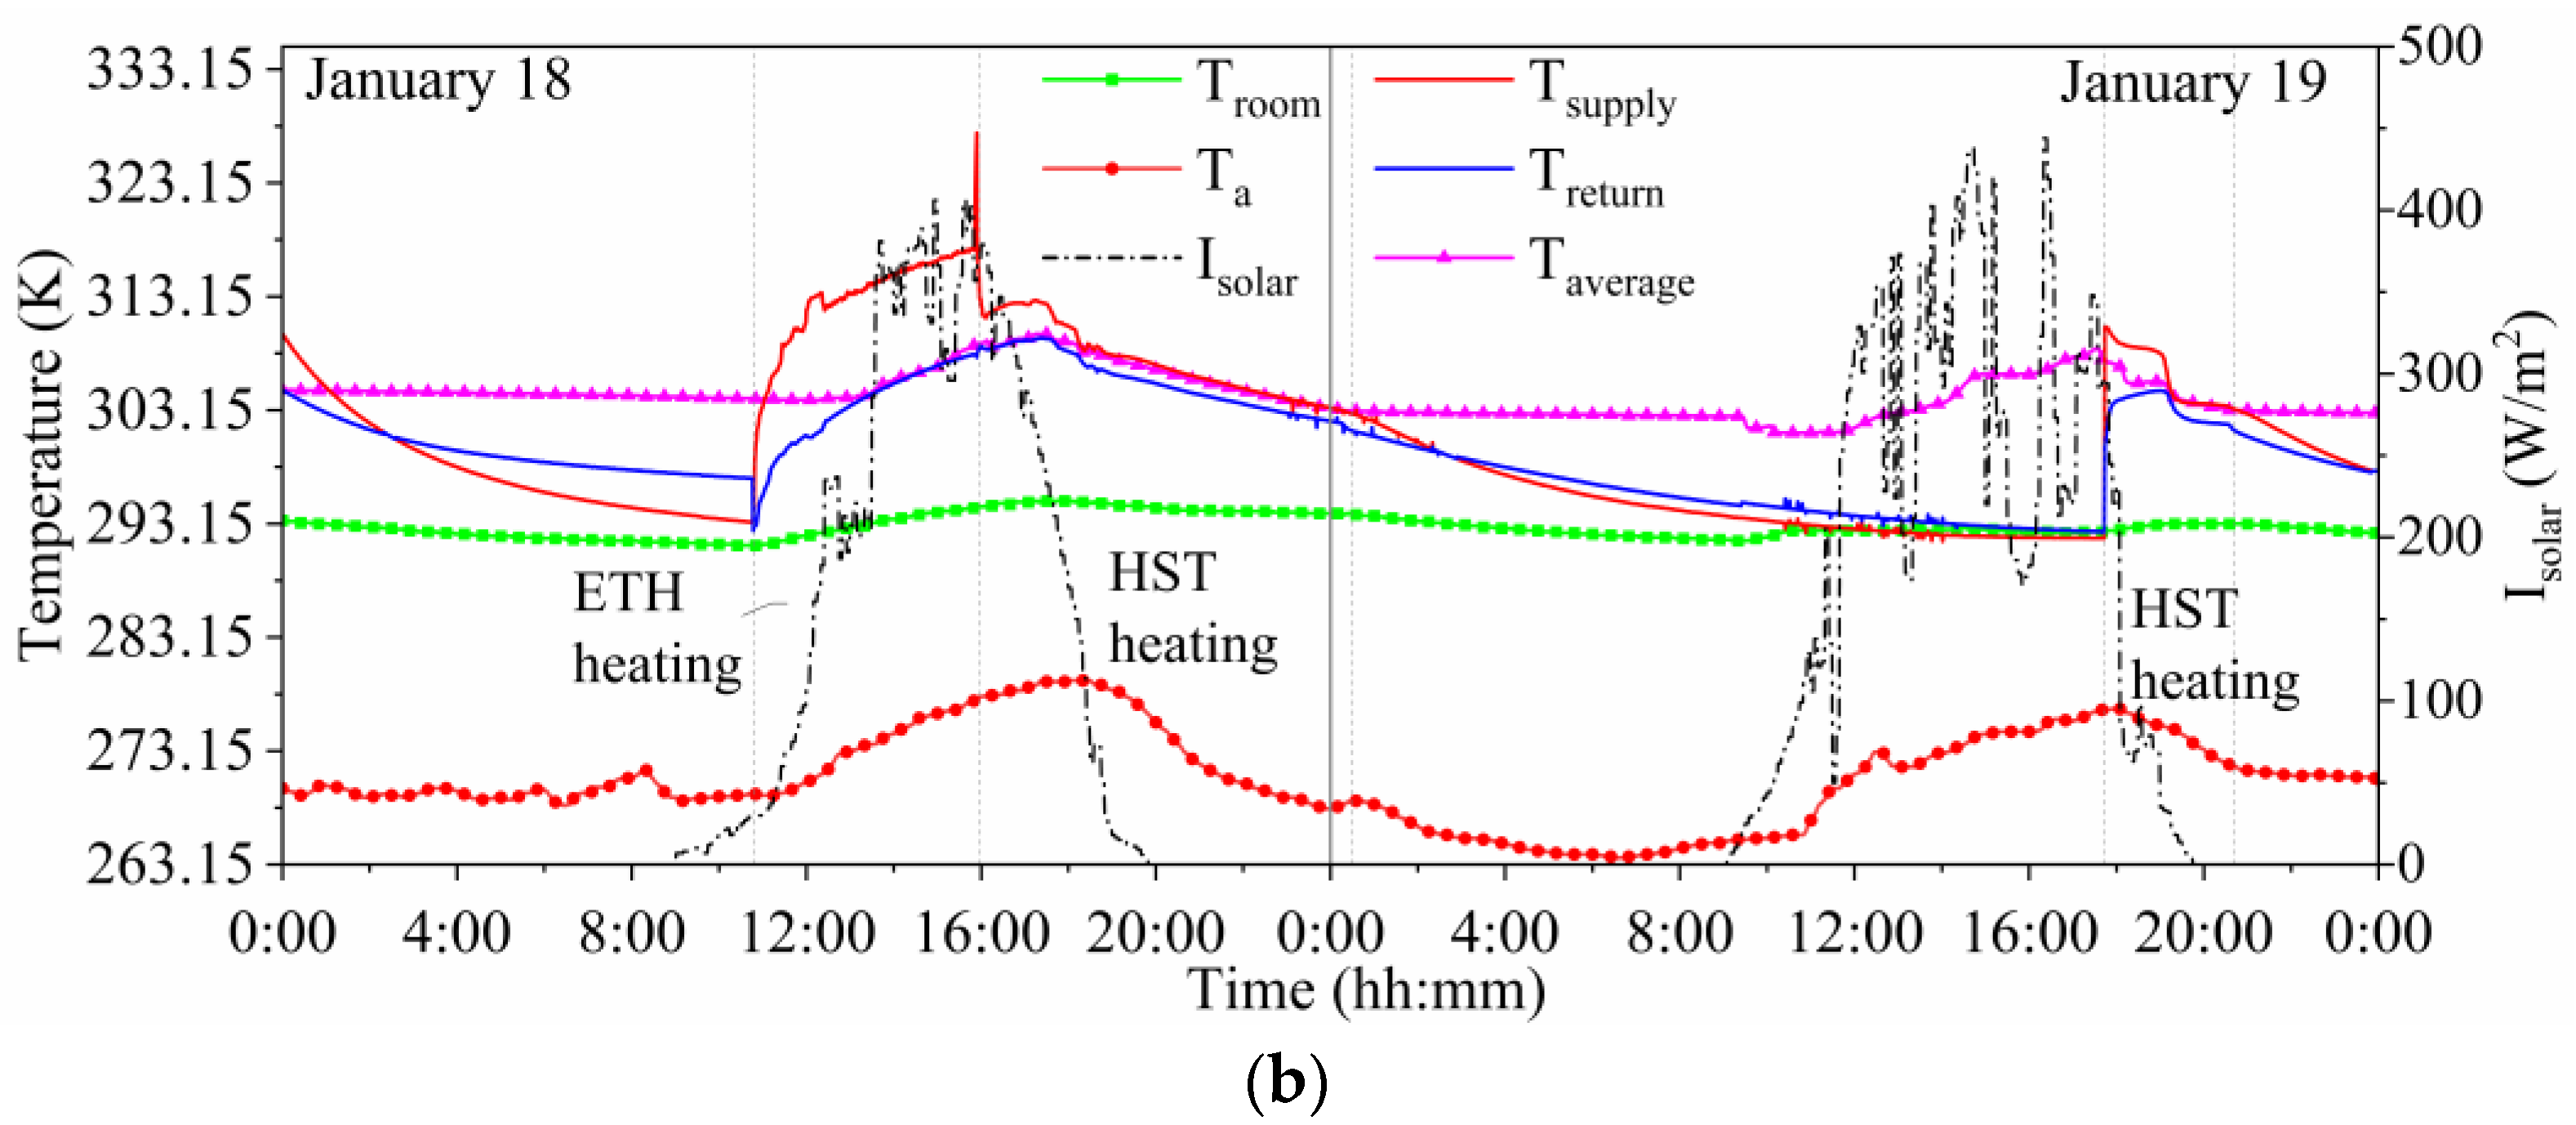
4.2. Analysis of HST-CON Test Results

Mode 3: The operation of Mode 3 is shown in Figure 5a. In the early morning of 14 January, due to the lack of Isolar, the HST of heat storage could not be carried out. When Troom decreased to 291.15 K, the BB was first turned on for heating. Therefore, TBB,supply and TBB,return increased rapidly at 7:27 until Troom reached the maximum limit of 295.15 K, showing a slow downward trend. During the day, as Isolar increased, Taverage soon reached 308.15 K, and heat was supplied from 16:17 to 22:26. At night, with the decrease in outdoor temperature, Troom had a slow downward trend, but it still maintained above 291.15 K. Until 15:40 on 15 January, the HST again met the heating conditions and started heating. During this process, the maximum temperature of Troom was 293.35 K. Table S5 in Supplementary Material shows the statistics of the key operational data for Mode 3.
Mode 4: The test lasted for two days from 18 to 19 January. The operation of Mode 4 is shown in Figure 5b. Different from Mode 3, this mode used ETH for auxiliary heating. Owing to different heating efficiency, it can be seen that ETH ran for a longer time. Therefore, Troom did not rise to 295.15 K when Taverage reached 308.15 K. According to HST-CON, the ETH was turned off whereas the HST was turned on. The seamless connection of ETH heating and HST heating kept the floor temperature warm, thus extending the heating time of the thermal storage tank. On 19 January, Isolar fluctuated greatly, resulting in less heat collected by the VTC and greatly reducing the heating hours of the HST. However, under this control strategy, Troom could still be maintained above 291.15 K. Table S6 in Supplementary Material shows the statistics of the key operational data for Mode 4.
The above control strategies were all heating experiments conducted under the condition of abundant SE. Owing to the relatively abundant SE resources in Tumxuk City during the heating season, only a few days had weak Isolar. Therefore, when the indoor temperature cannot meet the heat demand, BB or ETH auxiliary equipment was used for heating. Detailed experimental data are provided in Figure S3, Supplementary Material.

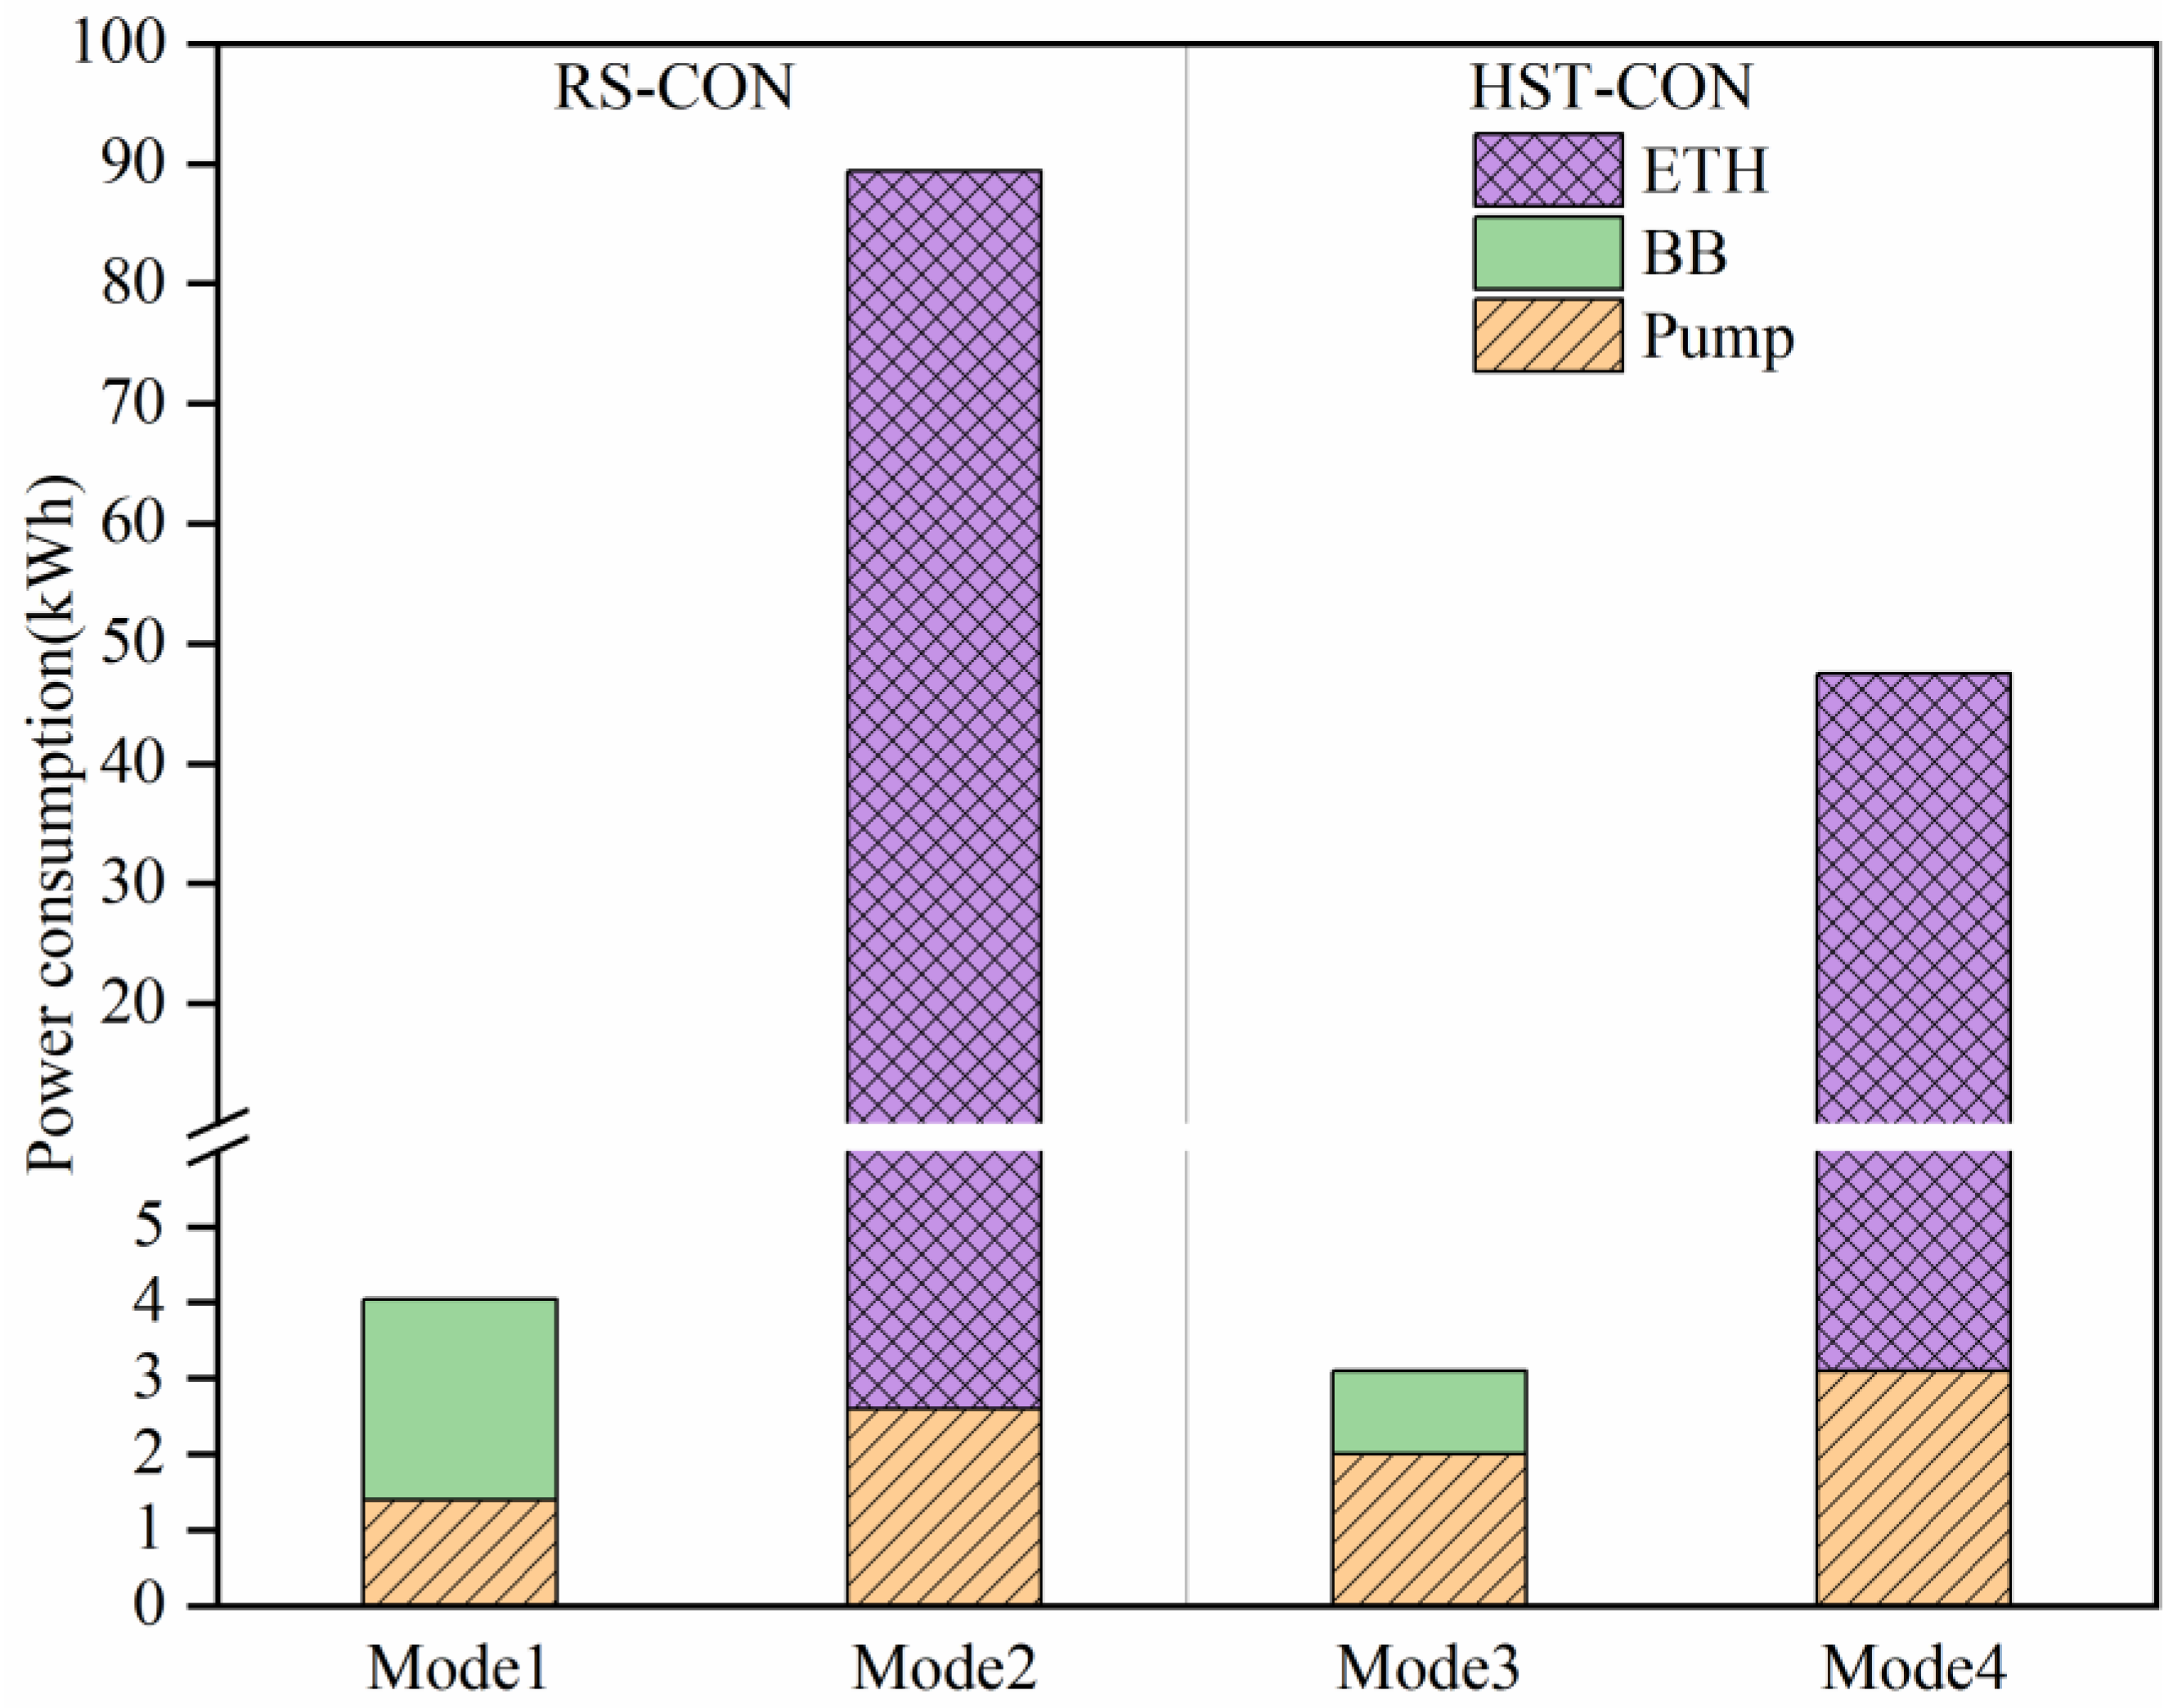
4.3. Comparison of Different Control Strategies

4.3.1. System Performance Analysis

To compare the operational characteristics of the MECH system under different control strategies, the power consumption, auxiliary heating, solar fraction, and temperature change of the HST were analyzed. The power consumption under the different control strategies during the test process is shown in Figure 6. It can be seen that the power consumption of the BB and ETH were reduced by 58.3% and 48.8%, respectively, by adopting the HST-CON instead of the RS-CON. This is because the HST-CON enabled the maximum utilization of the HST and required less energy consumption of auxiliary heat sources. In addition, the most power-consuming equipment was the ETH, whose power consumption reached 86.8 kWh, followed by the BB and the pump. According to the comprehensive power consumption and heating capacity, the average efficiency of electric heating was relatively low, and there was no unified industry standard for the energy efficiency of electric heating [29]. Therefore, heating efficiency and operating costs should be considered comprehensively when choosing electric heating in cold areas.
The auxiliary heating and solar fraction calculated based on different control strategies using the experimental data are presented in Table 1. The result shows that the HST-CON reduces auxiliary heating. Mode 3 indicated the least auxiliary heating, which reached 177.4 MJ. Compared with Mode 1, Mode 3 exhibited less auxiliary heating by 81.4 MJ. The auxiliary heating of Mode 4 was 199.7 MJ, which can be reduced by 141.1 MJ compared with that of Mode 2. Owing to the reduction in auxiliary heating, the solar fraction of the HST-CON was significantly higher, and each mode can be improved by approximately 10%, as compared with the case for the RS-CON.
A comparison of the temperatures of the HST immediately after heat accumulation and at the time of heating is shown in Figure 7. Owing to the failure in using the heat of the HST in a timely manner, varying degrees of heat loss occurred during heat accumulation until the time at which the HST was utilized, where the average loss was 274.45 K. The temperature changes of the HST during the heating process under the two different control strategies are shown in Figure 8. We discovered that under the HST-CON, the heat provided by the HST remained significantly longer. This is because the heat from the HST was consumed rapidly during the heating period, and the lower temperature facilitated in improving the collection efficiency of the SE system [30]. During heat consumption, Ttop, Tmiddle, and Tlower can increase to varying degrees, and thus, significantly extend the heating operation time of the HST. The results presented in Figure 7 and Figure 8 show that the HST-CON offers significant energy-saving advantages when used to satisfy indoor heat demands.

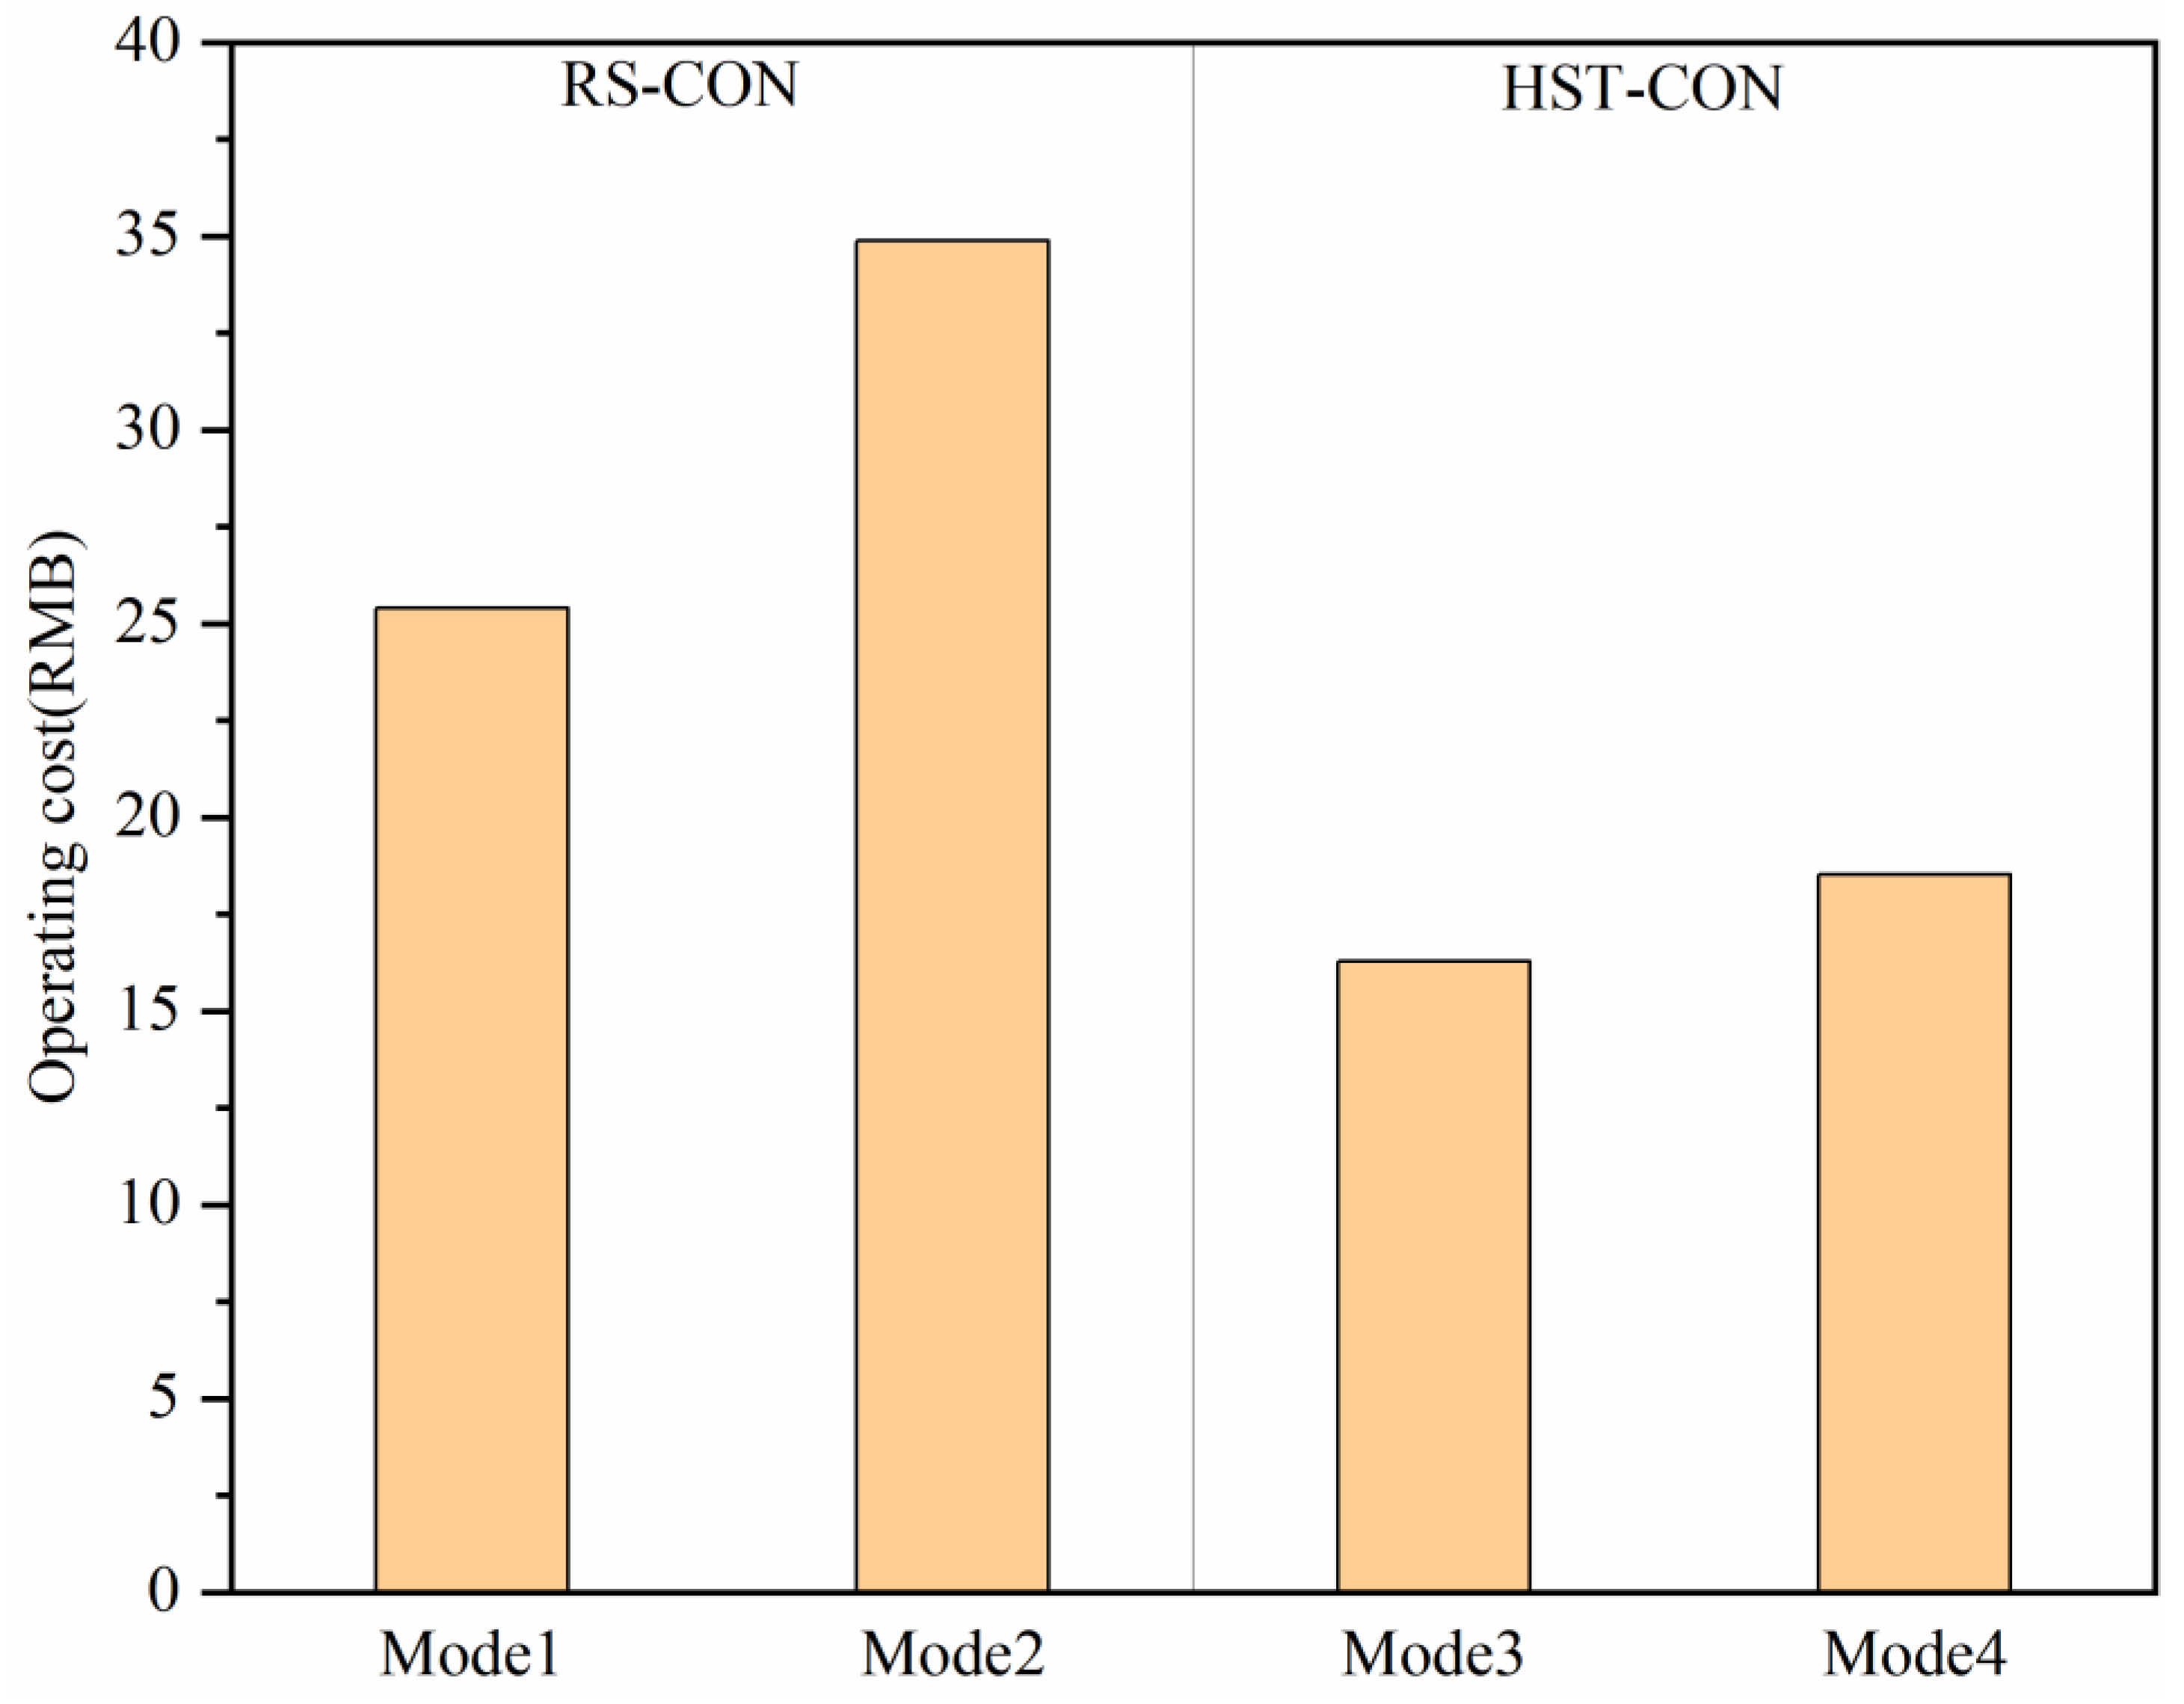
4.3.2. Analysis of Economic and Environmental Benefits

The economic benefit was analyzed by comparing the operating costs of the four heating modes under two different control strategies. Modes 1 and 3 consumed 32.6 and 20.1 kg of biomass fuel, respectively. This information was used in Equation (6) to calculate the operational cost of the heating system, and the results are shown in Figure 9. The results show that the operational cost of Mode 3 was 35.9% lower than that of Mode 1, whereas the operational cost of Mode 4 was 46.7% lower than that of Mode 2, which indicates that the HST-CON is more economical. After performing more calculations, the result shows that the operational cost of Mode 3 was 12.1% lower than that of Mode 4.
Based on the literature review, 0.997 kg of CO2 can be reduced for every 1 kW·h of power conserved [31]. Based on Figure 6, the carbon emission of Mode 3 was 23.3% less than that of Mode 1, and that of Mode 4 was 46.9% less than that of Mode 2. Therefore, the HST-CON provided better environmental benefits. Further analysis shows that the amount of CO2 emitted by Mode 3 was 93.5% lower than that emitted by Mode 4.
From the above analysis, in the middle heating period, with abundant SE, HST-CON is obviously better than RS-CON. To further illustrate the advantages of the HST-CON, the system performance of different heating control strategies with SE participation is summarized in Table 2. Owing to the regional differences, the Isolar had different temporal and spatial changes, which led to a lower solar fraction in the middle of heating when the outdoor temperature was cold. In this case, it was necessary to combine auxiliary heat source for heating. However, the participation of auxiliary energy undoubtedly increased the energy consumption of the system. The comparison showed that the minimum total power consumption of the proposed HST-CON for two consecutive days was 3.1 kWh, which had obvious energy-saving advantages compared with other control strategies. From the perspective of heating effect, the proposed HST-CON can achieve higher indoor temperature and ensure indoor thermal comfort when the operation time was short. Therefore, HST-CON was feasible for heating rural buildings in cold regions. From the perspective of heating efficiency, Mode 3 was the best heating mode.

4.4. Application and Analysis of the HST-CON at the End of the Heating Period

At the end of the heating period, the HST-CON was used for the test, which was conducted from 1 to 5 March. Figure 10 shows Isolar and Ta for five consecutive days. The average Isolar and Ta were 257.7 W/m2 and 279.05 K, respectively.
The variations in the HST temperature and Troom based on the operation time are plotted in Figure 11. As the Ta increased, Troom increased continuously and fluctuated from 291.15 K to 295.15 K when only the HST was used for heating. The average least favorable room temperature for the five consecutive days was 292.55 K. According to Indoor Air Quality Standards, the heating temperature in the winter is 289.15–297.15 K [34]. Therefore, under the HST-CON, using only the HST for heating can satisfy the demands of indoor temperature at the end of the heating period.
The heating hours for a room and the associated power consumed during heating operation can be used to evaluate the solar system. Figure 12 shows the heating hours and power consumption of the HST during the experimental period. As shown, the heating time in HST heating was longest and the power consumption largest on 4 March, while the heating time was shortest and the power consumption smallest on 2 March. This is because, affected by the Isolar, when the sun was better, the HST could obtain more heat, thus extending the heating time. In addition, it can be seen from Figure 12 that the heating time on 5 March was the shortest, but it consumed more electricity instead. This is because the indoor and outdoor temperatures were high, resulting in serious heat loss of the HST, which increased the load of the heat pump and consumed more power. Therefore, the heating time and power consumption were also affected by the indoor and outdoor temperatures. From the heating data of five consecutive days, although Isolar and indoor and outdoor temperatures were the main factors affecting heating time and power consumption, the average heating time was 5.99 h, only 0.22 kWh of the average electricity was consumed. Therefore, at the end of the heating period, the HST-CON can satisfy the heating hours and reduce energy consumption by using only the HST. This also gave rise to a new operating condition: Mode 5 (HST heating).

4.5. Application Analysis of HST-CON over Entire Heating Season

The optimal heating strategy was identified as the HST-CON using Mode 3 in the middle of the heating period and Mode 5 for heating at the end of the heating period. Next, the proportion of energy supplied by the SE and BE for the entire heating season was predicted. As shown in Supplementary Material, Figures S1 and S2, the heating period can be categorized into three periods using cluster analysis: the beginning of the heating period from 15 to 27 November during 2021, the middle heating period from 28 November to 10 February during 2021–2022, and the end of the heating period from 11 February to 15 March during 2022 [35]. At the beginning and end of heating, the temperature was higher, and the user’s heat demand for the room was lower as compared with the case in the middle of heating; therefore, only the SE can be used for heating. In the middle of the heating period, the outdoor temperature was lower, the temperature difference between day and night was more significant, and the user’s heat demand for the room was higher, as compared with the case at the beginning and end of heating. Therefore, the BE was used for auxiliary heating [36]. According to estimation, the total heat supplied by the system was 30.81 GJ, in which 19.21 and 11.60 GJ were from the SE and BE, respectively, which constituted 62.35% and 37.65% of the total system’s heat supply, respectively. The calculation shows that for the entire heating process, the consumption of biomass fuel was 743.70 kg, and the total fuel cost was RMB 557.78 (USD 77).
The economic and environmental benefits of different heating systems were evaluated during the life cycle, and the payback period was calculated using Equation (7) [37]:
P t = I 2       I 1 S + C 1     S + C 2 ,
where Pt is the static investment payback period (years), I1 is the investment amount of the coal-fired boiler (RMB/USD), I2 is the investment amount of the calculated system (RMB/USD), S is the annual energy cost (RMB/USD), C is the annual maintenance cost, 1 is the coal-fired boiler, and 2 is the computed system. The economic parameters of the heating system are presented in Table 3.
Compared with other heating systems, MECH system included an automatic control device, VTC, BB, ETH, and other equipment. Therefore, the initial investment cost of the system was the highest. However, owing to the use of the best MECH system control strategy, the heating equipment took full advantage of energy-saving, and the annual energy cost was the lowest. The investment payback period of the system was 9.73 years, which was longer than that of other traditional heating systems. However, in terms of environmental benefits, the system adopted SE and BE for heating, which generated negligible CO2. Compared with other heating systems, the proposed system offered more environmental benefits.

5. Conclusions

A matching control strategy plays a crucial role in the energy gain of MECH system. However, different climate conditions and different types of energy render it difficult to establish a general control strategy suitable for all heating systems. This study takes a rural residence in the cold region of Xinjiang as an example to explore the optimal control strategy of MECH system under different heating periods in the entire heating season, and the economic and environmental benefits of different heating systems are compared. The following conclusions were obtained:
(1)
In the middle of heating, compared with RS-CON, HST-CON with sufficient SE can afford a higher solar fraction by 10%, more HST heating hours, and a lower operating cost and CO2 emissions. In addition, compared with the energy-saving advantages and heating efficiency of other heating system control strategies, HST-CON had certain feasibility in rural building heating. In addition, during heating operation, Mode 3 was the best heating mode.
(2)
At the end of the heating period, under HST-CON, the average indoor temperature was kept at 292.55 K by using Mode 5, and the average power consumption was only 0.22 kWh for an average of 5.99 h of heating, which indicated that the control strategy can meet the indoor heat demand and had a significant energy-saving effect.
(3)
In the entire heating season, Mode 3 in the middle of the heating period and Mode 5 at the beginning and end of heating period provided a total heating supply of 30.81 GJ, in which 19.21 GJ and 11.60 GJ were from the SE and BE, respectively, which constituted 62.35% and 37.65% of the total system’s heat supply, respectively. Under the same heating conditions, the payback period of the system was 9.73 years. Compared with traditional coal-fired heating, electric heating and air source heat pump heating, the system had the lowest annual energy consumption cost and achieved almost zero CO2 emission.
The proposed control strategy of MECH system in this study can provide a good reference value for engineering applications in cold northern rural regions in China. In future works, we hope to further promote this heating system, so as to realize regional management, reduce the initial investment cost and improve the rural heating environment.

Supplementary Materials

The following supporting information can be downloaded at: https://www.mdpi.com/article/10.3390/en15218140/s1, Table S1: Building structure information; Table S2: Main parameters of test instruments; Table S3: Statistics of key operational data in Mode 1. Table S2: Main parameters of test instruments; Table S4: Statistics of key operational data in Mode 2; Table S5: Statistics of key operational data in Mode 3; Table S6: Statistics of key operational data in Mode 4; Figure S1: Thermal load of the building in winter; Figure S2: Dry bulb temperature and solar radiation (Isolar); Figure S3: Experimental test data: (a) BB heating and (b) ETH heating.

Author Contributions

Conceptualization, X.M., Y.R., R.E. and Q.W.; methodology, J.L. (Junfeng Li) and J.L. (Jie Li); software, X.M. and S.H.; validation, X.M., Y.R. and Q.W.; formal analysis, X.M. and J.L. (Junfeng Li); investigation, X.M. and S.H.; resources, J.L. (Junfeng Li) and J.L. (Jie Li); data curation, X.M. and S.H.; writing—original draft preparation, X.M.; writing—review and editing, J.L. (Junfeng Li) and M.M.; visualization, J.L (Junfeng Li) and J.L. (Jie Li); supervision, J.L. (Junfeng Li); project administration, J.L. (Junfeng Li) and J.L. (Jie Li); funding acquisition, J.L. (Junfeng Li). All authors have read and agreed to the published version of the manuscript.

Funding

This research was supported by the Key Science and Technology Project in the special issues of Bingtuan (2019DB007).

Data Availability Statement

Not applicable.

Acknowledgments

We acknowledge the working team and village committee of the 8th company in 51st Regiment Farm, Tumxuk, for rendering the experimental facilities and houses.

Conflicts of Interest

The authors declare no conflict of interest.

Nomenclature

QcoInstantaneous heat output by collector: W
TroomLeast favorable room temperature, K
TaverageAverage temperature of HST, K
TtopUpper temperature of HST, K
TmiddleMiddle temperature of HST, K
TlowerLower temperature of HST, K
TBB,supplyBB water supply temperature, K
TBB,returnBB return water temperature, K
TaAmbient temperature, K
ISolar radiation, W/m2
QvtcHeat accumulated by VTC, W
CpSpecific heat capacity of working fluid, J/(kg·K)
mvtcMass flow rate of fluid circulating in VTC, kg/s
Tvtc,outOutlet fluid temperature of VTC, K
Tvtc,inInlet fluid temperature of VTC, K
QstHeat supplied by HST, W
CptSpecific heat capacity of water, J/(kg·K)
mstMass flow rate of fluid circulating in HST, kg/s
Tst,outOutlet fluid temperature of HST, K
Tst,inInlet fluid temperature of HST, K
QbHeat supplied by BB, kW
mbMass flow rate of fluid circulating in BB, kg/s
Tb,outOutlet fluid temperature of BB, K
Tb,inInlet fluid temperature of BB, K
QethHeat supplied by ETH, W
methMass flow rate of fluid circulating in ETH, kg/s
Teth,outOutlet fluid temperature of ETH, K
Teth,inInlet fluid temperature of ETH, K
fSolar fraction
CCost incurred by MECH system operation, RMB/USD
PeElectricity price, RMB/kWh (USD/kWh)
EElectricity consumption, RMB/USD
PbPrice of biomass fuel, RMB/kg (USD/kg)
MbBiomass fuel usage, kg
Abbreviations
MECHMulti-energy complementary heating
SESolar energy
BEBiomass energy
RS-CONRoom temperature control strategy
HST-CONThe heat storage tank control strategy
HSTHeat storage tank
VTCVacuum tube collector
BBBiomass boiler
ETHElectric tube heater

References

  1. Zhang, Y.; Xia, J.; Fang, H.; Zuo, H.; Jiang, Y. Roadmap towards clean heating in 2035: Case study of inner Mongolia, China. Energy 2019, 189, 116152. [Google Scholar] [CrossRef]
  2. Shahzad, U.; Gupta, M.; Sharma, G.D.; Rao, A.; Chopra, R. Resolving energy poverty for social change: Research directions and agenda. Technol. Forecast. Soc. Chang. 2022, 181, 121777. [Google Scholar] [CrossRef]
  3. Guo, M.; Cai, S. Impact of Green Innovation Efficiency on Carbon Peak: Carbon Neutralization under Environmental Governance Constraints. Int. J. Environ. Res. Public Health 2022, 19, 10245. [Google Scholar] [CrossRef] [PubMed]
  4. Building Energy Research Center of Tsinghua University. Annual Development Research Report on Building Energy Efficiency in China 2020; China Construction Industry Press: Beijing, China, 2020. [Google Scholar]
  5. Dong, Z.; Bingyang, L.; Qintong, Z.; Jinping, L. Thermal performance and energy characteristic analysis of multiple renewable energy complementary heat pump system. Sol. Energy 2020, 196, 287–294. [Google Scholar] [CrossRef]
  6. Ge, T.S.; Wang, R.Z.; Xu, Z.Y.; Pan, Q.W.; Du, S.; Chen, X.M.; Ma, T.; Wu, X.N.; Sun, X.L.; Chen, J.F. Solar heating and cooling: Present and future development. Renew. Energy 2018, 126, 1126–1140. [Google Scholar] [CrossRef]
  7. Hou, Y.-T.; Yang, B.; Zhang, S.-Y.; Qi, Y.; Yu, X.-H. 4E analysis of an integrated solar-biomass heating system: A case study in rural housing of northern China. Sustain. Energy Technol. Assess. 2022, 53, 102794. [Google Scholar] [CrossRef]
  8. Verhagen, T.J.; van der Voet, E.; Sprecher, B. Alternatives for natural-gas-based heating systems: A quantitative GIS-based analysis of climate impacts and financial feasibility. J. Ind. Ecol. 2021, 25, 219–232. [Google Scholar] [CrossRef]
  9. Mi, P.; Ma, L.; Zhang, J. Integrated optimization study of hot water supply system with multi-heat-source for the public bath based on PVT heat pump and water source heat pump. Appl. Therm. Eng. 2020, 176, 115146. [Google Scholar] [CrossRef]
  10. Guo, F.; Li, Y.; Xu, Z.; Qin, J.; Long, L. Multi-objective optimization of multi-energy heating systems based on solar, natural gas, and air- energy. Sustain. Energy Technol. Assess. 2021, 47, 101394. [Google Scholar] [CrossRef]
  11. Zhang, X.; Yang, J.; Fan, Y.; Zhao, X.; Yan, R.; Zhao, J.; Myers, S. Experimental and analytic study of a hybrid solar/biomass rural heating system. Energy 2020, 190, 116392. [Google Scholar] [CrossRef]
  12. Liu, Z.; Liu, Y.; Wu, D.; Jin, G.; Yu, H.; Ma, W. Performance and feasibility study of solar-air source pump systems for low-energy residential buildings in Alpine regions. J. Clean. Prod. 2020, 256, 120735. [Google Scholar] [CrossRef]
  13. Zhang, X.; Wang, E.; Liu, L.; Qi, C.; Zhen, J.; Meng, Y. Analysis of the operation performance of a hybrid solar ground-source heat pump system. Energy Build. 2022, 268, 112218. [Google Scholar] [CrossRef]
  14. Gao, W.; Wang, Y.; Yang, L.; Xu, S.; Zhou, W.; Guo, H. Performance evaluation for solar combined gas heating system. Renew. Energy 2021, 167, 520–529. [Google Scholar] [CrossRef]
  15. Huang, J.; Fan, J.; Furbo, S.; Chen, D.; Dai, Y.; Kong, W. Economic analysis and optimization of household solar heating technologies and systems. Sustain. Energy Technol. Assess. 2019, 36, 100532. [Google Scholar] [CrossRef]
  16. Xi, Y.; Zeng, Q.; Chen, Z.; Lund, H.; Conejo, A.J. A market equilibrium model for electricity, gas and district heating operations. Energy 2020, 206, 117934. [Google Scholar] [CrossRef]
  17. Xu, D.; Yuan, Z.-L.; Bai, Z.; Wu, Z.; Chen, S.; Zhou, M. Optimal operation of geothermal-solar-wind renewables for community multi-energy supplies. Energy 2022, 249, 123672. [Google Scholar] [CrossRef]
  18. Li, G.; Du, Y. Performance investigation and economic benefits of new control strategies for heat pump-gas fired water heater hybrid system. Appl. Energy 2018, 232, 101–118. [Google Scholar] [CrossRef]
  19. Zemann, C.; Deutsch, M.; Zlabinger, S.; Hofmeister, G.; Gölles, M.; Horn, M.J.B. Optimal operation of residential heating systems with logwood boiler, buffer storage and solar thermal collector. Biomass Bioenergy 2020, 140, 105622. [Google Scholar] [CrossRef]
  20. Li, X.; Wang, Z.; Li, J.; Yang, M.; Yuan, G.; Bai, Y.; Chen, L.; Xu, T.; Gilmanova, A. Comparison of control strategies for a solar heating system with underground pit seasonal storage in the non-heating season. J. Energy Storage 2019, 26, 100963. [Google Scholar] [CrossRef]
  21. Liu, Y.; Li, T.; Chen, Y.; Wang, D. Optimization of Solar Water Heating System under Time and Spatial Partition Heating in Rural Dwellings. Energies 2017, 10, 1561. [Google Scholar] [CrossRef]
  22. Li, H.; Long, E.; Zhang, Y.; Yang, H. Operation strategy of cross-season solar heat storage heating system in an alpine high-altitude area. Indoor Built Environ. 2020, 29, 1249–1259. [Google Scholar] [CrossRef]
  23. Qiu, G.; Yu, S.; Cai, W. A novel heating strategy and its optimization of a solar heating system for a commercial building in term of economy. Energy 2021, 221, 119773. [Google Scholar] [CrossRef]
  24. Liao, Z.; Swainson, M.; Dexter, A.L. On the control of heating systems in the UK. Build. Environ. 2005, 40, 343–351. [Google Scholar] [CrossRef]
  25. Nhut, L.M.; Raza, W.; Park, Y.C. A Parametric Study of a Solar-Assisted House Heating System with a Seasonal Underground Thermal Energy Storage Tank. Sustainability 2020, 12, 8686. [Google Scholar] [CrossRef]
  26. Naili, N.; Kooli, S. Solar-assisted ground source heat pump system operated in heating mode: A case study in Tunisia. Renew. Sustain. Energy Rev. 2021, 145, 111144. [Google Scholar] [CrossRef]
  27. Prando, D.; Renzi, M.; Gasparella, A.; Baratieri, M. Monitoring of the energy performance of a district heating CHP plant based on biomass boiler and ORC generator. Appl. Therm. Eng. 2015, 79, 98–107. [Google Scholar] [CrossRef]
  28. Mehdaoui, F.; Hazami, M.; Messaouda, A.; Guizani, A. Performance analysis of two types of Solar Heating Systems used in buildings under typical North-African climate (Tunisia). Appl. Therm. Eng. 2020, 165, 114203. [Google Scholar] [CrossRef]
  29. Hu, S.; Yan, D.; Guo, S.; Cui, Y.; Dong, B. A survey on energy consumption and energy usage behavior of households and residential building in urban China. Energy Build. 2017, 148, 366–378. [Google Scholar] [CrossRef]
  30. Yang, W.; Zhang, H.; Liang, X. Experimental performance evaluation and parametric study of a solar-ground source heat pump system operated in heating modes. Energy 2018, 149, 173–189. [Google Scholar] [CrossRef]
  31. Chen, H.; Fan, W.; Cai, B.; Li, G.; Wang, Y.; Akhlaghi, Y.G.; Wang, Y.; Sun, Y.; Jiang, L. Performance and economic evaluation of a solar-air hybrid source energy heating system installed in cold region of China. J. Build. Eng. 2022, 56, 104796. [Google Scholar] [CrossRef]
  32. Li, J.; Wang, M.; Xu, X. Exploratory research on the field application of solar assisted air source heat pump system for rural buildings in Xinjiang. J. Asian Archit. Build. Eng. 2022, 1, 1–14. [Google Scholar] [CrossRef]
  33. Dong, Z.; Boyi, Q.; Pengfei, L.; Zhoujian, A. Comprehensive evaluation and optimization of rural space heating modes in cold areas based on PMV-PPD. Energy Build. 2021, 246, 111120. [Google Scholar] [CrossRef]
  34. GB/T 18883-2002; Indoor Air Quality Standard. General Administration of Quality Supervision, Inspection and Quarantine. The Ministry of Health, State Environmental Protection Administration: Beijing, China, 2002.
  35. Arroyo, Á.; Herrero, Á.; Tricio, V.; Corchado, E. Analysis of meteorological conditions in Spain by means of clustering techniques. J. Appl. Log. 2017, 24, 76–89. [Google Scholar] [CrossRef]
  36. Xue, P.; Zhou, Z.; Fang, X.; Chen, X.; Liu, L.; Liu, Y.; Liu, J. Fault detection and operation optimization in district heating substations based on data mining techniques. Appl. Energy 2017, 205, 926–940. [Google Scholar] [CrossRef]
  37. Alshehri, F.; Beck, S.; Ingham, D.; Ma, L.; Pourkashanian, M. Techno-economic analysis of ground and air source heat pumps in hot dry climates. J. Build. Eng. 2019, 26, 100825. [Google Scholar] [CrossRef]
  38. Zhang, Y.; Zhi, G.; Guo, S.; Jin, W.; Wang, L.; Du, J.; Cheng, M.; Xue, Z.; Xu, Y.; Shi, R.; et al. Algorithm developed for dynamic quantification of coal consumption for and emission from rural winter heating. Sci. Total Environ. 2020, 737, 139762. [Google Scholar] [CrossRef] [PubMed]
  39. Zhang, Q.; Zhang, L.; Nie, J.; Li, Y. Techno-economic analysis of air source heat pump applied for space heating in northern China. Appl. Energy 2017, 207, 533–542. [Google Scholar] [CrossRef]
Figure 1. Diagram of MECH system.
Energies 15 08140 g001
Figure 2. Equipment constituting MECH system: (a) VTC and (b) system pipeline.
Energies 15 08140 g002
Figure 3. Isolar, Tvtc,out, Tvtc,in, and Qvtc vs. operation time.
Energies 15 08140 g003
Figure 4. Experimental test data: (a) Mode 1 and (b) Mode 2.
Energies 15 08140 g004
Figure 5. Experimental test data: (a) Mode 3 and (b) Mode 4.
Energies 15 08140 g005aEnergies 15 08140 g005b
Figure 6. Power consumption under different heating control strategies.
Energies 15 08140 g006
Figure 7. Comparison of HST temperatures immediately after heat accumulation and at the time of heating.
Energies 15 08140 g007
Figure 8. Temperature change of HST under different control strategies: RS-CON (left) and HST-CON (right).
Energies 15 08140 g008
Figure 9. Operating costs under different control strategies.
Energies 15 08140 g009
Figure 10. Isolar and Ta vs. operation time.
Energies 15 08140 g010
Figure 11. HST temperature and Troom vs. operation time.
Energies 15 08140 g011
Figure 12. Heating hours and power consumption of HST.
Energies 15 08140 g012
Table 1. Auxiliary heating and solar fraction under different control strategies.
Control StrategyAuxiliary Heating (MJ)Solar Fraction (%)
RS-CONMode 1258.641.3
Mode 2340.836.1
HST-CONMode 3177.452.7
Mode 4199.746.4
Table 2. Performance comparison of different heating control strategies.
Control StrategyOperation ModeOperation Results
HST-CONMode 3The total operation time is 14.35 h, and the total heat supply is 375.37 MJ, and the room temperature is maintained at 291.15–295.15 K.
Mode 4The total operation time is 16.57 h, and the total heating capacity is 369.1 MJ, and the room temperature is maintained at 291.15–295.15 K.
Time-controlled [32]Solar + air source heat pumpThe outdoor temperature is 255.07 K, the solar heating capacity is 38.41 MJ, the solar fraction is 27.31%, and the room temperature is maintained at 289.15–291.15 K with 11 h of operation. The power consumption of the air source heat pump is 32.2 kWh with 11.5 h operation, and the heat supply is 189.32 MJ, maintaining the room temperature at 289.15–293.15 K.
Time and spatial partition heating [21]Solar + auxiliary heaterThe heating duration and temperature are set according to the energy supply of the room. The annual heating capacity is 12,730.23 MJ, and the annual solar fraction is 40.3%.
Continuous and whole space heating [21]Solar + auxiliary heaterThe heating system operates all day long, and the room temperature is maintained at 291.15 K. The annual heat supply is 20,120.38 MJ, and the annual solar fraction is 16.3%.
Thermal comfort control [33]Solar + electric Typical daily power consumption 9.22 kWh, room temperature 287.15–289.15 K.
Table 3. Economic and environmental parameters of different heating systems.
Economic and Environmental AnalysisMECH (HST-CON)Electricity [31]Coal-Fired Boiler [38]Air Source Heat Pump [39]
Initial investment cost (RMB/USD)33,000(4555.63)8485(1171.35)5514(761.20)32,731.4(4518.55)
Annual energy cost (RMB/USD)558.2(77.06)3185(439.69)4292.85(592.63)1145.6(158.15)
Annual maintenance cost (RMB/USD)1384.23(191.09)424.25(58.57)275.7(38.06)1091.05(150.62)
Investment payback period (year)9.734.23311.67
CO2 emissions (kg)-10,737.69926.42303.79
Publisher’s Note: MDPI stays neutral with regard to jurisdictional claims in published maps and institutional affiliations.

