Article

Hybrid DC–AC Microgrid Energy Management System Using an Artificial Gorilla Troops Optimizer Optimized Neural Network

by
Sathesh Murugan
1,*,
Mohana Jaishankar
1 and
Kamaraj Premkumar
2,*
1
Department of Electronics and Communication Engineering, Saveetha School of Engineering, Chennai 602105, India
2
Department of Electrical and Electronics Engineering, Rajalakshmi Engineering College, Chennai 602105, India
*
Authors to whom correspondence should be addressed.
Energies 2022, 15(21), 8187; https://doi.org/10.3390/en15218187
Submission received: 1 October 2022 / Revised: 25 October 2022 / Accepted: 28 October 2022 / Published: 2 November 2022
(This article belongs to the Section F1: Electrical Power System)

Abstract

:
In this research, we introduce an artificial gorilla troop optimizer for use in artificial neural networks that manage energy consumption in DC–AC hybrid distribution networks. It is being proposed to implement an energy management system that takes into account distributed generation, load demand, and battery-charge level. Using the profile data, an artificial neural network was trained on the charging and discharging characteristics of an energy storage system under a variety of distribution-network power situations. As an added bonus, the percentage of mistakes was maintained far below 10%. An artificial neural network is used in the proposed energy management system, and it has been taught to operate in the best possible manner by using an optimizer inspired by gorillas called artificial gorilla troops. The artificial gorilla troops optimizer optimize the weights and bias of the neural network based on the power of the distributed generator, the power of the grid, and the reference direct axis current to obtain most suitable energy management system. In order to simulate and evaluate the proposed energy management system, small-scale hybrid DC/AC microgrids have been created and tested. When compared to other systems in the literature, the artificial gorilla troops optimizer enhanced neural network energy management system has been shown to deliver 99.55% efficiency, making it the clear winner.

1. Introduction

Recent years have seen a growth in interest in alternative energy sources, as concerns about the depletion of fossil fuels and the emission of greenhouse gases have become stronger [1,2,3,4,5]. Consequently, legislation to reduce global emissions of greenhouse gases like oil, natural gas, and coal is now under consideration. The Paris Agreement, which replaced the Kyoto Protocol when it expired in 2020, established a target for renewable energy sources to account for 11% of the global energy supply during the next decade (2020). Since 2012, it has been mandatory to use RESs such as wind, tidal, and solar power to generate electricity. Researchers have characterized a microgrid as a small distribution network fueled by renewable energy and equipped with network control capabilities in line with this trend [6,7]. A microgrid’s ability to reduce power loss due to long-distance transmission makes it more efficient than a centralized power plant. With its ability to function independently of the present power grid, microgrids may attain a high degree of energy independence [8]. A microgrid may be classed as a DC, AC, or hybrid AC/DC microgrid depending on how the distribution network and loads are linked [9,10]. By eliminating concerns such as phasing (phase), frequency (power factor), or reactive power in the DC microgrid, it is expected to reduce costs and improve power transmission efficiency by reducing the power conversion step. Smaller initial investments are required since existing AC distribution networks may be converted to AC microgrids. DC voltage is produced by most distributed power sources, such as photovoltaics and fuel cells, which need an additional power conversion device to connect them to existing AC systems [11,12]. An energy-storage-system-based energy management system is needed for a continuous supply of electricity and good network performance [13].
Monitoring the remaining capacity of an energy storage system and other distributed power sources like solar and wind power is essential for ensuring a steady power supply and optimizing usage [14]. Accurate information is required in various fields, such as distribution networks and distributed energy sources. However, accurate statistics ca not be derived due to sudden fluctuations in power generation [15]. Estimates of the amount of power that can be produced by solar photovoltaics over different time periods have been the subject of several studies [16]. However, this has been shown to be unachievable in most cases. When trying to predict demand, most academics have zeroed in on big loads with low variability and certainty [17]. However, tiny consumers and buildings, where considerable load changes may occur, have received little research attention. The conventional method of running an EMS relies only on the power supply and load demand from the distribution generator to establish the ESS’s power reference [18,19]. This approach is wasteful since it ignores both the AC grid and the energy storage device’s charge. Additionally, it is difficult to understand the algorithm behind the energy management system. The optimization of a microgrid’s energy management system using a genetic algorithm-based fuzzy logic system was described. To achieve optimum energy flow between sources and load, a genetic algorithm was utilized to fine-tune the parameters of a fuzzy inference system. In [20], particle swarm optimization was used to regulate the energy output of a hybrid power production system. Particle swarm optimization was utilized to maximize the efficiency of the hybrid system’s energy management and decrease operational costs by optimizing the production and energy from renewable sources like PV and wind. In [21,22,23,24], the cuckoo search optimization algorithm was used to minimize household energy consumption and water use. In order to reduce the overall cost of the system, the cuckoo search algorithm was utilized to move loads from peak to off-peak times.
The results suggest that the artificial-gorilla-troops-optimizer-optimized artificial neural network theory might be applied in small-scale microgrids to guarantee efficient power operation through centralized control. Focusing on simplifying neural transmission and using an artificial neural network theory that can be understood mathematically are the two main tenets of the suggested energy management strategy. This strategy is quite useful if you are trying to find a way to improve the performance of the power converters in your distribution network. In addition to the distribution generator’s power production and load demand, the suggested method also takes into account the AC grid’s accumulated power and its state of charge when establishing the energy storage system’s power reference. The power reference is derived using input data from an artificial-gorilla-troops-optimizer-optimized artificial neural network, making the operation of the energy storage system much less complicated than that of a conventional energy management system.
An overview of the paper’s major contributions is provided below:
  • In microgrids with frequent fluctuations in power supply and demand, our artificial gorilla troops optimizer optimized artificial neural network based energy-management-system algorithm achieves excellent results.
  • By factoring in the energy storage system’s current charge status in addition to the collected AC grid power, our distribution network maximizes power efficiency.
  • The energy storage system’s output power requirement was lowered for practicality’s sake as a consequence of the artificial-gorilla-troop-optimizer-optimized artificial neural network being trained using distinct sets of input data for each operational mode.
There are four parts to this study. In Section 2, we introduce the proposed centralized distribution system, the artificial neural network optimized using the artificial gorilla troop optimizer, and the power flow in the distribution system. Section 3 provides a training simulation for an artificial gorilla troop optimizer based on an artificial neural network theory, and Section 4 discusses the outcomes of this simulation in the context of evaluating the effectiveness of the proposed approach. Findings are summed up in Section 5.

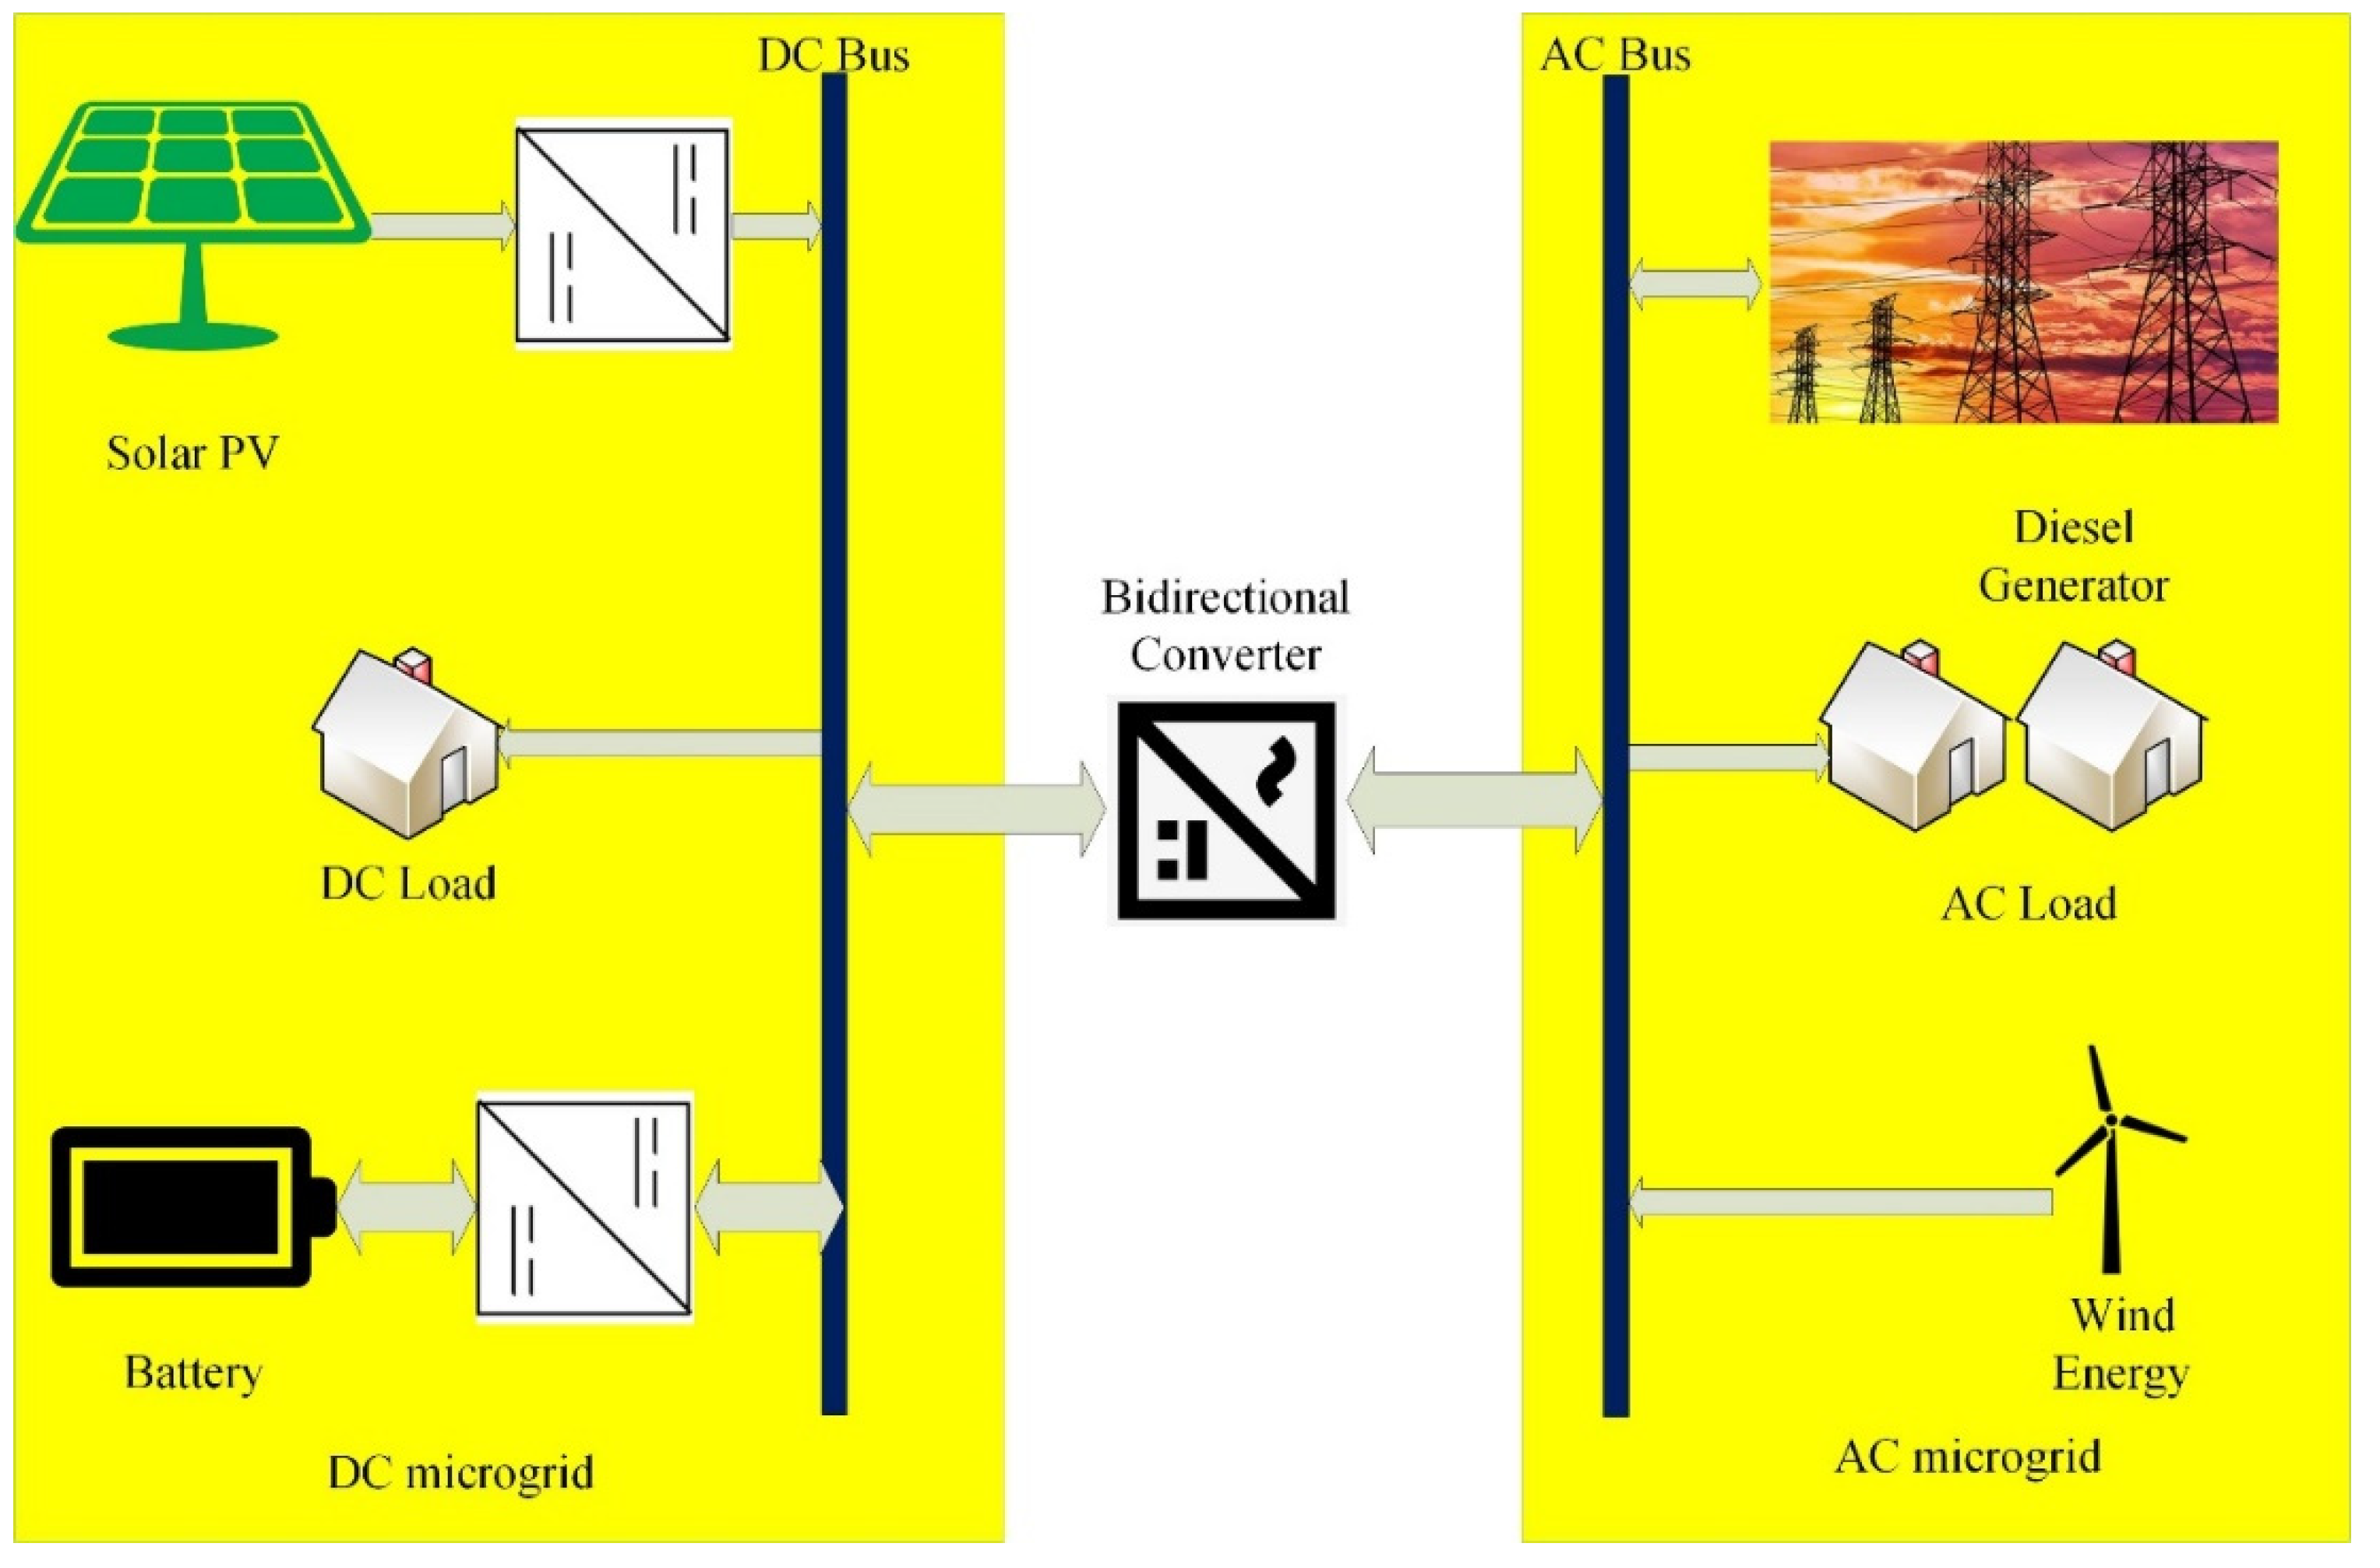
2. Hybrid DC–AC Microgrids Energy Management System with Neural Network

In this section, the AC/DC microgrid design and the EMS operation method are detailed. Figure 1 shows a diagram of the hybrid-microgrid distribution network AC/DC. The interlinking converter has just one mode of operation, which is grid-connected. The grid-connected mode utilizes the AC grid’s electricity to maintain DC voltage in the DC distribution network. When a DC distribution system is connected to wind and solar power, energy may be generated. In order to control the DC distribution network’s voltage, it also executes charge/discharge operations based on the current operating mode [25,26].
Control of the hierarchical energy-management control system is centered in this study. To connect the DC and AC distribution networks, an interlink converter is used, which is managed by microgrid controllers on the ground. In the distribution network, each power converter is controlled by a local controller that is part of the main controller’s control structure. The secondary controller utilizes a specific local controller to maintain the distribution-network voltage. The interlink converter was designed to offer secondary control of the DC-distribution-network voltage.
An energy management system (ESS) uses power control in conjunction with distributed generators connected to the distribution network to manage energy. With the exception of distribution-network accidents, which trigger stand-alone operation, the microgrid’s central control handles energy via its energy storage system. Microgrid central control impacts the modes of operation and the output power of local controllers, notably those that govern the distribution-network voltage, when they create a reference voltage.
A power converter attached to a distributed power source performs in MPPT mode and low-power mode. In addition, the energy storage system manages the charging and discharging power and the DC-distribution voltage of the DC-distribution network. When the grid is linked to the interlink converter, DC-power-distribution-network voltage management is utilized; however, when the grid is detached, AC customer-side voltage control is employed to maintain a steady voltage. An ANN is used by the microgrid’s central control to determine the mode of operation and the power consumption of each local controller in the microgrid network.

3. Training of an Artificial Neural Network Using Artificial Gorilla Troops Optimizer

As shown in Figure 2’s ANN-based energy-management flowchart for a hybrid AC–DC microgrid, modes 1, 2, and 3 are grid-connected modes wherein the interlink converter manages the DC voltage in the hybrid AC–DC microgrid. Figure 3 shows the ANN linked to the grid (configuration diagram). The neural network employed in this study has three input layers, three hidden levels, and one output layer. To each layer, a certain weight has been allocated [27,28].
The hidden layer receives the signal from the input layer and transmits it to the output layer. At present, the output value of each layer is determined by its weighted connections. To obtain the best possible output from the input signal, the weight value must be modified. This practice is referred to as “training”. When using our proposed technique, we will train the ANN’s weights via an artificial gorilla troops optimizer. Taking cues from the social behaviors of real gorilla groups, we developed a novel metaheuristic algorithm we dubbed the gorilla troops optimizer (GTO). In it, we give detailed mathematical procedures to account for both the exploratory and exploitative stages. Five distinct operators are utilized in the GTO algorithm to model exploration and exploitation, two types of optimization procedures [29].
Exploration has included the usage of three separate operators; more ground-to-orbit (GTO) probes have been moved to an uncharted region. An enhancement in the equilibrium between exploration and exploitation is achieved via the addition of the second operator, a shift to the other gorillas. The GTO is greatly boosted by the addition of a third operator during exploration, namely, movement toward a known place, a capacity to explore a variety of optimization domains. Search performance is dramatically improved during exploitation because to the usage of two operators. Figure 4 provides an overview of the optimization operation approach employed in GTO, demonstrating how the phase transition procedure of exploration and exploitation is handled differently in this framework.
To find a workable solution, GTO often use the following guidelines:
  • In the GTO method, there are three possible solutions to an optimization problem, denoted as X (the gorillas’ position vector), GX (the gorilla candidates’ position vectors generated at each iteration and used if they outperform the present solution), and Z (other possible solutions). Each iteration converges on the silverback as the optimal answer.
  • When it comes to the number of search agents used for optimization purposes, there is only one silverback in the whole population.
  • The social lives of wild gorillas may be properly modeled using three different solution types: X, GX, and silverback.
  • Gorillas may strengthen themselves by increasing their muscle mass or by securing a prominent place in a balanced and powerful group. Each GX iteration in the GTO algorithm produces a new set of solutions. If the new solution (GX) turns out to be better, the old one will be abandoned (X). Aside from that, it will always be remembered (GX).
  • As a species, gorillas are not able to lead solitary lives due to their strong propensity for group living. Therefore, they continue to forage for food as a social group and to be led by a silverback who makes all of the important choices. Assuming that the weakest member of the gorilla group represents the poorest solution in the population, the gorillas spend the formulation phase moving away from the worst solution and toward the best solution (silverback), with the goal of collectively becoming better.
Given GTO’s distinctive qualities in many optimization problems, the methods find extensive application when modeled on the fundamental ideas of gorilla group life while foraging for food and coordinating activities as a group. The equation-related two phases of the GTO algorithm are as follows.

3.1. Exploration Phase

This section takes a closer look at the processes used during the discovery stage of GTO. Gorillas, when seen in the wild, live in groups dominated by a silverback who is generally followed; however, there are instances wherein individual gorillas choose to spend time apart from the group. When gorillas leave their group, they go to other areas of the forest where they may or may not encounter other gorillas. In the GTO method, every gorilla is treated as a potential answer, and the top performer at each step of the optimization process is given the title of “silverback.” The techniques we used during the exploration phase were movement to a new area, movement toward an already-visited area, and movement to other gorillas. There is a standard approach that is used in the selection of each of these three mechanisms.
The method of departure for an unspecified destination was chosen using a parameter named p. In the case when rand is less than p, the first mechanism is chosen. In contrast, the method of migration toward other gorillas is chosen if rand is less than 0.5. If rand is less than 0.5, however, the migration technique to a fixed place is chosen. It is clear that the GTO algorithm benefits greatly from the techniques it employs. The first mechanism allows the algorithm to keep a close eye on the whole problem space, and the second boosts the GTO’s ability to explore, and the third helps it break free of any local-optimum solutions. The three processes deployed during exploration have been simulated using Equation (1)
X G t + 1 = r 1 U L L L + L L ;       i f   p > r a n d L × H + X r t × r 2 C ; i f   0.5 r a n d X i L × L × X t X r G t + X t X r G t ; i f   0.5 > r a n d
where, r 1 , r 2 , and r 3 are arbitrary numbers, X i is the current postion of the gorilla, X G t + 1   is the position of the gorilla in the next iteration, p is known as the probability of migration mechanism of the gorilla troops, and it ranges from zero to one, X r t and X r G t   is a gorilla position selected randomly, UL and LL are upper and lower limits for the variables. The variables C, L, and H are calculated using the following equations:
C = t m a x t t m a x × F
F = 1 + cos r 4 × 2
L = F × C
H = X t × Z
Z = C , C
where t m a x is the maximum iteration used in this optimization, t is the current iteration number of the optimization, r 4 is an arbitrary number between zero to one, L is the silverback leadership concept of the gorilla troop optimizer, and Z is an arbitrary number between C and −C.
Due to its quality in many optimization problems, these methods find extensive application when modeled on the fundamental ideas of gorilla group life while foraging for food and coordinating activities as a group. The equation-related two phases of the GTO algorithm are as follows.

3.2. Exploitation Phases

Two behaviors, follow the silverback and competition for adult females, are used in in the GTO algorithm’s exploitation phase. A troop of gorillas will follow the lead of the silverback, who makes all the choices, plans the routes, and guides the others to the best food sources. All of the other gorillas in the group defer to the silverback’s judgement on matters of life and death. On the other side, the silverback gorilla may get old and sick, at which point a gorilla back in the group may take over as leader, or other male gorillas may challenge the silverback gorilla for dominance of the group. Follow the silverback or competition for adult females may be chosen using the C value in Equation, as stated with the two exploitation-phase procedures (2). If C > W, the mechanism to “follow the silverback” is chosen, but if C > W, the mechanism to “compete with adult females” is chosen. The value of W must be determined in advance of the optimization process.
Follow the silverback:
The group is very new; therefore, the silverback and other male gorillas are also young and in good condition. They will travel wherever the silverback directs them to in order to obtain food. They may influence the behavior of the whole group as it moves. When the C W value is opted for, this tactic is chosen. This behavior may be modeled using Equation (7)
X G t + 1 = X t + M × L × X t X s i l v e r b a c k
M = i = 1 N X G i t N 2 L 2 L
where X s i l v e r b a c k is the position of the silverback gorilla, X t is the current position vector of the gorilla, N is the number gorilla in the optimization, and L is the silverback leadership concept of the gorilla troop optimizer and is calculated based on Equation (4).
Competition for adult females:
When C is less than W, the second method is chosen for full-scale implementation. Soon after reaching sexual maturity, adolescent male gorillas engage in fierce rivalry with other males in their growing group for the attentions of adult females. Group members may become involved in conflicts that persist for days. This behavior may be modelled using Equation (9)
X G i t = X t X s i l v e r b a c k × Q × A + X s i l v e r b a c k
Q = ( r 5 × 2 ) 1
A = E × β
E = N 1   i f   0.5 r a n d N 2   i f   0.5 > r a n d
where r 5 is an arbitrary number between zero to one, X s i l v e r b a c k is the position of the silverback gorilla, X t is the current position vector of the gorilla, the impact force is represented by Q , the conflict degree of violence is represented by A , the violence effect is represented by E , and β is a random number zero to one and should be provided the beginning of the optimization. Figure 5 provides a visual representation of the GTO flowchart, and the subsequent sections explain each individual step of the formulation method in detail.
ANN input data include the state of charge of the battery, the total power generated by the distributed power supply, and grid power. ANN generates a direct axis reference current for charging or discharging the battery through the microgrid.
It is possible to recharge the energy storage system in Mode 1 when there is little residual state of charge in the system and enough extra power is being produced. At a condition of charge of less than 50%, the energy storage system activates this mode. At least fifty percent of the state of charge’s (SOC) remaining capacity is protected while the interlink converter operates in a stand-alone mode.
An ANN training table and input data (SOC, surplus power, and cumulative power) may be used to estimate the ESS’s charging power in Mode 1 (shown in Table 1). An evaluation of the data was done by comparing it to a graded or maximum value (P.U. value). When establishing the ESS’s charge power reference, for example, the SOC and cumulative power received, as well as the excess generated power, were considered. With a PDG output greater than the PLoad and an energy-storage-system charge of 50% or above, mode 2 is activated to meet the load requirement. An interlink converter is used to transfer the power produced in this mode to the AC grid. In order to determine the direct axis current required to charge an energy storage system, an artificial neural network (ANN) was trained using the data shown in Table 2. As a percentage of the rated or maximum value, P.U. values are listed. It is possible to reduce AC grid power consumption by activating energy storage system discharge mode in Mode 3 when the charge is 50% or more and DG power generation falls short. According to the technique outlined above, the data in Table 3 are the input and output data used to train the ANN for the discharge mode of the energy storage system.

4. Simulation and Result Discussion on Hybrid AC/DC Microgrid Energy Management Systems

As a part of this section, we conducted a simulation to verify that the method presented in the paper is really valid and reliable. The interlinking converter capacity of the AC distribution network and the DC distribution network was 40 kW and 100 kW for the energy storage system, wind power, solar power, and the AC load on the customer side. Because the data in Table 1, Table 2 and Table 3 are nonlinear, no mathematical analysis can be performed on them. For an energy storage system’s optimal charge/discharge power reference value, an artificial neural network (ANN) has to be trained using this data. To verify that the error rate of the energy-storage-system charge/discharge reference data and the energy-storage-system charge/discharge reference in each operating mode was less than 10%, training sessions were performed between 100 and 500 times.
Using the artificial gorilla troops optimizer, we may train a neural network with inputs like battery-charge level, distribution generating power output, grid input power, and the reference direct axis current, as shown in Figure 6. Input and output data are sent to the MATLAB neural network toolbox training model. Training, testing, and validation performance is shown graphically in Figure 7. The training root mean square error at epoch 9 is around 0.011788. Figure 8 shows the regression curve for training, testing, and validation after the completion of training, testing, and validation. In the range of 0.98 to 0.99, the regression value for training, testing, and validation may be used. It demonstrates the greater agreement between the trained neural network and the goal data. Figure 9 depicts the final energy-management-system neural-network model in its entirety. One output neuron, ten hidden neuron inputs, and three input neurons make up this system. The performance of the artificial gorilla troops optimizer is also compared with GA, PSO, and cuckoo search algorithm, and its convergence graph is shown in Figure 10. The initial population for all algorithms is considered the same value, and 100 trials have been conducted for finding the global stability point. For 100 trials, the artificial gorilla troops optimizer found the global point quickly and minimized the root mean square error effectively.
Using Levenberg–Marquardt, GA, PSO, cuckoo search, and artificial gorilla troops optimizer, Table 4 compares the five methods’ performance. The Levenberg–Marquardt, GA, PSO, and cuckoo search are outperformed by the artificial gorilla troops optimizer in terms of root mean square error, regression value, and computing time. The root mean square error is 0.011788 for GTO, and this value is more than the 0.02 for GA, PSO, Cuckoo search, and the Levenberg–Marquardt algorithm. GTO reached the global optimum point at the tenth iteration but GA, PSO, cuckoo search, and the Levenberg–Marquardt algorithm took more than 15 iterations. The computation time for finding the global optimum value is 5 s for the GTO algorithm, but this value is more than 6 s for GA, PSO, cuckoo search, and the Levenberg–Marquardt algorithm. An electrical load and an energy-management neural network are all part of this grid, which has a total capacity of 150 megawatts and includes a PV battery DC microgrid system rated at 40 megawatts.
Using these parameters, the simulation model (Figure 11) is put to the test, with the battery’s initial state of charge set at 0.3 power units (PU) and the irradiance of the solar PV system changing every one second. The wind speed is set at 12 m/s; the DC load is 5 kW, and the AC load power is set at 100 kW. The simulation model’s results are shown in Figure 12, Figure 13 and Figure 14.
From the results in Figure 12, Figure 13 and Figure 14, it appears that battery charging always occurs using PV power and that PV power is adjusted based on the amount of irradiance. The wind generator’s output is kept at around 45 kW, and the DC link voltage is kept at about 450 V. The grid supplies 100 kW of power. For all irradiance situations, the power balance between source and load is maintained.
Simulated results are shown in Figure 15, Figure 16 and Figure 17 under the following conditions: the battery’s starting state of charge is set at 0.7% and irradiance is adjusted every 1 s, the wind speed is 12 m per second, the DC load is 5 kW, and the AC load power is fixed at 100 kW. According to the test results shown in Figure 15, Figure 16 and Figure 17, the battery is constantly draining because of the PV power, and the PV power varies depending on the irradiance. The wind generator power is kept at approximately 45 kW; the DC link voltage is kept at around 450 V, and the grid supplies 10 kW. For all irradiance situations, the power balance between the source and the load is maintained.
Table 5 provide results comparisons of GA, PSO, cuckoo search, and the artificial gorilla troops optimizer. The total power generation of the hybrid system is 100.48 kW with a GTO-optimized neural-network energy management system, but total power generation is more than 100.69 kW for GA-, PSO-, Cuckoo-search-, and Levenberg–Marquardt-algorithm-optimized neural-network energy management systems. The efficiency of the system is 99.55% for a GTO-optimized neural-network energy management system, but the efficiency is more than 99.31% for GA-, PSO-, Cuckoo-search-, and Levenberg–Marquardt-algorithm-optimized neural-network energy management systems. The loss in the hybrid system effectively reduced the use of GTO-optimized neural-network energy management systems. From Table 5, the GTO-optimized neural-network energy management system outperforms the other considered algorithms.

5. Conclusions

This study suggests that the concept of an artificial gorilla troop optimizer optimized neural network energy management system might be useful for tiny hybrid DC/AC microgrids. The proposed energy management system was implemented by training a neural network in each mode of operation. The energy management system, powered by a neural network, takes into account the charge level of batteries, the output of local generators, and the availability of the power grid, all in accordance with the parameters set during training. Using MATLAB, we built a small-scale microgrid and monitoring system to evaluate the proposed operating algorithm for the energy management system, which includes the energy storage system, solar PV power generating system, wind power generation system, and interlink converter. Neural-network energy management systems optimized by Levenberg–Marquardt, GA, PSO, and cuckoo search were compared to those optimized by an artificial gorilla troop optimizer. The test results show that it was more effective than the Levenberg–Marquardt-, GA-, PSO-, and cuckoo-search-optimized neural-network energy management systems, with an efficiency of 99.55 percent.

Author Contributions

Conceptualization, S.M. and M.J.; methodology, S.M.; software, K.P.; validation, S.M., M.J., and K.P.; formal analysis, S.M.; investigation, M.J.; resources, K.P.; data curation, S.M.; writing—original draft preparation, S.M.; writing—review and editing, M.J.; visualization, M.J.; supervision, M.J.; project administration, M.J. All authors have read and agreed to the published version of the manuscript.

Funding

This research received no external funding.

Data Availability Statement

Not applicable.

Conflicts of Interest

The authors declare no conflict of interest.

References

  1. Ahmad, S.; Ahmad, A.; Naeem, M.; Ejaz, W.; Kim, H. A Compendium of Performance Metrics, Pricing Schemes, Optimization Objectives, and Solution Methodologies of Demand Side Management for the Smart Grid. Energies 2018, 11, 2801. [Google Scholar] [CrossRef] [Green Version]
  2. Yaqub, R.; Ahmad, S.; Ahmad, A.; Amin, M. Smart energy-consumption management system considering consumers’ spending goals (SEMS-CCSG). Int. Trans. Electr. Energy Syst. 2016, 26, 1570–1584. [Google Scholar] [CrossRef]
  3. Ahmad, S.; Naeem, M.; Ahmad, A. Unified Optimization Model for Energy Management in Sustainable Smart Power Systems. Int. Trans. Electr. Energy Syst. 2020, 30, e12144. [Google Scholar] [CrossRef]
  4. Ahmad, S.; Alhaisoni, M.M.; Naeem, M.; Ahmad, A.; Altaf, M. Joint Energy Management and Energy Trading in Residential Microgrid System. IEEE Access 2020, 8, 123334–1233346. [Google Scholar] [CrossRef]
  5. Atika, Q.; Fayaz, H.; Nasrudin, A.R.; Glenn, H.; Daniyal, A.; Khaled, S.; Khalid, H. Towards Sustainable Energy: A Systematic Review of Renewable Energy Sources, Technologies, and Public Opinions. IEEE Access 2019, 7, 63837–63851. [Google Scholar]
  6. Rajvikram, M.E.; Shafiullah, G.M.; Sanjeevikumar, P.; Nallapaneni, M.K.; Annapurna, A.; Ajayragavan, M.V.; Lucian, M.-P.; Jens, B.H.-N. A Comprehensive Review on Renewable Energy Development, Challenges, and Policies of Leading Indian States with an International Perspective. IEEE Access 2020, 8, 74432–74457. [Google Scholar]
  7. Ali, S.; Zheng, Z.; Aillerie, M.; Sawicki, J.-P.; Péra, M.-C.; Hissel, D. A Review of DC Microgrid Energy Management Systems Dedicated to Residential Applications. Energies 2021, 14, 4308. [Google Scholar] [CrossRef]
  8. European Commission. 2030 Climate & Energy Framework. Available online: https://Ec.Europa.Eu/Clima/Policies/Strategies/2030_en (accessed on 30 September 2020).
  9. REN21. Renewables 2021 Global Status Report; REN21 Secretariat: Paris, France, 2021; ISBN 978-3-948393-03-8. [Google Scholar]
  10. Ramon, Z.; Anurag, K.S. Controls for microgrids with storage: Review, challenges, and research needs. Renew. Sustain. Energy Rev. 2010, 14, 2009–2018. [Google Scholar]
  11. Asano, H.; Hatziargyriou, N.; Iravani, R.; Marnay, C. Microgrids: An overview of ongoing research, development, and demonstration projects. IEEE Power Energy Mag. 2007, 5, 78–94. [Google Scholar]
  12. Daniel, E.O.; Ali, M.-S.; Amir, H.E.; Claudio, A.C.; Reza, I.; Mehrdad, Z.; Amir, H.H.; Oriol, G.-B.; Maryam, S.; Rodrigo, P.B.; et al. Trends in Microgrid Control. IEEE Trans. Smart Grid 2014, 5, 1905–1919. [Google Scholar]
  13. Farzam, N.; Yun, W.L. Overview of Power Management Strategies of Hybrid AC/DC Microgird. IEEE Trans. Power Electron. 2015, 30, 7072–7089. [Google Scholar]
  14. Planas, E.; Andreu, J.; Gárate, J.I.; Martínez de Alegría, I.; Ibarra, E. AC and DC Technology in Microgrids: A Review. Renew. Sustain. Energy Rev. 2015, 43, 726–749. [Google Scholar] [CrossRef]
  15. Lie, X.; Dong, C. Control and Operation of a DC Microgrid with Variable Generation and Energy Storage. IEEE Trans. Power Deliv. 2011, 26, 2513–2522. [Google Scholar]
  16. Rajesh, K.S.; Dash, S.S.; Ragam, R.; Sridhar, R. A review on control of ac microgrid. Renew. Sustain. Energy Rev. 2017, 71, 814–819. [Google Scholar] [CrossRef]
  17. Poh, C.L.; Ding, L.; Yi, K.C.; Frede, B. Autonomous Operation of Hybrid Microgrid with AC and DC Subgrids. IEEE Trans. Power Electron. 2013, 28, 2214–2223. [Google Scholar]
  18. Liang, C.; Mohammad, S.; Ahmed, A.; Yusuf, A.-T. Hierarchical Coordination of a Community Microgrid with AC and DC Microgrids. IEEE Trans. Smart Grid 2015, 6, 3042–3051. [Google Scholar]
  19. Leonori, S.; Paschero, M.; Mascioli, F.M.F.; Rizzi, A. Optimization strategies for Microgrid energy management systems by Genetic Algorithms. Appl. Soft Comput. 2020, 86, 105903. [Google Scholar] [CrossRef]
  20. Cheng, Y.-S.; Liu, Y.-H.; Wang, S.-C.; Peng, B.-R. A Particle Swarm Optimization Based Energy Management Strategy for Hybrid Generation System. In Proceedings of the 2017 5th International Conference on Applied Computing and Information Technology/4th International Conference on Computational Science/Intelligence and Applied Informatics/2nd International Conference on Big Data, Cloud Computing, Data Science (ACIT-CSII-BCD), Hamamatsu, Japan, 9–13 July 2017; pp. 104–108. [Google Scholar] [CrossRef]
  21. Khalid, A.; Zafar, A.; Abid, S.; Khalid, R.; Ali Khan, Z.; Qasim, U.; Javaid, N. Cuckoo Search Optimization Technique for Multi-objective Home Energy Management. In Innovative Mobile and Internet Services in Ubiquitous Computing, Proceedings of the 11th International Conference on Innovative Mobile and Internet Services in Ubiquitous Computing (IMIS-2017), Torino, Italy, 28–30 June 2017; Barolli, L., Enokido, T., Eds.; Advances in Intelligent Systems and Computing; Springer: Cham, Switzerland, 2018; Volume 612. [Google Scholar] [CrossRef]
  22. Ajay, G.; Suryanarayana, D.; Kishore, C. Hybrid AC-DC Microgrid: Systematic Evaluation of Control Strategies. IEEE Trans. Smart Grid 2018, 9, 3830–3843. [Google Scholar]
  23. Javad, K.; Gerry, M. Simplified Hybrid AC-DC Microgrid with a Novel Interlinking Converter. IEEE Trans. Ind. Appl. 2020, 56, 5023–5034. [Google Scholar]
  24. Igualada, L.; Corchero, C.; Cruz-Zambrano, M.; Heredia, F. Optimal Energy Management for a Residential Microgrid Including a Vehicle-to-Grid System. IEEE Trans. Smart Grid 2014, 5, 2163–2172. [Google Scholar] [CrossRef] [Green Version]
  25. Radhakrishnan, P.; Ramaiyan, K.; Vinayagam, A.; Veerasamy, V. A stacking ensemble classification model for detection and classification of power quality disturbances in PV integrated power network. Measurement 2021, 175, 109025. [Google Scholar] [CrossRef]
  26. Veerasamy, V.; Wahab, N.I.A.; Ramachandran, R.; Othman, M.L.; Hizam, H.; Kumar, J.S.; Irudayaraj, A.X.R. Design of single- and multi-loop self-adaptive PID controller using heuristic based recurrent neural network for ALFC of hybrid power system. Expert Syst. Appl. 2022, 192, 116402. [Google Scholar] [CrossRef]
  27. Veerasamy, V.; Wahab, N.I.A.; Othman, M.L.; Padmanaban, S.; Sekar, K.; Ramachandran, R.; Hizam, H.; Vinayagam, A.; Islam, M.Z. LSTM Recurrent Neural Network Classifier for High Impedance Fault Detection in Solar PV Integrated Power System. IEEE Access 2021, 9, 32672–32687. [Google Scholar] [CrossRef]
  28. Veerasamy, V.; Wahab, N.I.A.; Ramachandran, R.; Madasamy, B.; Mansoor, M.; Othman, M.L.; Hizam, H. A novel RK4-Hopfield Neural Network for Power Flow Analysis of power system. Appl. Soft Comput. 2020, 93, 106346. [Google Scholar] [CrossRef]
  29. Abdollahzadeh, B.; Soleimanian Gharehchopogh, F.; Mirjalili, S. Artificial gorilla troops optimizer: A new nature-inspired metaheuristic algorithm for global optimization problems. Int. J. Intell. Syst. 2021, 36, 5887–5958. [Google Scholar] [CrossRef]
Figure 1. Hybrid-microgrid distribution network AC/DC system.
Energies 15 08187 g001
Figure 2. Flowchart of a neural network energy management system.
Energies 15 08187 g002
Figure 3. Structure of a neural network.
Energies 15 08187 g003
Figure 4. Different phases of the gorilla troops optimizer.
Energies 15 08187 g004
Figure 5. Flowchart of gorilla troops optimizer.
Energies 15 08187 g005
Figure 6. Input and target data for a neural network.
Energies 15 08187 g006
Figure 7. Performance of training using artificial gorilla troops optimizer algorithm.
Energies 15 08187 g007
Figure 8. Regression plot of a neural network after training by artificial gorilla troops optimizer.
Energies 15 08187 g008
Figure 9. Final neural network after training.
Energies 15 08187 g009
Figure 10. Convergence curve of GA, PSO, Cuckoo search, and GTO.
Energies 15 08187 g010
Figure 11. Simulink model of a neural-network energy management system for a hybrid AC–DC microgrid.
Energies 15 08187 g011
Figure 12. Power of grid, PV, battery, wind generator, and AC load at case1.
Energies 15 08187 g012
Figure 13. Battery voltage, current, power, and state of charge at case1.
Energies 15 08187 g013
Figure 14. Duty cycle of bi directional converter, DC link voltage, voltage, and current of DC load at case1.
Energies 15 08187 g014
Figure 15. Power of grid, PV, battery, wind generator, and AC load at case2.
Energies 15 08187 g015
Figure 16. Battery voltage, current, power, and state of charge at case2.
Energies 15 08187 g016
Figure 17. Duty cycle of bi directional converter, DC link voltage, voltage, and the current of DC load at case2.
Energies 15 08187 g017
Table 1. MODE 1 Data for ANN.
SOC (%)PdgPgridIdref
0.1−0.490.29−1.49
0.1−0.490.49−1.39
0.1−0.490.69−1.29
0.100.29−1.19
0.100.49−1.09
0.100.69−0.99
0.10.490.29−0.89
0.10.490.49−0.79
0.10.490.69−0.69
0.3−0.490.29−1.39
0.3−0.490.49−1.29
0.3−0.490.69−1.19
0.300.29−1.09
0.300.49−0.99
0.300.69−0.89
0.30.490.29−0.79
0.30.490.49−0.69
0.30.490.69−0.59
Table 2. MODE 2 Data for ANN.
SOC (%)PdgPgridIdref
0.490.290.290.09
0.490.290.490.19
0.490.290.690.39
0.490.690.290.1
0.490.690.490.09
0.490.690.690.19
0.690.290.290.19
0.690.290.490.29
0.690.290.690.49
0.690.690.290.19
0.690.690.490.29
0.690.690.690.49
0.890.290.290.29
0.890.290.490.39
0.890.290.690.59
0.890.690.290.29
0.890.690.490.39
0.890.690.690.59
Table 3. MODE 3 Data for ANN.
SOC (%)PdgPgridIdref
0.49−0.290.290.4
0.49−0.290.490.5
0.49−0.290.690.6
0.49−0.690.290.7
0.49−0.690.490.8
0.49−0.690.690.9
0.69−0.290.291
0.69−0.290.490.7
0.69−0.290.690.8
0.69−0.690.290.9
0.69−0.690.491
0.69−0.690.691.1
0.89−0.290.291.2
0.89−0.290.491
0.89−0.290.691.2
0.89−0.690.291.3
0.89−0.690.491.4
0.89−0.690.691.5
Table 4. Performance analysis of the training of neural network with Levenberg–Marquardt, GA, PSO, cuckoo search, and artificial gorilla troops optimizer.
AlgorithmRoot Mean Square ErrorGlobal Point EpochsHidden NeuronRegression ValueComputation Time (s)
Levenberg–Marquardt0.038313150.87–0.9910
GA0.026420100.90–0.9910
PSO0.0245515100.93–0.996
Cuckoo search0.0235617100.93–0.997
Artificial gorilla troops optimizer0.01178810100.98–0.995
Table 5. Performance analysis of simulation results with LMNN, GANN, PSONN, Cuckoo-NN, and GTONN.
AlgorithmBattery Power
(kW)
PV Power
(kW)
Wind Power
(kW)
Grid Power
(kW)
Total Source Power
(kW)
Total Load (kW)Efficiency
(%)
LMNN17.3127.438.1418.31101.1610098.85
GANN17.5927.537.4518.56101.1010098.91
PSONN17.3527.237.8918.31100.7510099.29
Cuckoo-NN17.1827.138.1118.3100.6910099.31
GTONN16.8626.9638.2618.4100.4810099.55
Publisher’s Note: MDPI stays neutral with regard to jurisdictional claims in published maps and institutional affiliations.

