Article

Creep Phenomenon in a Multiple-Input Single-Output Control System of a Piezoelectric Bimorph Actuator

Faculty of Mechanical Engineering and Robotics, AGH University of Science and Technology, al. Mickiewicza 30, 30-059 Kraków, Poland
*
Author to whom correspondence should be addressed.
Energies 2022, 15(21), 8267; https://doi.org/10.3390/en15218267
Submission received: 30 September 2022 / Revised: 29 October 2022 / Accepted: 2 November 2022 / Published: 5 November 2022
(This article belongs to the Special Issue Energy Problems in Control and Robotics Systems)

Abstract

:
This article presents a comparison of the course of a creep phenomenon in the control system of a bimorph actuator, in which control voltages were applied to both piezoelectric layers, with the course of the creep phenomenon in the control system of a unimorph actuator, in which a control voltage was applied to only one piezoelectric layer. The bimorph actuator was built from two layers of piezoelectric composite, macro fiber composite was applied, and a carrier layer made of epoxy laminate was used for production of printed circuit boards. A comparative analysis was carried out on the basis of 22 laboratory experiments in which the vision system was used to measure a displacement change of six points of the bimorph actuator structure. Based on the results of laboratory experiments, it was noted that the duration of a transient part is approximately the same in a system with a control voltage applied to one MFC patch as in a system with control voltages applied to two MFC patches. In the system with control voltages applied to two MFC patches, the position change due to the creep process is more than two times bigger in comparison to the system with the control voltage applied to one MFC patch.

1. Introduction

Piezoelectric actuators consist of two main parts: a material exhibiting piezoelectric properties and an executive structure generating displacement or/and force. Taking into account that the actuator’s executive structures can be very diverse [1,2], this article focuses on only one of the structures, which is a cantilever-type bimorph actuator [3] that works in bending mode. Bimorph actuators can have two piezoelectric layers and one substrate layer, or only two piezoelectric layers [4]. Piezoelectric materials, used in bimorph actuators, can be divided into three main groups: ceramics, especially lead zirconate titanate (PZT) [1,5]; ceramic–polymer composites, especially macro fiber composite (MFC) [6]; and polymers, especially polyvinylidene fluoride (PVDF) [7]. PZT ceramics are more suited to use as actuators, while PVDF polymers are better for sensing applications [8]. Composites enable higher actuator deflections in comparison to ceramics [9]. The substrate layer in a cantilever-type bimorph actuator mostly has a rectangular longitudinal cross-section, and other shapes, e.g., tapered [10], are less often investigated. The substrate layer is made from a metal [1], especially steel [11], or a composite, especially a material used for printed circuit board (PCB) manufacturing [12] or materials containing carbon and glass fibers [13].
The polarization of both layers of piezoelectric material in the bimorph actuator can be both perpendicular [14] and parallel [9] to the symmetry axis of the cantilever beam. The direction of polarization is related to the piezoelectric material used: in the case of PZT ceramics, the polarization is perpendicular to the symmetry axis of the cantilever beam, and in the case of the MFC composite, the polarization is parallel to the same axis. When polarization of the piezoelectric layers is perpendicular to the symmetry axis of the cantilever beam, the electrical connection of the two layers of piezoelectric material may be in series, parallel or biased uniform [15]. Xu et al. [16] proposed two electrical connections for the bimorph actuator, one of which enables the obtaining of an alternating supply of both piezoelectric layers and second simultaneous supply of these layers. When the polarization of the piezoelectric layers is parallel to the symmetry axis of the cantilever beam, the two layers of piezoelectric material may be electrically connected in parallel [17], or not electrically connected [18]. In the case of actuator control, in which independent control voltages are applied to two piezoelectric layers, the control system becomes a multiple-input single-output (MISO) system [19].
Two main areas can be distinguished in the step response of a general piezoelectric actuator: the transient part and the creep phenomenon [20]. The creep starts immediately after the transient part, whose duration is many times smaller in comparison with the duration of the creep. The creep phenomenon is the drift of the displacement of ceramics for a constant applied electric field [21]. The drift is caused by a slow realignment of crystal domains in piezoelectric at a constant input voltage over time, so this phenomenon is the function of time and input voltage [22]. The creep phenomenon that causes the displacement of a piezoelectric actuator depends on the frequency of excitation [23]; the creep becomes noticeable in slow-speed operations [24]. The creep phenomenon decreases with time [25]. Two groups of mathematical models: a logarithmic models and a finite-dimension linear time-invariant (LTI) models are mainly used for the creep phenomenon’s description in the literature [26]. Logarithmic models are based on a linear relationship between actuator displacement caused by step of control signal and the logarithmic scaled time. LTI models describe the creep phenomenon as a series connection of springs and dampers. These two models are phenomenological descriptions of the creep phenomenon take into account the physical principles of creep phenomena to a small extent [27].
The course of the creep phenomenon in the control systems of cantilever-type unimorph or bimorph actuators is described in the literature in the same way as for a general piezoelectric actuator. For a cantilever-type actuator, Schröck et al. [28] noted that the creep course depends on the evolution of the control voltage signal in the past. Escareno et al. [29] investigated the creep phenomenon on two axes and noticed that there is a coupling between the waveforms of the creep phenomenon on the two axes. However, the available literature does not contain full knowledge on the course of the creep phenomenon in a bimorph actuator control system. Two issues have not been reported in the literature: (1) how the number of control signals affects the course of the creep phenomenon, and (2) whether the course of the creep phenomenon depends on the distance from the fixing of the cantilever beam. The first issue concerns bimorph actuators, which in their structures contain two layers of piezoelectric material, polarized in a direction parallel to the axis of a cantilever beam (such an actuator is presented in, e.g., [18]). During upward deflection of the actuator, the top piezoelectric layer is compressed and the bottom piezoelectric layer is tensioned; the opposite situation occurs during the downward deflection of the actuator. A research question arises: how will the application of a control voltage with opposite signs to both piezoelectric layers (bimorph) affect the course of the creep phenomenon compared to applying a voltage to one layer only (unimorph)? The laboratory research presented in the following chapters intend to answer this question.

2. Research Methods

2.1. Research Object

A piezoelectric bimorph actuator was manufactured from three components: one layer of standard FR-4 epoxy laminate, which is used for production of printed circuit boards, and two patches of piezoelectric material, which were type P1 macro fiber composites (MFC) manufactured by Smart Material Corp. The MFC patch consists of rectangular piezoelectric fibers, layers of adhesive, interdigitated electrodes and outer shell made from a polyimide [30]. The polarization of the piezoelectric material is along the direction of the rectangular fiber [31]. The MFC patches were glued symmetrically on both sides of the FR-4 layer. Epoxy Adhesive DP490, produced by 3M, was used to produce two glued joints. The mutual arrangement of these three layers is shown in Figure 1a, its fixing in a clamping assembly in Figure 1b and its geometric parameters are presented in Table 1.
In laboratory experiments, one end of the beam was fixed in a stationary clamping assembly and the other was unfixed. The direction of polarization of the piezoceramic fibers was in line with the axis 3, so MFC patches also generated stresses in the manufactured beam in the axis 3 direction. Hence, if one end of the beam was fixed and MFC no 1 generated compressive stresses and MFC no 2 generated tensile stresses, then the second unfixed end of the beam moved upwards in line with the axis 1. If MFC no 1 generated tensile stresses and MFC no 2 compressive stresses, the unfixed end of the beam moved downwards in the direction of axis 1.
Both MFC patches were controlled by using a TD250-INV voltage amplifier [32], produced by PiezoDrive. Two independent voltage control signals with a maximum/minimum value equal to ±500 V were the output quantities from the amplifier. The input signals to the amplifier had a maximum/minimum value of ±10 V and their value and shape were created in the MATLAB Simulink program. The output signals from the amplifier were the product of the input signals to the amplifier and the number 25. RT_DAC/Zynq board, produced by INTECO company, was used to make the connection between the hardware: TD250-INV voltage amplifier, and the software: MATLAB Simulink. RT_DAC/Zynq board, containing a Xilinx FPGA chip, is dedicated to real-time data acquisition and control in Windows environments [33].

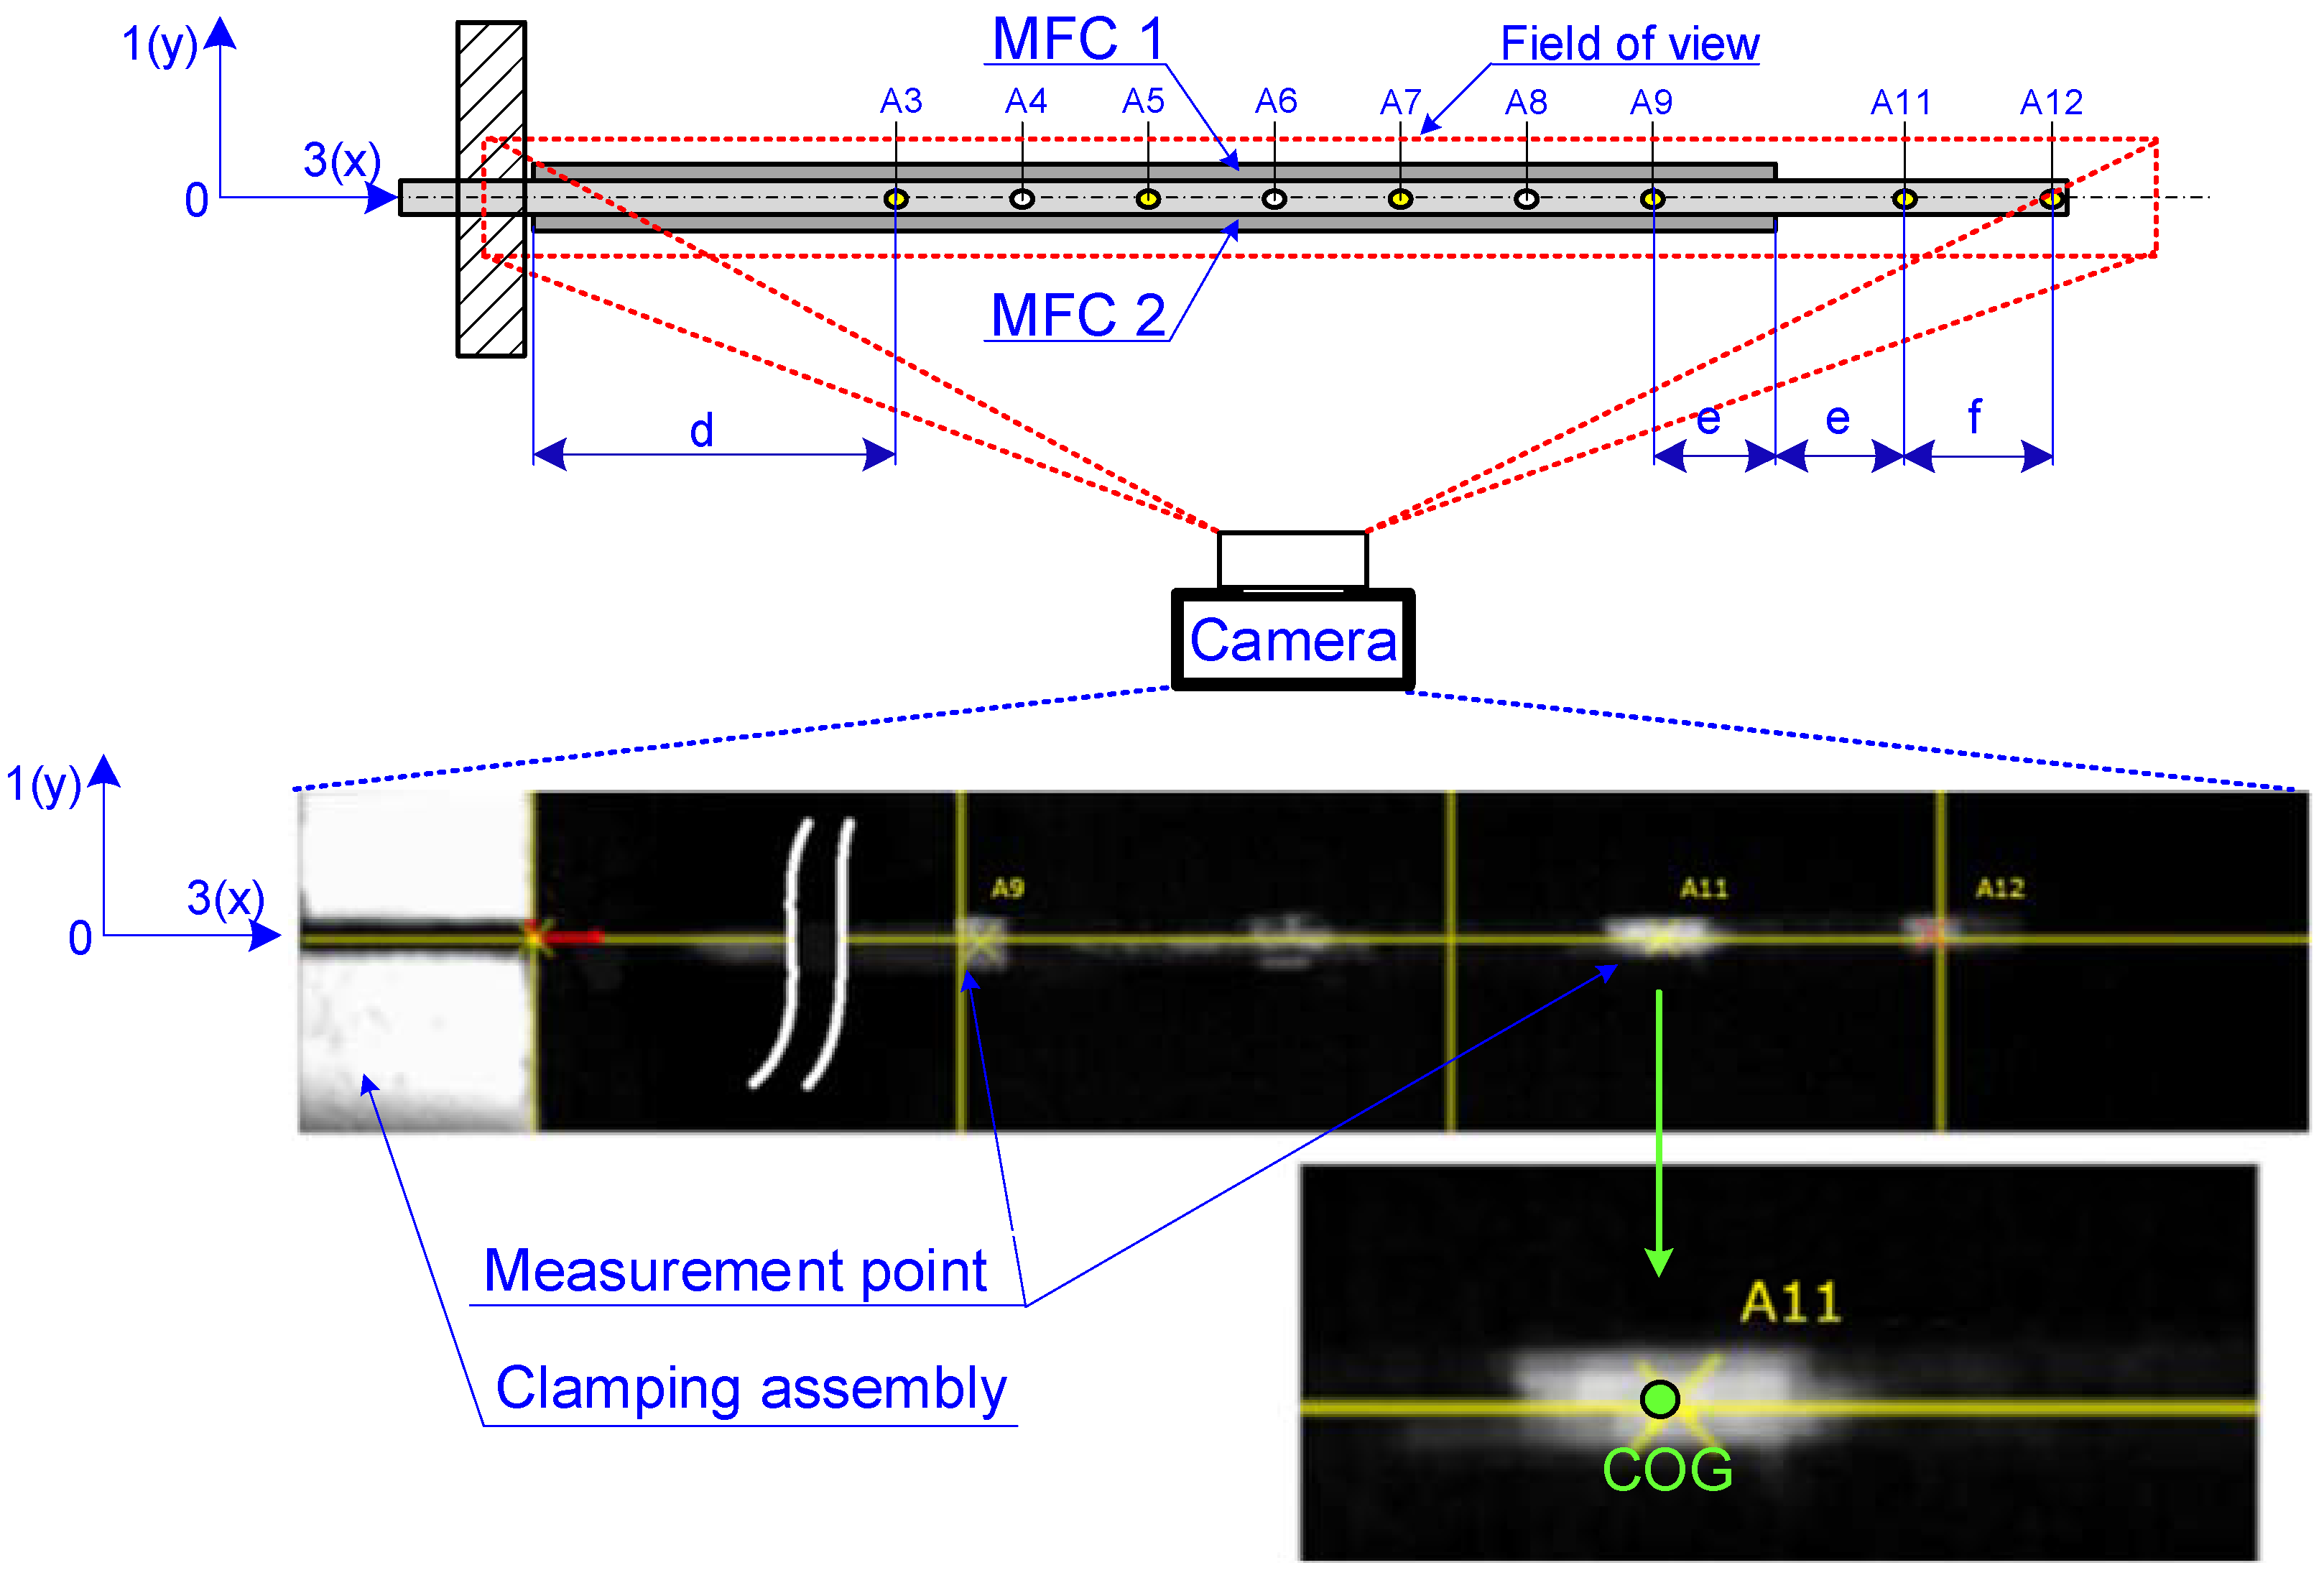
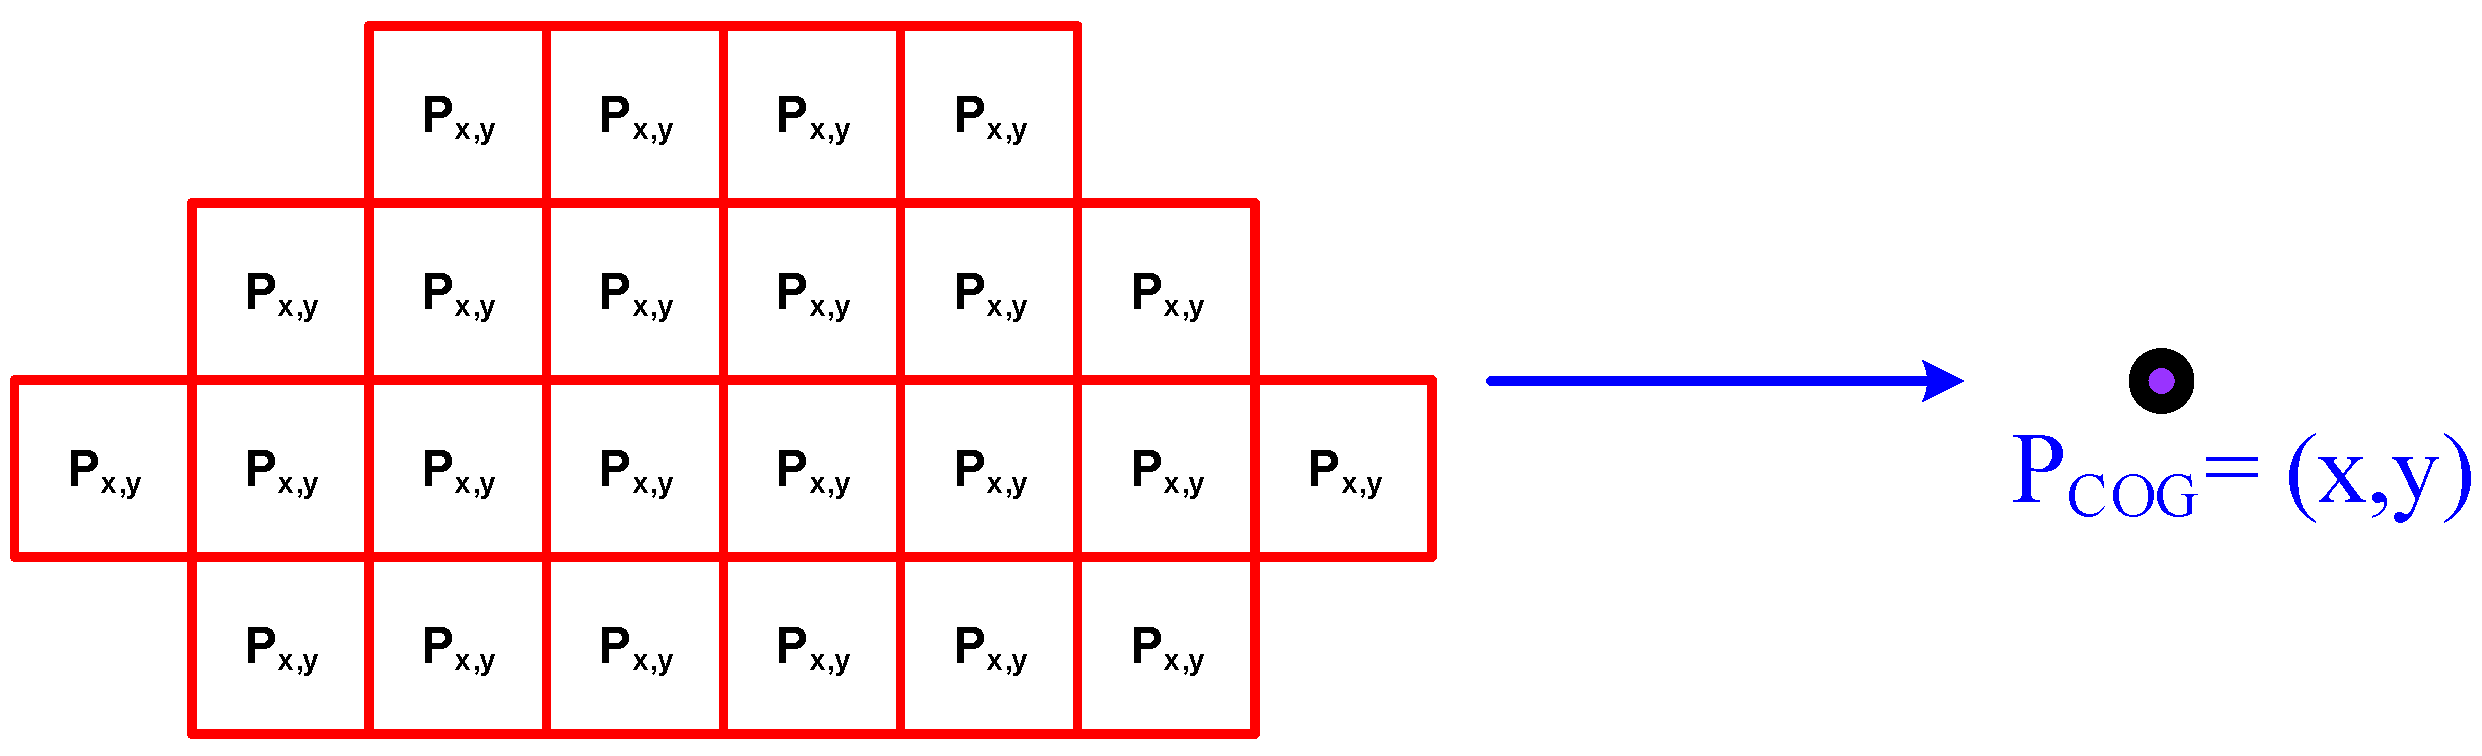
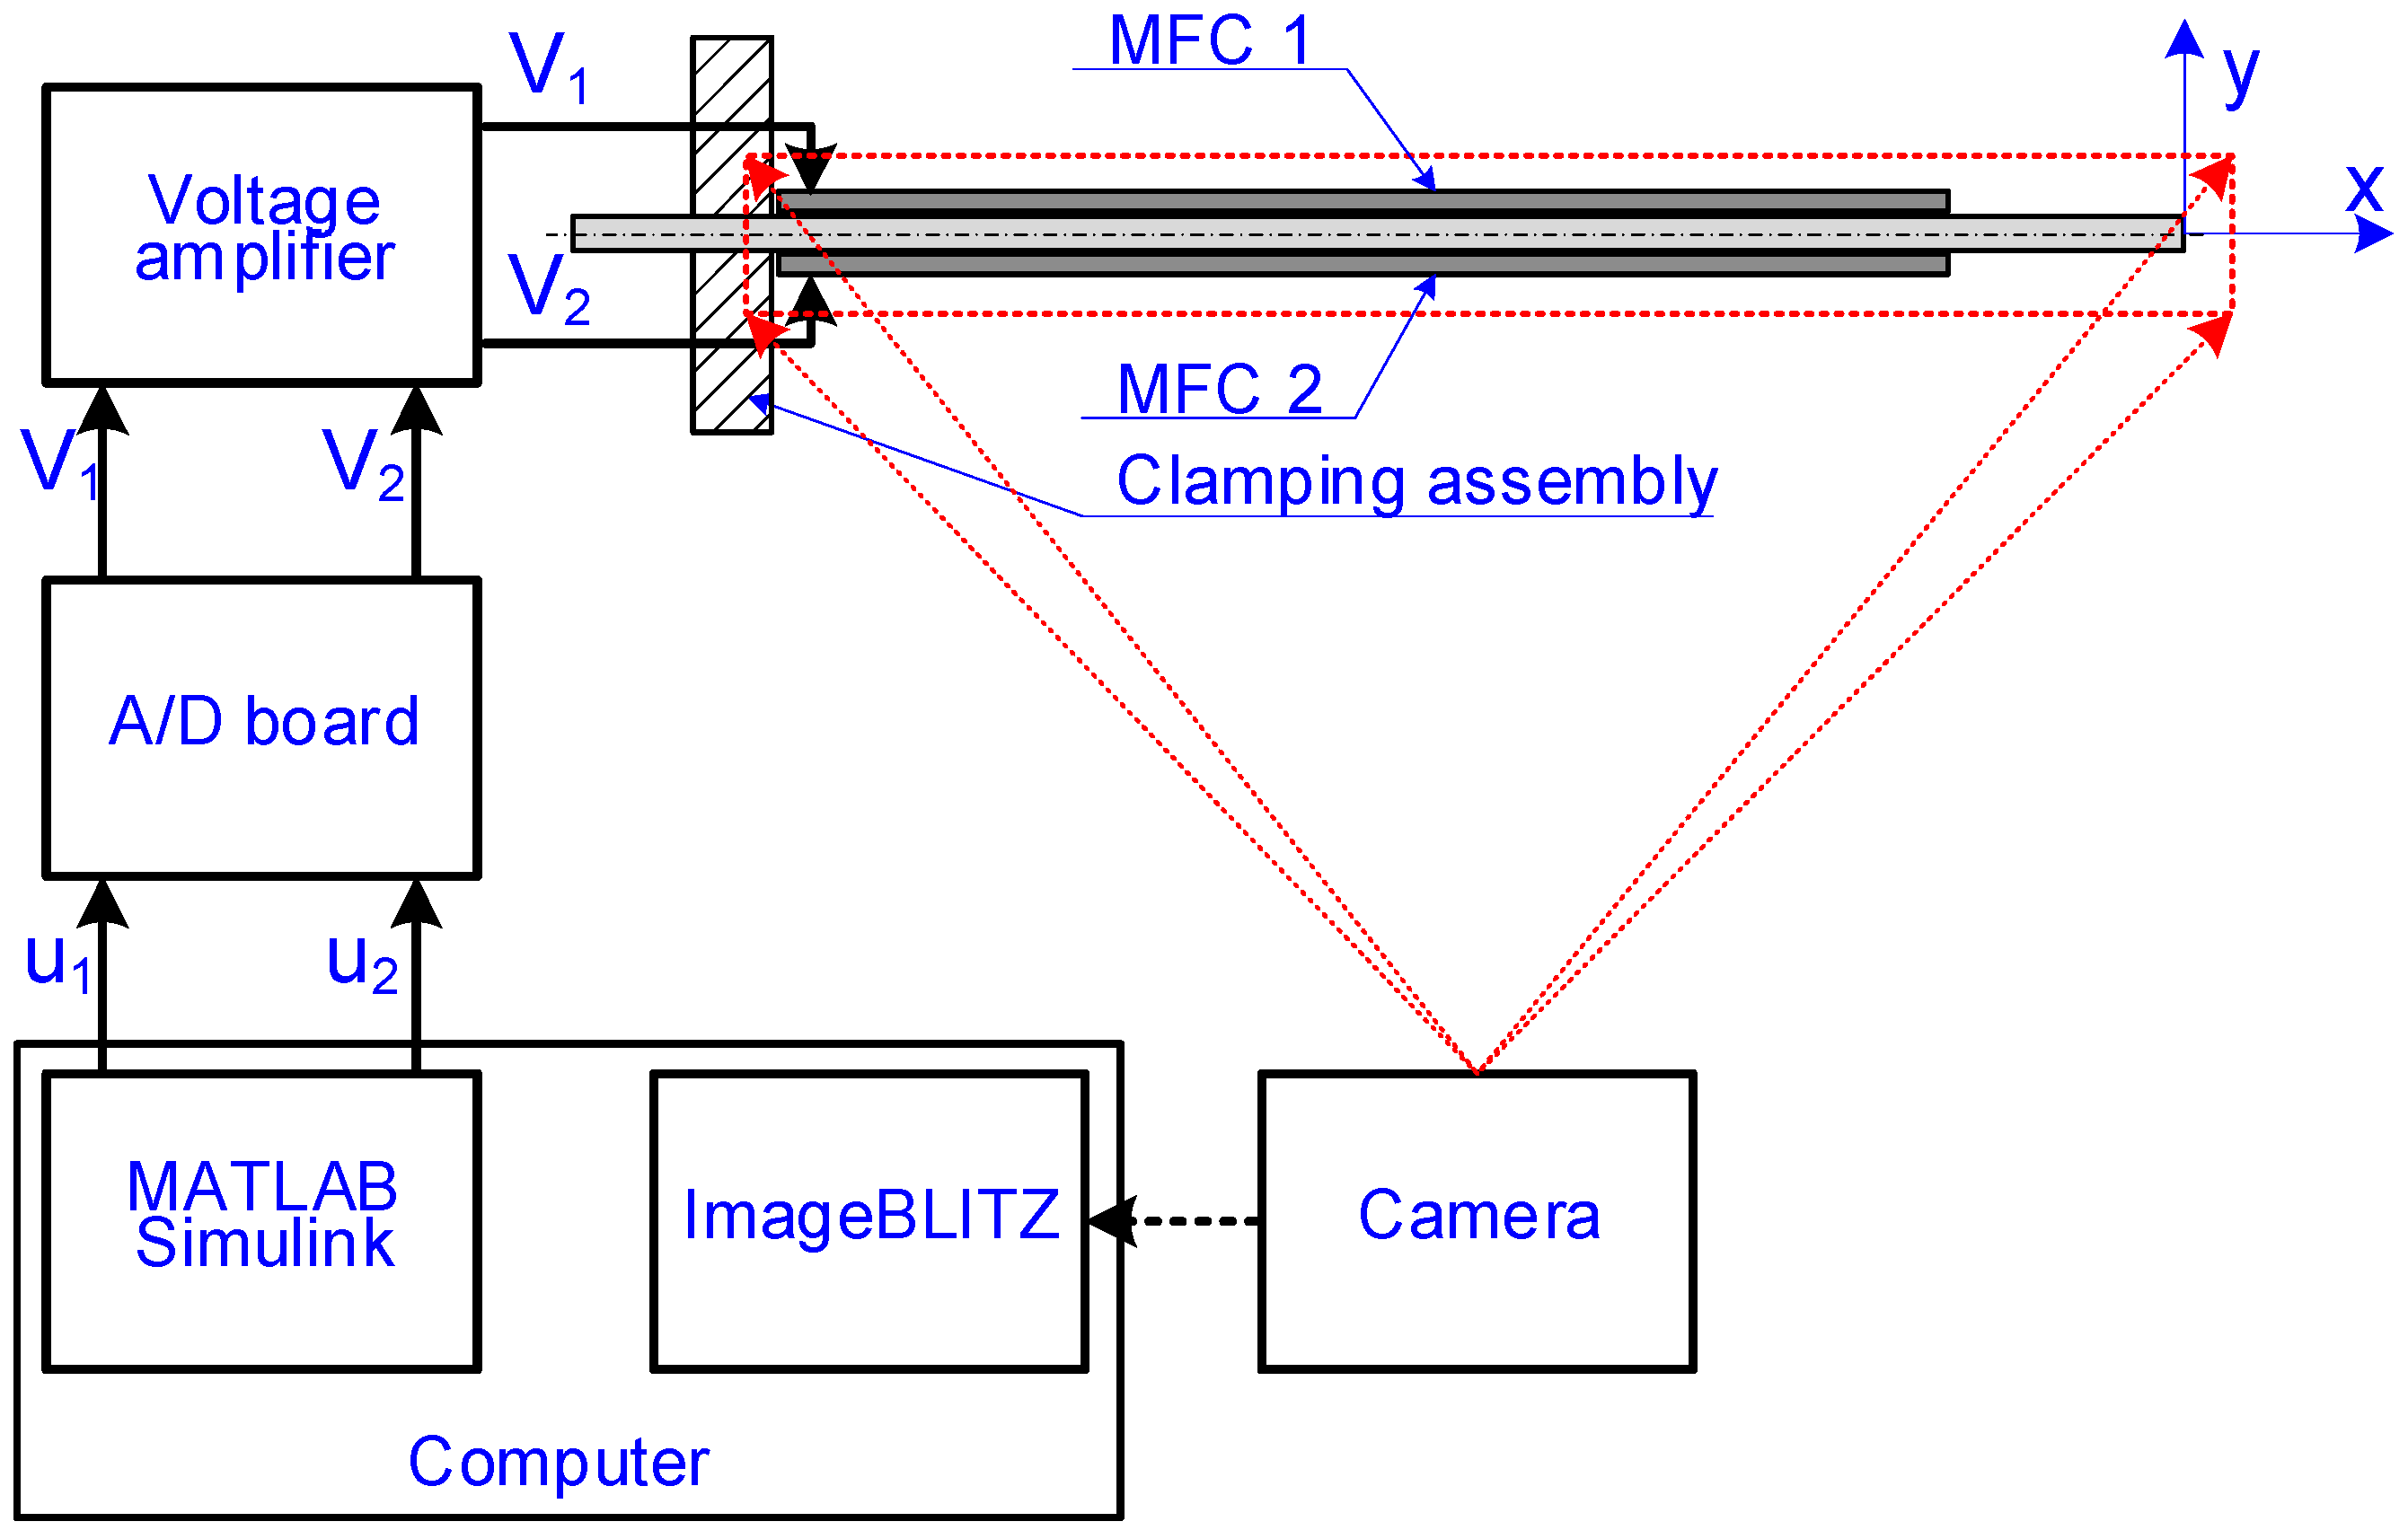
2.2. Measurement System

A motion of the bimorph actuator was measured using a vision system, the main part of which was a camera capable of recording an image of the entire beam and simultaneously recording the beam deformation at all characteristic points marked on the beam. An image registration matrix of 1200 × 100 pixels was used for the tests, allowing the registration of the field of view (Field of View) marked in Figure 2. Image calibration was performed using the length standard registered in the measurement station system [34]. The resolution of the displacement measurement using image analysis for the set-up measurement station is 11.6 µm/pixel. The research used a measurement algorithm that allows for determining each measurement point’s position with a resolution of up to 1/16 of a pixel.
A coordinate system for the vision measurements was adopted at point U0. The OX axis of the coordinate system coincides with the axis of symmetry of the beam in its mounting system. On the other hand, the OY axis was positioned at the edge of the mounting system. As part of the tests carried out, the displacements of measurement points A3, …, A9 and A11, A12 described on the beam were determined in the Y axis of the coordinate system adopted. A localization of measurement points in the beam structure is presented in Figure 2. The distances between the points A3 and A9 were the same and each distance was 10 mm. The description of the deformation of the beam using the displacements of the characteristic points was performed in two measurement modes. The first two vision measurements were aimed at describing changes in the position of the applied measurement points, the displacement velocities and the accelerations occurring when the control signal was applied to the MFC patches. The image acquisition system was configured to capture images at a rate of 5000 frames per second with an exposure time per frame of 150 μs. This configuration required a high-powered illuminator to capture images with clearly visible markers. A 30 W white light diode illuminator was used to illuminate the beam in a ring configuration. It allows correct illumination of the field and markers within the ring. This illuminator made it possible to reproduce the measuring points well on the image as bright areas. For each of the points recorded in the beam image, pixels describing the area of each marker in the image segmentation process were extracted based on the definition of absolute intensity. The center of gravity calculation algorithm was used for calculating marker position coordinates for each point. An algorithm taking into account the position of each pixel forming the marker area was used to determine the area’s center of gravity. The example of the area of the measurement point marker is presented in Figure 3.
The area indicating the position of the marker need not contain pixels of precisely the same intensity. It is most often composed of pixels of similar intensity defined by a certain range. The marker area must have an average intensity significantly different from the background upon which it is observed. The position of the center of gravity was determined by using all marker pixels with the following relationship:
P COG _ X = 1 P i = 1 P P xi
P COG _ Y = 1 P i = 1 P P yi
where P is a number of pixels forming the marker area, Pxi is x-coordinate of the Pi pixels making up the area in the image and Pyi is y-coordinate of the Pi pixels making up the area in the image.
An algorithm for calculating the position coordinates of all feature points was implemented for each image recorded during the survey. Each recorded sequence consisted of several thousand recorded images. In each of the recorded images, the position of the center of gravity of the markers was determined in pixel coordinates. These were then converted to a coordinate expressed in millimeters in the coordinate system adopted by the image. In the next step, the velocity of each point and its acceleration were determined. All parameters such as displacement, velocity and acceleration were determined in the OY axis of the adopted coordinate system [35]. Based on the analysis of successive images, successive positions of points in the adopted coordinate system were determined. Information on the coordinates of points was collected in a .csv file. Determining the positions of markers in time, corresponding to the sequence of recorded images, made it possible to describe changes in the coordinates of the observed points and changes in their speed and acceleration. The use of recording information about the movement parameters of the measurement pointing to a .csv file made it possible to import the data into MATLAB software, in which the analysis of the creep process was performed. As part of the first part of the study, two series of measurement images were recorded. Each series allowed 8 s of recording at 5000 fps (frames per second), describing the transient state after applying the control signal. First, the transition state for control using MFC patch 1 was recorded. Then the transition state for simultaneous control with MFC patch 1 and MFC patch 2 were recorded. The second part of the study involved observing the beam at a lower frequency (1500 fps) but over a more extended period of time and aimed to observe the creep process. As part of these tests, a set of control signals was prepared for each MFC patch. A sequence of images was recorded for each control signal level. From these tests, the relationship between the creep process and the level of the control signal fed to the MFC patch was determined.
Schema of a laboratory stand contained the piezoelectric actuator with control system and the measurement system are shown in Figure 4. The view of the piezoelectric actuator and the measurement system is shown in Figure 5.

3. Results

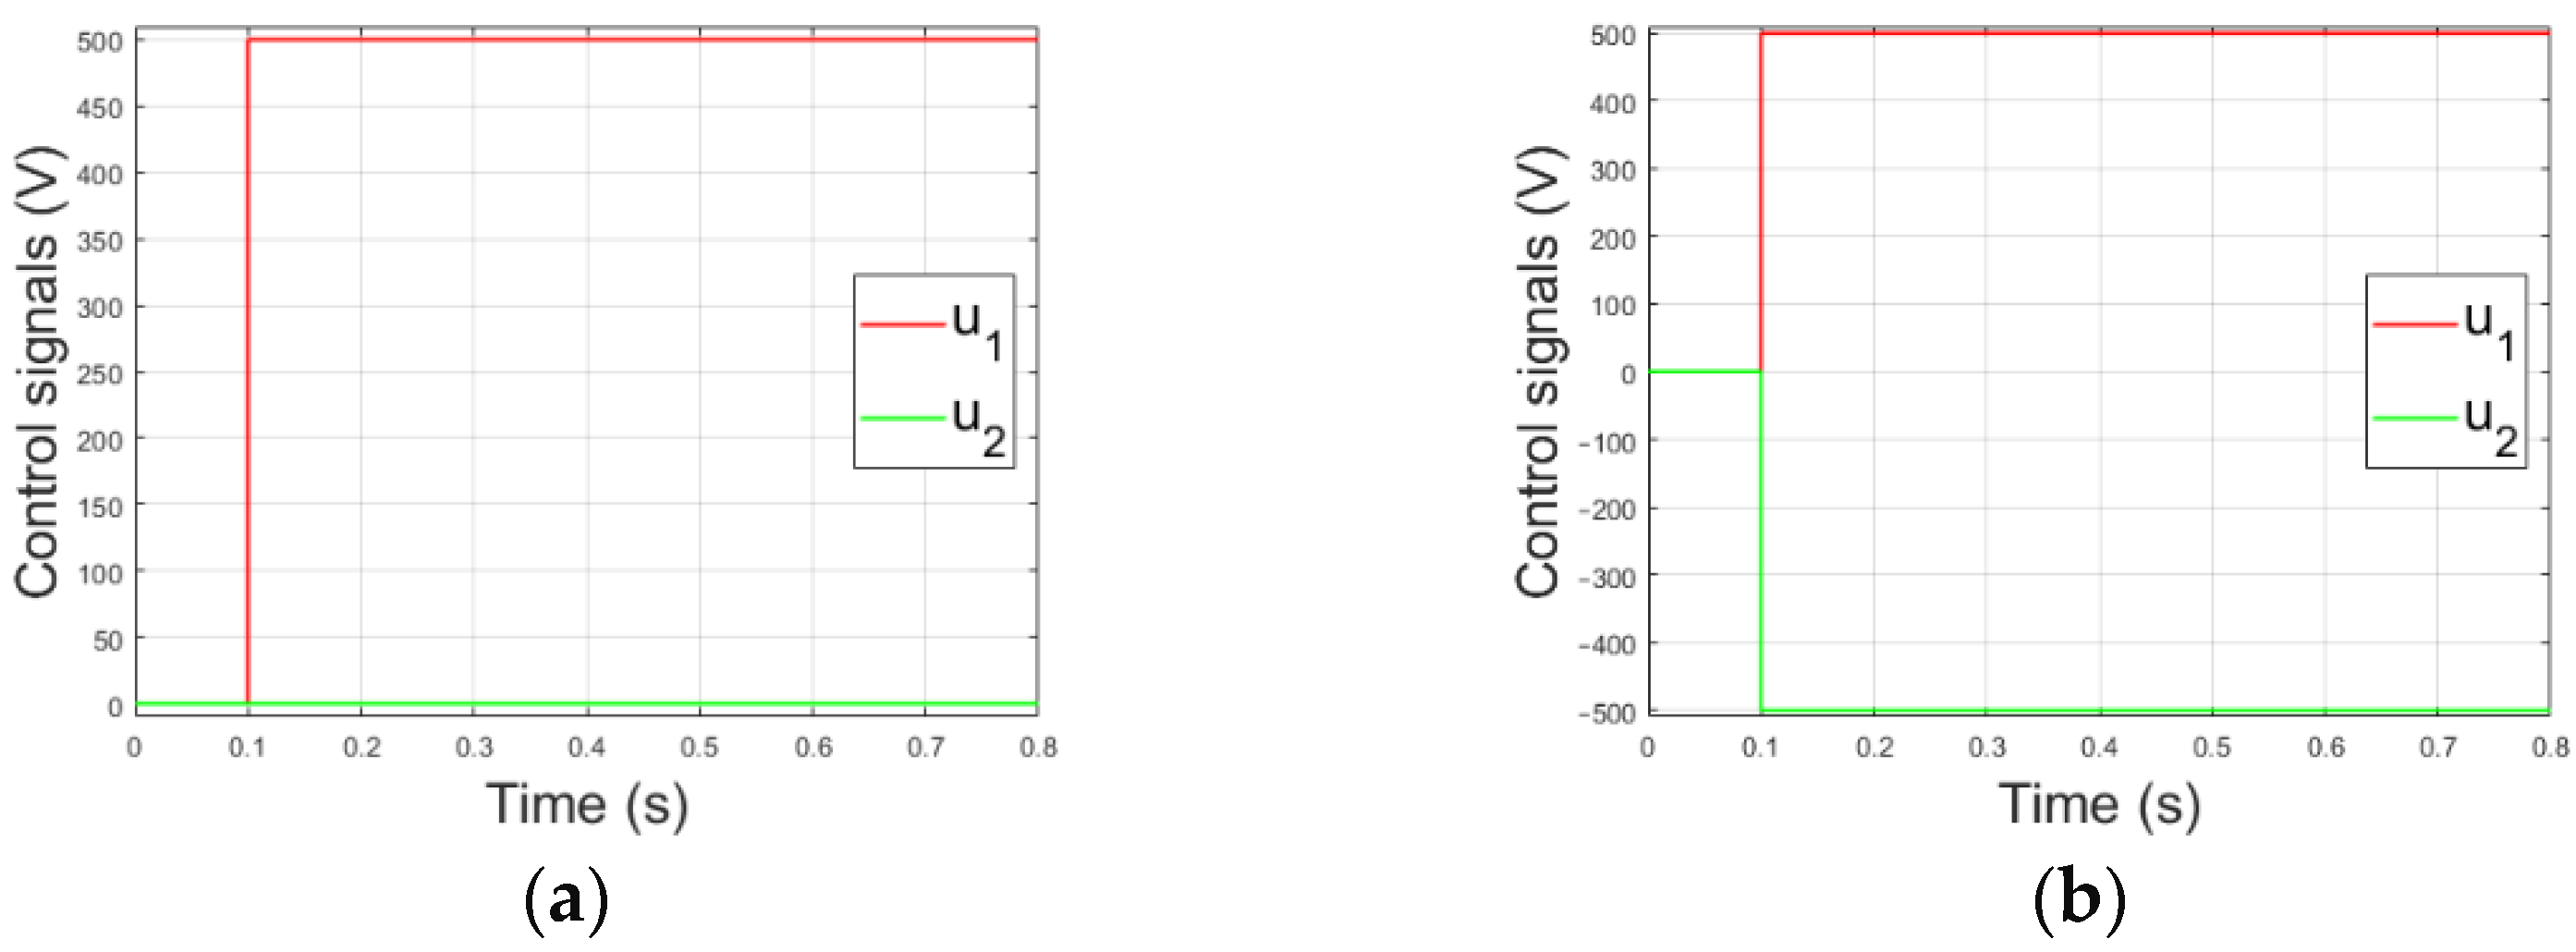
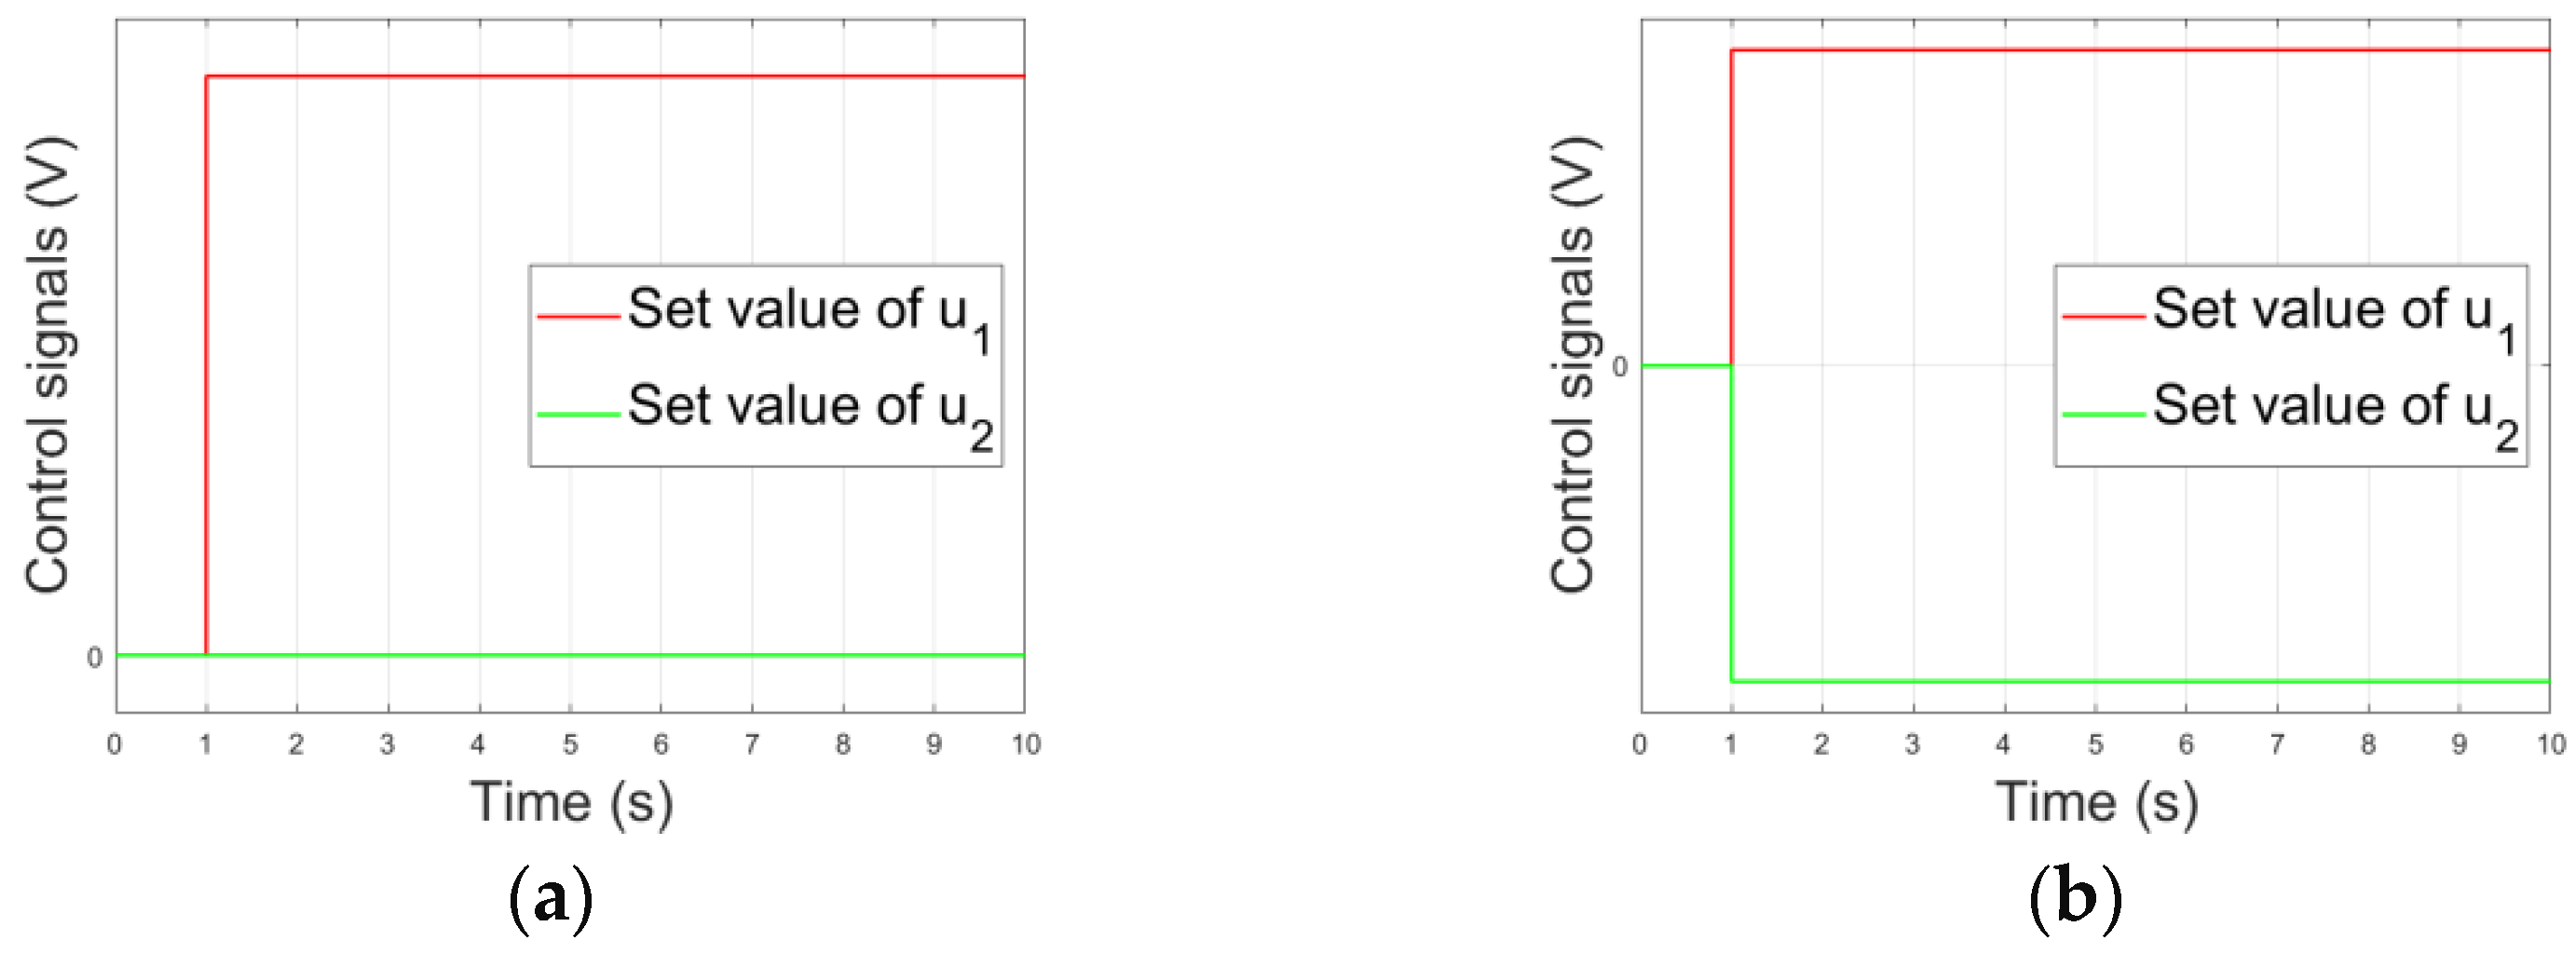
3.1. Program of Laboratory Experiments

Laboratory research consisted of two stages: preliminary research, the aim of which was to determine the duration of a transient part in an actuator step response, and the proper research, the purpose of which was to determine the course of a creep phenomenon itself. The preliminary research contained 2 experiments and the proper research contained 20 experiments.
The preliminary research was carried out with a frequency equal to 5000 fps and included determining the step response waveform for two sets of control voltages. In the first set u1 = +500 V and u2 = 0 V, and in the second set u1 = +500 V and u2 = –500 V. The durations each of experiments were 800 ms. The course of control signals in laboratory experiments are presented in Figure 6 .
The proper research was carried out with a frequency equal to 1500 fps and contained 20 experiments. Particular experiments differed from each other in the number of control signals (one or two) and the value of these signals. In all experiments, a step change of the value of control signal/signals from the value equal to 0 to the set value was applied. The course of control signals in laboratory experiments are presented in Figure 7. Table 2 shows the set values of control signals.

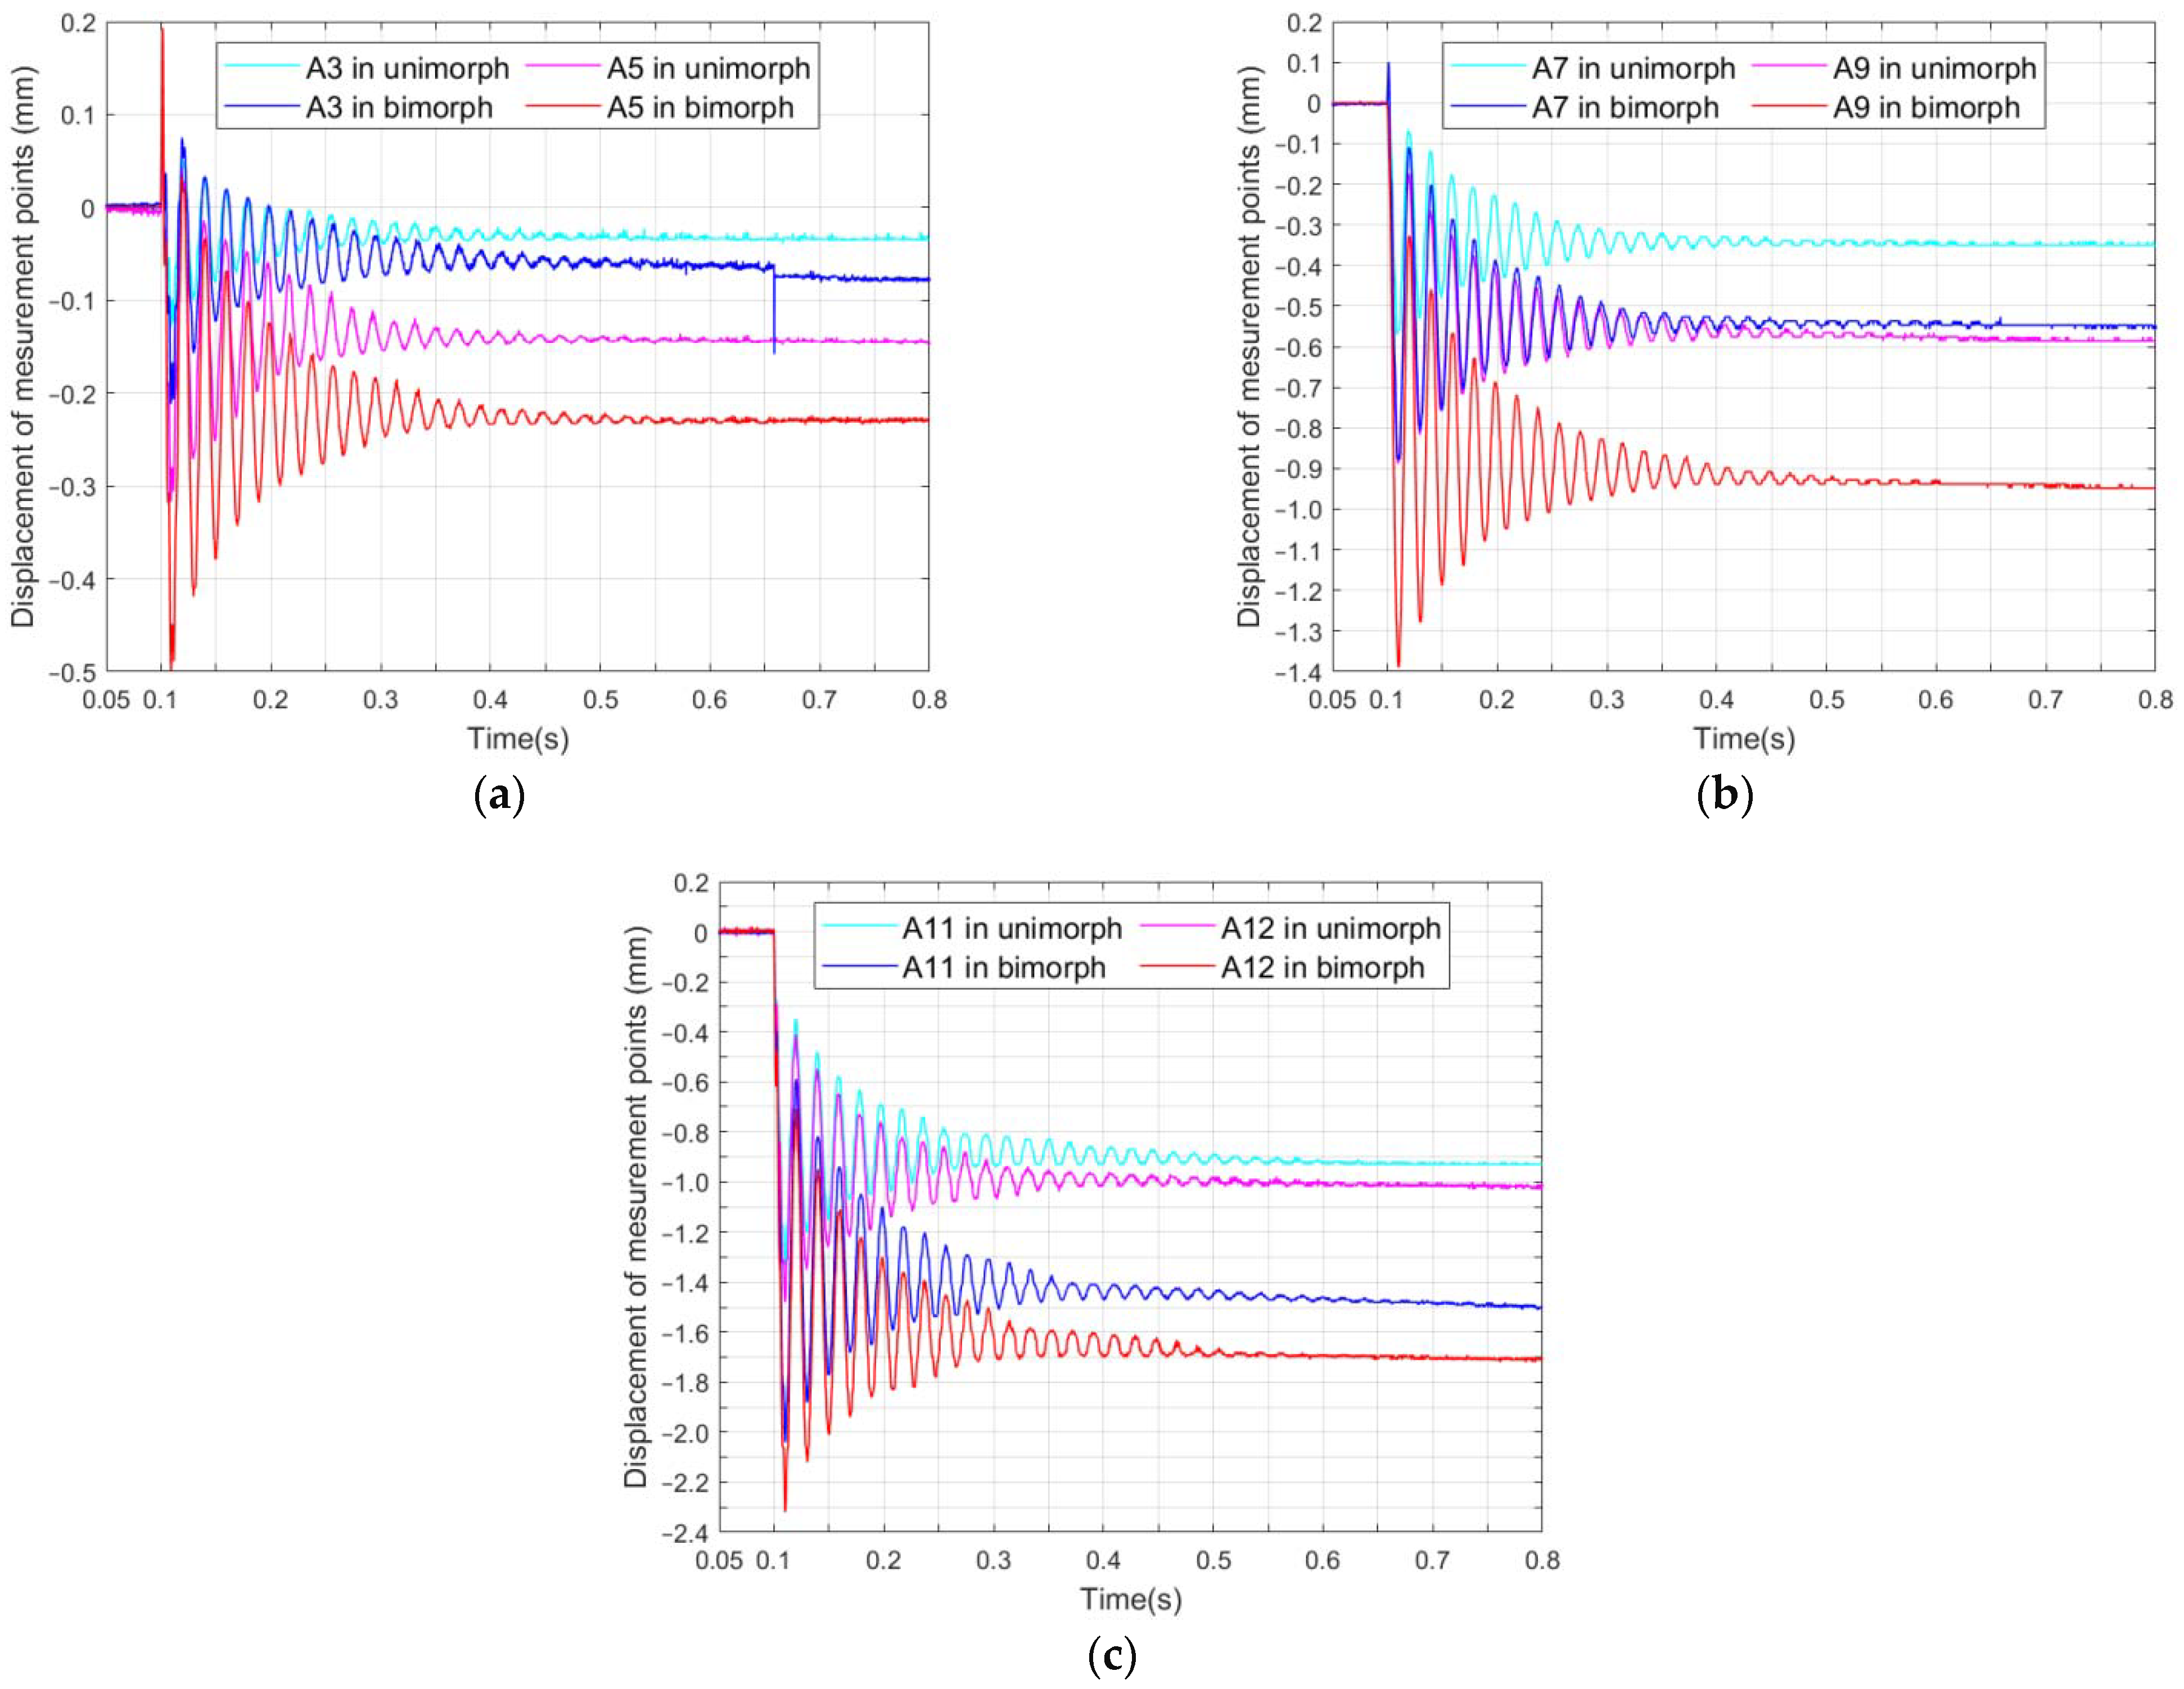
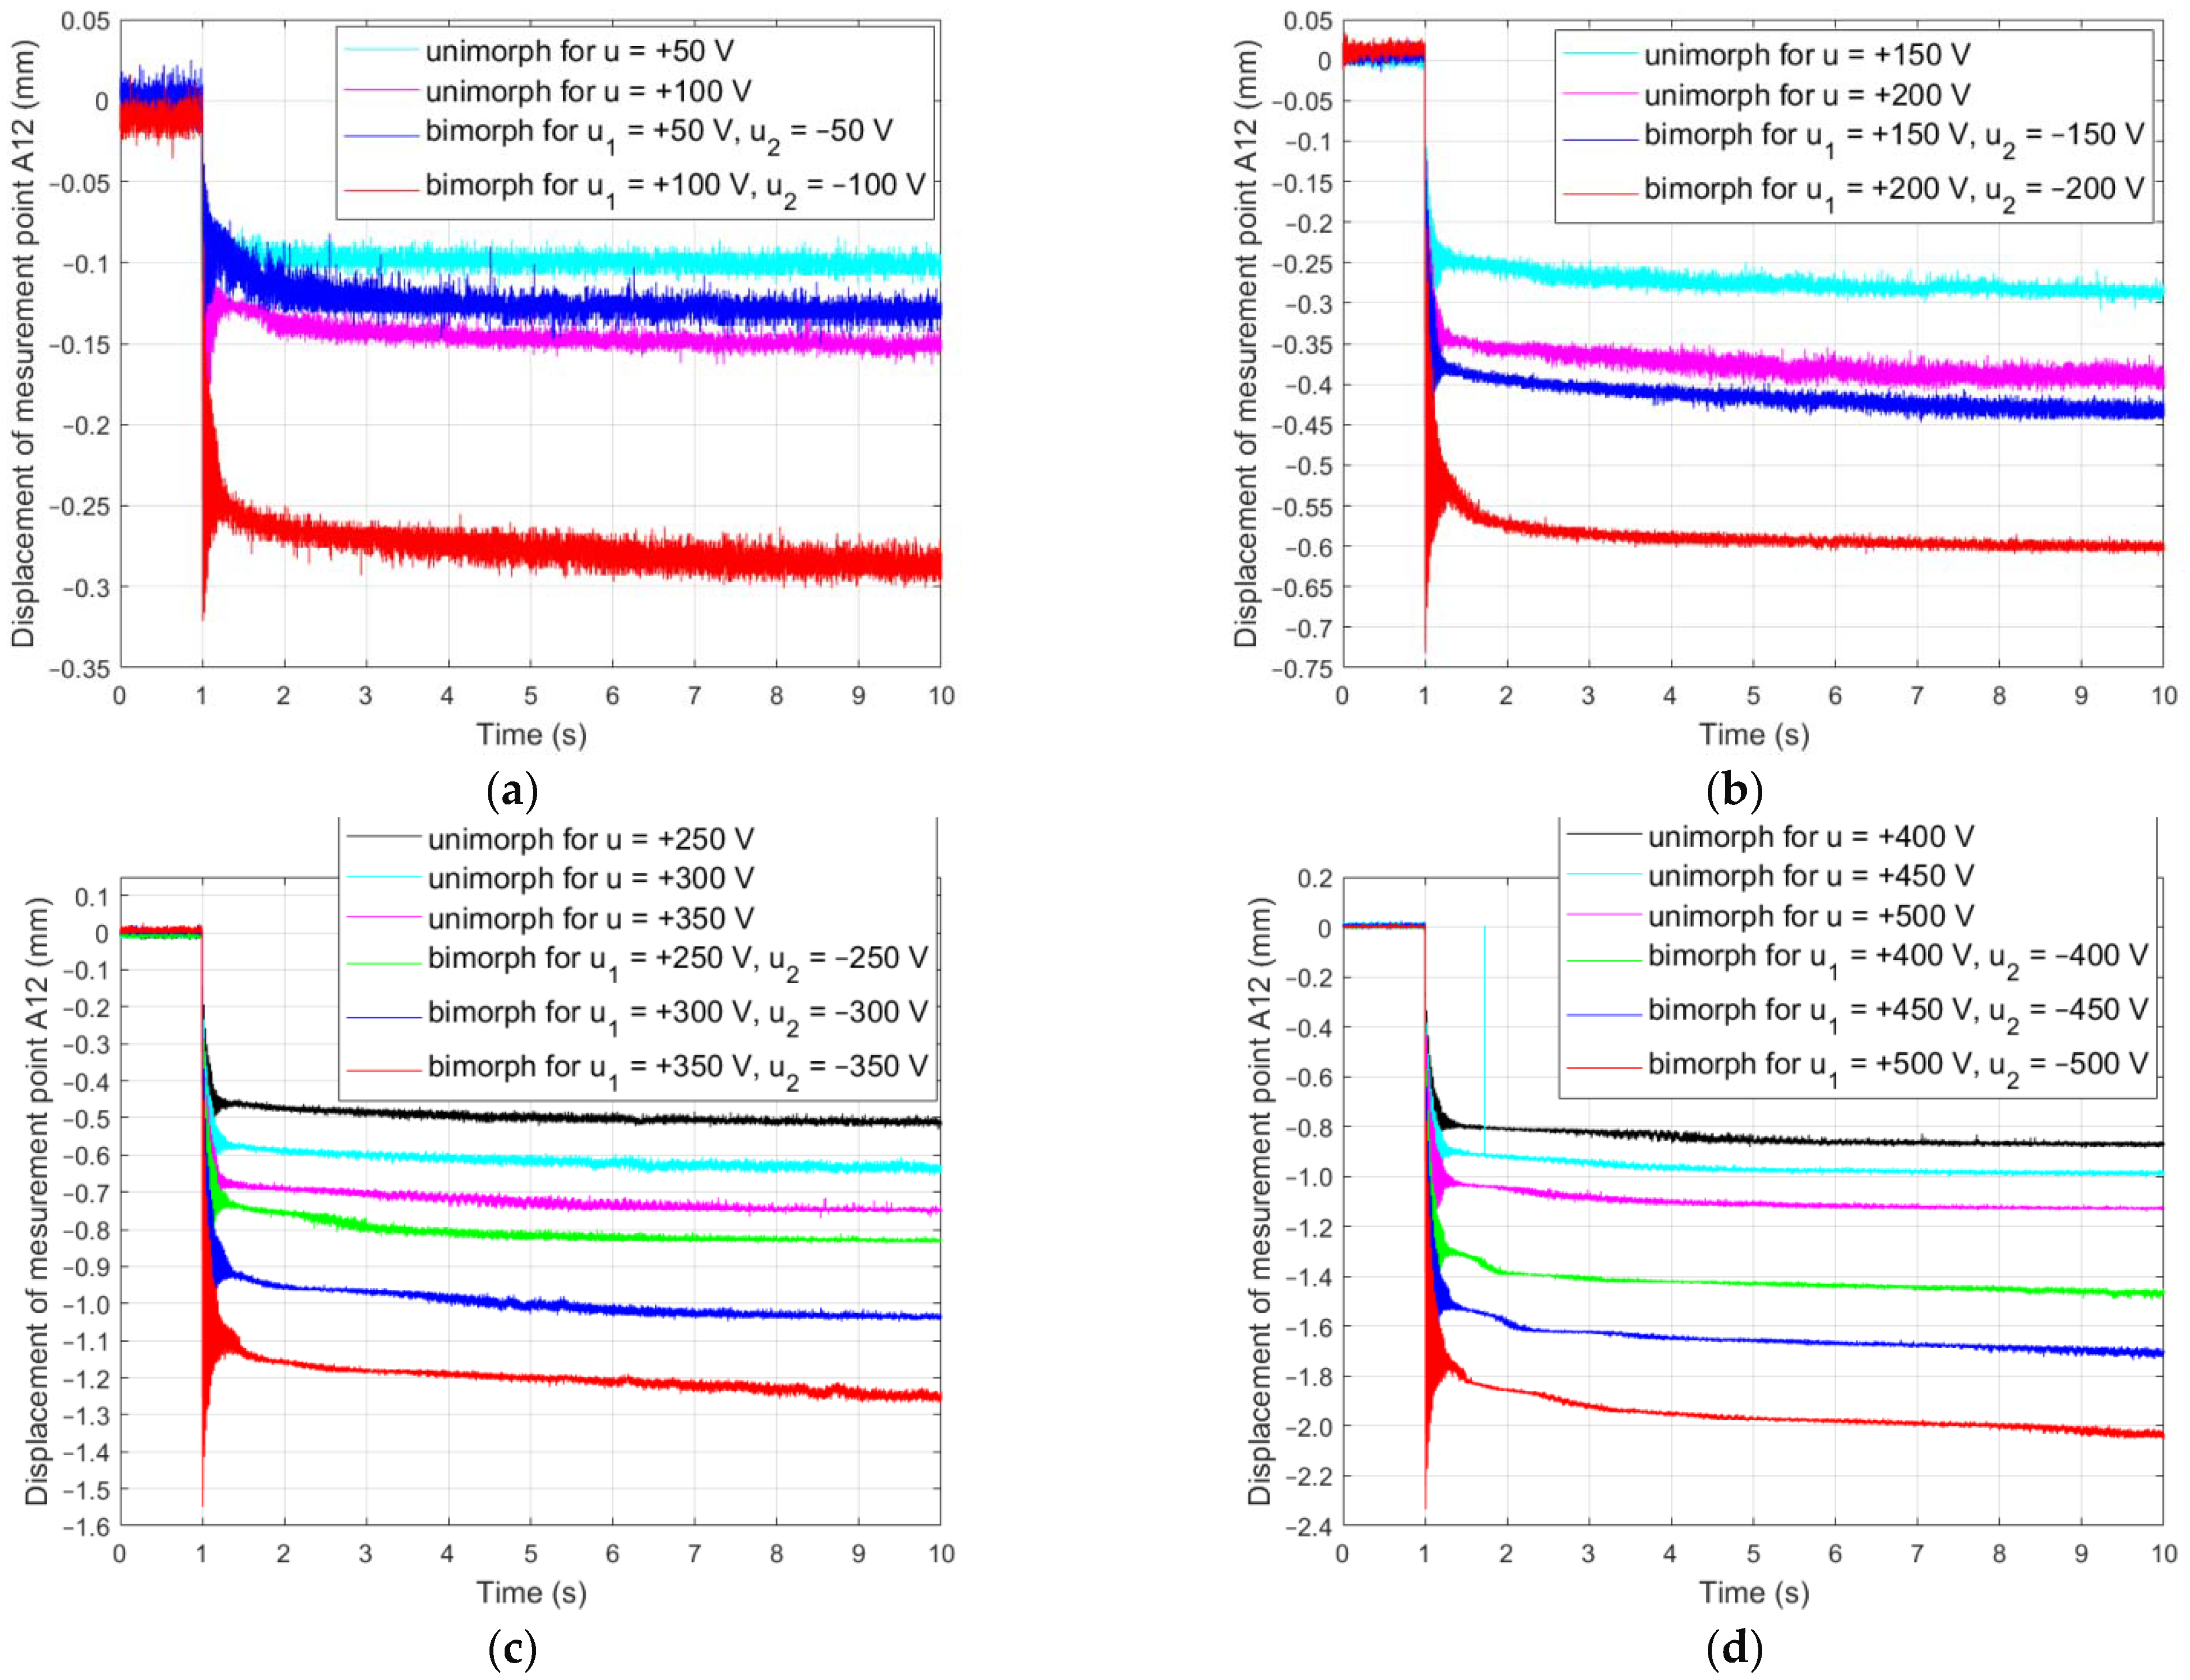
3.2. Transient Part of Actuator Step Response

Courses of step responses of six measurement points: A3, A5, A7, A9, A11, A12 in the first 700 ms of these responses are presented in Figure 8.
In order to determine the duration of a transit part, the average courses of a step responses were determined for all of measurement points. In MATLAB R2019b, moving averages were calculated with the assumed time window equal to 100 ms. The courses of these averages are shown in Figure 9. On the basis of the course of the moving averages, it was assumed that the duration of the transit part was equal to 25 ms (from t0 = 1 s to t1 = 1.025 s) in both the one-control signal and the two-control signal experiment.

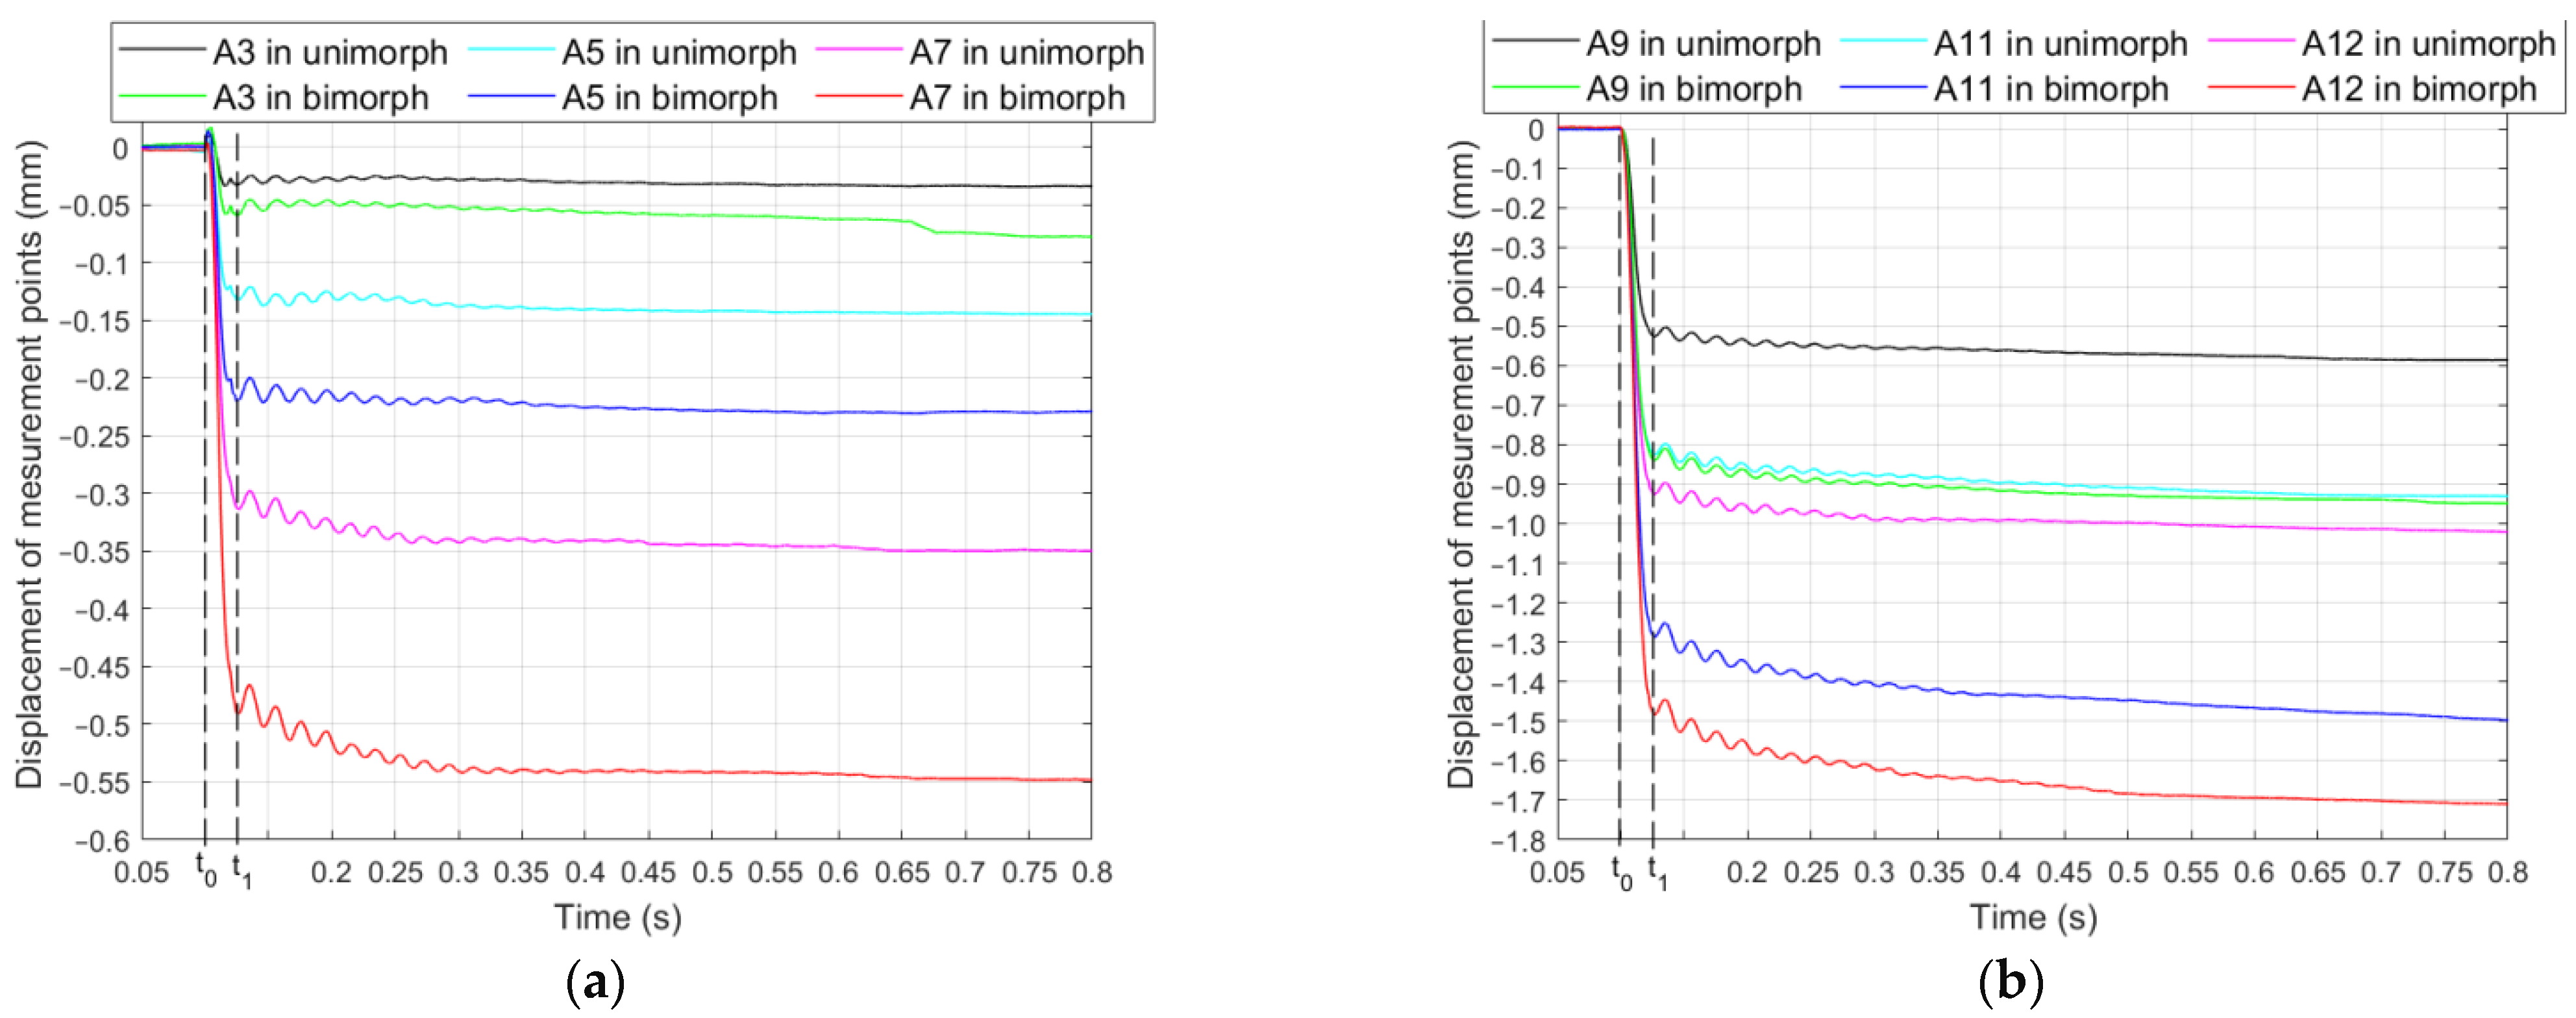
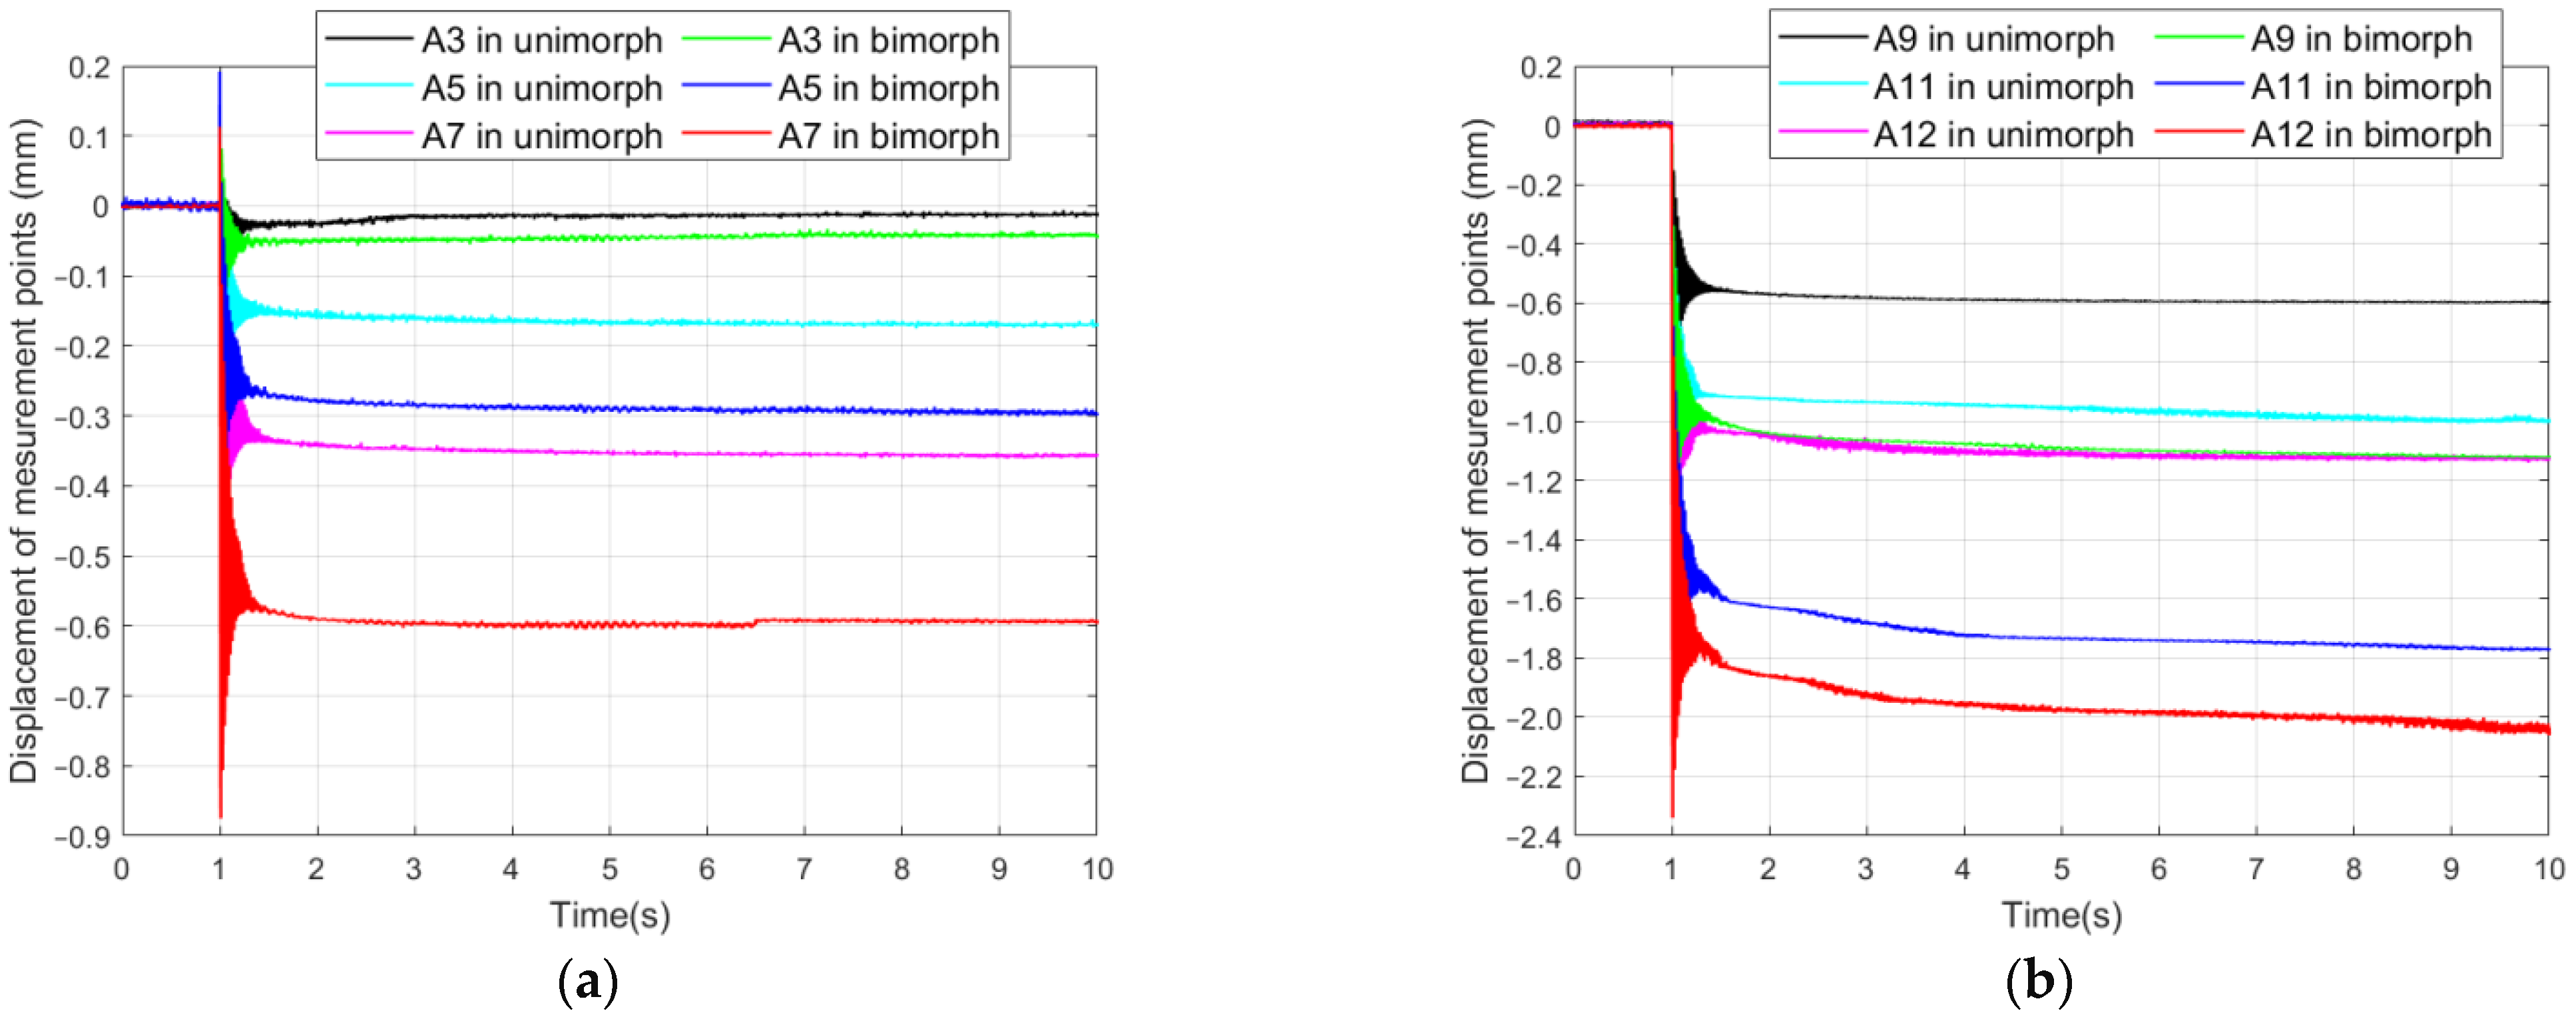
3.3. A Course of Creep Phenomenon

A displacement of the measurement point A12 for 10 values of the control voltage u1 from the range: +50 V to +500 V is presented in Figure 10a. The displacement of the measurement point A12 for 10 values of the control voltage u1 from the range: +50 V to +500 V and 10 values of u2 from the range: −50 V to −500 V is shown in Figure 10b.
Displacements of the measurement points: A3, A5, A7, A9, A11, A12 for the control voltage u1 equal to +500 V is presented in Figure 11a. Displacements of the measurement points for the control voltage u1 equal to +500 V and the control voltage u2 equal to –500 V is shown in Figure 11b.
Figure 10 and Figure 11 show the results of selected laboratory experiments only. Such types of courses were determined on the basis of data collected in all 20 experiments, the conditions of which are presented in Table 3. Based on these courses, position changes of measurement points resulting from the creep phenomenon occurring was calculated. For the position change of each point, the following calculation procedure was adopted: (1) calculation of the average actuator position y1 in the time interval from 1.025–1.525 s, (2) calculation of the average actuator position y2 in the time interval of 9.5–10 s, (3) calculation of the difference between these two positions: y2–y1. Changes of the positions of measurement points in all of laboratory experiments are presented in Table 3.

4. Discussion

The first problem that needs to be solved during the analysis of the creep phenomenon is the determination of the beginning of a creep process. It is known from the literature that the step response of a piezoelectric actuator contains two areas: a step response transient part and a position change caused by the creep process. Some researchers assume that the start time of the creep process is equal to the start time of the transient part [20], that is, they do not include this transient part in their analysis. Other researchers assume a constant value of the transient part duration, usually equal to 0.1 s [21,22]. Wang et al. [36] proposed to assume that the transient part is part of the creep process. The creep process was divided by them into two areas: a transient portion of creep and a steady portion of creep; the step response transient part was named a damped oscillation and included in the creep transition part. This article assumes that the actuator step response contains two distinct areas: a step response transient part and a position change caused by the creep [20]. The article proposes to determine the start time of the creep phenomenon on the basis of the course of the moving average. Based on numerical research, it was assumed that the time window was equal to 100 ms in the moving average calculation. The designated time for the beginning of a creep phenomenon was 1.025 s (Figure 9). Note that this time is approximately the same for all measurement points. The most important observation from this part of the research was that a duration of the transient part is approximately the same in a system with control voltage applied to one MFC patch and in a system with control voltages applied to two MFC patches.
Courses of the creep process were estimated on the basis of measurement point position changes between the beginning of creep process and the end of laboratory experiment. In order to answer the research question of how the number of control signals affects the course of the creep phenomenon, a percentage difference between displacements caused by creep phenomenon of the unimorph actuator and the displacements caused by creep phenomenon of the bimorph actuator was calculated for 10 set values of control signals. The displacement of the unimorph actuator was assumed to be the reference displacement for the displacement of the bimorph actuator. The comparison of a percentage ratio of point displacements in the bimorph and in the unimorph is shown in Table 4.
A value without a sign in Table 4 means that the displacement of bimorph actuator was greater than the displacement of unimorph actuator in the direction of action of this actuator that is in the direction towards −∞ on axis 1(y), e.g., 300% means that the displacement of the bimorph actuator was three times greater than the unimorph actuator. The sign “−” next to a value means that the greater point position change occurred in the unimorph compared to the bimorph in the direction of action of this actuator that is in the direction towards −∞ on axis 1(y). It was noted that in the system with control voltages applied to two MFC patches the position change due to the creep process was more than twice the size in comparison to the system with control voltage applied to one MFC patch. The position changes of bimorph were on average 257% of the position changes of unimorph for point A12 in the direction of actuator action and 292% for point A11, 265% for point A9, 211% for point A7, 426% for point A5, 131% for point A3, respectively. On average, the position changes of the bimorph were 264% of the position changes of the unimorph for all six measurement points. Hence, it can be concluded that the change of position caused by creep in a system with two control inputs is not the sum of changes in positions of two control systems with one control input.
In order to answer the second research question: whether the course of the creep phenomenon depends on the distance from the fixing of the cantilever beam, the percentage ratios of displacements, caused by creep phenomenon, between adjacent points were calculated for the bimorph. The increase in the displacement of A12 in relation to A11 amounted to an average of 19% in the direction of actuator action and 138% A11 in relation to A9, 281% A9 in relation to A7, 82% A7 in relation to A5, 578% A5 in relation to A3, respectively. It was noted that the changes of point positions, due to the creep phenomenon, increased with increasing distance from the fixing for all measurement points. However, the value of this increase was not proportional to the increase in the distance from the fixing.

5. Conclusions

A comparison of the course of a creep process in the control system of a bimorph actuator, in which control voltages were applied to both piezoelectric layers, with the course of the creep process in the control system of an unimorph actuator, in which a control voltage was applied to only one piezoelectric layer, was the subject of this article.
Based on the results of laboratory experiments, it was noted that the duration of a transient part is approximately the same in a system with control voltage applied to one MFC patch and in a system with control voltages applied to two MFC patches.
In the system with control voltages applied to two MFC patches, the position change due to the creep process is more than twice as large in comparison to the system with a control voltage applied to one MFC patch. Hence, it can be concluded that the change of position caused by creep in a system with two control inputs is not the sum of changes in positions in two control systems, each of which having one control input. Based on this, it can be supposed that the creep compensation methods used in the actuator control system with one piezoelectric layer should be modified if they are to be used on the actuator control system with two piezoelectric layers.
Based on the results of laboratory tests, it was noted the changes of point positions, due to the creep phenomenon, increase with increasing distance from the fixing for all measurement points. However, the value of this increase is not proportional to the increase in the distance from the fixing.

Author Contributions

Conceptualization, D.G.; methodology, D.G. and A.S.; investigation, D.G. and A.S.; writing—original draft preparation, D.G.; writing—review and editing, D.G.; supervision, D.G. All authors have read and agreed to the published version of the manuscript.

Funding

This research was funded by the AGH University of Science and Technology within the scope of the research program No. 16.16.130.942 and Initiative for Excellence—Research University at AGH UST.

Data Availability Statement

Data is contained within the article.

Conflicts of Interest

The authors declare no conflict of interest.

References

  1. Mohith, S.; Upadhya, A.R.; Karanth, N.; Kulkarni, S.M.; Rao, M. Recent trends in piezoelectric actuators for precision motion and their applications: A review. Smart Mater. Struct. 2020, 30, 013002. [Google Scholar] [CrossRef]
  2. Yang, C.; Youcef-Toumi, K. Principle, implementation, and applications of charge control for piezo-actuated nanopositioners: A comprehensive review. Mech. Syst. Signal Process. 2022, 171, 108885. [Google Scholar] [CrossRef]
  3. Giri, A.M.; Ali, S.F.; Arockiarajan, A. Piezoelectric unimorph and bimorph cantilever configurations: Design guidelines and strain assessment. Smart Mater. Struct. 2022, 31, 035003. [Google Scholar] [CrossRef]
  4. Ramegowda, P.C.; Ishihara, D.; Takata, R.; Niho, T.; Horie, T. Finite element analysis of a thin piezoelectric bimorph with a metal shim using solid direct-piezoelectric and shell inverse-piezoelectric coupling with pseudo direct-piezoelectric evaluation. Compos. Struct. 2020, 245, 112284. [Google Scholar] [CrossRef]
  5. El-Sayed, A.M.; Abo-Ismail, A.; El-Melegy, M.T.; Hamzaid, N.A.; Abu Osman, N.A. Development of a micro-gripper using piezoelectric bimorphs. Sensors 2013, 13, 5826–5840. [Google Scholar] [CrossRef] [Green Version]
  6. Tan, D.; Yavarow, P.; Erturk, A. Nonlinear elastodynamics of piezoelectric macro-fiber composites with interdigitated electrodes for resonant actuation. Compos. Struct. 2018, 187, 137–143. [Google Scholar] [CrossRef]
  7. Chilibon, I.; Dias, C.; Inacio, P.; Marat-Mendes, J. PZT and PVDF bimorph actuators. J. Optoelectron. Adv. Mater. 2007, 9, 1939–1943. [Google Scholar]
  8. Donoso, A.; Sigmund, O. Optimization of piezoelectric bimorph actuators with active damping for static and dynamic loads. Struct. Multidiscip. Optim. 2009, 38, 171–183. [Google Scholar] [CrossRef] [Green Version]
  9. Hu, K.M.; Li, H.; Wen, L.H. Experimental study of axial-compressed macro-fiber composite bimorph with multi-layer parallel actuators for large deformation actuation. J. Intell. Mater. Syst. Struct. 2020, 31, 1101–1110. [Google Scholar] [CrossRef]
  10. Chattaraj, N.; Ganguli, R. Performance improvement of a piezoelectric bimorph actuator by tailoring geometry. Mech. Adv. Mater. Struct. 2018, 25, 829–835. [Google Scholar] [CrossRef]
  11. Low, T.S.; Guo, W. Modeling of a three-layer piezoelectric bimorph beam with hysteresis. J. Microelectromech. Syst. 1995, 4, 230–237. [Google Scholar] [CrossRef]
  12. Zhang, J.; Yang, Y.; Lou, J.; Wei, Y.; Fu, L. Development and hybrid position/force control of a dual-drive macro-fiber-composite microgripper. Sensors 2018, 18, 1301. [Google Scholar] [CrossRef] [PubMed] [Green Version]
  13. Karpelson, M.; Wei, G.Y.; Wood, R.J. Driving high voltage piezoelectric actuators in microrobotic applications. Sens. Actuators A Phys. 2012, 176, 78–89. [Google Scholar] [CrossRef]
  14. Jain, R.K.; Majumder, S.; Ghosh, B.; Saha, S. Deflection control for piezoelectric actuator through voltage signal and it’s application in micromanipulation. Mech. Syst. Signal Process. 2015, 62, 305–323. [Google Scholar] [CrossRef]
  15. Rios, S.A.; Fleming, A.J. A new electrical configuration for improving the range of piezoelectric bimorph benders. Sens. Actuators A Phys. 2015, 224, 106–110. [Google Scholar] [CrossRef]
  16. Xu, Z.; Wang, Y.; Chen, C. Micro converter with a high step-up ratio to drive a piezoelectric bimorph actuator applied in mobile robots. Int. J. Adv. Robot. Syst. 2018, 15, 1729881418763458. [Google Scholar] [CrossRef] [Green Version]
  17. Cen, L.; Erturk, A. Bio-inspired aquatic robotics by untethered piezohydroelastic actuation. Bioinspiration Biomim. 2013, 8, 016006. [Google Scholar] [CrossRef] [Green Version]
  18. Grzybek, D. Control System for Multi-Input and Simple-Output Piezoelectric Beam Actuator Based on Macro Fiber Composite. Energies 2022, 15, 2042. [Google Scholar] [CrossRef]
  19. Grzybek, D. LQG Control of the Smart Truss with the Piezoelectric Active Members. In Solid State Phenomena; Kot, A., Ed.; Trans Tech Publications Ltd.: Zurich, Switzerland, 2014; Volume 208, pp. 125–133. [Google Scholar]
  20. Rakotondrabe, M.; Haddab, Y.; Lutz, P. Nonlinear modeling and estimation of force in a piezoelectric cantilever. In Proceedings of the 2007 IEEE/ASME International Conference on Advanced Intelligent Mechatronics, Zurich, Switzerland, 4–7 September 2007; pp. 1–6. [Google Scholar]
  21. Jung, H.; Gweon, D.G. Creep characteristics of piezoelectric actuators. Rev. Sci. Instrum. 2000, 71, 1896–1900. [Google Scholar] [CrossRef] [Green Version]
  22. Changhai, R.; Lining, S. Hysteresis and creep compensation for piezoelectric actuator in open-loop operation. Sens. Actuators A Phys. 2005, 122, 124–130. [Google Scholar] [CrossRef]
  23. Qiu, J.; Tani, J.; Ueno, T.; Morita, T.; Takahashi, H.; Du, H. Fabrication and high durability of functionally graded piezoelectric bending actuators. Smart Mater. Struct. 2003, 12, 115. [Google Scholar] [CrossRef]
  24. Gu, G.Y.; Zhu, L.M.; Su, C.Y.; Ding, H.; Fatikow, S. Modeling and control of piezo-actuated nanopositioning stages: A survey. IEEE Trans. Autom. Sci. Eng. 2014, 13, 313–332. [Google Scholar] [CrossRef]
  25. Yong, Y.K.; Moheimani, S.R.; Kenton, B.J.; Leang, K.K. Invited review article: High-speed flexure-guided nanopositioning: Mechanical design and control issues. Rev. Sci. Instrum. 2012, 83, 121101. [Google Scholar] [CrossRef] [PubMed]
  26. Sabarianand, D.V.; Karthikeyan, P.; Muthuramalingam, T. A review on control strategies for compensation of hysteresis and creep on piezoelectric actuators based micro systems. Mech. Syst. Signal Process. 2020, 140, 106634. [Google Scholar] [CrossRef]
  27. Liu, Y.; Shan, J.; Qi, N. Creep modeling and identification for piezoelectric actuators based on fractional-order system. Mechatronics 2013, 23, 840–847. [Google Scholar] [CrossRef]
  28. Schröck, J.; Meurer, T.; Kugi, A. Control of a flexible beam actuated by macro-fiber composite patches: II. Hysteresis and creep compensation, experimental results. Smart Mater. Struct. 2010, 20, 015016. [Google Scholar] [CrossRef]
  29. Escareno, J.; Abadie, J.; Piat, E.; Rakotondrabe, M. Robust micro-positionnig control of a 2DOF piezocantilever based on an extended-state LKF. Mechatronics 2019, 58, 82–92. [Google Scholar] [CrossRef] [Green Version]
  30. Smart Material—Home of the MFC. Available online: https://www.smart-material.com/MFC-product-mainV2.html (accessed on 25 September 2022).
  31. Zhang, S.Q.; Li, Y.X.; Schmidt, R. Modeling and simulation of macro-fiber composite layered smart structures. Compos. Struct. 2015, 126, 89–100. [Google Scholar] [CrossRef]
  32. TD250 V9 Six Channel +/−250 V Amplifier. Manual and Specifications. Available online: https://www.piezodrive.com/wp-content/uploads/2022/04/TD250-V9-R1.pdf (accessed on 26 September 2022).
  33. RT-DAC/Zynq User’s Manual. Available online: http://www.inteco.com.pl/Docs/Rtdac_Zynq.pdf (accessed on 26 September 2022).
  34. Sioma, A. Geometry and resolution in triangulation vision systems. In Proceedings of the Photonics Applications in Astronomy, Communications, Industry, and High Energy Physics Experiments 2020, Wilga, Poland, 31 August–2 September 2020; Romaniuk, R.S., Linczuk, M., Eds.; SPIE: Bellingham, WA, USA; Volume 11581, pp. 264–271. [Google Scholar]
  35. Romaszko, M.; Sapiński, B.; Sioma, A. Forced vibrations analysis of a cantilever beam using the vision method. J. Theor. Appl. Mech. 2015, 53, 243–254. [Google Scholar] [CrossRef]
  36. Wang, X.; Pommier-Budinger, V.; Reysset, A.; Gourinat, Y. Simultaneous compensation of hysteresis and creep in a single piezoelectric actuator by open-loop control for quasi-static space active optics applications. Control Eng. Pract. 2014, 33, 48–62. [Google Scholar] [CrossRef]
Figure 1. Piezoelectric bimorph actuator: (a) structure: V1—control voltage for MFC patch 1, V2—control voltage for MFC patch 2; (b) fixing in a clamping assembly: a—distance between MFC patches and clamping assembly, b—distance between MFC patches and beam tip, c—distance between clamping assembly and beam tip.
Energies 15 08267 g001
Figure 2. View of displacement of measurement points in a beam structure: d = 30 mm, e = 10 mm, f = 8 mm.
Energies 15 08267 g002
Figure 3. Pixels forming an example of a marker area in a measurement point A12.
Energies 15 08267 g003
Figure 4. Schema of laboratory stand.
Energies 15 08267 g004
Figure 5. View of main parts of laboratory stand: 1—piezoelectric actuator, 2—clamping assembly, 3—diode illuminator, 4—camera.
Energies 15 08267 g005
Figure 6. Courses of control signals in preliminary research: (a) one control sign for u1 = +500 V and u2 = 0 V, (b) for u1 = +500 V and u2 = −500 V.
Energies 15 08267 g006
Figure 7. Courses of set values of control signals in proper research: (a) experiments 1–10, (b) experiments 11–20.
Energies 15 08267 g007
Figure 8. Transient part and the beginning of the creep phenomenon in an actuator step response: (a) for points: A3 and A5; (b) for points: A7 and A9; (c) for points: A11 and A12.
Energies 15 08267 g008
Figure 9. Moving average of an actuator step response: (a) for points: A3, A5 and A7; (b) for points: A9, A11 and A12.
Energies 15 08267 g009
Figure 10. Displacements of measurement point A12 in unimorph and bimorph: (a) for control signals 50 V and 100 V; (b) for control signals 150 V and 200 V; (c) for control signals 250 V, 300 V and 350 V; (d) for control signals 400 V, 450 V and 500 V.
Energies 15 08267 g010
Figure 11. Displacements of measurement points in unimorph and bimorph: (a) A3, A5 and A7; (b) A9, A11 and A12.
Energies 15 08267 g011
Table 1. Dimensions of manufactured cantilever-type bimorph actuator (values in mm).
DimensionValue Value
Length of MFC patch100Width of FR-4 layer20
Length of active area in MFC patch85Thickness of FR-4 layer1
Width of MFC patch20Distance “a”2
Width of active area in MFC patch14Distance “b”20
Thickness of MFC patch0.3Distance “c”122
Table 2. Set values of control signals in laboratory experiments.
Number of Experiment
12345678910
Signal nameSymbolUnitSet values in experiment
Control voltage of MFC 1V1V+500+450+400+350+300+250+200+150+100+50
Control voltage of MFC 2V2V0000000000
Number of experiment
11121314151617181920
Signal nameSymbolUnitSet values in experiment
Control voltage of MFC 1V1V+500+450+400+350+300+250+200+150+100+50
Control voltage of MFC 2V2V–500–450–400–350–300–250–200–150–100–50
Table 3. Position changes of measurement points in laboratory experiments.
Number of Experiment
1 2 3 4 5 6 7 8 9 10
Measurement point Position change caused by a creep phenomenon (µm)
A3 18 – 17 23 – 1 5 3 – 23 2 1 – 6
A5 – 22 1 – 9 – 15 – 10 – 6 – 12 – 10 2 1
A7 – 37 1 – 24 – 18 30 28 – 6 41 6 2
A9 – 52 – 30 – 52 – 14 – 33 – 33 – 7 13 20 22
A11 – 97 – 100 – 89 – 80 – 64 – 33 – 11 – 11 – 16 – 7
A12 – 111 – 95 – 87 – 75 – 66 – 52 – 41 – 40 – 23 – 5
Number of experiment
11 12 13 14 15 16 17 18 19 20
Measurement point Position change caused by a creep phenomenon (µm)
A3 10 10 – 1 – 13 2 – 2 – 7 1 3 – 1
A5 – 41 – 34 – 39 – 12 15 – 16 – 2 – 5 – 1 – 6
A7 – 41 – 6 – 82 – 53 – 49 – 17 12 – 5 – 14 6
A9 – 156 – 120 – 96 – 82 – 59 – 47 – 36 – 25 13 21
A11 – 251 – 204 – 166 – 131 – 89 – 105 – 46 – 55 – 63 – 24
A12 – 304 – 219 – 183 – 167 – 139 – 109 – 77 – 57 – 42 – 35
Table 4. Comparison of a percentage ratio of point displacements in the bimorph and in the unimorph.
Value of Control Voltage u in an Unimorph (V)
+500 +450 +400 +350 +300 +250 +200 +150 +100 +50
Value of Control Voltage u1 in Bimorph (V)
+500 +450 +400 +350 +300 +250 +200 +150 +100 +50
Value of Control Voltage u2 in Bimorph (V)
–500 –450 –400 –350 –300 –250 –200 –150 –100 –50
Measurement Point Point Displacement in a Bimorph/Point Displacement in an Unimorph (%)
A3 144 – 258 204 1300 160 266 – 169 150 – 300 – 183
A5 186 3600 433 – 125 – 350 267 – 600 -200 250 800
A7 111 800 342 294 363 261 – 400 212 433 – 300
A9 300 400 185 586 179 142 514 392 135 105
A11 259 204 187 164 139 318 418 500 394 343
A12 274 231 210 223 211 210 188 143 183 700
Publisher’s Note: MDPI stays neutral with regard to jurisdictional claims in published maps and institutional affiliations.

