Article

Identifying the Photometric Characteristics and Applicability of Hybrid Solar Lighting

1
Department of Architectural Engineering, Jeju National University, Jeju 63243, Korea
2
Department of Electrical and Energy Engineering, Jeju National University, Jeju 63243, Korea
3
School of Architecture and Building Science, Chung-Ang University, Seoul 06974, Korea
4
Sustainable Technology and Wellness R&D Group, Jeju Division, Korea Institute of Industrial Technology, Jeju 63243, Korea
*
Author to whom correspondence should be addressed.
Energies 2022, 15(22), 8356; https://doi.org/10.3390/en15228356
Submission received: 30 September 2022 / Revised: 28 October 2022 / Accepted: 2 November 2022 / Published: 9 November 2022

Abstract

:
The present research aims at promoting the stability and applicability of a hybrid daylighting system combining daylight and artificial light, which eventually enables a constant and pleasant luminous flux of the mixed light delivered by a terminal device installed indoors. That is, the present system allows a constant amount of luminous flux through its terminal device similar to an electric lamp, demonstrating its energy efficiency as well as comfortableness. The system effectively combines two different types of light, as solar rays are collected by a solar tracking sun light collector. The mixed light is transmitted indoors by optical fiber cables all the way to terminal devices installed indoors and discharged as needed. This feature enables the utilization of daylight to its full capacity, promoting solar availability. In this study, the photometry of hybrid lighting was experimentally measured and analyzed by using a spectrometer for different portions of sunlight when maintaining a constant luminous flux of mixed light. The effectiveness of hybrid lighting was explored for a number of cases in actual conditions, and the system was capable of delivering a constant illuminance of 1200 lux on a plane located 1.1 m away from the terminal device (light emitter). Finally, the system was installed in a test cell to verify its effectiveness for indoor illumination.

1. Introduction

Daylighting is the direct or indirect use of sunlight for indoor illumination. This can result in a two-fold effect in the form of energy efficiency in buildings while also improving human health and the productivity of office workers [1,2]. Sunlight is mandatory for maintaining good health and a good circadian rhythm [3], while its deficiency can lead to various health issues on the physical and physiological levels [
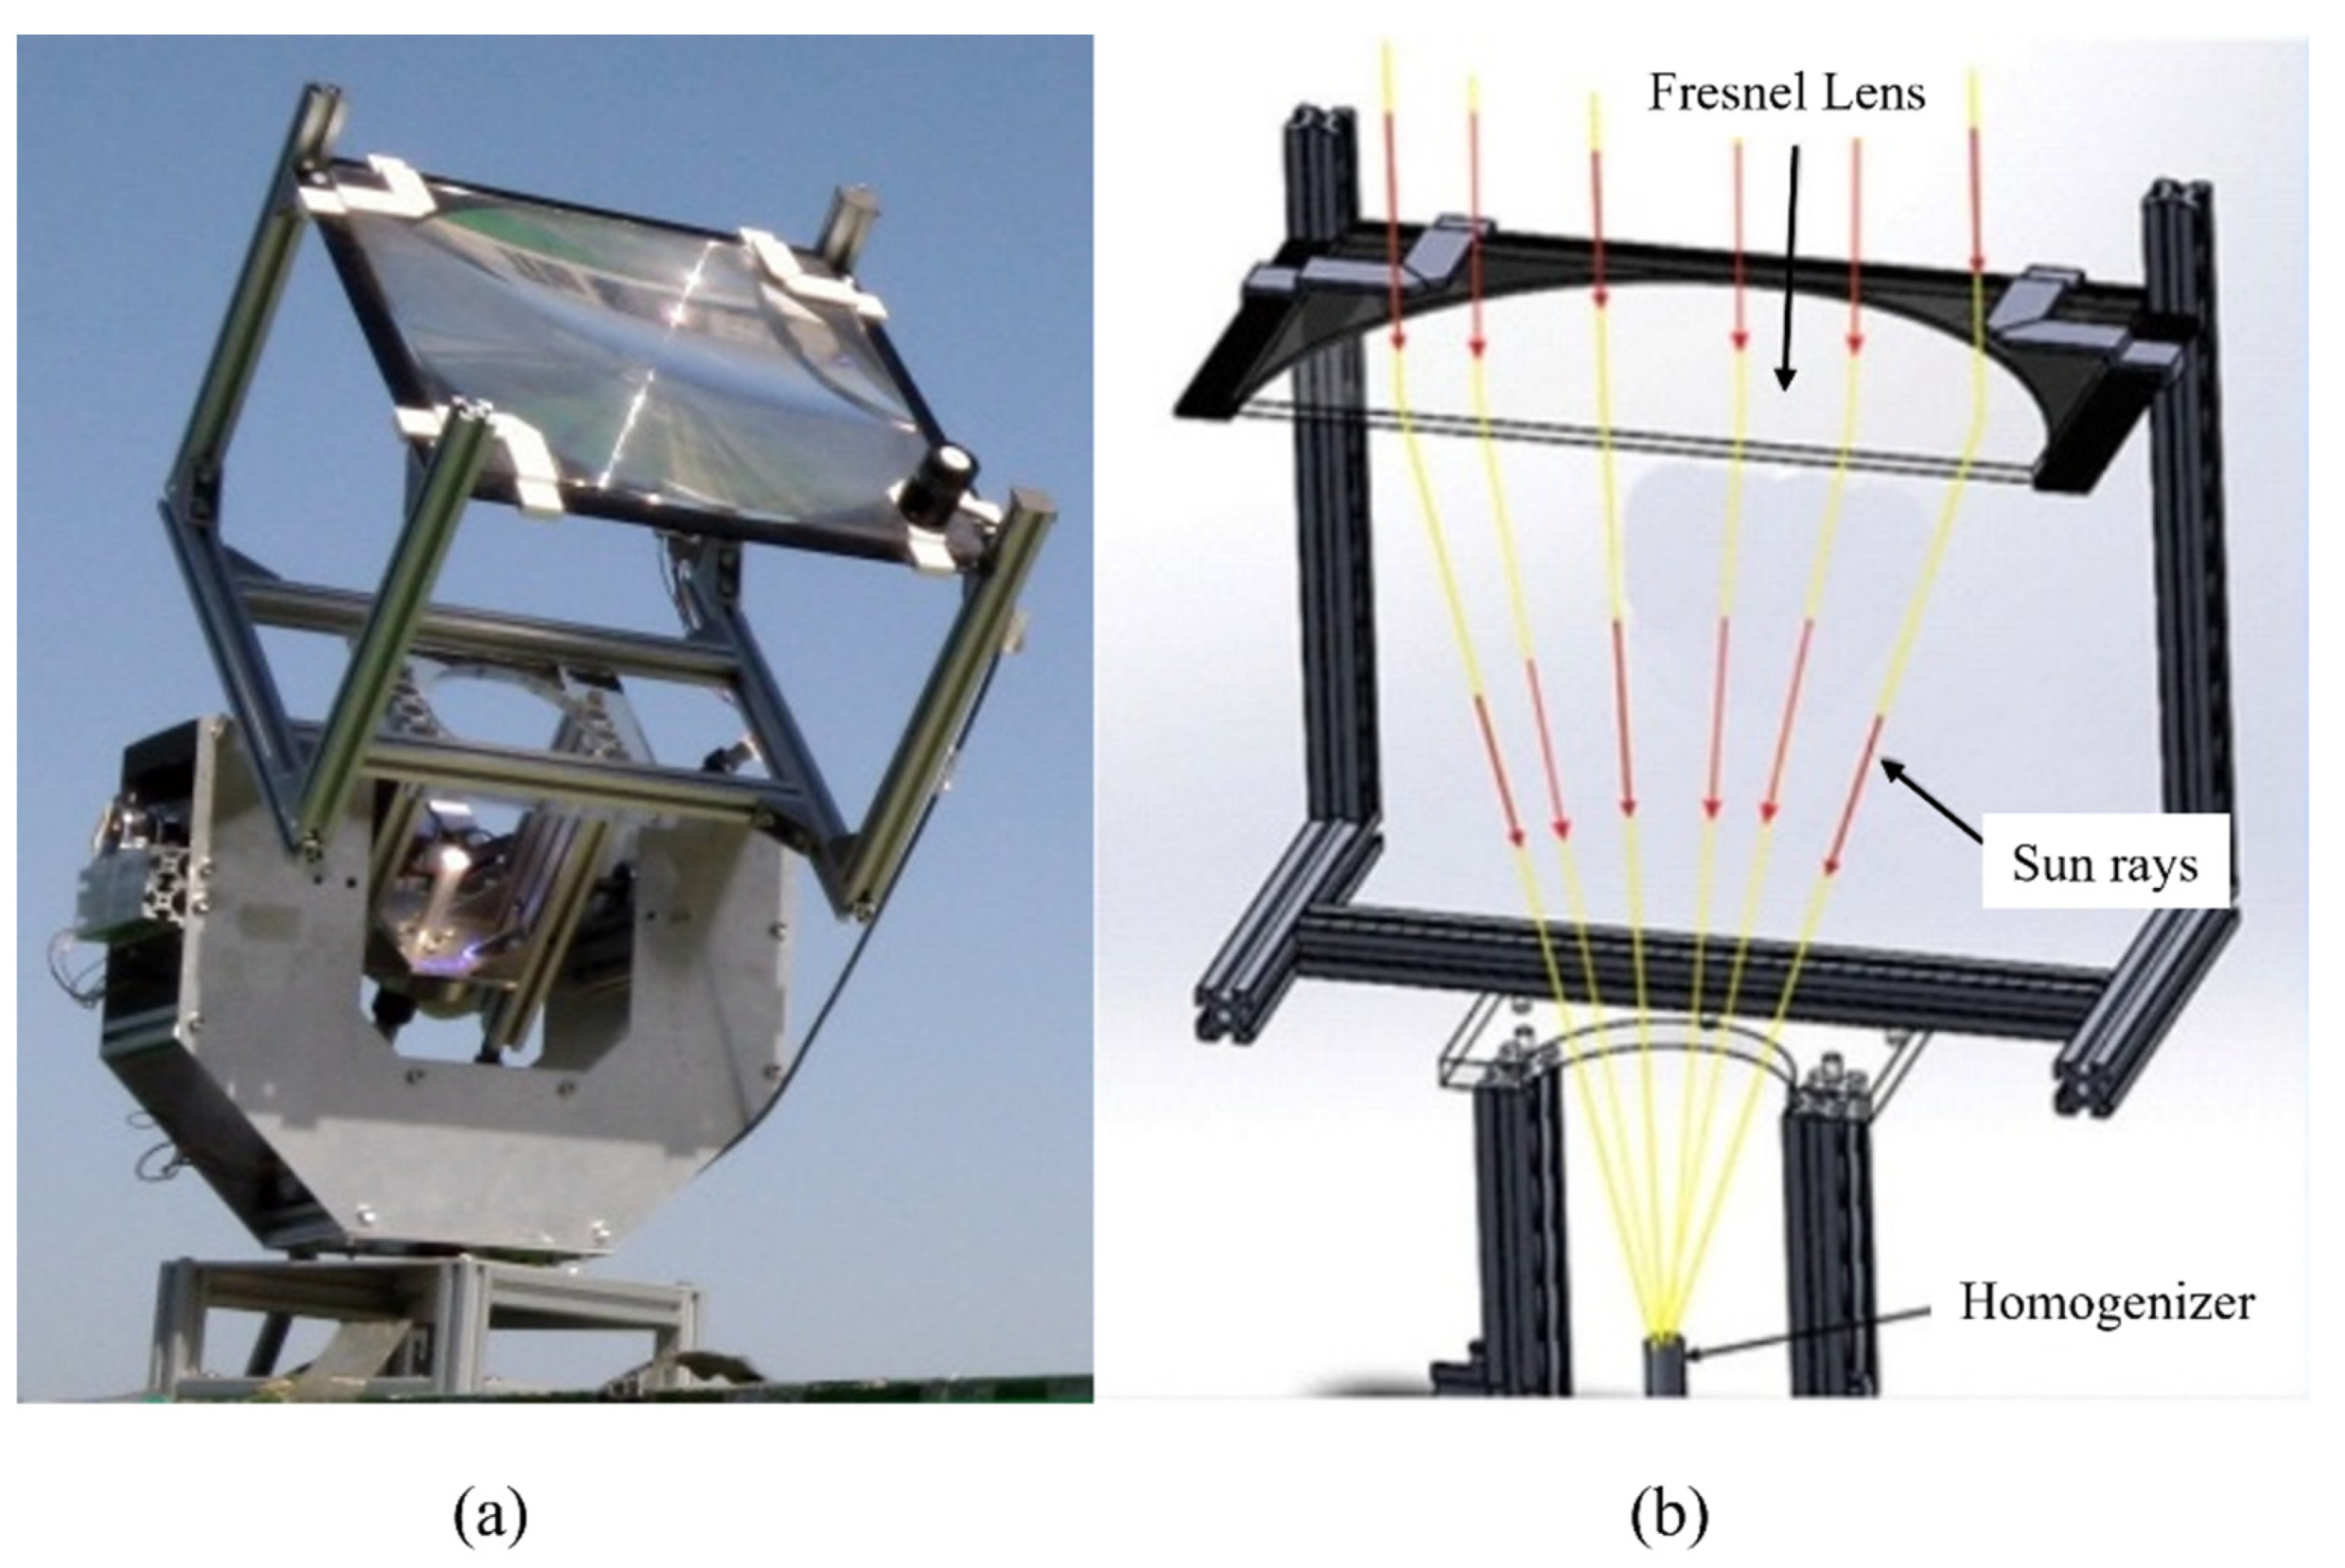
4]. During the past decade, the research on active daylighting with the use of solar concentrators has gained special attention. Ullah et al. experimented with a Fresnel lens-based daylighting system with a focus on providing uniform illumination [5]. The design used binary optical elements where a secondary optical element in the form of a homogenizer helped to increase the uniformity of the output light. The design was able to achieve 10% higher transmission efficiency when compared to the conventional concentrators. Han et al. experimented with a two-axis Fresnel lens-based solar tracker to provide illumination to an office space [6]. This daylighting system was capable of tracking the sun throughout the day to provide a constant level of illumination. In case of the sunlight deficiency, the system could provide additional illuminance through an auxiliary lighting source. A detailed study was carried out to improve the effectiveness of tracking system using CdS sensors and hybrid control strategies [7,8]. The modified system is able to accurately track the sun, even in cloudy weather. Vu et al. studied a fiberless design for illumination in multistory buildings [9]. The authors compared the effectiveness of a fiber optic solar tracker with a wave guide concentrator, where the latter showed a 15% higher optical efficiency. Using the recommended tracker can result in 46.5% energy savings in the sunny climate of Vietnam. Yang et al. experimented with a very large aperture Fresnel lens to provide high flux daylighting. The Fresnel lens had a diameter of 1 m with a concentration ratio of 1500 suns, and it transmitted the sunlight using PMMA fibers. To avoid overheating, flux homogenization and an infrared light filter were used. Using this configuration, the system was able to provide an illumination of 180 lx over an area of 36 m2 [10]. He et al. experimented with a trackerless fiber optic daylighting system. The concentrator in this study behaved as a spherical flower and transferred the same amount of sunlight, irrespective of the incident angle of the solar rays. A typical daylighting system made from these concentrators has multiple rows of single concentrators arranged in an arc. The output of this system is mainly dependent on the solar irradiance. With the total receiving area of 1.69 × 10⁻² m2 and at a solar irradiance of 800 W/m2, the system was able to produce an output of 300 lx at a distance of 0.4 m from the emitter [11].
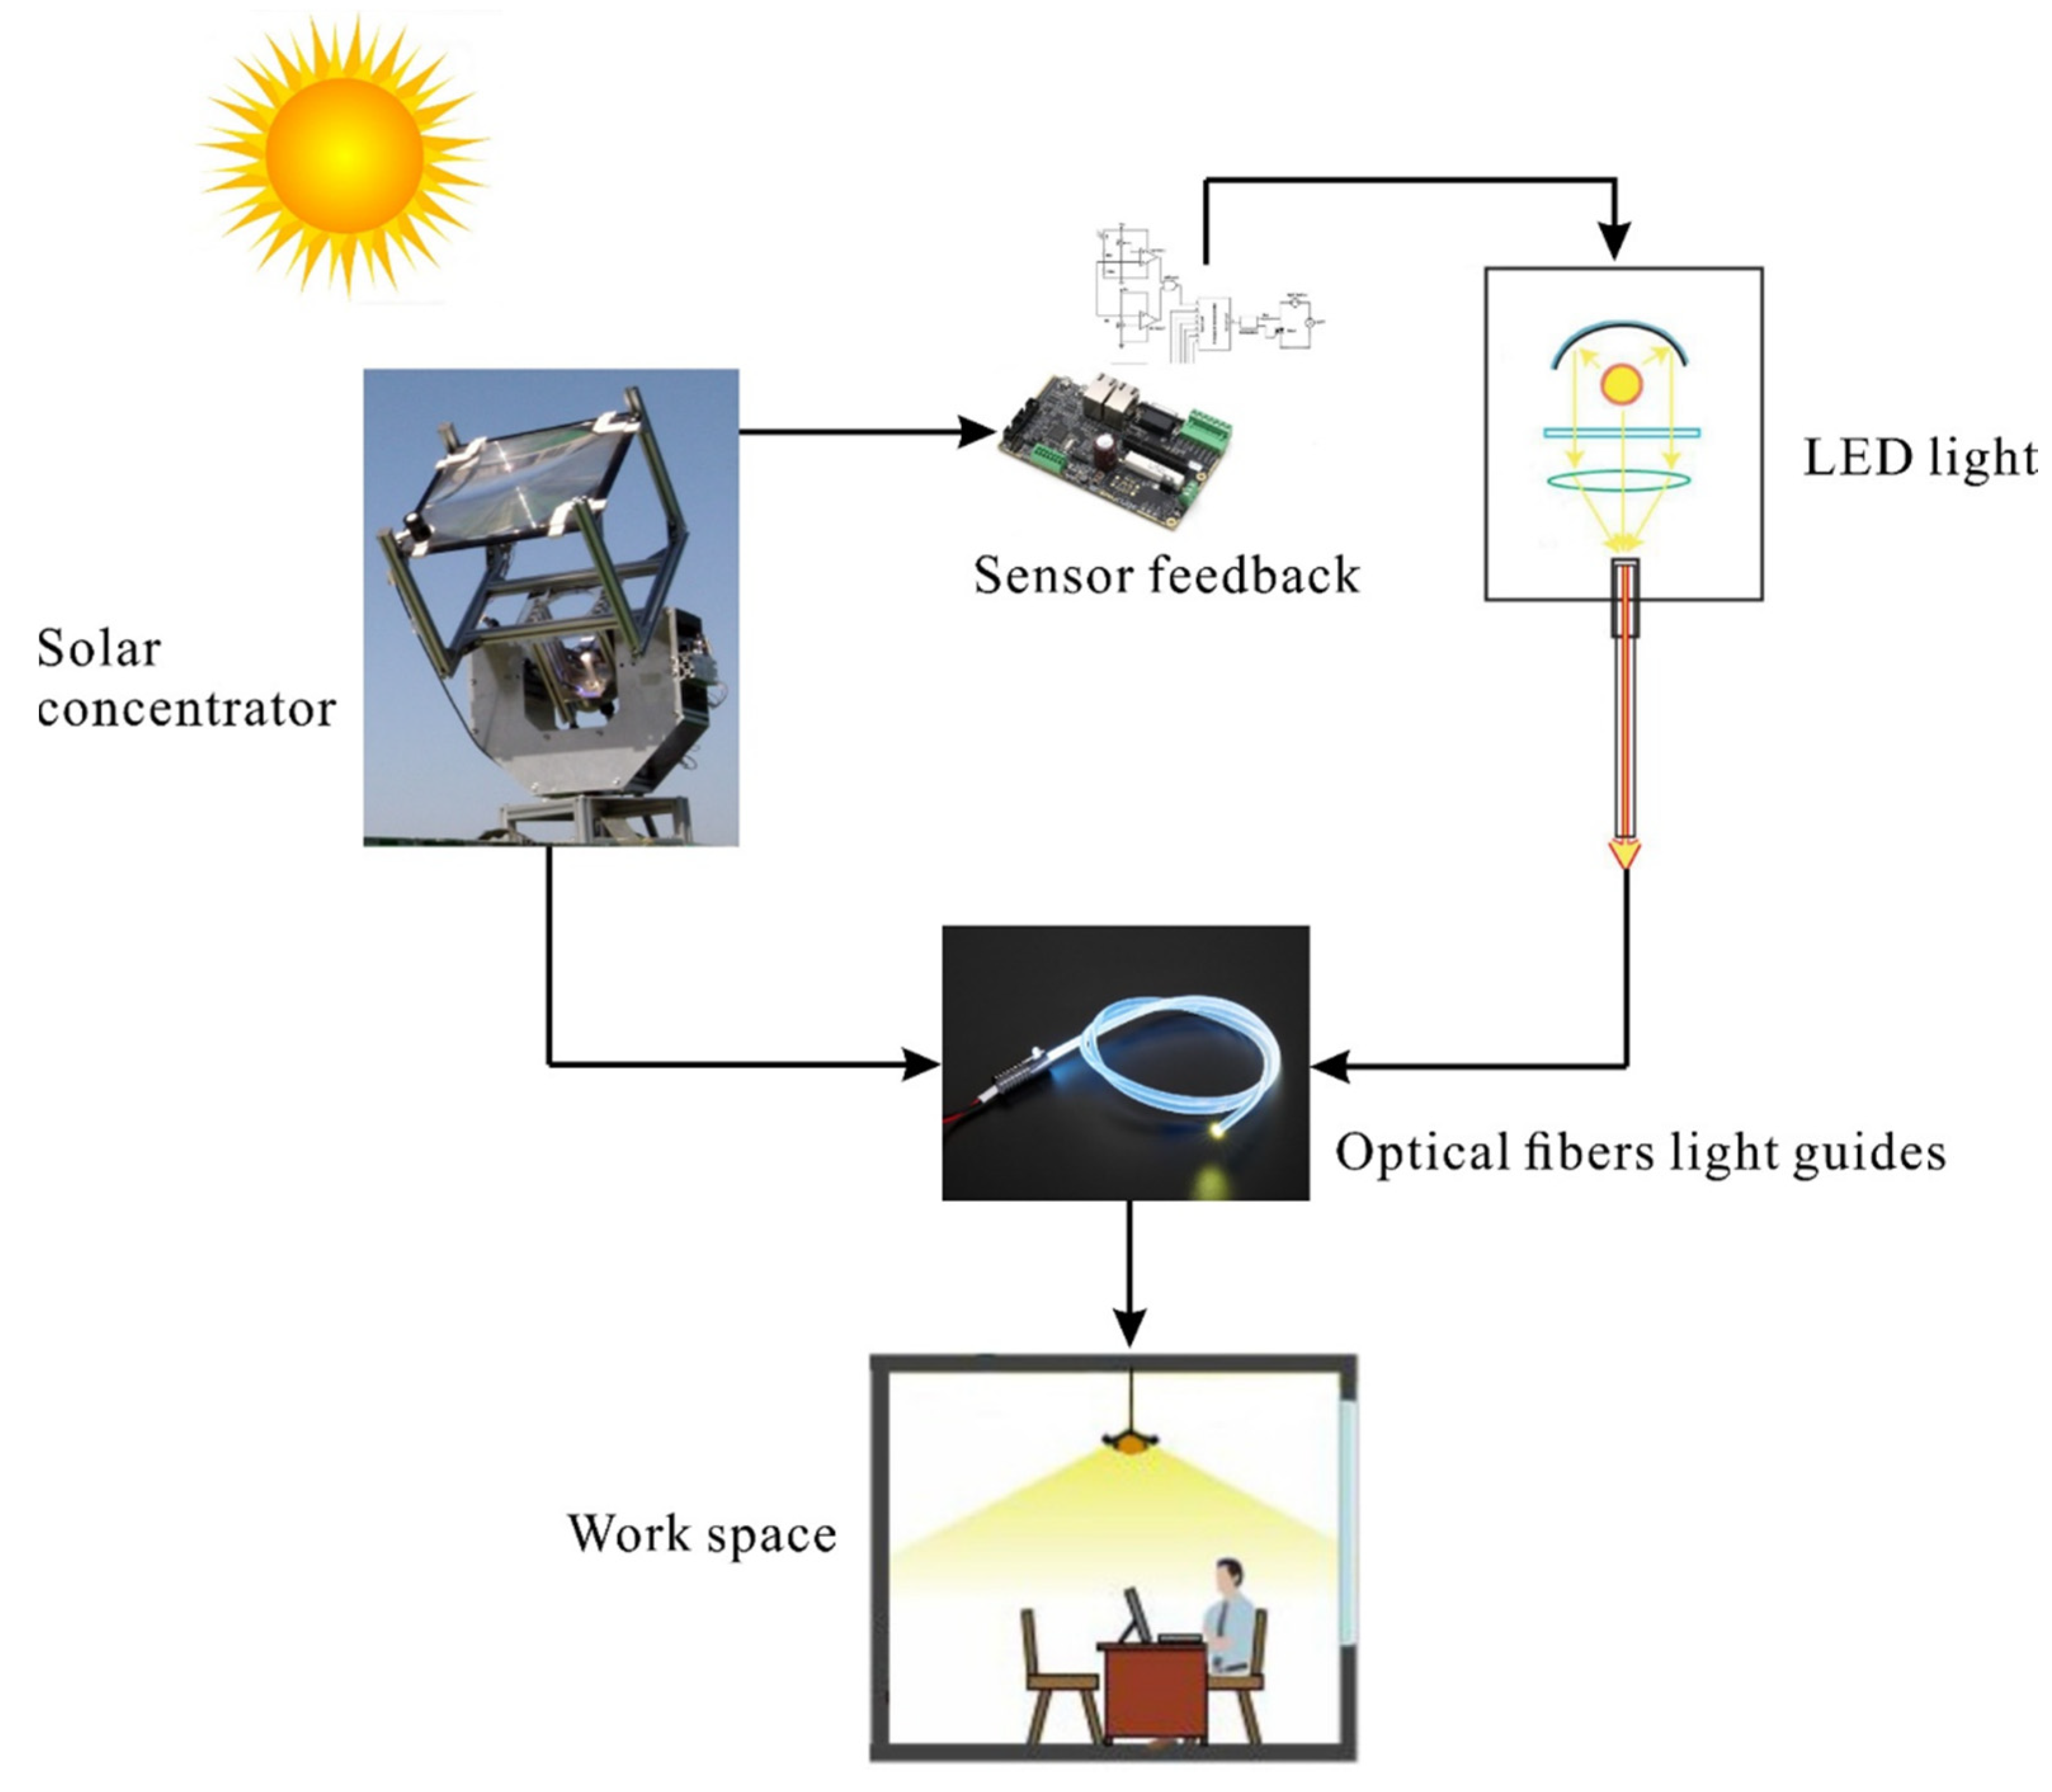
The light delivered from daylighting systems does not provide constant photometric properties such as luminance and color temperature, since it is largely affected by solar and sky conditions. On the other hand, the proposed system in this study aims to achieve a constant level of illumination on the task plane surface throughout the day. The sunlight may not be adequate during the early and late portions of the day. To complement the system in this scenario, additional light is provided by coupling a LED light source with the solar tracker. The addition of light is based on the response from the lighting control. The LED light has the color temperature of 5000 K, which is close to the color temperature of daylight on a sunny day. In this manner, the light delivered by the system shows almost the same photometric characteristics as compared to daylight. Figure 1 gives the schematics of the hybrid lighting system.
The photometric characteristics of daylighting systems are of importance in determining both the quality and quantity of daylighting in the interior of a building. Furthermore, knowing the detailed photometric properties of daylighting systems leads to energy savings from artificial lighting through effective control systems. Thus far, few studies have been conducted on the photometric characteristics of a hybrid solar lighting system that integrate artificial light with sunlight. In this study, therefore, a series of measurement and ray-tracing simulations was conducted in order to investigate the photometric characteristics of the proposed hybrid solar lighting system.

2. System Components

The proposed lighting system consists of four major components: (1) solar trackers, (2) fiber optic light guides, (3) feedback and lighting control and (4) light source.

2.1. Solar Trackers

A two-axis solar tracking system was employed to track the sun precisely. Figure 2 shows a two-axis solar tracker with a Fresnel lens mounted on it, as well as a way of capturing solar rays. A hybrid control method that combines an open-loop method and a closed-loop method was used in order to improve the tracking accuracy. Initially, the solar tracker operates in the open-loop mode where the microcontroller calculates the sun’s position and creates the trajectory for the motors to follow, and then, it sends the commands to two motor drives. The motor drive, in turn, generates an electric current required to drive a step motor. The step motor generates a torque to move the mechanical components such as gears and shafts. Once the solar tracker is positioned towards the sun, the fine control operation is carried out based on a closed-loop mode, where an optical feedback device detects the exact solar position. A heat pipe-based heat exchanger was installed on the surfaces of the two-step motors in the lower compartment to remove the heat generated by the motors, which is essential for the energy savings and tracking efficiency of the solar tracker. The specifications of the Fresnel lens used for collecting the sun rays are shown in Table 1.

2.2. Optical Fiber Light Guides

To mix light emitted from different sources, various methods can be used. Light can be effectively mixed within optical fibers with the help of a light mixing device, which design and fabrication can take different forms, depending on the materials used and the functional requirements. Different types of fiber couplers can be used in optical fiber systems to split or mix beams of light as needed. A device can be made simply by applying the method of fusion splicing of fibers to have multiple output ports, which, in reverse, can be used as a dual branch light guide to mix light from multiple light sources. That is, a dual branch light guide enables the mixing and transmitting of light in the same medium before it reaches the luminaire for indoor illumination. Figure 3 shows the different types of light guides used in this work.

2.2.1. Lighting Control

The sunlight is mixed with the artificial light inside the light coupler at a certain mixing ratio that is computed by comparing the measured outdoor illuminance with the standard curve (SC). A number of measurements were carried out to create the SC under clear sky conditions. If the feedback system gives a signal indicating the insufficiency of the measured illuminance compared with the target illuminance (indoor), artificial light (from an AC lamp) is added with the help of a light coupler to compensate for the deficit. That is, SC correlates the outdoor illuminance with the target value on a task plane located indoors. The correlation was based on the illuminance level on the task plane directly below the luminaire and on the plane perpendicular to the sun. The mixing of artificial light with sunlight was controlled in seven steps that were created for the outside illuminance range of 68,000–98,000 lx. Changes in the illuminance of 75 and 675 lux were observed when an additional increment of 100 lx was supplied by the LED source. This was demonstrated during the test cell experimentation when the distance between the diffuser and the task plane was 1.1 m.

2.2.2. Light Source

In this experiment, illuminators that can be easily coupled with a fiber optic lighting system were used. As shown in the Table 2, the two light sources used in the experimentation were: (1) a LED fiber optic illuminator with a color temperature of 5000 K and (2) a halogen lamp fiber optic illuminator. The selection of an illuminator is based on its ability to maintain a constant quality of light, and this is described in detail in a later section of the paper.

3. Light Spectrum/Selection of Light Sources

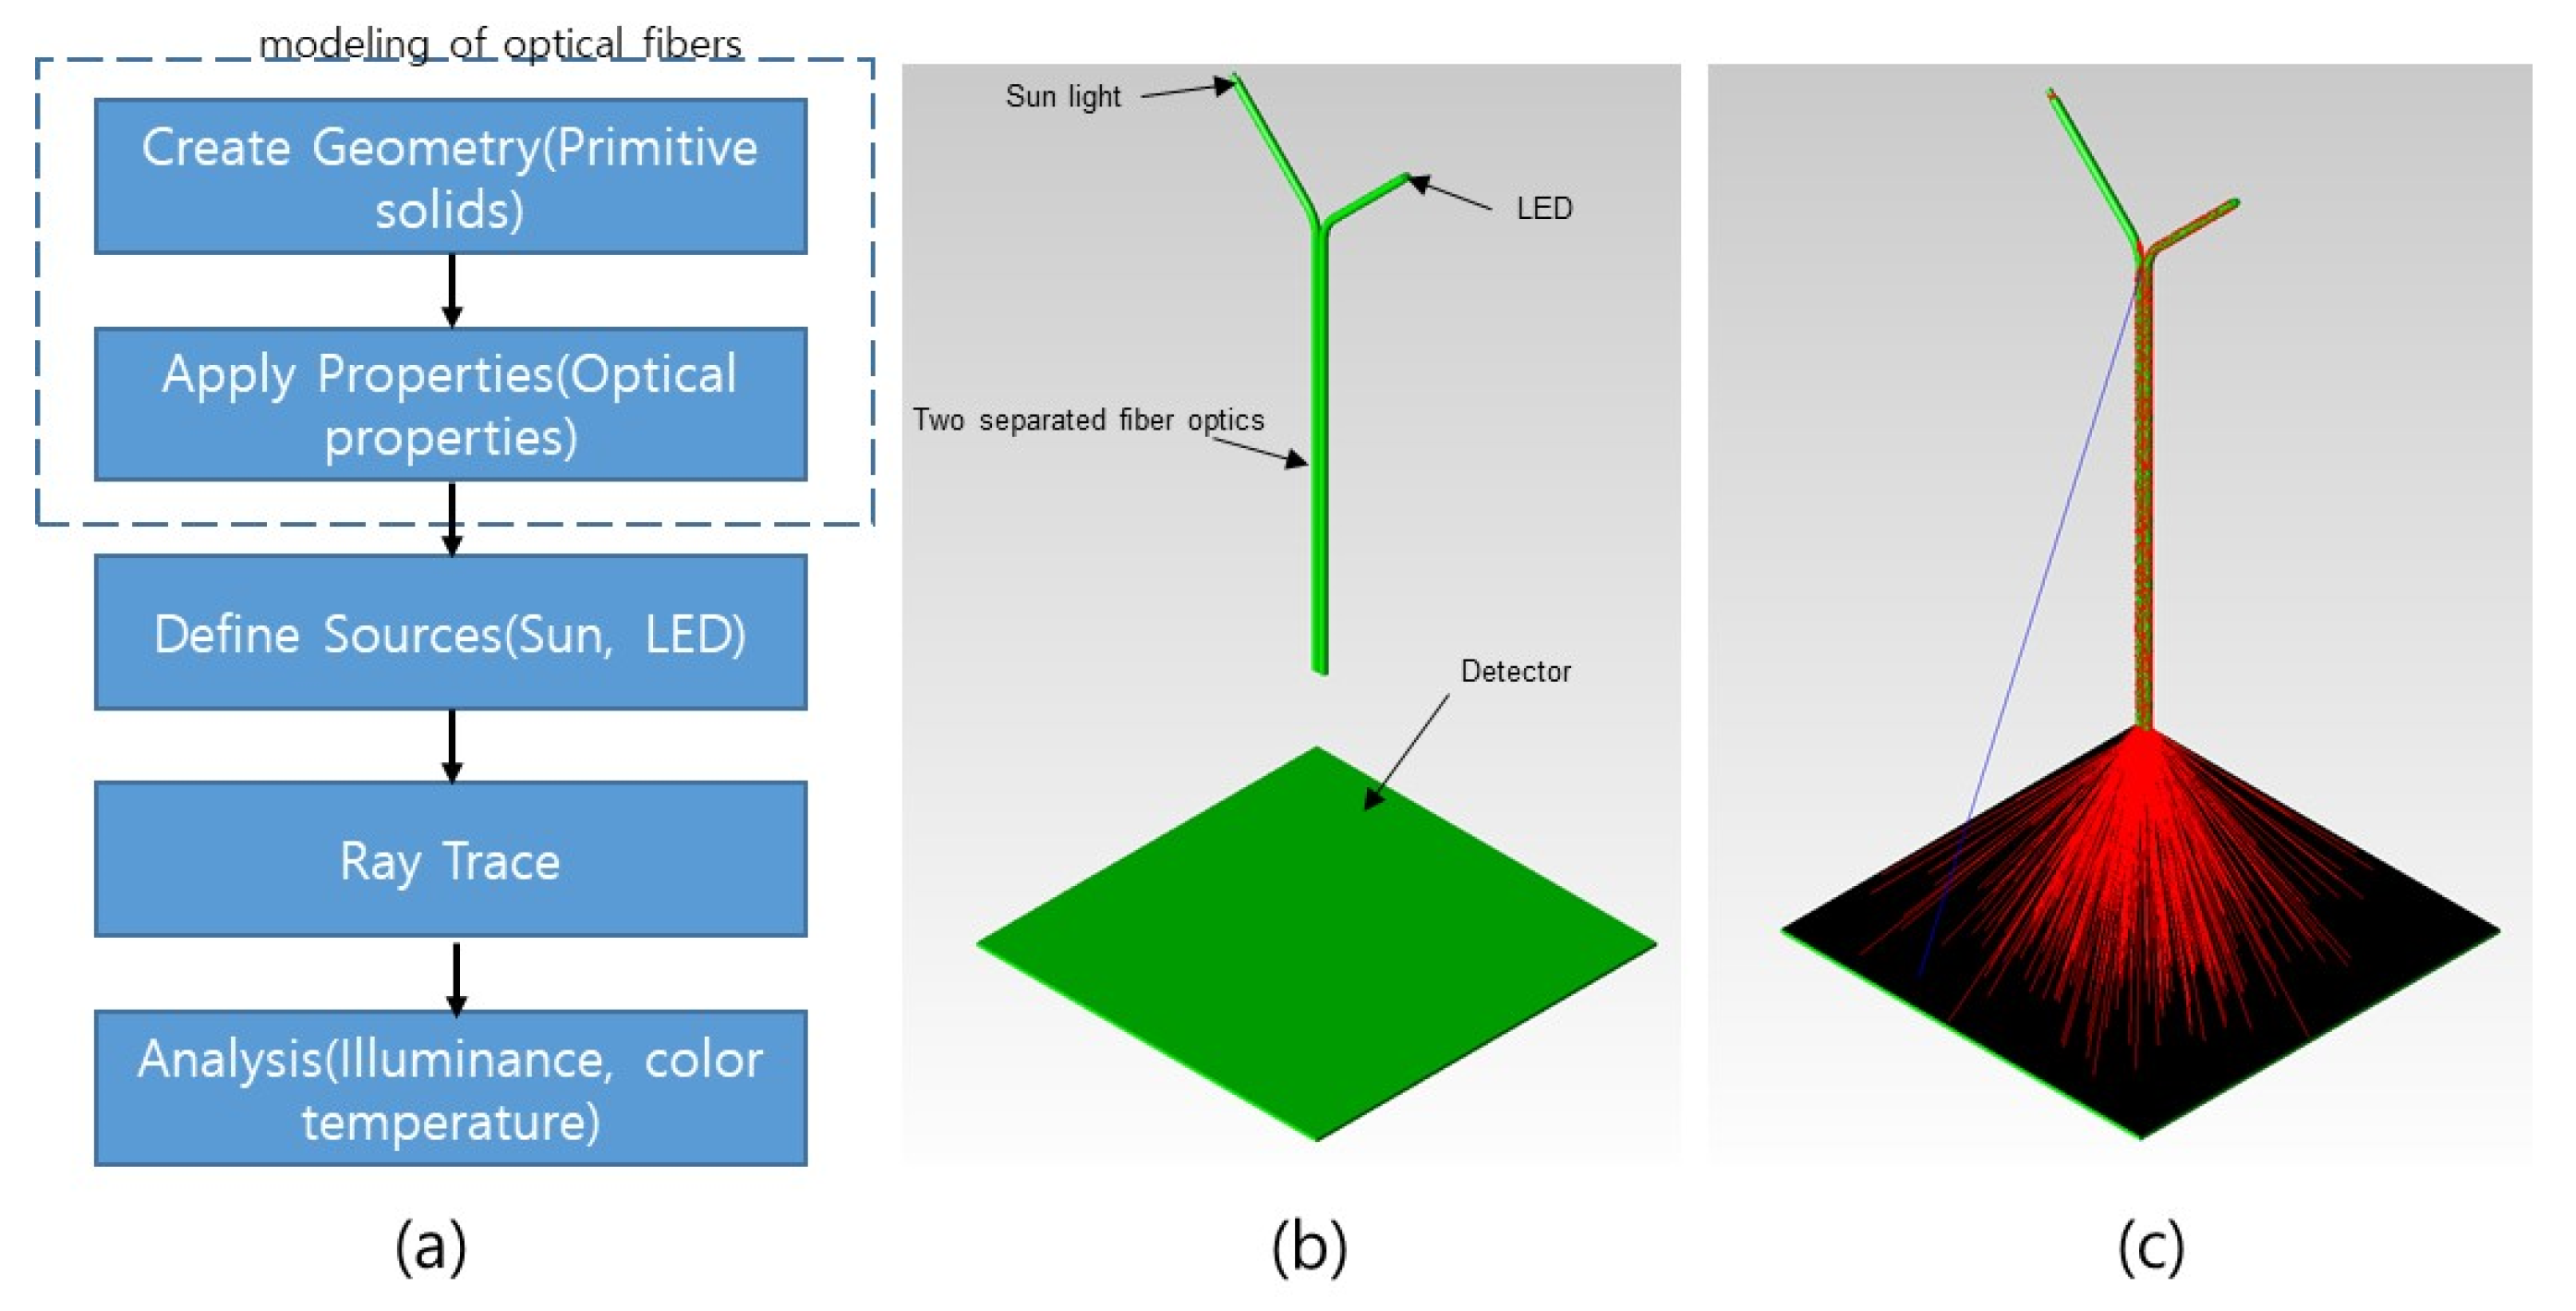
The lighting system should be able to maintain a constant quality of light, i.e., a fixed color temperature, irrespective of the portion of light from sunlight or electric light. For this reason, the electric light should have a color temperature closer to daylight. In this section, two different compositions of a hybrid light are presented to demonstrate the importance of the color temperature for each light source in maintaining its quality of output light. An ILT-350 illuminance spectrophotometer was used to record the values in this experiment, which is designed for portability, quality and ease of use. In this experiment, the readings were taken during a clear sunny day with the color temperature of sunlight very close to 5000 K. To accurately predict the nature of light after mixing two different sources, i.e., sunlight and LED light, a ray-tracing simulation was carried out using TracePro software. TracePro is a ray-tracing simulation tool for designing and analyzing optical and illumination systems, which was developed by Lambda Research Corporation in Littleton.
Figure 4a shows the procedure of the ray-tracing simulation of the optical fiber light guides. At first, the model of the optic fiber light guides was created in TracePro, as illustrated in Figure 4b. To gain accurate results, the light guides are modeled in the same way as the ones used in the experiment. It has two inlets, one for sunlight and the other for LED light. The light enters through these light guides and exits through a common outlet. Finally, it is absorbed by a surface from which the required values of the color temperature are recorded. After modeling the optical fiber light guides, the optical properties were applied to the model. B270 with a reflex index of 1.52 from SCHOTT was employed, because its properties are the same as those of the optical fibers that were measured during the experiment. After that, two different light sources were defined in the simulation, namely LED and Sun. A range of wavelengths spanning from 0.38 μm to 0.78 μm with a total ray of 70,000 was defined to create a real sunlight source. In the case of the LED source, the light source file was obtained from the catalog of OSRAM, and it had a total number of rays of 1000. The wavelength spanned from 0.38 μm to 0.7 μm. The detector that was located below the bottom of the optical fibers was set as a perfect absorber in order to collect all the rays exiting the fibers without any loss. The ray tracing was then performed in the analysis mode, in which all of the ray data that were generated during the ray tracing was saved. This allowed to view the irradiance on any surface in the model after the ray trace was completed. Figure 4c shows the ray-tracing simulation results.
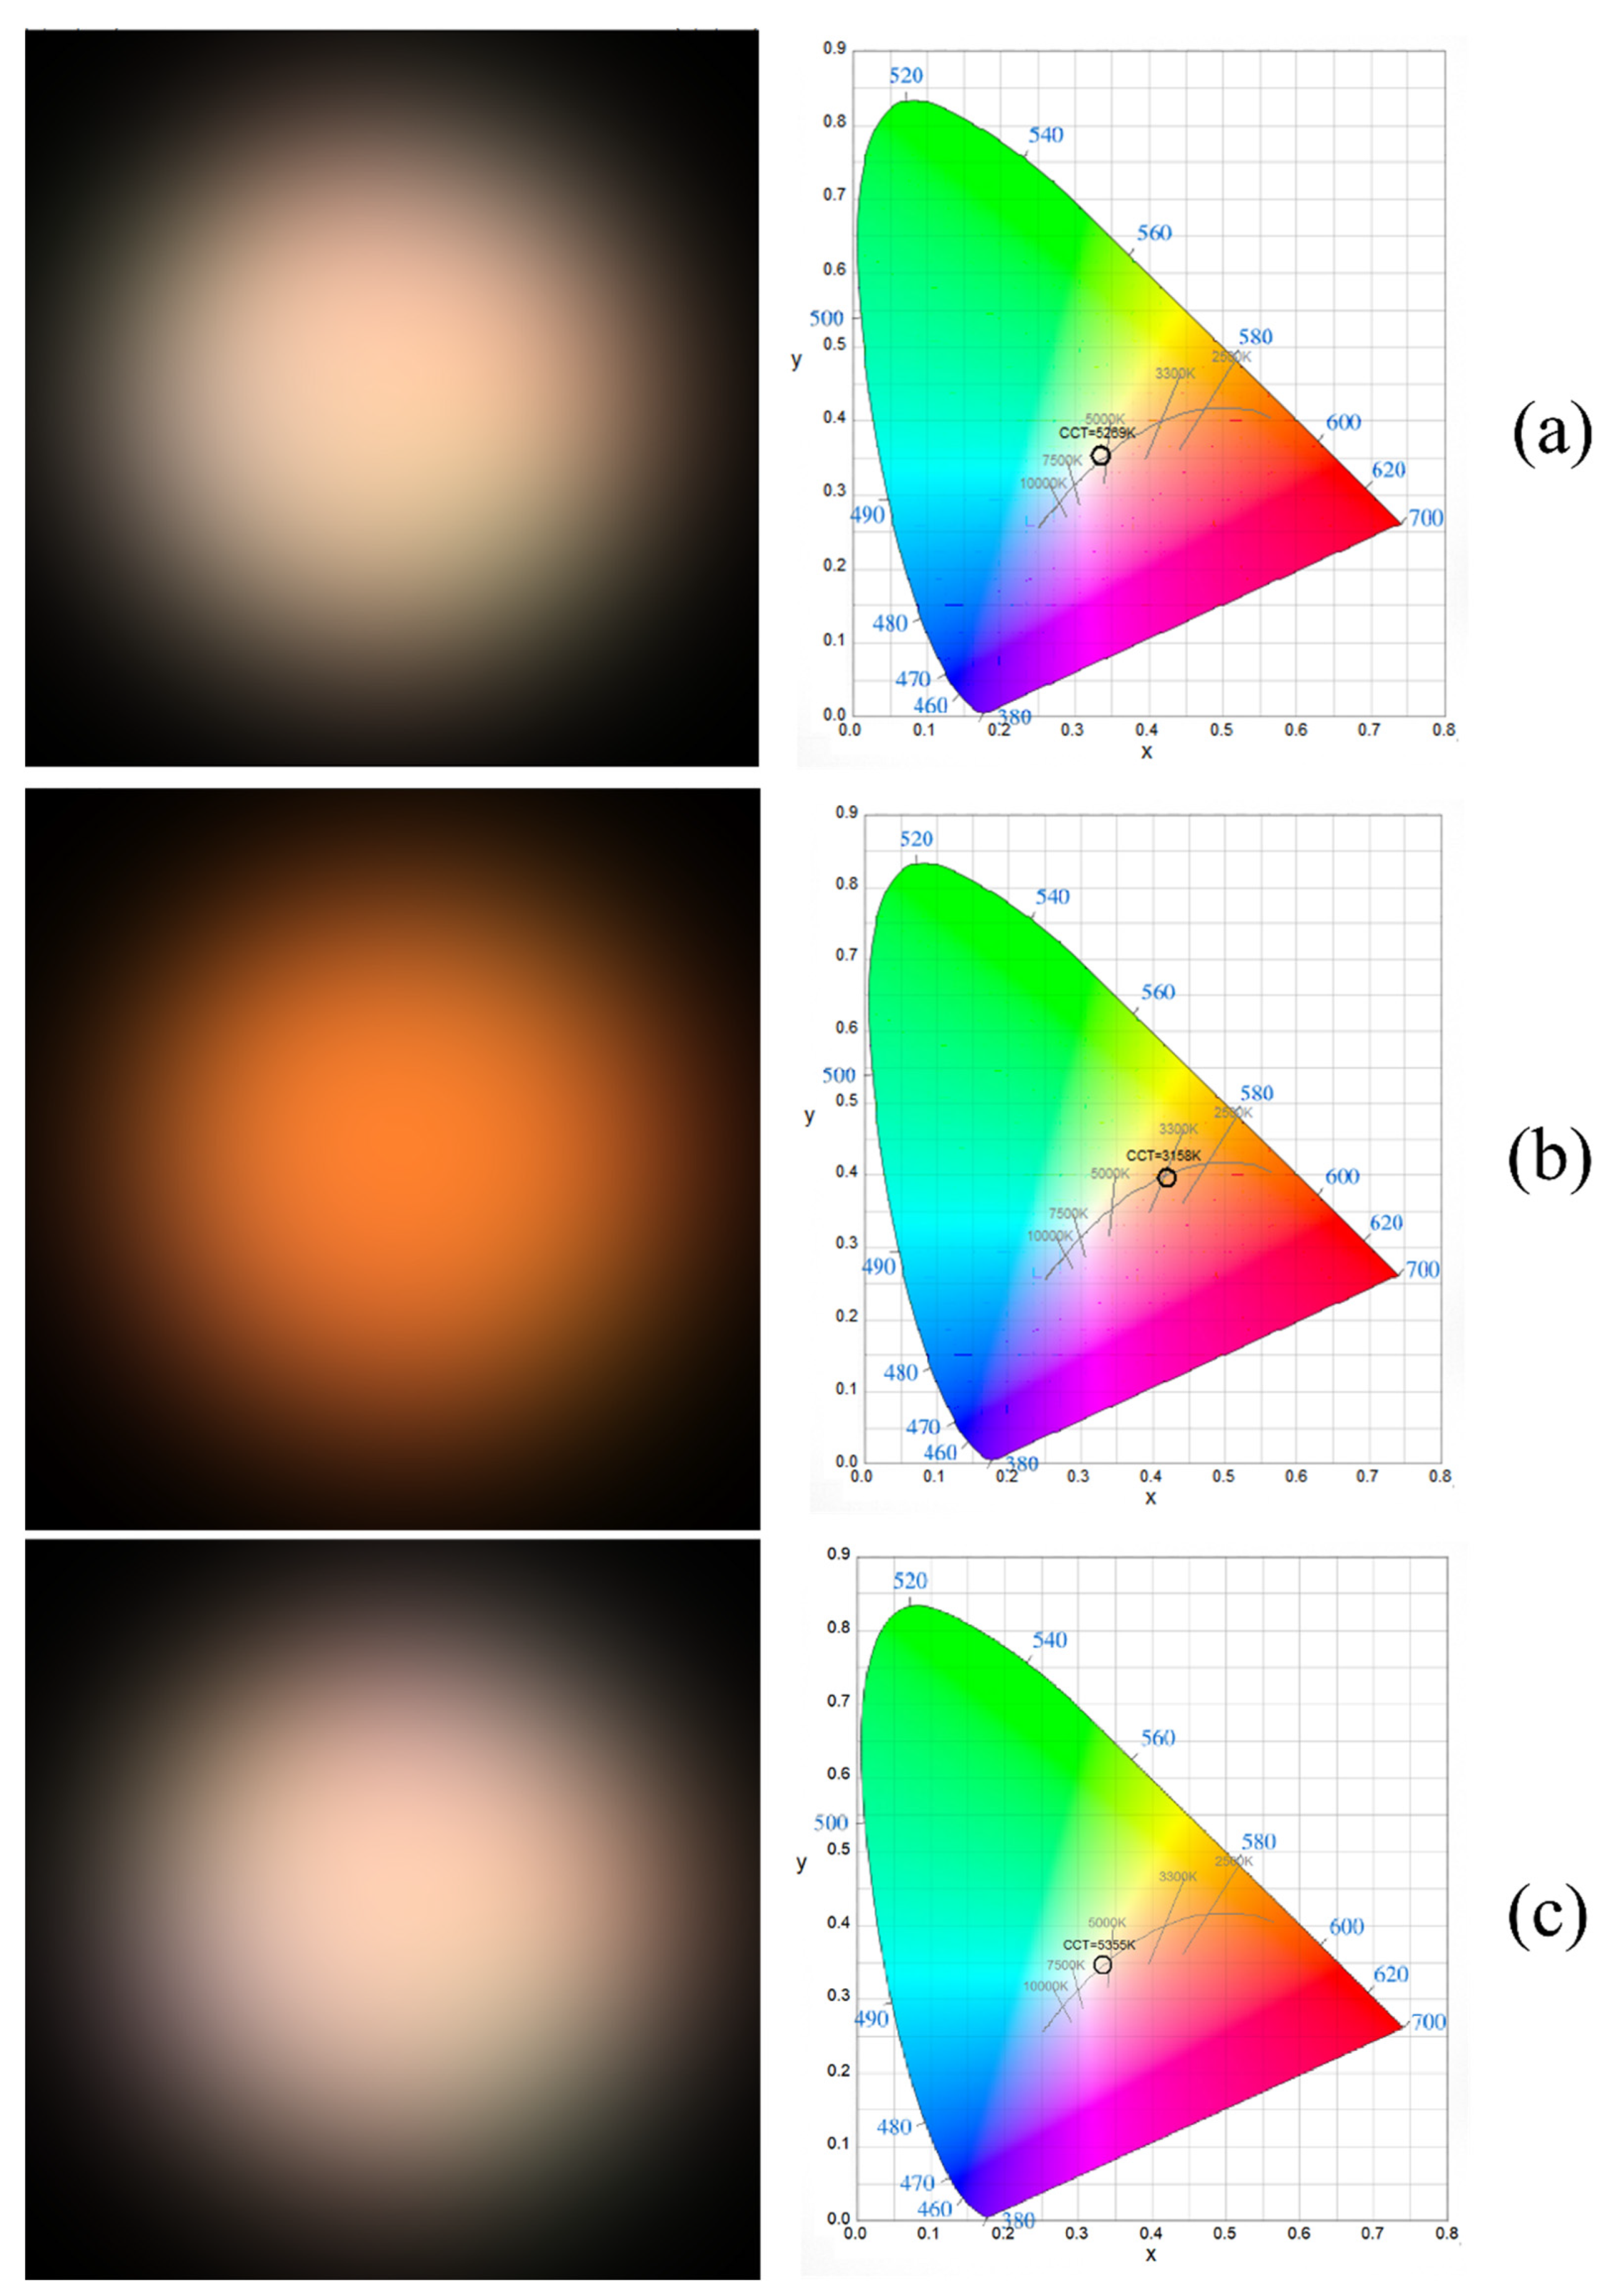
Three types of light sources were chosen from the TracePro library for the simulation. The color temperatures of these light sources were very close to the color temperatures of the light sources used during the experiment. These light sources were sunlight, a LED light with a CCT of 3158 K and a LED light with a CCT of 5355 K. The color images of these light sources, along with the color temperatures on the CIE chart, are given in Figure 5.
Same as the experiment, the intensity of the LED light and sunlight is varied by increasing the proportion of LED light. Table 3 and Table 4 give the changes in the color temperatures of the mixed light for warm white LED (3158 K) and cool white LED (5355 K), respectively. On the other hand, Table 5 and Table 6 show the measured values in the color temperatures for LED (3000K) and LED (5000 K), respectively.
Comparing the results from both of the cases, it can be seen that the color temperature of the mixed light stays almost consistent in the case of white warm LED light. In the case of warm LED light, its color temperature decreases as the intensity of the LED light is increased.
The two cases of hybrid light calculated with a ray-tracing simulation were validated through experimentation. In the first case, a warm LED light with a color temperature of 3000 K was used as the electric light in the system. The portions of light from sunlight and LED light were mixed in different proportions to see their effects on the color temperature of the output light. 
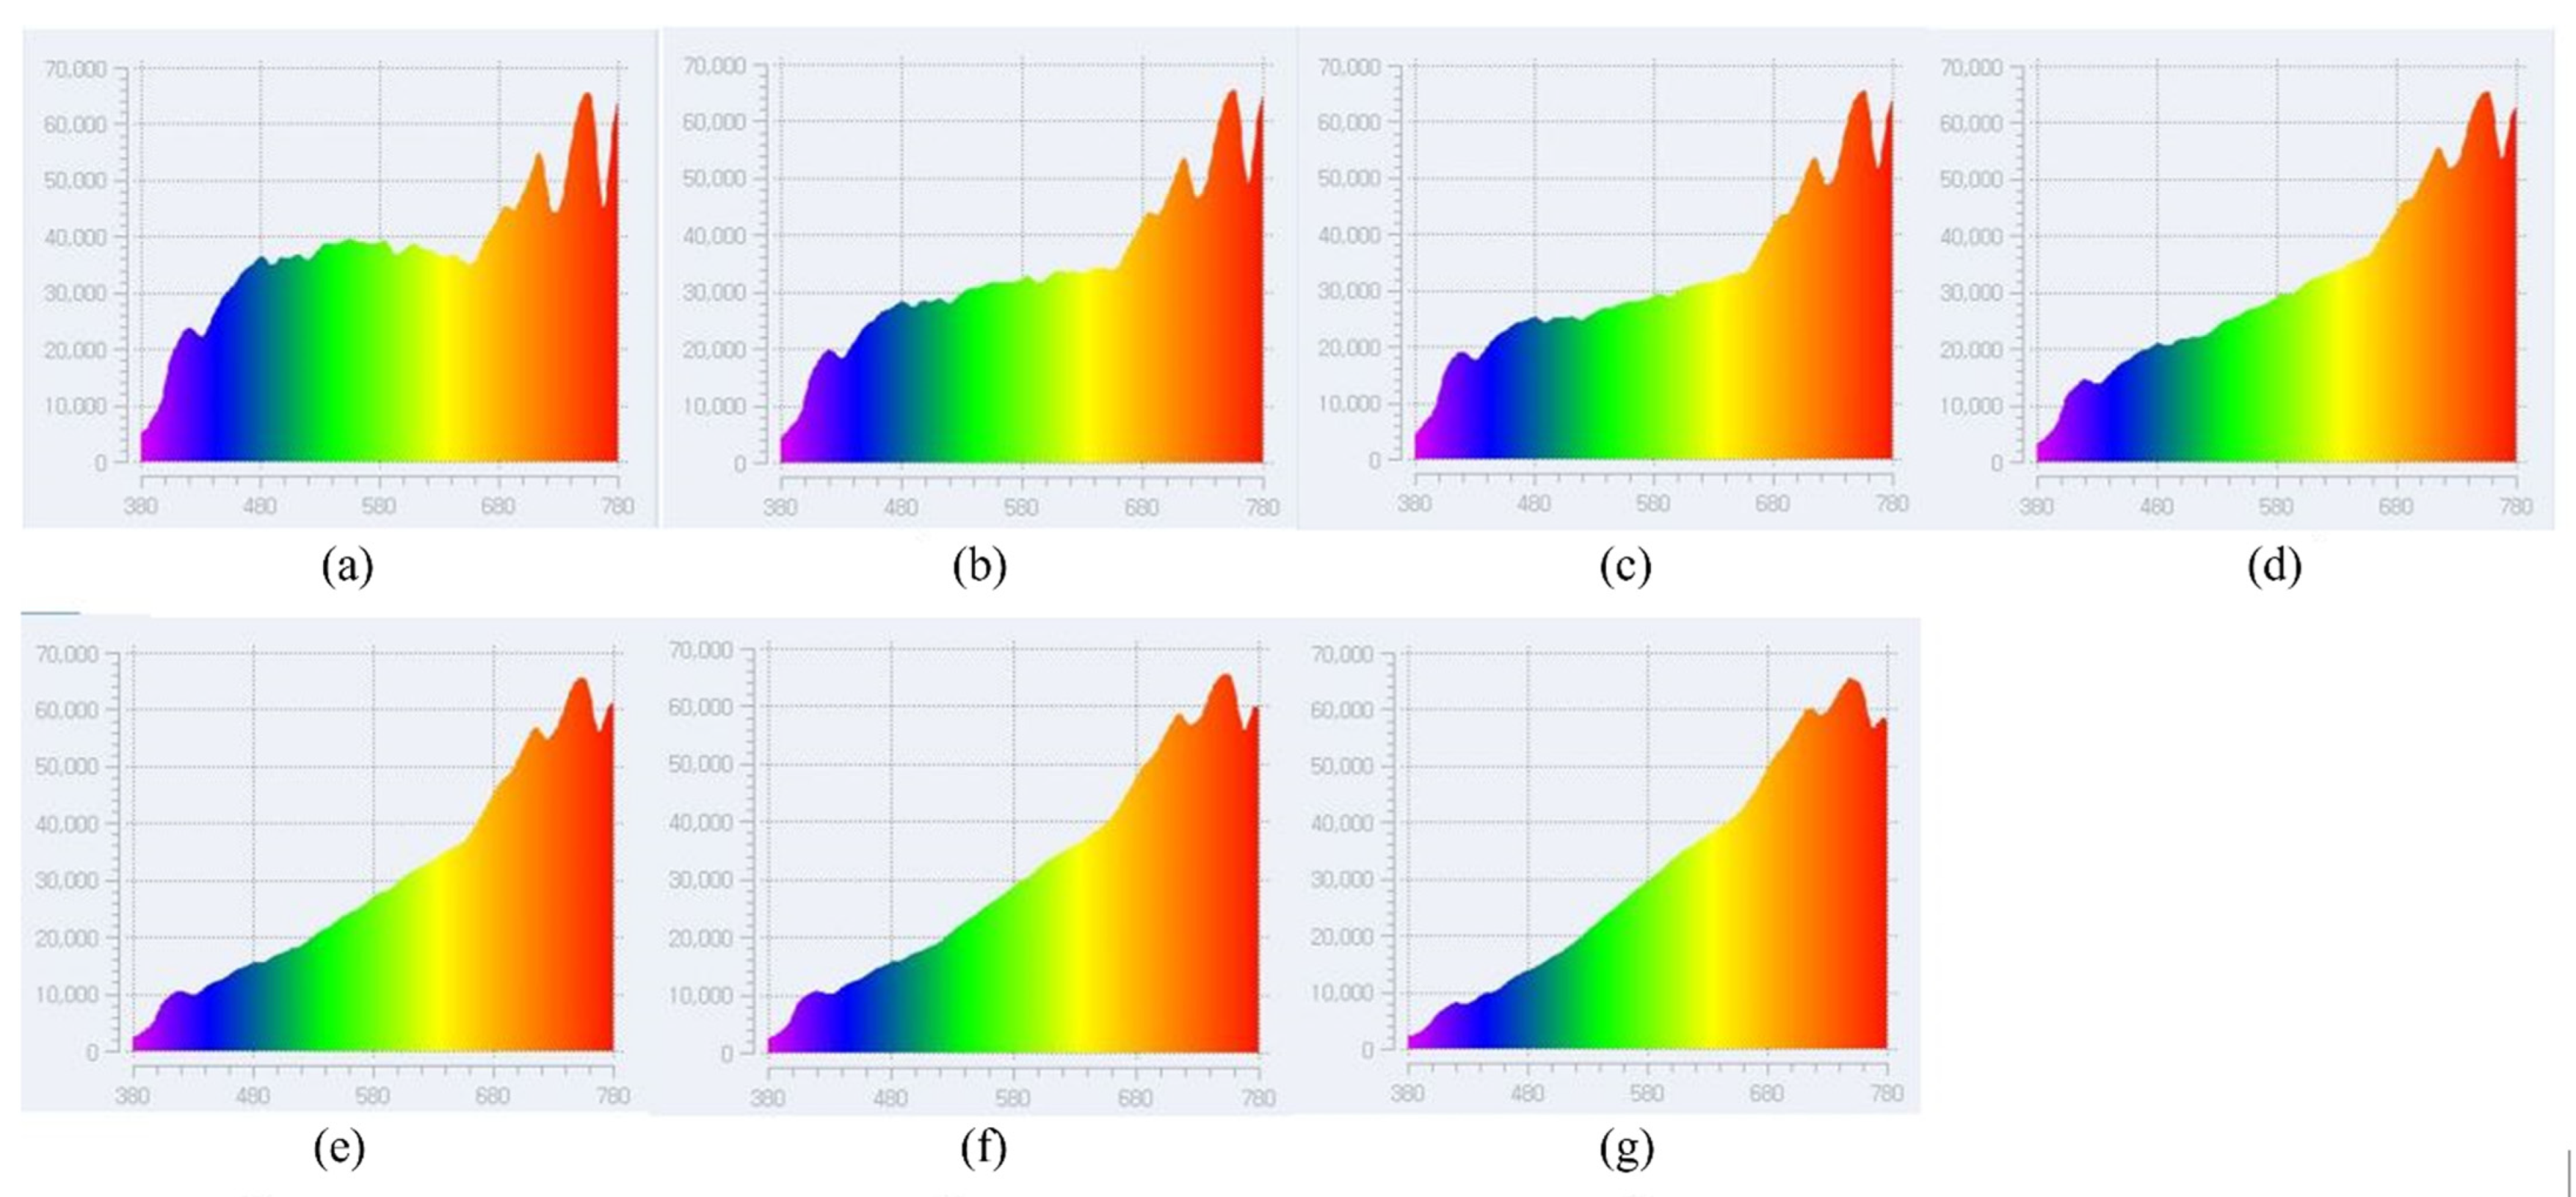
Figure 6 gives the variations of the spectrum of light with respect to different proportions of sunlight and LED light (3000 K).
It can be seen that the color temperature of the output light is related with the portion of each light source in the mixture. As the amount of LED light is gradually increased, the color temperature shifts from the value of 5000 K to the value of 3000 K which is the color temperature of the LED light.
In the second case, the measurements were taken with a LED light source of 5000 K in temperature. The color temperature was almost similar to that of sunlight. 
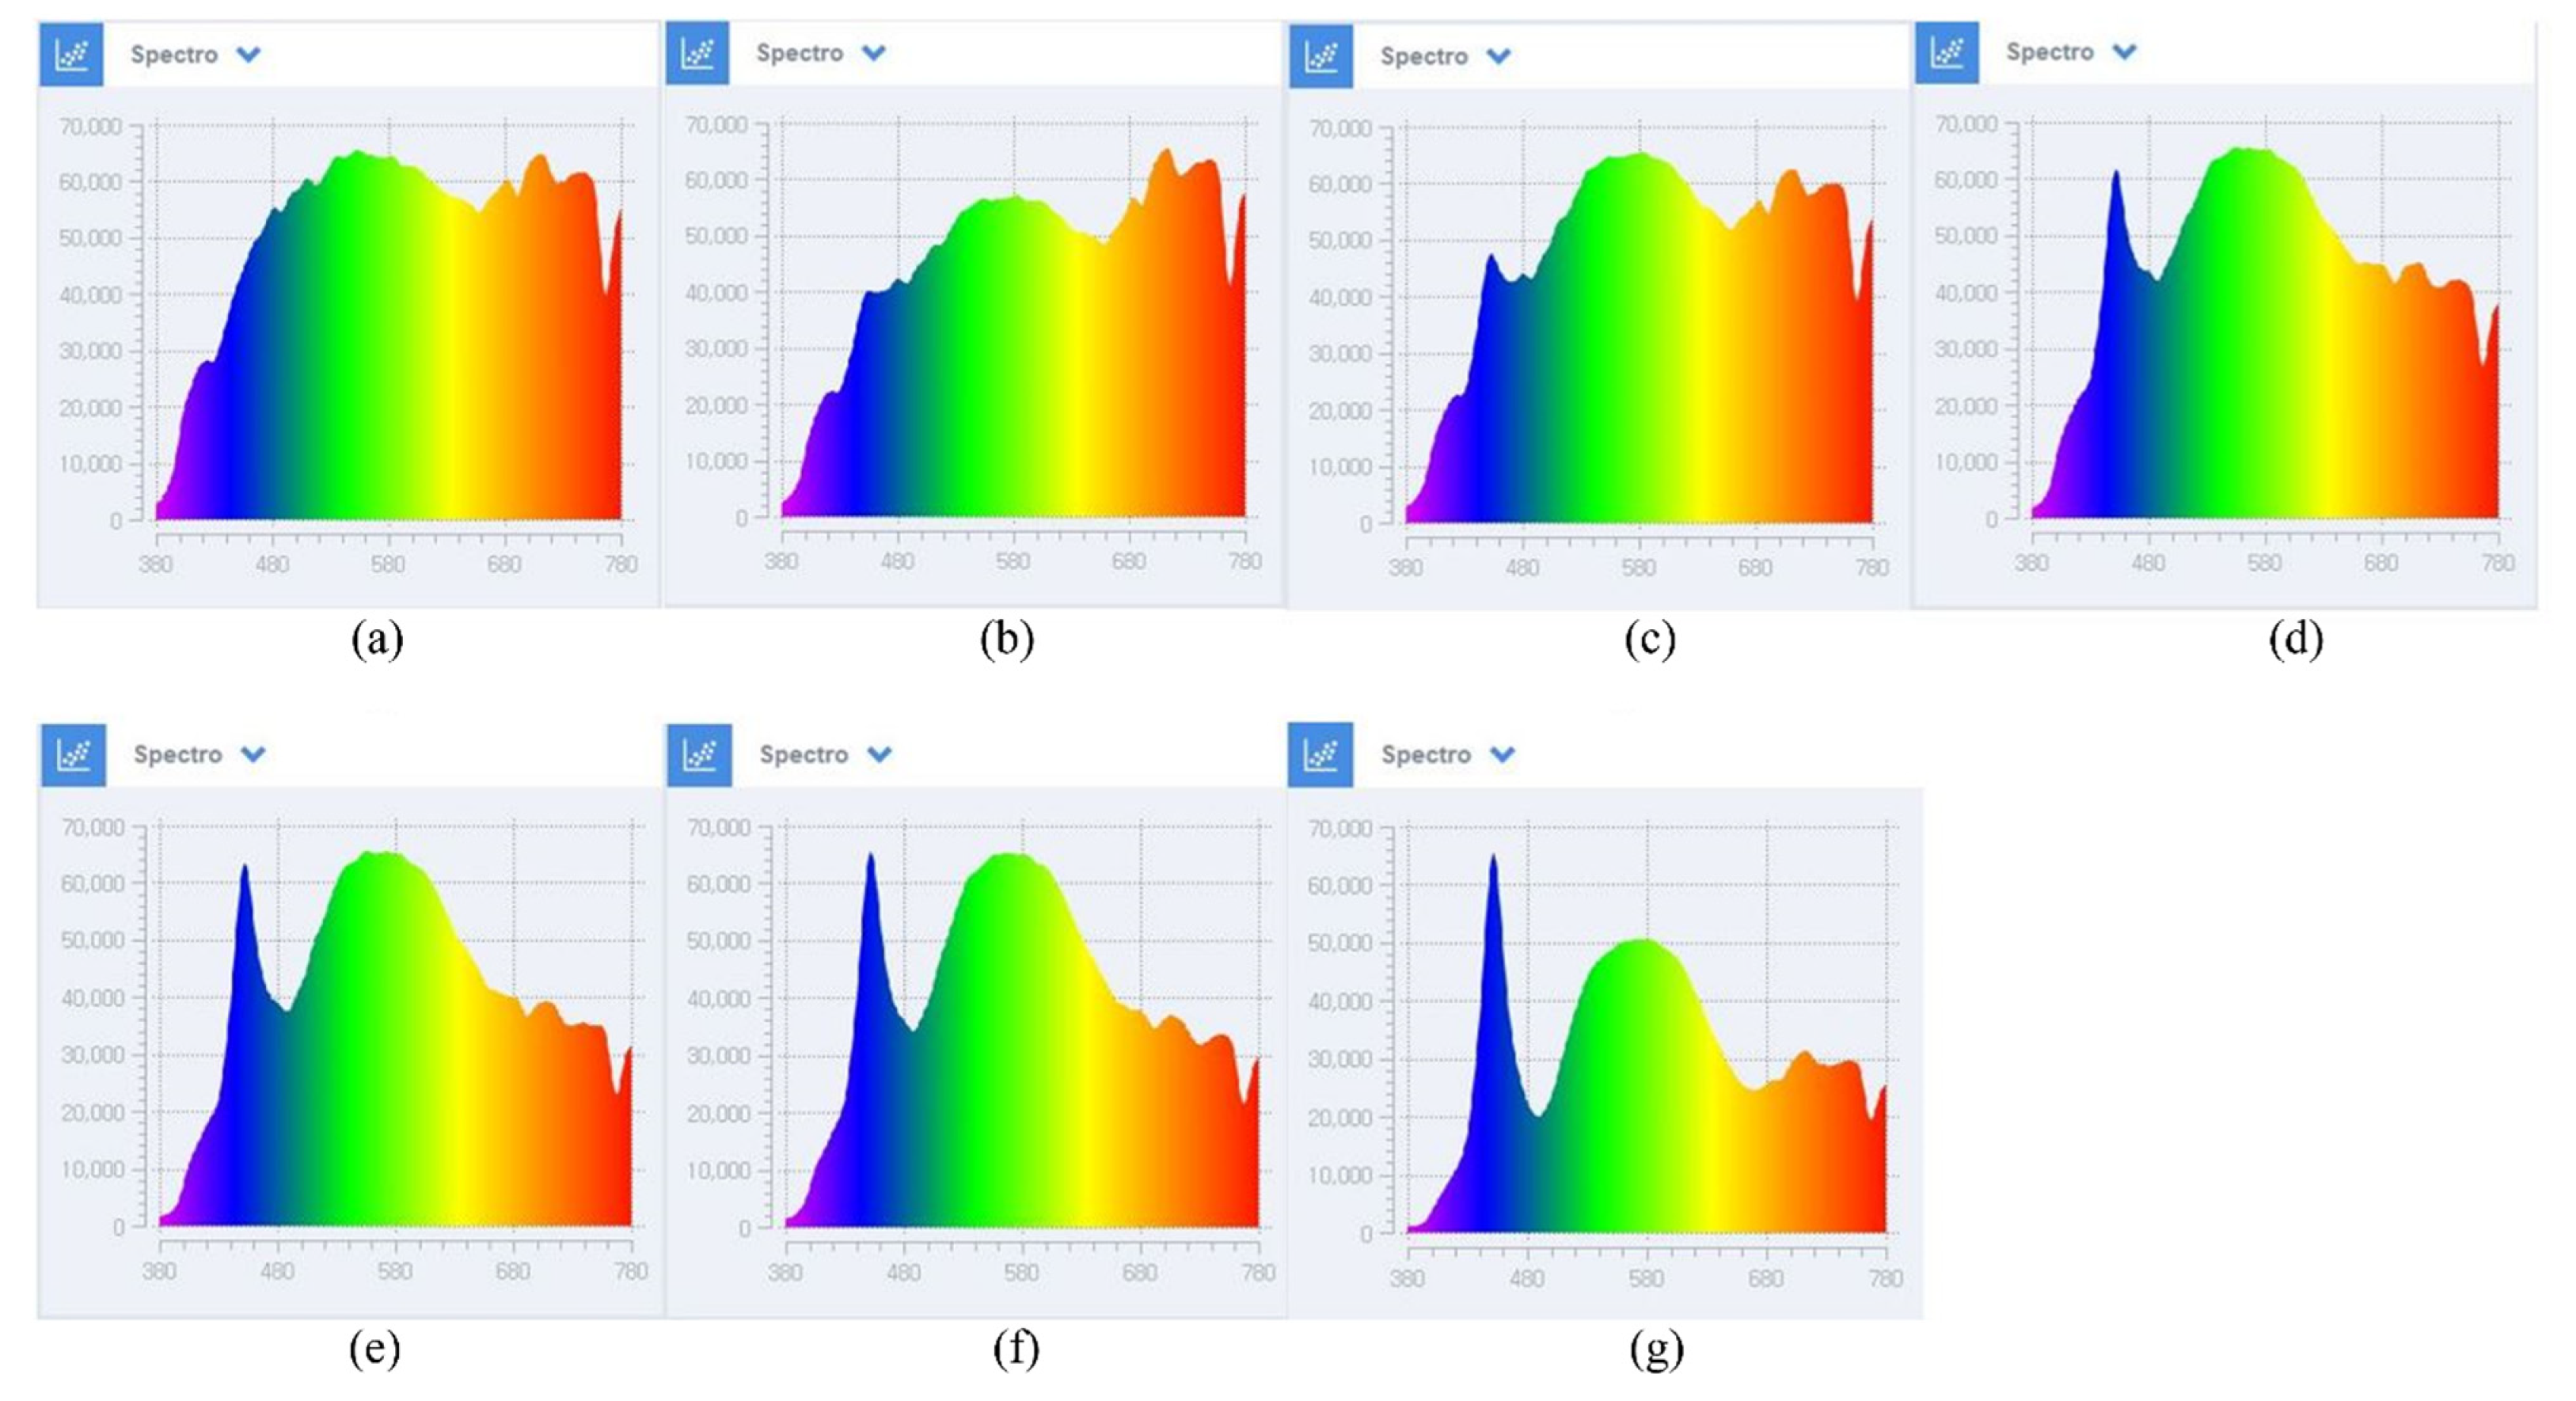
Figure 7 gives the variations of the spectrum of light with respect to different proportions of sunlight and LED light (5000 K).
The portions of light from both the sunlight and LED were kept the same as the previous case. In the current scenario, negligible or no change was observed in the color temperature of the output light. Therefore, it can be concluded that using a light source with a color temperature close to or equal to the sunlight can help maintain a constant quality of the output hybrid light as shown in Figure 8.

4. Performance Assessment/Test Cell Experiment

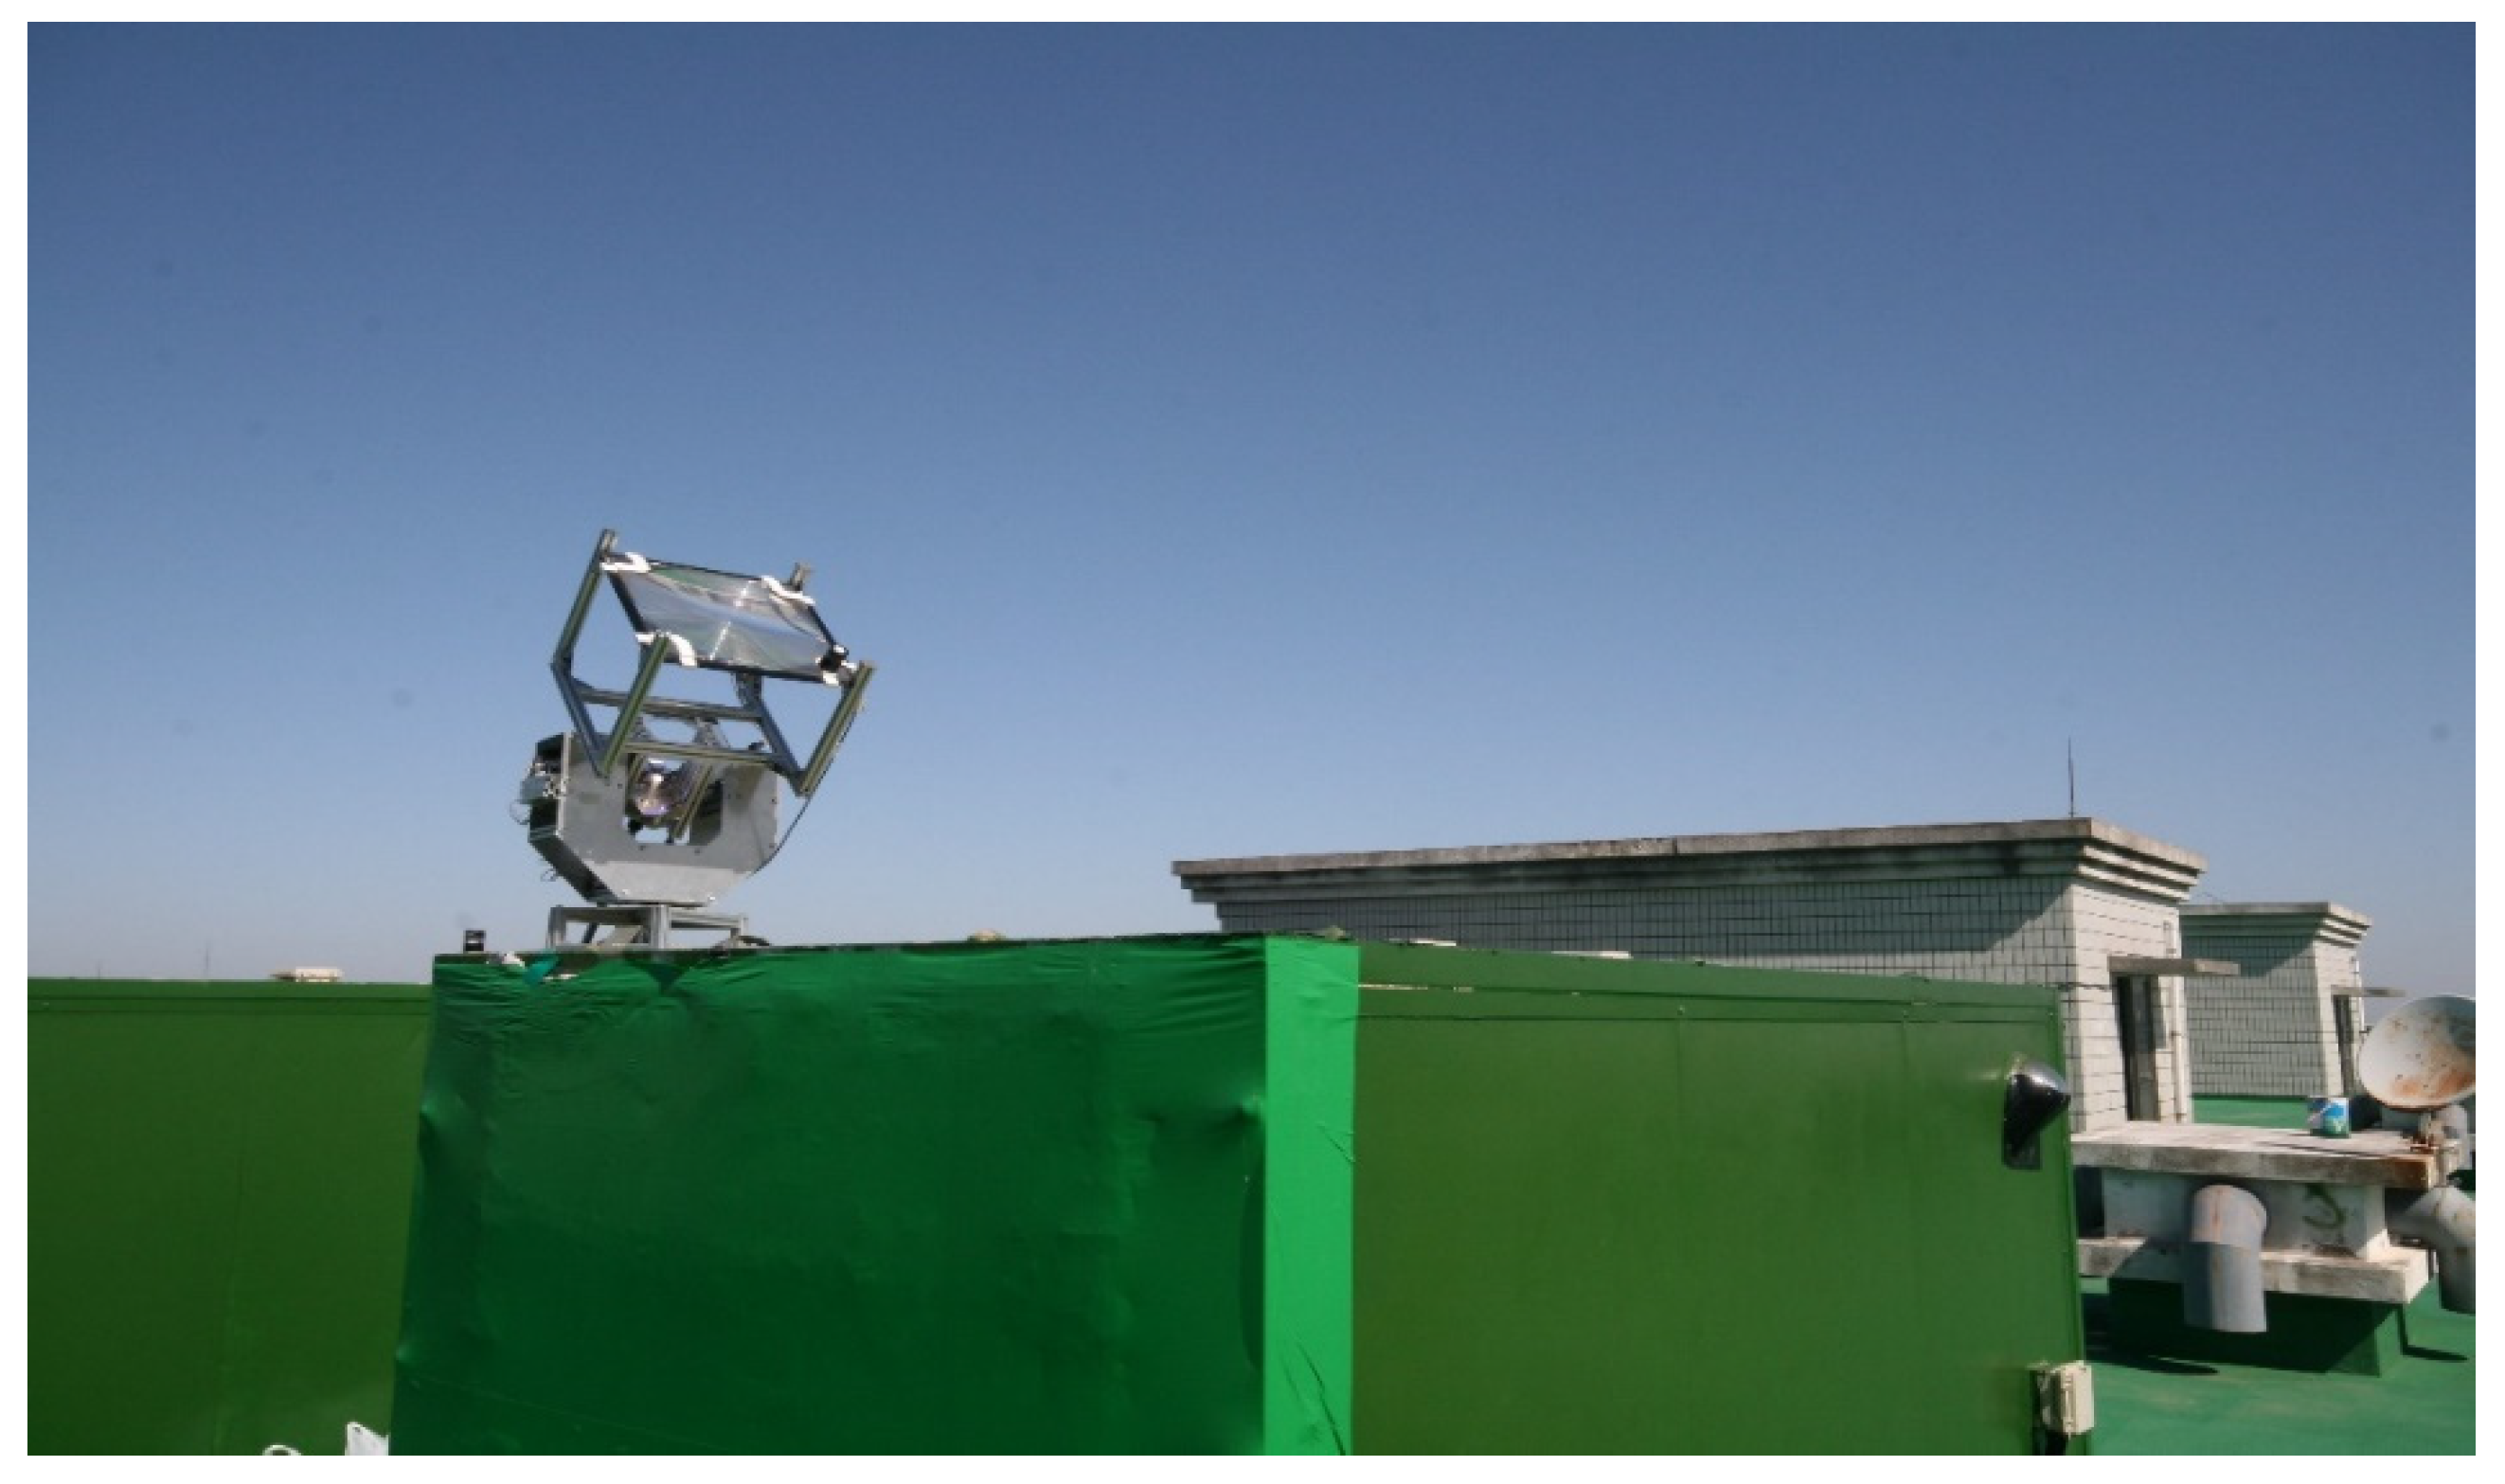
A number of measurements were carried out to investigate the feasibility of the proposed daylighting system from the perspective of constant lighting when applied under clear sky conditions. The system was installed on the rooftop of a test cell (3 m × 1.5 m × 1.5 m) located at Jeju National University of South Korea (Figure 9). The detailed information of the test cell is given in the 
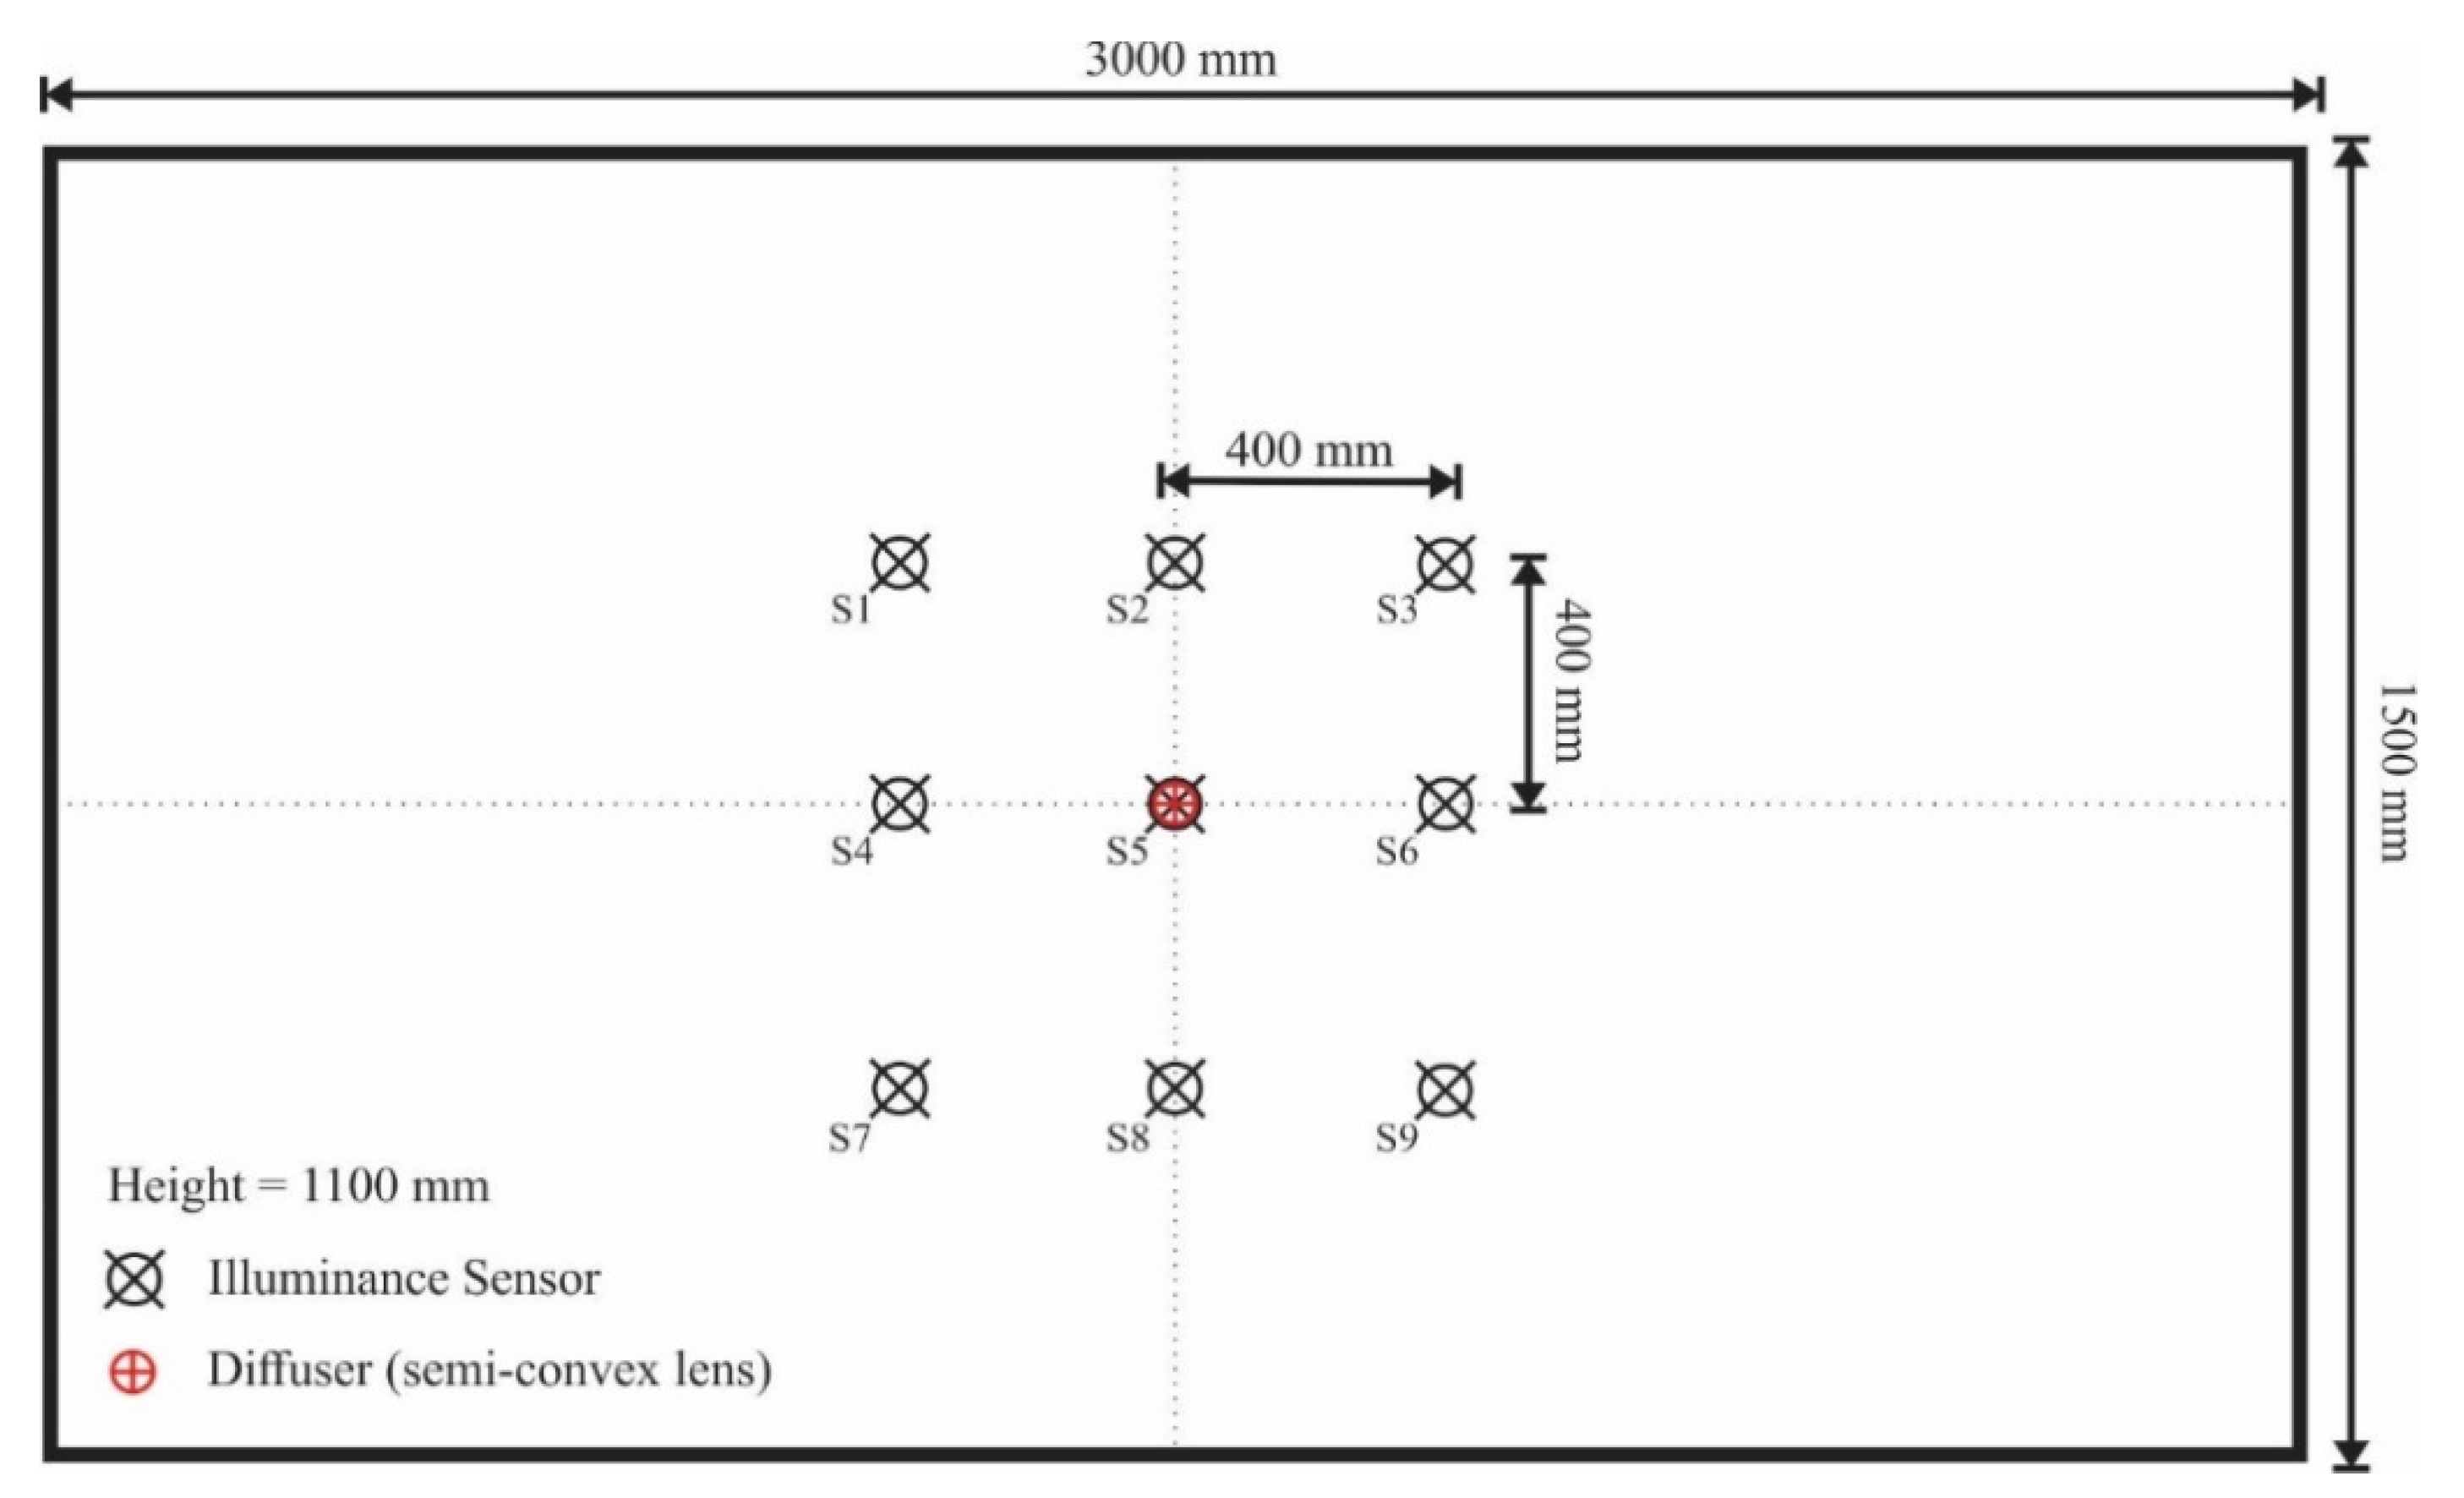
Table 7. Daylight was delivered to its interior via a diffuser (a planoconcave lens) that was connected to the optical fiber cable, which transmitted the light captured by the daylighting system. To prevent overheating of its interior during sunny hours, a ventilation fan was installed. The test cell was monitored for two consecutive days, while illuminance was measured by photo sensors installed on the task plane from 9:00 a.m. to 5:00 p.m. under clear sky conditions in April. On the first day, indoor illumination was only done by daylight (sunlight) channeled in by the daylighting system, i.e., no artificial light. On the second day, however, the test cell was lit by both daylight and artificial light (from an electric lamp) to meet the desired target illuminance on the task plane. As anticipated, the performance of the present daylighting system was affected by sky conditions (clearness and air mass of the sun) to a great extent. A total of nine illumination sensors were located at a height of 1.1 m and spaced 0.4 m apart from each other, as depicted in Figure 10. LPPHOT01 from Delta OHM was employed to measure the illuminance on the task plane. All the sensors were calibrated, and every sensor had a different spectral response based on the standard photopic curve. Hence, corrected sensitivity was applied to each sensor for the reliability of the measurements. The measured data recorded an interval of 1 s with the Agilent 34970A data logger. Table 8 shows the specifications of the LPPHOTO01 used in the experiment.
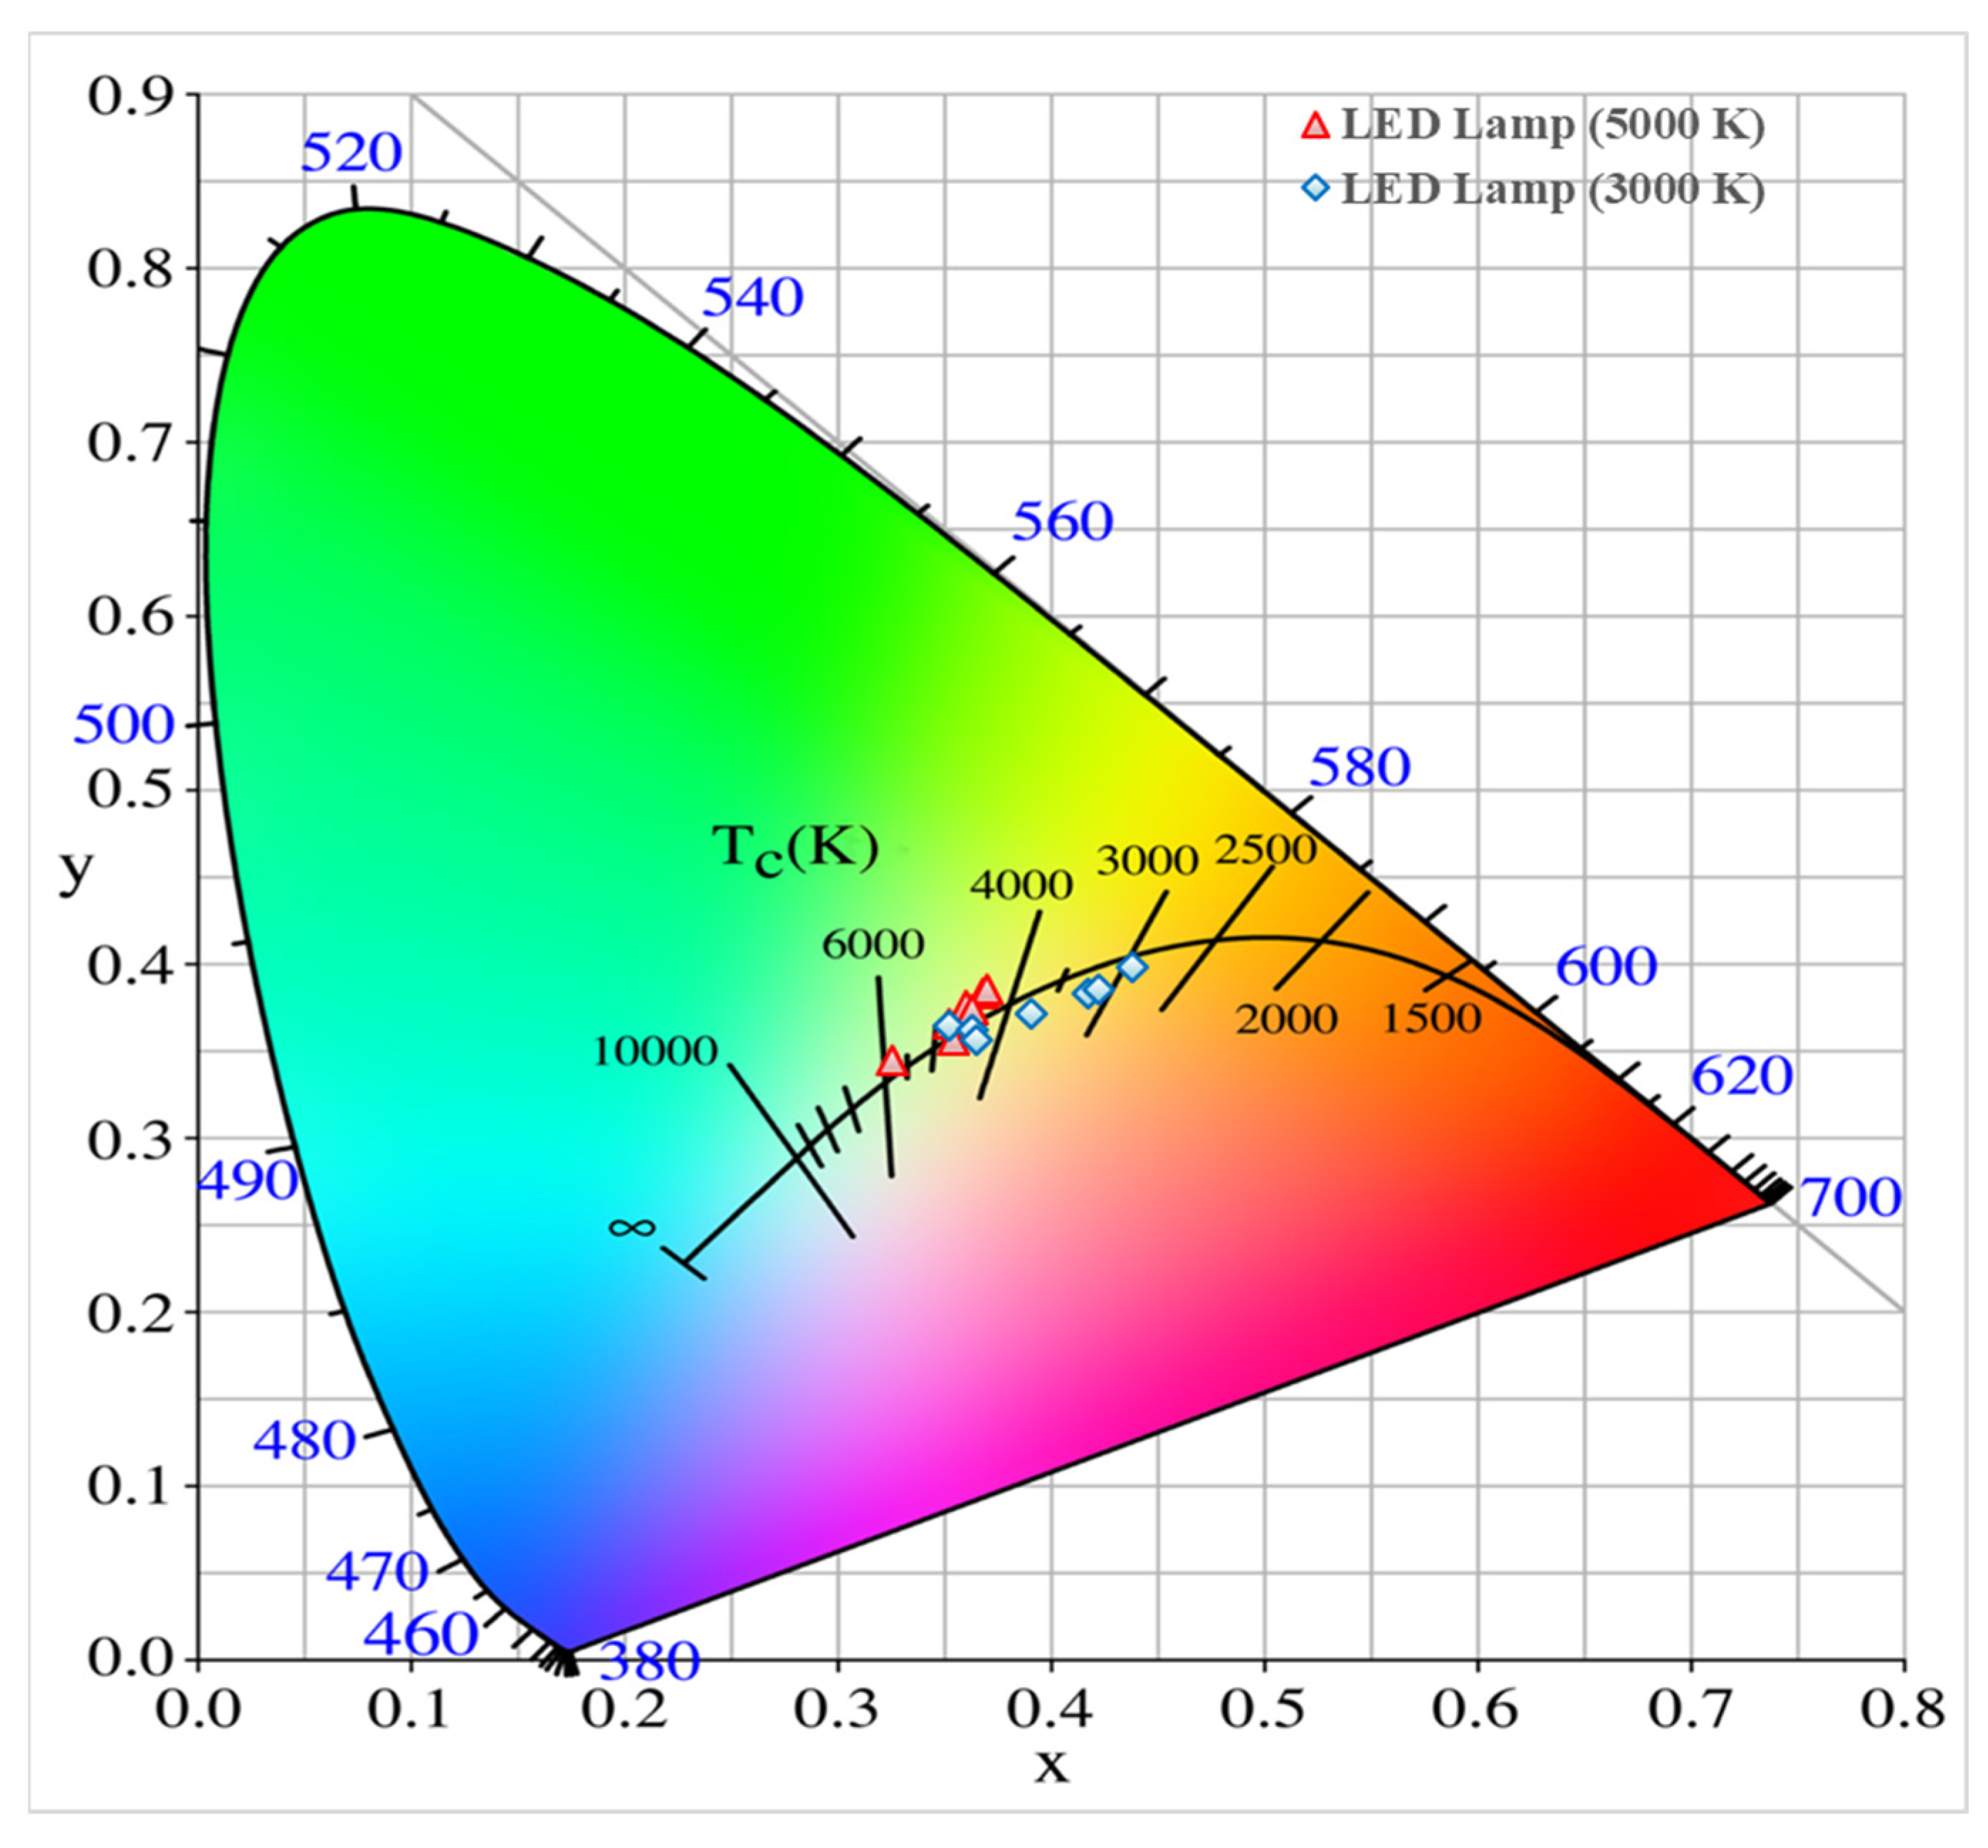
Plotting all the points from the spectrometer readings on the CIE chart showed the spectrum of the color temperature. When the LED light was used in the mixture, the output light was in the region of higher color temperatures and nearly consistent. However, in the case of the halogen light, the output light depended on the portion of halogen light in the mixture. As a result, the output shifted from 4500 K to 3000 K as the portion of halogen light increased.

All Day Measurements

The experimental results are presented in this section to verify the effectiveness of the system in delivering a constant amount of illumination to the task plane surface. For this purpose, the experiments were conducted in a test cell for a series of days. The measurements presented here display the performance of the system for three configurations: (1) without using a LED light, (2) the performance of the system with a LED light where it is able to meet the target illumination and (3) the performance of the system with a LED light where it is unable to meet the specified illumination on the task plane.
The experimentation was performed on consecutive days. In this way, the standard curves could be recalibrated according to measurements from 9:00 a.m. to 5:00 p.m. and improve the accuracy of the lighting control on a subsequent day. During both these days of the experimentation, the weather was clear and sunny. 
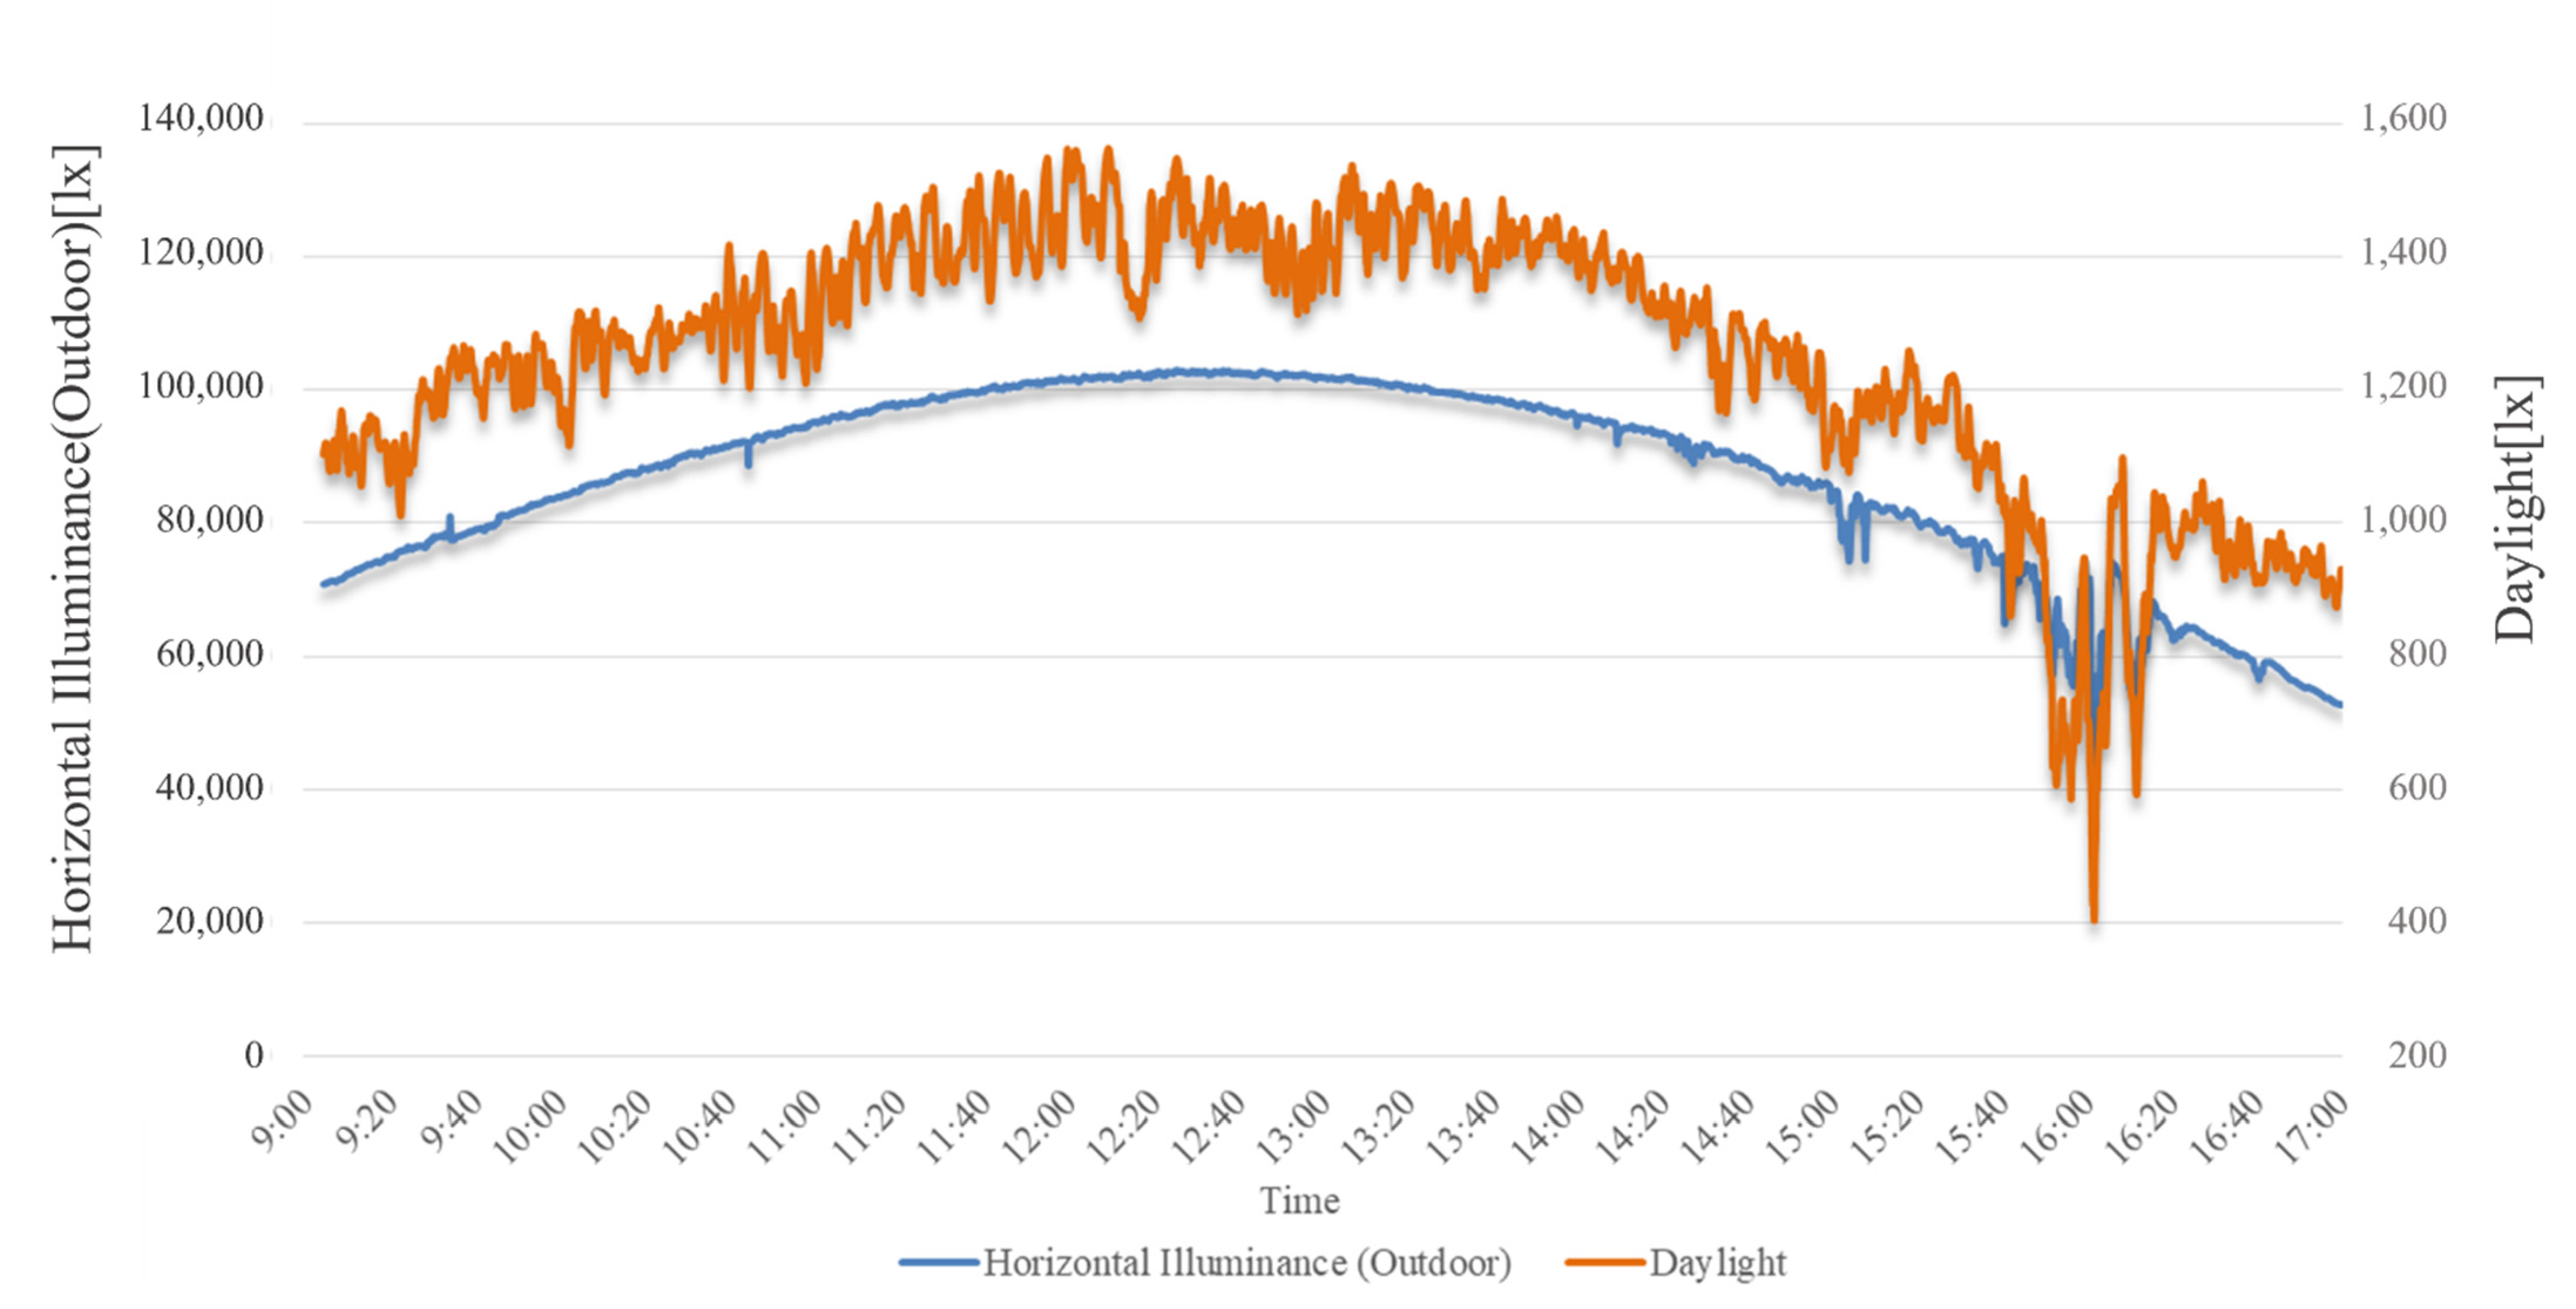
Figure 11 gives the measurements on the first day of experimentation. A near-constant level of illumination was observed throughout most of the day, except in the early and late hours. During the late hours from 15:30 to 16:30, some fluctuations could be observed due to some patches of moving clouds.
On the second day of experimentation, the light was added to the system to provide constant levels of illumination, especially during the early and late hours of the day. 
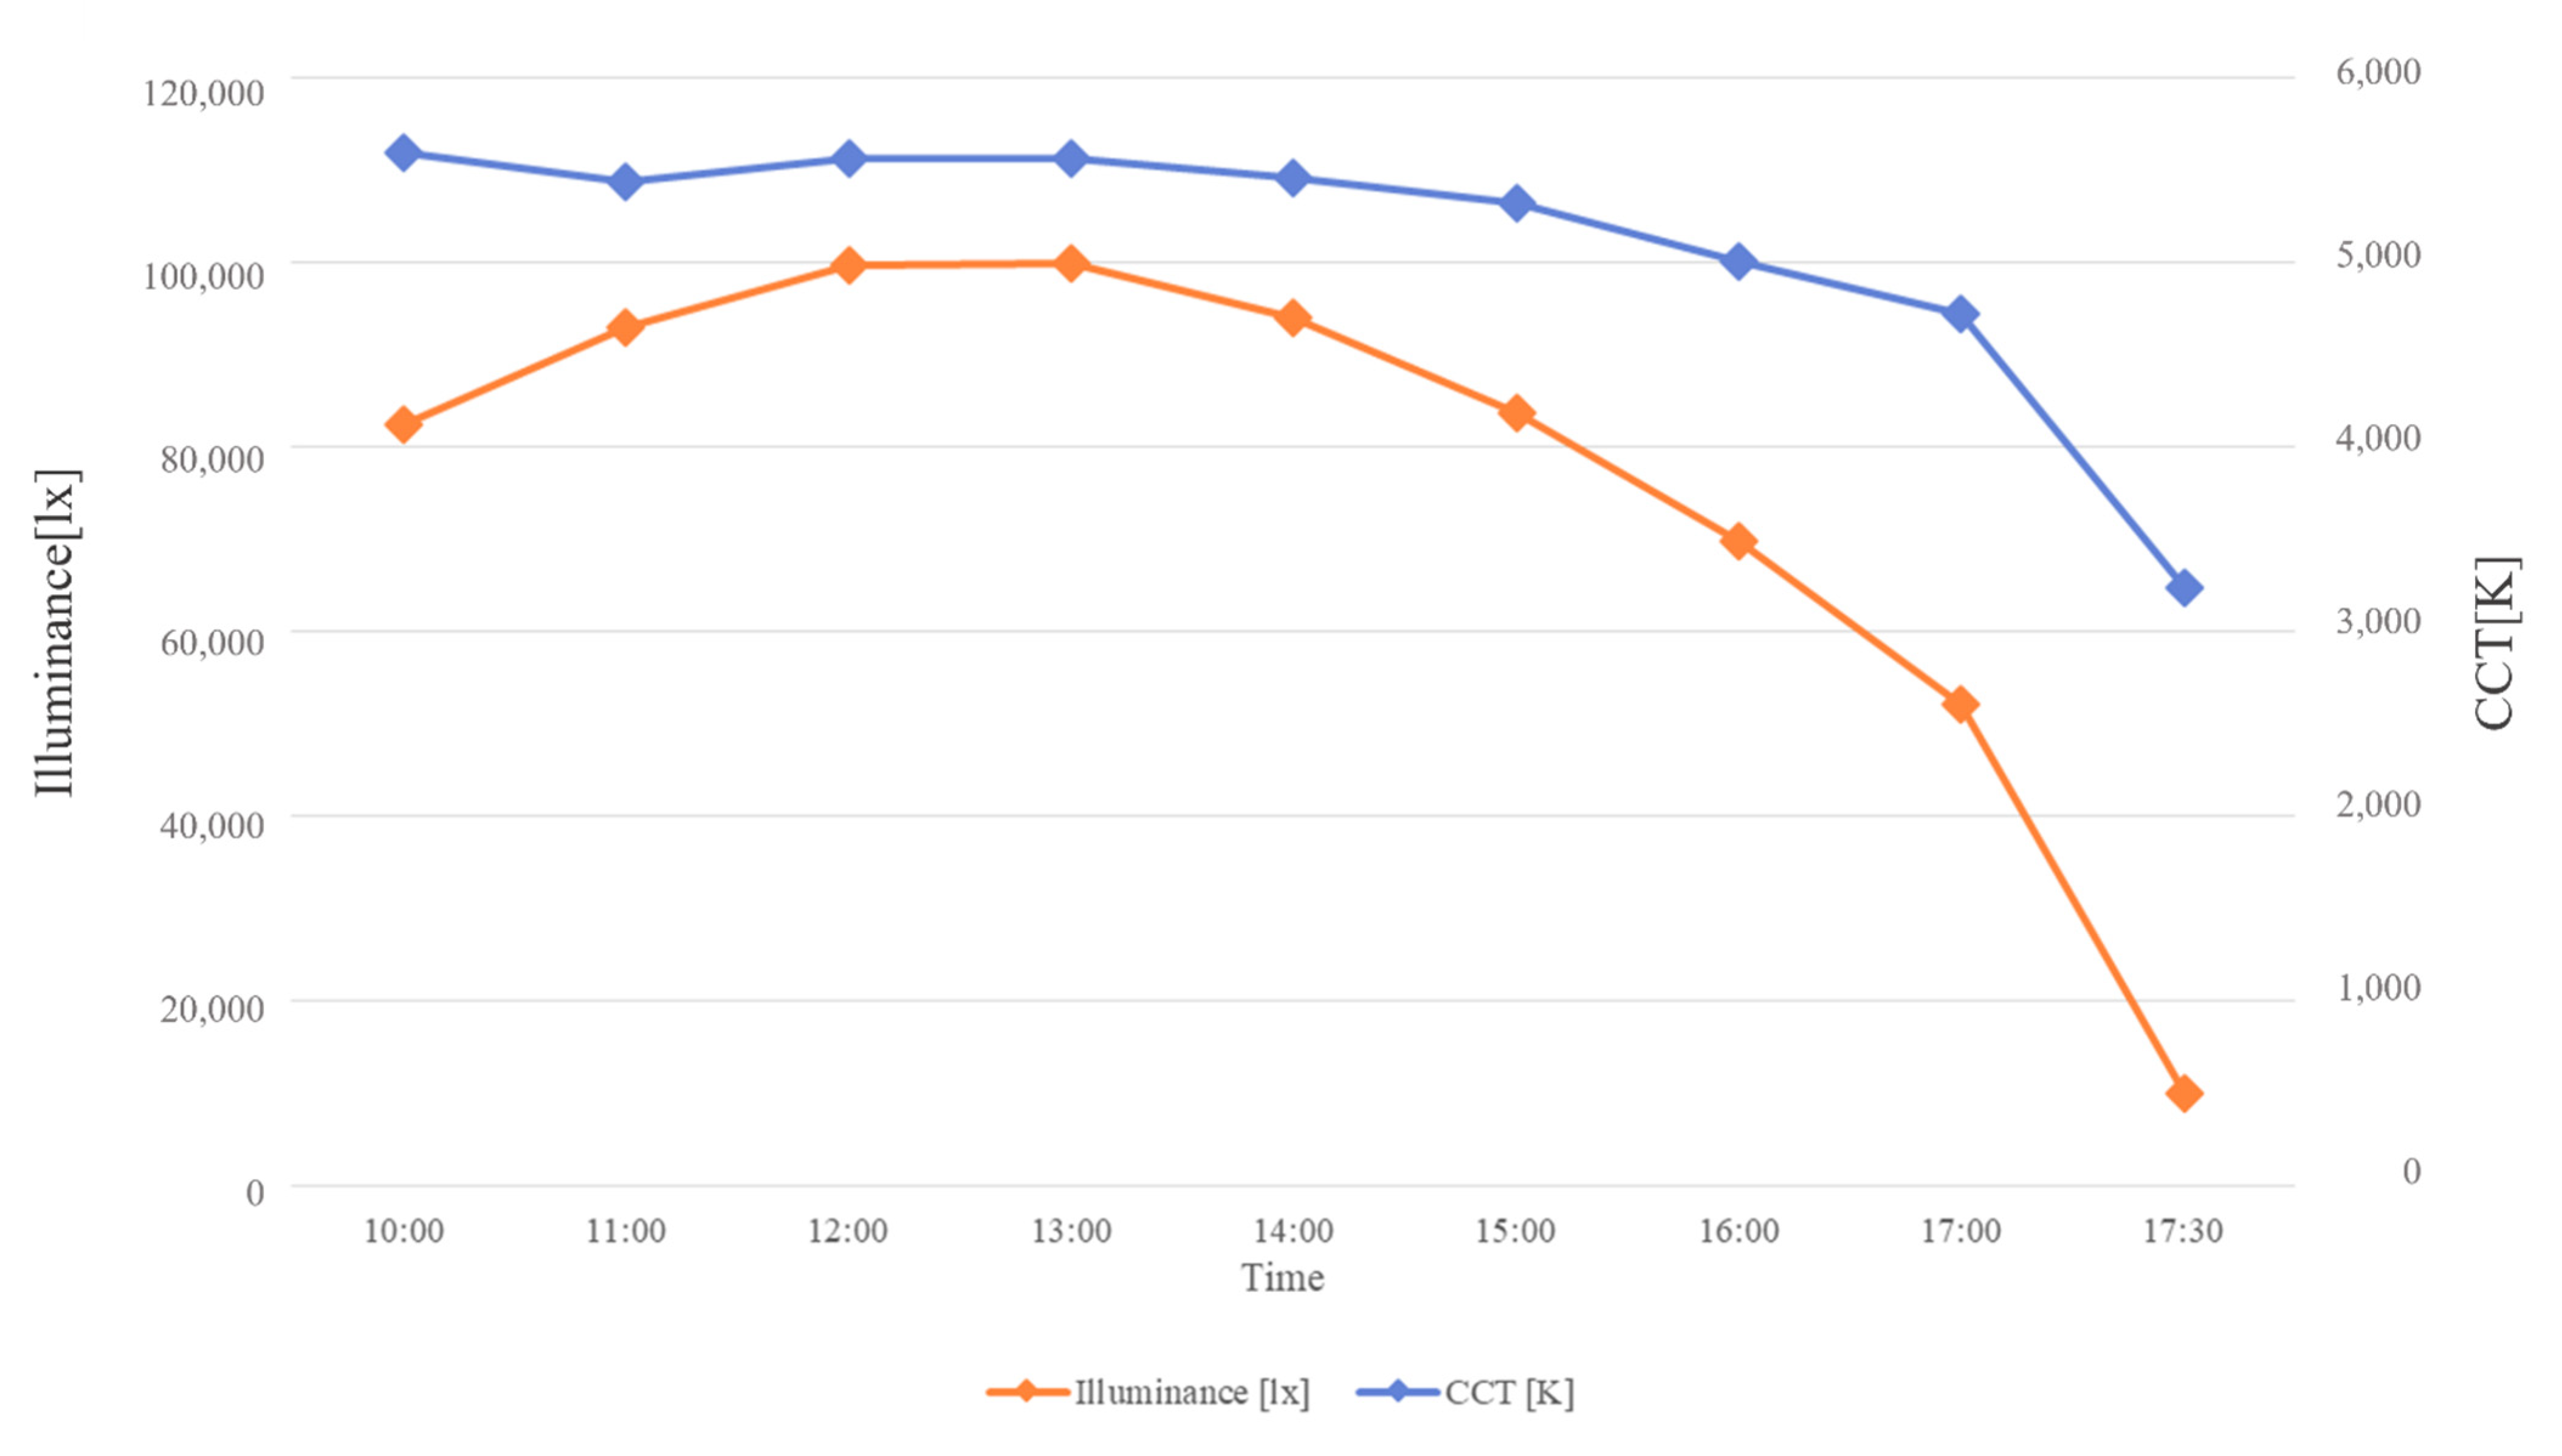
Figure 12 gives the measurements of illuminance throughout the second day of experimentation. During the early hours, from 9:00 to 10:00, the task plane received a hybrid light to meet the required level of 1200 lux. For the major portion of the day, the sunlight was enough to meet the required illuminance. From 15:30 to 17:00, the sunlight alone was not enough to meet the level of task plane illuminance, and again, the lighting control activated to add LED light into the system. A LED light with a color temperature of 5000 K was used in this experiment as the auxiliary light source. It should be noted that the color temperature of the sunlight remained nearly constant for the main portion of the day (Figure 13). The value of CCT only decreased noticeably after 17:00 when it was time for sunset.
An appreciable level of outside horizontal illuminance is mandatory to meet the required value of illuminance with the system. In the case where the outside horizontal illuminance is significantly lower, the system may not be able to meet the desired illumination, even with the combined sunlight and LED light.

5. Conclusions

In this work, a hybrid daylighting system was studied for its effectiveness to provide a constant level of light in the desired space. Special emphasis was given to the nature of the light and the ability of the system to maintain a constant color temperature throughout its hours of operation. Using an electric light with a color temperature equivalent to the sunlight can preserve the color temperature of the output, even when the portions of either of the input lights are significantly changed. The effectiveness of the system was studied in a test cell environment for different scenarios. In the case of adequate sunlight, the system proved to be effective in providing a constant illuminance of 1200 lx, as well as a constant color temperature throughout the day.

Author Contributions

Conceptualization, H.-J.H.; Formal analysis, S.-J.O.; Funding acquisition, S.-J.O.; Investigation, S.-H.L.; Methodology, J.-C.P.; Visualization, J.-W.L.; Writing—original draft, H.-J.H. and M.U.M.; Writing—review & editing, S.-J.O. All authors have read and agreed to the published version of the manuscript.

Funding

This work was supported by the Renewable Surplus Sector Coupling Technology Program of the Korea Institute of Energy Technology Evaluation and Planning (KETEP) granted financial resource from the Ministry of Trade, Industry & Energy, Republic of Korea (No. 20226210100050) and also supported by the Basic Science Research Program through the National Research Foundation of Korea (NRF) funded by the Ministry of Education (Grant no. 2016R1D1A1B01015616, 2021R1I1A1A01060291 and 2021R1I1A1A01047958).

Data Availability Statement

The data in this study is available on requests from the corresponding author.

Conflicts of Interest

The authors declare no conflict of interest.

References

  1. Kischkoweit-lopin, M. An overview of daylighting systems. Fuel. Energy Abstr. 2003, 44, 234. [Google Scholar] [CrossRef]
  2. Souman, J.L.; Tinga, A.M.; te Pas, S.F.; van Ee, R.; Vlaskamp, B.N.S. Acute alerting effects of light: A systematic literature review. Behav. Brain Res. 2018, 337, 228–239. [Google Scholar] [CrossRef] [PubMed]
  3. Duffy, J.F.; Czeisler, C.A. Effect of Light on Human Circadian Physiology. Sleep Med. Clin. 2009, 4, 165–177. [Google Scholar] [CrossRef] [Green Version]
  4. Baggerly, C.A.; Cuomo, R.E.; French, C.B.; Garland, C.F.; Gorham, E.D.; Grant, W.B.; Heaney, R.P.; Holick, M.F.; Hollis, B.W.; McDonnell, S.L.; et al. Sunlight and Vitamin D: Necessary for Public Health. J. Am. Coll. Nutr. 2015, 34, 359–365. [Google Scholar] [CrossRef] [Green Version]
  5. Ullah, I.; Lv, H.; Whang, A.J.W.; Su, Y. Analysis of a novel design of uniformly illumination for Fresnel lens-based optical fiber daylighting system. Energy Build 2017, 154, 19–29. [Google Scholar] [CrossRef]
  6. Han, H.J.; Mehmood, M.U.; Ahmed, R.; Kim, Y.; Dutton, S.; Lim, S.H.; Chun, W. An advanced lighting system combining solar and an artificial light source for constant illumination and energy saving in buildings. Energy Build 2019, 203, 109404. [Google Scholar] [CrossRef]
  7. Ahmed, R.; Kim, Y.; Zeeshan, Z.; Mehmood, M.U.; Han, H.J.; Chun, W.; Lim, S.H. Seven-Point Solar Tracking Control for a Fiber-Optic Daylighting System. J. Sol. Energy Eng. 2021, 143, 1–10. [Google Scholar] [CrossRef]
  8. Ahmed, R.; Oh, S.J.; Mehmood, M.U.; Kim, Y.; Jeon, G.; Han, H.J.; Lim, S.H. Computer vision and photosensor based hybrid control strategy for a two-axis solar tracker—Daylighting application. Sol. Energy 2021, 224, 175–183. [Google Scholar] [CrossRef]
  9. Tu, D.; Vu, H.; Shin, S.; Quoc, T.; Hai, N. New mechanism of a daylighting system using optical-fiber-less design for illumination in multi-storey building. Sol. Energy 2021, 225, 412–426. [Google Scholar] [CrossRef]
  10. Yang, Z.; Wang, J.; Wang, W.; Song, J. Realization of high fl ux daylighting via optical fi bers using large Fresnel lens. Sol. Energy 2019, 183, 204–211. [Google Scholar] [CrossRef]
  11. He, K.; Chen, Z.; Zhong, S.; Qian, Y.; Liu, H.; Yin, J.; Zhou, B. A solar fi ber daylighting system without tracking component. Sol. Energy 2019, 194, 461–470. [Google Scholar] [CrossRef]
Figure 1. Schematics of the hybrid lighting system.
Energies 15 08356 g001
Figure 2. Fresnel lens mounted on a two-axis tracker: (a) fabricated and (b) operation schematic.
Energies 15 08356 g002
Figure 3. Optical fiber light guides used in the experiment, (a) a glass type light guide; (b) a polymer type light guide.
Energies 15 08356 g003
Figure 4. Procedure of the ray-tracing simulation (a), model of the fiber optics and light sources in TracePro (b) and the ray-tracing simulation results (c).
Energies 15 08356 g004
Figure 5. Monochromatic color image and CCT charts for three different light sources: (a) sunlight, (b) a warm white LED with a CCT of 3158 K and (c) a cool white LED with a CCT of 5355 K.
Energies 15 08356 g005
Figure 6. Variations of the spectrum of light with the changes in the proportions of sunlight and LED light (3000 K); The proportions for each subfigure are shown in Table 5.
Energies 15 08356 g006
Figure 7. Variations of the spectrum of light with changes in the proportions of sunlight and LED light (5000 K); The proportions for each subfigure are shown in Table 6.
Energies 15 08356 g007
Figure 8. Color temperature of the experimental points plotted on a CIE chart.
Energies 15 08356 g008
Figure 9. Test cell for the experimentation.
Energies 15 08356 g009
Figure 10. Plane view of the sensor setup in the test cell.
Energies 15 08356 g010
Figure 11. Variations of the indoor illuminance with the time (Day 1).
Energies 15 08356 g011
Figure 12. Variations of the indoor illuminance with the time (Day 2).
Energies 15 08356 g012
Figure 13. Variations of the color temperature and outdoor illuminance with the time.
Energies 15 08356 g013
Table 1. Specifications of the Fresnel lens.
Fresnel Lens
Emissivity93%
Thickness5 mm
Distance between0.35 m
Surface area30.48 cm2
TypePMMA
Table 2. Properties of the light sources used during the experimentation.
Light SourceLED LampHalogen LampGlass Optical Fiber
Color temperature5000 K3000 KNumerical aperture (NA)0.57
Luminous efficacy17 lm/W12 lm/WTransmission efficiency at 5 m65%
Power120 W100 WCable diameter8 mm/10 mm
Luminous power2000 lm1800 lmNumber of fibers22,000/32,600
Table 3. Simulation results for the mixed color temperature (K) when sunlight is mixed with LED (3158 K) with different mixing ratios.
CaseSun Light (lux)LED Light (3158 K)Color Temperature (K)
11.00.05321
20.70.34654
30.60.44355
40.40.63962
50.30.73668
60.10.93369
70.01.03157
Table 4. Simulation results for the mixed color temperature (K) when sunlight is mixed with LED (5355 K) with different mixing ratios.
CaseSun Light (lux)LED Light (5355 K) (lux)Color Temperature (K)
11.00.05258
20.70.35285
30.60.45264
40.40.65275
50.30.75292
60.10.95317
70.01.05290
Table 5. Change in the color temperature with the change in the proportion of sunlight and LED light (3000 K).
CaseSun Light (lux)LED Light (3000 K) (lux)Color Temperature (K)
a70004829
b5002004450
c4003004133
d3004003715
e2005003221
f1006003144
g07002968
Table 6. Changes in the color temperature with changes in the proportion of sunlight and LED light (5000 K).
CaseSunlight (lux)LED Light (5000 K) (lux)Color Temperature (K)
a70004673
b5002004412
c4003004377
d3004004700
e2005004624
f1006004597
g07004724
Table 7. Details of the experimental setup (test cell).
ItemDetails
WeatherClear
Measurements9 photo sensors
DimensionsWidth 1500 mm × Length 3000 mm × height 1500 mm
Location33.49° N, 126.50° E
Jeju National University (Engineering Bldg. 2, rooftop)
DurationContinuous Measurement from 9:00 to 17:00
Table 8. Specifications of the illumination sensor (LPPHOTO01) used in the experiment.
ParameterValue
Typical sensitivity0.5–1.5 mV/klux
Measuring range0–200,000
Spectral rangeV(λ)
Calibration accuracy<4%
f’1 (V(λ) match error)<6%
f2 (cosine response/directional error)<3%
f3 (linearity)<1%
F5 (fatigue)<0.5%
Operating temperature0–50 °C
Output impedance0.5–1 kΩ
DimensionsØ 30 mm × 38 mm height
Publisher’s Note: MDPI stays neutral with regard to jurisdictional claims in published maps and institutional affiliations.

