Article

Discharging Behavior of a Fixed-Bed Thermochemical Reactor under Different Charging Conditions: Modelling and Experimental Validation

1
School of Energy and Environmental Engineering, University of Science and Technology Beijing, Beijing 100083, China
2
Birmingham Centre for Energy Storage & School of Chemical Engineering, University of Birmingham, Birmingham B15 2TT, UK
3
Department of Engineering Science, University of Oxford, Parks Road, Oxford OX1 3PJ, UK
*
Authors to whom correspondence should be addressed.
Energies 2022, 15(22), 8377; https://doi.org/10.3390/en15228377
Submission received: 29 September 2022 / Revised: 26 October 2022 / Accepted: 7 November 2022 / Published: 9 November 2022
(This article belongs to the Special Issue Thermal Energy Storage (TES) and Its Applications)

Abstract

:
Thermochemical heat storage has attracted significant attention in recent years due to potential advantages associated with very high-energy density at the material scale and its suitability for long-duration energy storage because of almost zero loss during storage. Despite the potential, thermochemical heat storage technologies are still in the early stage of development and little has been reported on thermochemical reactors. In this paper, our recent work on the charging and discharging behavior of a fixed-bed thermochemical reactor is reported. Silica gels were used as the sorbent for the experimental work. An effective model was established to numerically study the effect of different charging conditions on the discharging behavior of the reactor, which was found to have a maximum deviation of 10.08% in terms of the root mean square error compared with the experimental results. The experimentally validated modelling also showed that the discharging temperature lift increased by 5.84 times by changing the flow direction of the air in the discharging process when the charging level was at 20%. At a charging termination temperature of 51.25 °C, the maximum discharging temperature was increased by 2.35 °C by reducing the charging flow velocity from 0.64 m/s to 0.21 m/s. An increase in the charging temperature and a decrease in the air humidity increased the maximum discharging outlet temperature lift by 3.37 and 1.89 times, respectively.

1. Introduction

Thermal energy accounts for more than half of the global final energy consumption and is responsible for over 40% of global energy-related CO2 emissions [1]. A large portion of such CO2 production is from fossil fuels, making it a major contributor to climate change [2,3]. It is projected that the global thermal energy demand will increase by 17 EJ in 2021–2026 [1]; therefore, there is an urgent need to reduce the carbon emissions associated with this energy demand, and the increased use of renewable energy is clearly one of most effective strategies for achieving this [4,5]. A challenge to this strategy is the mismatch, both in time and space, between the demand and supply of renewable energy. Thermal energy storage provides an effective way to address this challenge. This forms the motivation for this work.
Thermal storage technologies can be broadly classified into three categories: sensible heat storage [6], latent heat storage [7] and thermochemical heat storage [8]. Thermochemical heat storage has some salient advantages, including high-energy density materials and near-zero heat loss during the storage [9]; thus, they have attracted significant attention in recent years. Thermochemical heat storage can be subdivided into sorption-based and reversible reaction-based, though both can involve chemical reactions [10]. Figure 1 shows the basic principle of thermochemical energy storage [11]. During charging, heat storage materials absorb heat generated from renewable or other sources to separate the two substances. For sorption-based thermochemical energy storage, the two substances are known as the sorbent and sorbate, which are stored separately during storage. When there is heat demand, the stored heat is released through discharging and by combining the adsorbent with the adsorbate. This adsorptive thermochemical heat storage is mainly used for low-to-medium temperature applications, e.g., building heating and low-grade industrial waste heat recovery and utilization [12,13].
A key component of the thermochemical heat storage system is the reactor, where the heat and mass transfer as well as chemical reactions take place. An increasing number of studies have demonstrated improvements in the performance of thermochemical reactors. These studies have been mostly examining the following two aspects:
  • One of these aspects is to improve the heat transfer performance of the reactor by, e.g., increasing the contact area of the two substances and adding materials with higher thermal conductivity in the reactor [14,15,16].
  • The other aspect is to introduce heat transfer media in the reactor, which aims to take heat from within the reactor in a timely manner during the discharging process and to bring heat into the reactor quickly [17,18] during charging.
These studies have been mostly been conducted on a small lab-scale or using small pilot-scale thermochemical reactors [19], and the operating conditions for the charging and discharging differ from practical conditions. Little research has been done on the effect of the charging conditions on the reactor performance under industrially relevant conditions [20].
As the renewable energy supply varies with space and time, the thermochemical storage material in the reactor might not be fully charged before thermal energy is needed by the end-users. The humidity of the air differs significantly in different regions. For example, in the middle and lower Yangtze River regions of China, the air temperature can reach approximately 40 °C and the relative humidity of the air can be more than 90% in the summer, while in northwest China, the air temperature is relatively low and the climate is extremely dry [21]. In addition, the amount of industrial waste heat differs in different industrial applications. The heat storage system is more valuable if low-temperature heat sources can be reused to charge the thermochemical heat storage materials. So far, most published studies have used charging temperatures over 100 °C, and few studies have considered the effect of air humidity during the charging process. Moreover, during the charging process, the air outlet temperature cannot be exactly the same as the air inlet temperature, in particular, in the later stage of the charging process, the temperature at the outlet of the reactor increases and the charging efficiency decreases [22]. Therefore, when the air outlet reaches a set temperature, the reactor charging is considered to be complete. When the outlet of the reactor reaches the set temperature during the charging process, different flow rates of hot air will have different effects on the charging level. The ultimate purpose of the charging is the efficient use of the heat that is supplied. The discharging temperature is an important indicator of the discharging performance of the reactor. It is affected indirectly by the charging condition of the reactor. Therefore, it is necessary to study the influence of the charging conditions on the discharging performance and then propose a plan to optimize the discharging performance of the reactor. This paper aimed to address these gaps using a packed-bed reactor with silica gel as the thermochemical heat storage material. Both experimental and numerical modelling were performed. The specific objectives were as follows:
  • To investigate the effect of charging levels on the discharging performance of the reactor and optimize the operation mode.
  • To investigate the effect of temperature and humidity of the inlet air on the reactor discharging performance and to obtain an accurate forecast correlation.
  • To investigate the effect of charging flow rates on the reactor performance at specific charging termination temperatures for increasing the discharging temperature.
A two-dimensional axisymmetric computational fluid dynamics (CFD) model was established, which corresponded to the experimental conditions. The numerical results were compared with the experimental results to validate the model first. The experimentally validated model was then used to investigate the effect of the charging conditions on the discharging air outlet temperature.

2. Experiments

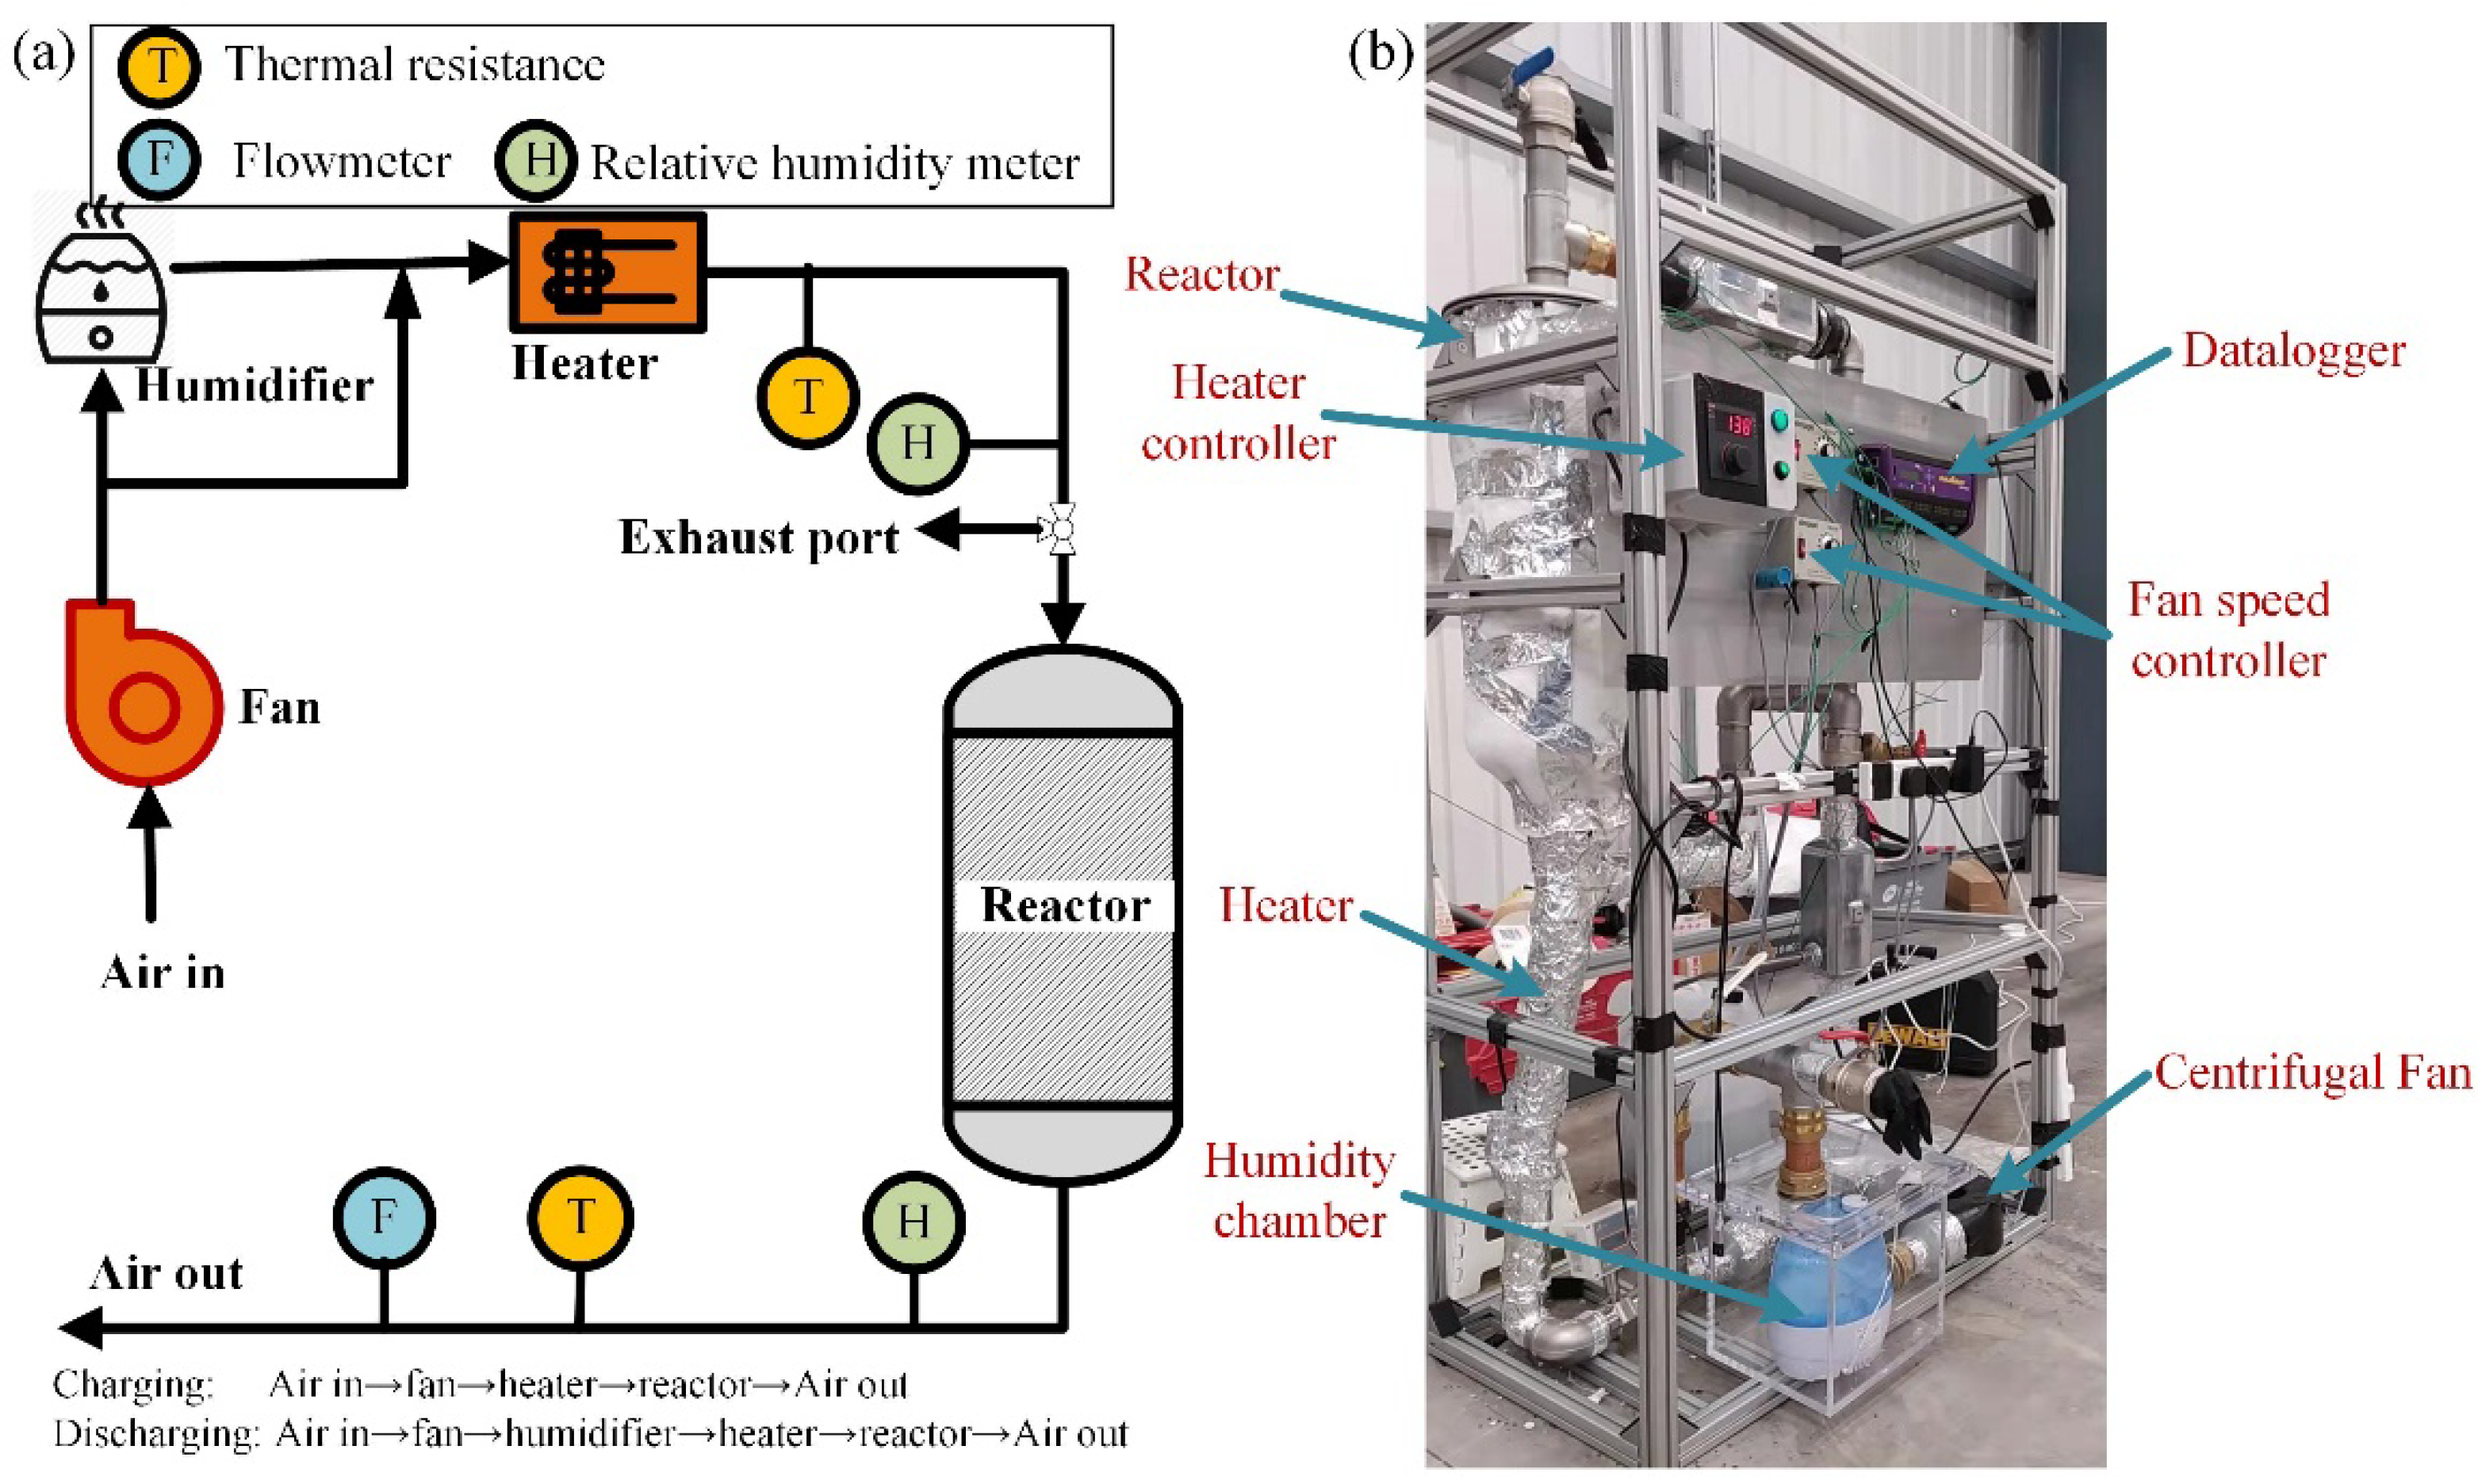
Experimental validation provides the basis for the accuracy of the numerical simulation results. Therefore, we set up an experimental platform for a thermochemical charging and discharging system and studied the temperature change at various positions of the reactor with time, during the charging and discharging processes. The flow chart and physical diagram of the experimental system are shown in Figure 2. During the charging process, the air was driven by the fan and then flowed through the heater and reactor in turn. The materials in the reactor were dehydrated at the air inlet temperature of 100 °C. We considered that the charging was complete when the outlet temperature of the reactor did not increase within one hour. During the discharging process, the air in the environment flowed through the fan, humidifier, heater, and thermochemical reactor in turn. The air carried a certain amount of water vapor into the heater after passing through the humidifier. The air was heated to the specified temperature and the water mist vaporized. Finally, the humid air, with the temperature and humidity adapted to the experimental requirements, entered the thermochemical reactor and was adsorbed by the heat storage materials to release heat. The humid air that did not adapt to the experimental requirements for temperature and humidity was discharged into the environment through the exhaust port. The experimental device and all pipes were wrapped with 50 mm thick glass fiber wool to limit the heat loss in the system.
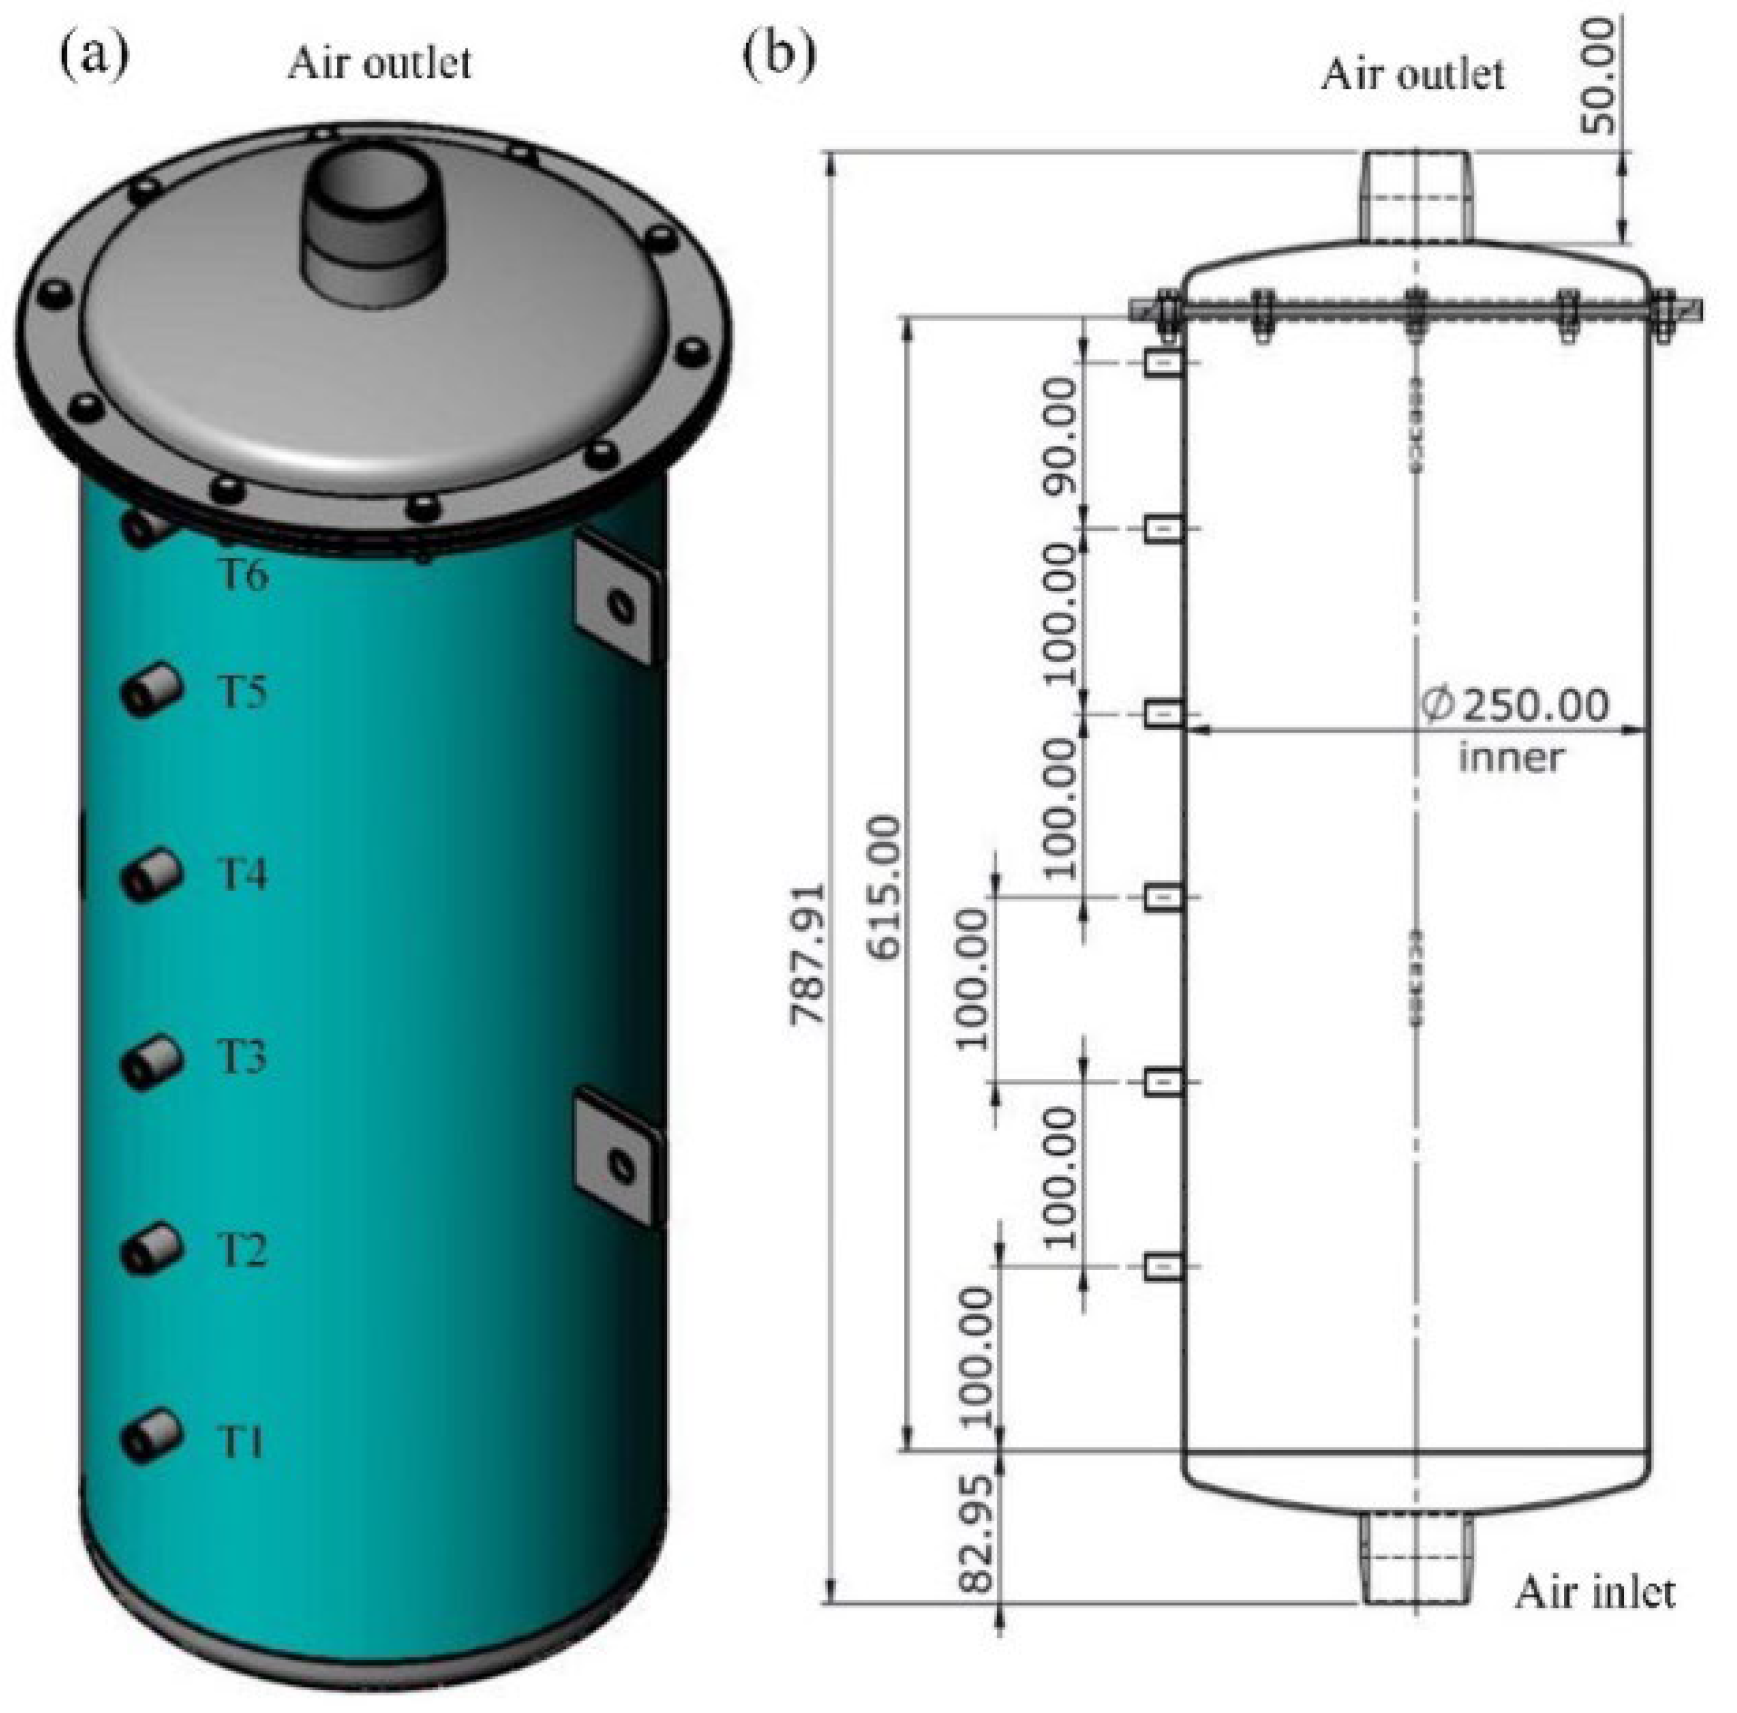
Figure 3 shows a three-dimensional stereogram and dimensional diagram of the fixed-bed reactor. The heat-storing materials had a fill height of 500 mm. The parameters of the silica gels were identical to those of the silica gel used by the authors in their previous work [17]. A wire mesh was added underneath the tube to keep the silica gels in the tube and guarantee that air flowed smoothly through the reactor. Six thermocouples were attached to the side of the reactor to measure how the reactor’s temperature changes as it is charged and discharged. The operating conditions during the experiment are listed in Table 1.

3. Numerical Simulations

During the charging and discharging process, complex heat and mass transfers and chemical reactions take place between the humid air and the silica gel in the reactor. Due to the limited number of measuring points that can be arranged in the reactor, it is difficult to obtain the details of all the parameters in the reactor using an experimental method; however, numerical simulation can compensate for this deficiency.

3.1. Geometric Model

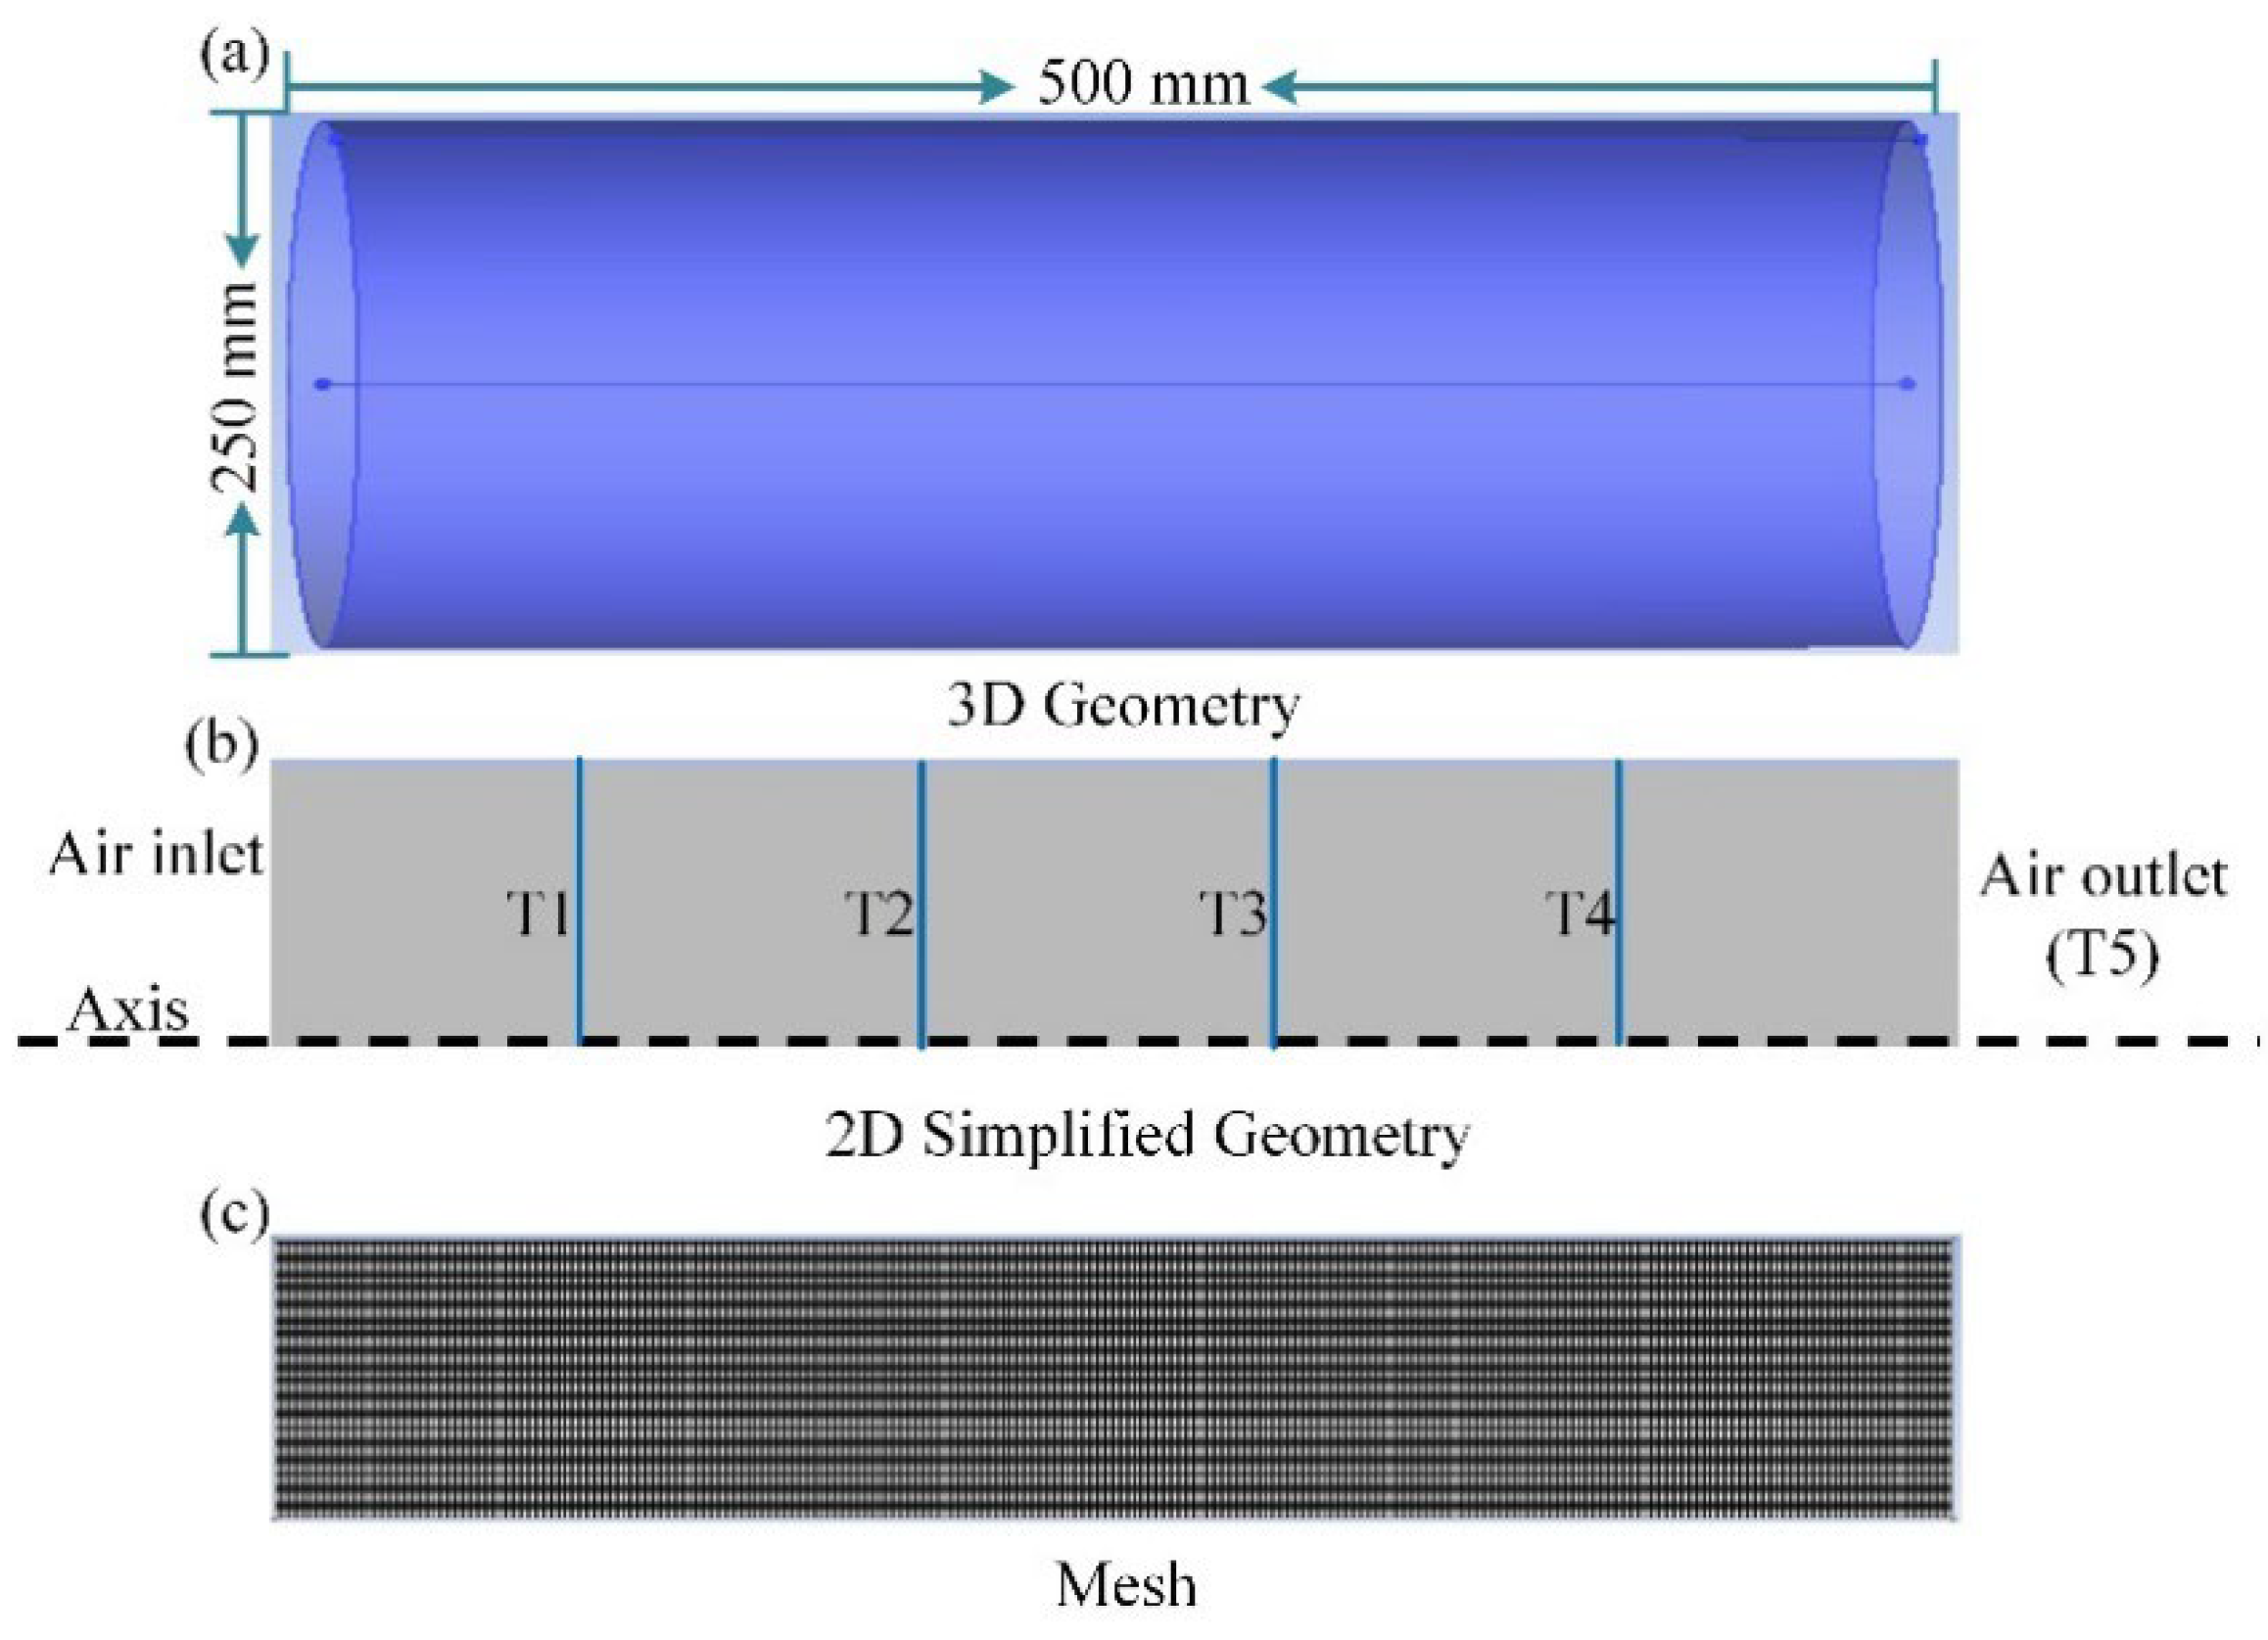
The geometric model for investigating the effect of the charging conditions on the discharging performance of a fixed-bed thermochemical reactor is shown in Figure 4. Figure 4a is a three-dimensional geometric model of the reactor. To reduce the computational resources and speed up the processing, the three-dimensional model was transformed into an axisymmetric model, as shown in Figure 4b. The mesh generated based on the geometric model of Figure 4b is shown in Figure 4c.

3.2. Model Assumptions

The following assumptions were made in the numerical simulation process:
  • The size of the silica gels and bed porosity in the reactor are uniform and do not change with time [23].
  • The thermophysical parameters of heat storage materials and air do not change with time, which is true in actual practice for the low-temperature range [24].
  • Because of the low charging and discharging temperature, the radiative heat transfer in the reactor is neglected and the thermal equilibrium between gas and solid in the reactor is assumed [25].
  • Water vapor in humid air is also considered an ideal gas due to its extremely low content [15].
  • Because of the thicker insulation layer and the lower charging and discharging temperature, it is assumed that the reactor wall is insulated [26].

3.3. Numerical Method and Boundary Conditions

The equations for the conservation of mass, momentum and energy for hydration and dehydration in a fixed-bed reactor are summarized in the authors’ previous work [17]. The same expressions for mass, momentum and energy source phases were used here. The Dubinin–Astakhov (DA) equation was applied to the isothermal adsorption of silica gels with water vapor and it has been validated in numerous studies [27,28]. The linear driving force (LDF) model was used to describe the mass transfer rate of water vapor in silica gels [29]. The velocity-inlet boundary condition was used at the inlet of the reactor, the pressure-outlet boundary condition was used at the outlet of the reactor, the axis boundary conditions were used at the symmetric axis and an adiabatic wall was used at the wall of the reactor. There was no adsorption equilibrium and kinetics model of water vapor adsorption by silica gels in FLUENT. We needed to import the model into FLUENT via a user-defined function (UDF) [17]. The SIMPLE algorithm was used for pressure–velocity coupling, and the second-order upwind method was used for the discretization of convection and diffusion terms. When the normalized residuals were <10−4 for each governing equation, the simulation was convergent.

3.4. Simulation Parameters

The calculation parameters of the numerical simulation and the basic operating conditions of the air are listed in Table 2. The porosity ε b of the bed was measured from the actual reactor. The density and thermal conductivity of the silica gels were provided by the silica gel manufacturer. The range of kinetics parameters of the water absorption reaction of silica gels was obtained by investigating the relevant literature [27] and the relevant parameters were adjusted [25,30] according to the experimental results.

3.5. Validation of Numerical Simulation

The proper number of grids is particularly significant for the accuracy of the simulation results. Therefore, before the simulation calculation, it is necessary to check the grid independence of the model. In this paper, ICEM software was used to establish a two-dimensional geometric model and generate grids. The time required for complete dehydration of the heat storage material in a reactor with complete hydration, and the total energy output of the discharging process within 2.8 h were used as evaluation indicators for mesh-independent testing. With the increase in the number of grids, if the change in the charging completion time and the total energy output of the discharging process within 2.8 h were both less than 5% [31,32], the results of the calculation were considered to be mesh-independent. The criterion for the completion of charging was that the air outlet temperature should be consistent with the air inlet temperature. Table 3 shows the detailed results of the grid independence test, which indicate that the appropriate number of grids was 2576.
Figure 5 shows a comparison of the experimental and numerical simulation results for the transformed fraction [17] and the temperature at different locations (T1, T3, and outlet) of the reactor during the charging and discharging process. The “time 0” signifies the time that “the reaction starts”. The results indicate that the maximum temperature in the numerical simulation of both the charging and discharging processes is slightly higher than that in the experiment. On the one hand, the reactor radiates heat outwards through the pipe wall; on the other hand, the reactor and the insulation layer outside the reactor also absorb part of the heat. Figure 5b shows the discharging process of the reactor. The experimental temperature gradually exceeded the numerical simulation temperature as the reaction proceeded. This may be due to the release of sensible heat absorbed by the reactor and the insulation at the early stage of discharging. To quantitatively illustrate the proximity of the numerical simulation to the experimental results, the root mean square percentage error (RMSPE) [33] was used as an evaluation index. RMSPE can be used to characterize the deviation between the numerical simulation and the experimental data, which indirectly indicates the accuracy of the model. The expression of RMSPE is as follows:
R M S P E = 1 N i = 1 n O i F i O i 2 · 100  
where O i is the ith experimental value, F i is the ith numerical simulation value and N is the total number of experiments. Among the six groups of data shown in Figure 5, the maximum RMSPE between the experimental and numerical simulation results was 10.08%. An RMSPE < 10% indicates that the model forecast is fairly accurate, whereas 10% < RMSPE < 20% indicates that the model forecast is accurate [34]. Therefore, the numerical simulation is in good agreement with the experimental results.

4. Result and Discussion

4.1. The Effect of Charging Level on Outlet Temperature of Discharging

In this section, the effect of different charging levels on the outlet temperature of the discharging reactions was studied under the following charging conditions: an air inlet temperature of 100 °C, a water vapor mass fraction of 1.44%, and an air flow velocity of 0.428 m/s. Figure 6 shows the changes in the reactor outlet temperature, average water content (AWC) of the materials, and the charging level with the charging time during the charging process. The outlet temperature of the reactor increased rapidly to about 37 °C. Then, the temperature started to increase very slowly. In the subsequent process of charging, the temperature at the reactor outlet rose again rapidly. Finally, the charging was completed with a slow temperature rise. The AWC of the thermal storage material in the reactor in the early stage of charging showed an almost equal slope decrease, which corresponds to the almost unchanged temperature at the reactor outlet during this period. This is determined by the equilibrium of the adsorption and desorption and the dynamic properties of the silica gel. The charging levels (20%, 40%, 60% and 80%) shown in Figure 6 were calculated from the AWC of the materials in the reactor. The charging level (CL) is defined as:
C L = 1 A W C 0.346 × 100 %
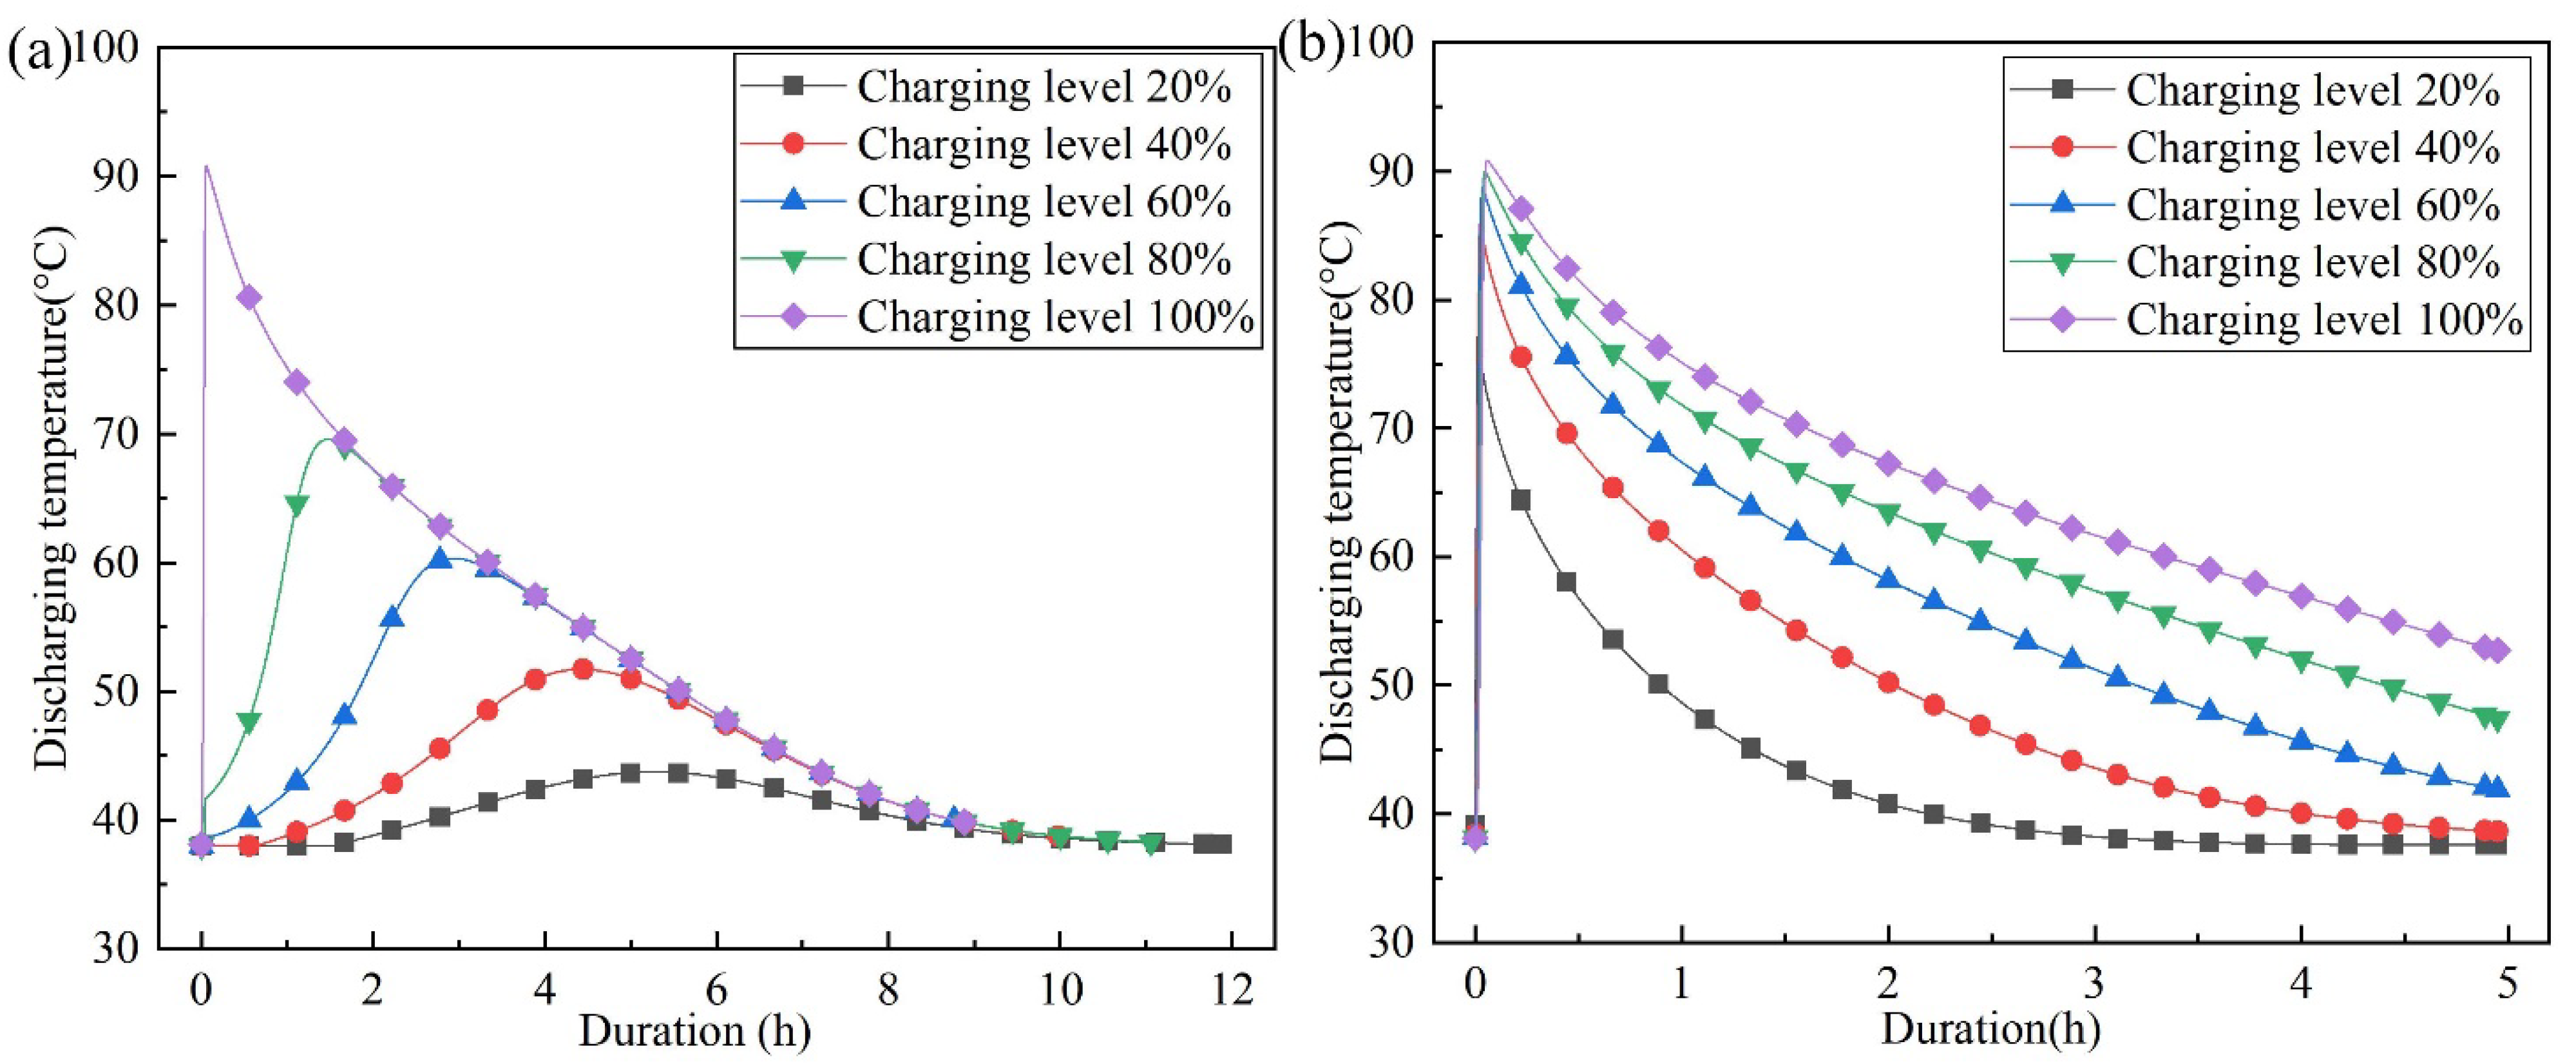
Figure 7a shows the variation in the air outlet temperature with time for different charging levels when the air flow direction is the same for the charging and discharging processes. When the charging level was 100%, the maximum outlet temperature in the discharging process reached 92.34 °C. When the charging level is 80%, the maximum outlet temperature was only 69.46 °C. The highest temperature lift only reached 57.89% of that in the fully charged case. As the charging level decreases, the time for the air outlet to reach the maximum temperature during the discharging process was greatly extended. When the charging level is 20%, it takes 5 h for the air outlet temperature to reach its maximum. This seriously reduces the sensitivity of the system response. The reason for this phenomenon can be explained by Figure 8. In Figure 8a, when the charging level reached 40%, the energy source phase in the reactor was less than 0, which means that all the materials in the reactor were absorbing heat. The absolute value of the energy source phase was the highest and the charging reaction was the strongest at the position of 200 mm from the reactor inlet. When the discharging reaction lasted for 400 s, the energy source phase at the reactor inlet was more than 0 and the heat storage material was releasing heat, while the energy source phase at 210 mm from the reactor inlet was obviously less than 0. This indicates that the heat storage material was undergoing a charging reaction at this location. Similarly, it can be seen from Figure 8b that the water content of the materials at the reactor inlet increased when the discharging reaction proceeded to 400 s, while the water content of the material in the reactor at 210 mm from the reactor inlet decreased. Therefore, in the case of incomplete charging, if the air flow direction in the discharging process is the same as that in the charging process, the dehydration reaction and hydration reaction of the materials in the reactor will occur at the same time, which significantly reduces the discharging performance of the reactor. Therefore, in the numerical simulation of the discharging reaction, we exchanged the inlet and outlet of air. Figure 7b shows the time-dependent change in the reactor outlet temperature during the discharging reaction after changing the air inlet of the charging reaction into the air outlet of the discharging reaction. In the initial stage of the discharging reaction, the outlet temperature of the reactor quickly reached its peak. The system sensitivity and outlet temperature were significantly improved. When the charging level was 20%, the maximum temperature lift of the air outlet increased from 5.73 °C to 39.22 °C, which is 6.84 times the original temperature lift.

4.2. The Effect of Charging Air Velocity on Outlet Temperature of Discharging Reaction

The effect of different charging air inlet velocities on the outlet temperature of the discharging reaction was studied under the following conditions: the air inlet temperature was 80 °C and the water vapor mass fraction was 1.44%. Before discussing the effect of charging air velocity on the outlet temperature of the discharging reaction, the termination temperature of the charging process needs to be specified. Figure 9a shows the change in the air outlet temperature over time during the complete charging process at different charging flow velocities. However, in the practical charging process, the air outlet temperature cannot be the same as the inlet temperature. At the end of the charging reaction, the charging efficiency is extremely low and most of the heat is carried out of the reactor by air. Therefore, the practical charging process is considered to be finished when the air outlet temperature reaches a certain value. Here, we chose 51.25 °C as the termination temperature for the charging process. Figure 9b is a numerical simulation of the discharging process based on these charging results. In the previous section, it was demonstrated that when the heat was released under conditions of incomplete charging, a higher discharging temperature could be obtained when the air flow direction in the discharging process is opposite to that in the charging process. Therefore, different flow directions were still used for charging and discharging. As shown in Figure 9b, the lower the charging air flow velocity, the higher the discharging temperature, and this phenomenon became more apparent as the discharging time increased. Figure 9 shows that when the discharging time reached 4.25 h, the discharging temperature at the charging air velocity of 0.214 m/s was 2.35 °C higher than that at the charging flow velocity of 0.642 m/s. This is because the charging time was longer at a lower charging air velocity, although the outlet temperatures of the charging process were the same. Furthermore, more heat was absorbed in the reactor and more dehydration of the material. Figure 10 shows the water content distribution cloud of the material in the reactor at different charging air velocities when the outlet temperature of the charging process reaches 51.25 °C. The lower the charging air velocity, the lower the water content of the materials in the reactor. This results in higher outlet temperatures during the discharging process.

4.3. The Effect of Charging Temperature and Water Vapor Mass Fraction on the Outlet Temperature of the Discharging Reaction

In this section, when the water vapor content in the air is 3.52% and 1.44% respectively, the influence of different charging temperatures on the outlet temperature of the discharging process was studied under the condition where the air flow velocity was 0.428 m/s and the outlet temperature of the charging process reached the same as the inlet temperature. Figure 11a shows the change in the AWC of the heat storage material in the reactor over time with a mass fraction of 3.52% water vapor in the air during the charging process. Regardless of the charging temperature, the AWC of the heat storage material in the reactor finally tends to a certain value. When the charging is complete, the higher the charging temperature, the lower the AWC of the heat storage materials in the reactor. The discharging reaction shown in Figure 11b was performed based on the charging process shown in Figure 11a. The initial AWC of the discharging reaction is the AWC of the material after the charging reaction. As the charging temperature increases, the maximum temperature (or maximum temperature lift) of the discharging reaction increases. This is due to the high charging temperature in the previous stage, which decreased the water content in the material. The low water content of the materials after charging increases the heat storage capacity of the materials on the one hand, and accelerates the discharging rate at the discharging stage on the other hand. When the charging temperature increased from 60 °C to 140 °C, the maximum temperature lift during the discharging process increased from 16.29 °C to 54.96 °C, which was 3.37 times the original. Although the maximum temperature of the discharging process and the heat storage capacity of the reactor decreased, the discharging temperature curve of the reactor became smooth. The outlet temperature of the reactor could be maintained at 54.1 °C for 2.5 h during the discharging process when the charging temperature was 60 °C and the temperature fluctuation did not exceed 0.2 °C. This will significantly reduce the load adjustment burden of the heat storage system.
Air with a vapor mass fraction of 3.53% is a common occurrence in summer in southern China, while northwest China mostly has a dry climate with low air humidity. Figure 12 shows the time-dependent change in the reactor outlet temperature during the discharging process when the mass fraction of water vapor in the air was 1.45% during charging. Compared to Figure 11b and Figure 12, a decrease in water vapor content in the air at the same charging temperature led to a larger discharging temperature lift, which is because the reduction in the initial water content of the materials in the reactor enhanced the heat storage capacity of the materials, and hence increased the reaction rate of the discharging reaction. When the charging temperature is 60 °C, if the water vapor content in the air is reduced from 3.53% to 1.45%, the maximum temperature lift at the air outlet during the discharging process will increase from 16.29 °C to 30.83 °C, which is 1.89 times the original.
Based on the above analysis, when the temperature and humidity of the air during the charging process are changed, the average water content of the material when the charging is completed will change correspondingly, and thus the discharging temperature will also change. The maximum discharging temperature represents the discharging performance of the reactor to a certain extent. Therefore, we integrated the effects of the air temperature and water vapor content during the charging process on the maximum outlet temperature of the discharging reaction, as shown in Figure 13. It can be seen from Figure 13a that with the increase in the water vapor mass fraction in the air during the charging process, the maximum outlet temperature of the discharging process gradually decreased. This is because too much water vapor in the charging process inhibited the dehydration of the material. When the charging temperature is low, the decreasing trend in the maximum outlet temperature slowed down with the increase in the water vapor mass fraction of the charging process. When the charging temperature is high, the decreasing trend of the maximum outlet temperature gradually becomes faster with the increase in the water vapor mass fraction of the charging process. This is because, under conditions of a high charging temperature and low water vapor mass fraction, the charging temperature plays a major role in deciding the final water content of the material when the charging is completed. With the increase in the water vapor mass fraction, the influence of the water vapor mass fraction is more and more obvious. However, under the conditions of a low charging temperature and low water vapor mass fraction, the influence of the water vapor mass fraction was significant, and the material had little water loss. With the increase in the water vapor mass fraction, the ability of the material to further reduce the water loss will also decrease. As shown in Figure 13b, with the increase in the charging temperature, the maximum discharging temperature also increases, but the degree of increase gradually slows down. This is because when the charging temperature increases to a certain extent, the water loss in the materials is close to the maximum. If the charging temperature continues to increase, the increase in the water loss will become smaller and smaller.
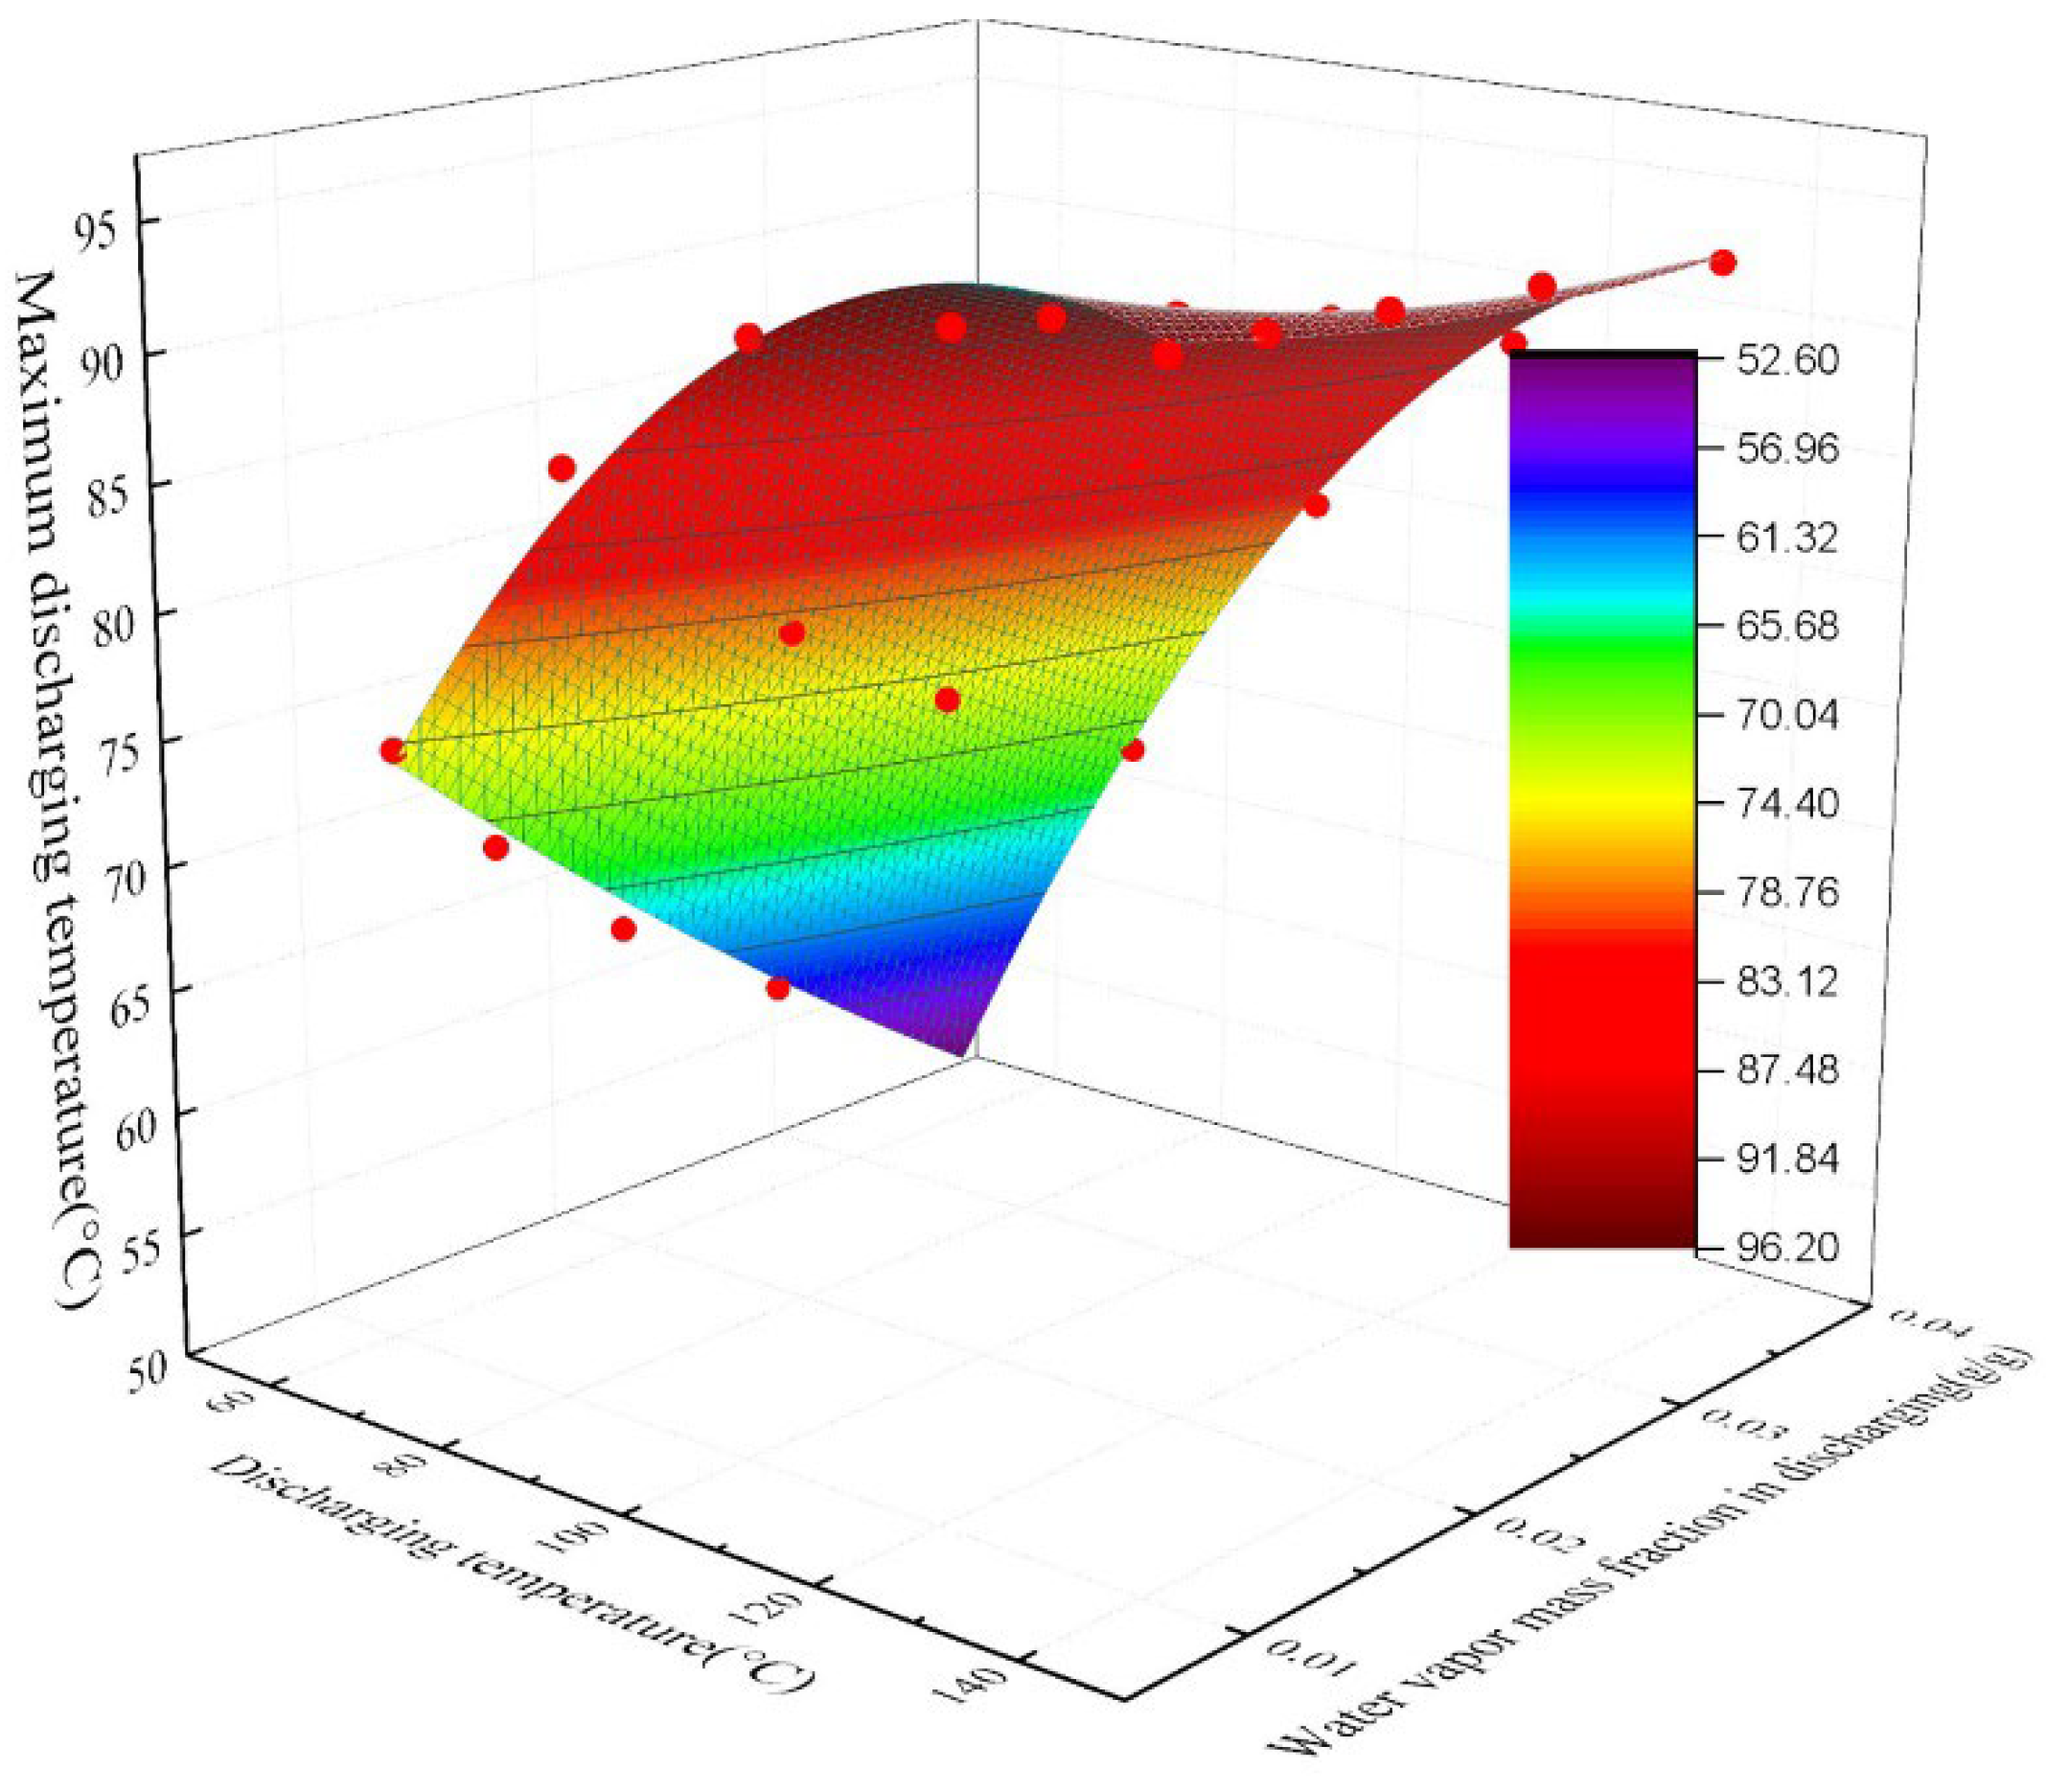
In practical engineering applications, the discharging temperature of the reactor needs to be predicted promptly to determine whether further treatment of the air temperature and the humidity during the charging process is required in areas with different heat source temperatures and water vapor content in the humid air. Therefore, the relationship between the air temperature, the water vapor mass fraction in the air in the charging process and the maximum air outlet temperature in the discharging process was fitted with a nonlinear curved surface. The fitting model was “Poly2D”. Figure 14 shows the fitted surface. The fitted maximum discharging temperature formula is as follows:
T m a x d = 31.13191 + 1.19447 × T c 16.6392693 × w c 0.00513 × T c 2 + 0.543212151 × w c 2 + 0.0956669 × T c × w c
where T c is air inlet temperature during charging, °C;   w c is the mass fraction of water vapor in the air during charging, %. After the surface was fitted, the R-square (COD) was 0.99609. This demonstrated that the fitted expression was accurate. In addition, according to the conditions used in the calculation process, the conditions for the application of Equation (3) are: an air velocity of 0.428 m/s for charging and discharging; an air inlet temperature of 38 °C and a relative humidity of 80% during the discharge process.

5. Conclusions

According to the possible operating charging conditions, the charging and discharging processes of a fixed-bed thermochemical reactor with silica gel as the heat storage material were simulated numerically in this paper. Firstly, the geometrical and mathematical models of the heat and mass transfer and chemical reaction between the air and silica gel were established. Then, the validity of the model was proved by comparing the numerical simulation and experimental results with a maximum RMSPE of 10.08%. Finally, the effect of different charging conditions on the discharging performance of the reactor was studied. The influence mechanism of the charging process on the discharging temperature was clarified, and the problem of the low discharging temperature under incomplete charging conditions was effectively solved. Under the condition of complete charging, the effects of different climates and charging heat sources on the discharging temperature were obtained, and approaches to increase the discharging temperature were further proposed.
The main conclusions of this study are as follows:
  • Under the condition of incomplete charging, higher discharging temperatures can be achieved when the air flow direction of the discharging process is opposite to that of the charging process. When the charging level is 20%, the maximum temperature lift of the air outlet increases from 5.73 °C to 39.22 °C, which is 6.84 times the original temperature lift.
  • At the same charging termination temperature, a lower charging flow velocity can achieve a higher charging level. This leads to higher discharging temperatures. The discharging temperature at 0.214 m/s is 2.35 °C higher than that at 0.642 m/s when the charging termination temperature is 51.25 °C.
  • To achieve the same discharging result, higher charging temperatures are required in areas with high water vapor content in the air. A heat source with a lower temperature can be used for charging in areas with low water vapor content in the air. The numerical simulation data shows that the relationship between the maximum discharging temperature and the charging temperature and the water vapor content in the air is fitted.
  • Increasing the charging temperature and decreasing the water vapor content in the air increases the maximum outlet temperature lift to 3.37 and 1.89 times during the discharging process, respectively.

Author Contributions

Data curation, M.J.; Investigation, C.W., H.M., A.A., H.Y., M.J., J.C., L.T. and L.W.; Methodology, C.W., H.M., H.Y., B.Z., B.N., L.T. and L.W.; Software, C.W. and A.A.; Supervision, B.N. and L.T.; Writing–original draft, C.W.; Writing–review & editing, C.W., H.M., B.Z. and Y.D. All authors have read and agreed to the published version of the manuscript.

Funding

This work was supported by University of Science & Technology Beijing for PhD scholarships for Chengcheng Wang and Hui Yang and also supported by the UK Engineering and Physical Sciences Research Council (EPSRC) under Grants EP/P003605/1, EP/V012053/1, EP/T022981/1 and EP/S0326221/1.

Data Availability Statement

The data in this study is available on requests from the corresponding author.

Conflicts of Interest

The authors declare no conflict of interest.

References

  1. Renewables. 2021. Available online: https://www.iea.org/reports/renewables-2021 (accessed on 11 June 2022).
  2. Renewable and Non-Renewable Heat Consumption and Heat-Related CO2 Emissions in Buildings, 2010–2020. Available online: https://www.iea.org/data-and-statistics/charts/renewable-and-non-renewable-heat-consumption-and-heat-related-CO2-emissions-in-buildings-2010-2020 (accessed on 24 December 2021).
  3. Global Energy Review. 2021. Available online: https://www.iea.org/reports/global-energy-review-2021 (accessed on 11 June 2022).
  4. van Soest, H.L.; den Elzen, M.G.J.; van Vuuren, D.P. Net-zero emission targets for major emitting countries consistent with the Paris Agreement. Nat. Commun. 2021, 12, 2140. [Google Scholar] [CrossRef] [PubMed]
  5. Allen-Dumas, M.R.; Rose, A.N.; New, J.R.; Omitaomu, O.A.; Yuan, J.; Branstetter, M.L.; Sylvester, L.M.; Seals, M.B.; Carvalhaes, T.M.; Adams, M.B.; et al. impacts of the morphology of new neighborhoods on microclimate and building energy. Renew. Sustain. Energy Rev. 2020, 133, 110030. [Google Scholar] [CrossRef]
  6. Miliozzi, A.; Dominici, F.; Candelori, M.; Veca, E.; Liberatore, R.; Nicolini, D.; Torre, L. Development and Characterization of Concrete/PCM/Diatomite Composites for Thermal Energy Storage in CSP/CST Applications. Energies 2021, 14, 4410. [Google Scholar] [CrossRef]
  7. Chen, H.; Zhao, R.; Wang, C.; Feng, L.; Li, S.; Gong, Y. Preparation and Characterization of Microencapsulated Phase Change Materials for Solar Heat Collection. Energies 2022, 15, 5354. [Google Scholar] [CrossRef]
  8. Critoph, R.E.; Pacho, A.M.R. District Heating of Buildings by Renewable Energy Using Thermochemical Heat Transmission. Energies 2022, 15, 1449. [Google Scholar] [CrossRef]
  9. Yang, Y.; Li, Y.; Yan, X.; Zhao, J.; Zhang, C. Development of Thermochemical Heat Storage Based on CaO/CaCO3 Cycles: A Review. Energies 2021, 14, 6847. [Google Scholar] [CrossRef]
  10. Aydin, D.; Casey, S.P.; Riffat, S. The latest advancements on thermochemical heat storage systems. Renew. Sustain. Energy Rev. 2015, 41, 356–367. [Google Scholar] [CrossRef]
  11. Abedin, A.H.; Rosen, M.A. Closed and open thermochemical energy storage: Energy- and exergy-based comparisons. Energy 2012, 41, 83–92. [Google Scholar] [CrossRef]
  12. van Alebeek, R.; Scapino, L.; Beving, M.A.J.M.; Gaeini, M.; Rindt, C.C.M.; Zondag, H.A. Investigation of a household-scale open sorption energy storage system based on the zeolite 13X/water reacting pair. Appl. Therm. Eng. 2018, 139, 325–333. [Google Scholar] [CrossRef]
  13. Helaly, H.; El-Sharkawy, I.; Kandel, A.; Awad, M. A study on thermal energy storage using open adsorption system. MEJ. Mansoura Eng. J. 2020, 43, 34–43. [Google Scholar] [CrossRef]
  14. Aydin, D.; Casey, S.P.; Chen, X.; Riffat, S. Novel “open-sorption pipe” reactor for solar thermal energy storage. Energy Convers. Manag. 2016, 121, 321–334. [Google Scholar] [CrossRef]
  15. Li, W.; Guo, H.; Zeng, M.; Wang, Q. Performance of SrBr2·6H2O based seasonal thermochemical heat storage in a novel multilayered sieve reactor. Energy Convers. Manag. 2019, 198, 111843. [Google Scholar] [CrossRef]
  16. Zhang, H.; Liu, S.; Shukla, A.; Zou, Y.; Han, X.; Shen, Y.; Yang, L.; Zhang, P.; Kusakana, K. Thermal performance study of thermochemical reactor using net-packed method. Renew. Energy 2022, 182, 483–493. [Google Scholar] [CrossRef]
  17. Wang, C.; Yang, H.; Nie, B.; Zou, B.; Li, Z.; Han, J.; Tong, L.; Wang, L.; Ding, Y. Discharging behavior of a shell-and-tube based thermochemical reactor for thermal energy storage: Modeling and experimental validation. Int. J. Heat Mass Transf. 2022, 183, 122160. [Google Scholar] [CrossRef]
  18. Bouché, M.; Richter, M.; Linder, M. Heat transformation based on CaCl2/H2O—Part B: Open operation principle. Appl. Therm. Eng. 2016, 102, 641–647. [Google Scholar] [CrossRef] [Green Version]
  19. Salgado-Pizarro, R.; Calderón, A.; Svobodova-Sedlackova, A.; Fernández, A.I.; Barreneche, C. The relevance of thermochemical energy storage in the last two decades: The analysis of research evolution. J. Energy Storage 2022, 51, 104377. [Google Scholar] [CrossRef]
  20. Zhao, Y.; Zhao, C.Y.; Markides, C.N.; Wang, H.; Li, W. Medium- and high-temperature latent and thermochemical heat storage using metals and metallic compounds as heat storage media: A technical review. Appl. Energy 2020, 280, 115950. [Google Scholar] [CrossRef]
  21. National Meteorological Science Data Center. Available online: http://data.cma.cn/ (accessed on 25 June 2022).
  22. Han, X.C.; Xu, H.J.; Zhao, C.Y. Design and performance evaluation of multi-layered reactor for calcium-based thermochemical heat storage with multi-physics coupling. Renew. Energy 2022, 195, 1324–1340. [Google Scholar] [CrossRef]
  23. Manila, M.R.; Mitra, S.; Dutta, P. Studies on dynamics of two-stage air cooled water/silica gel adsorption system. Appl. Therm. Eng. 2020, 178, 115552. [Google Scholar] [CrossRef]
  24. Farcot, L.; le Pierrès, N.; Michel, B.; Fourmigué, J.-F.; Papillon, P. Numerical investigations of a continuous thermochemical heat storage reactor. J. Energy Storage 2018, 20, 109–119. [Google Scholar] [CrossRef]
  25. Michel, B.; Neveu, P.; Mazet, N. Comparison of closed and open thermochemical processes, for long-term thermal energy storage applications. Energy 2014, 72, 702–716. [Google Scholar] [CrossRef] [Green Version]
  26. Xu, C.; Xie, Y.; Liao, Z.; Ren, Y.; Ye, F. Numerical study on the desorption process of a thermochemical reactor filled with MgCl2·6H2O for seasonal heat storage. Appl. Therm. Eng. 2019, 146, 785–794. [Google Scholar] [CrossRef]
  27. Mohammed, R.H.; Mesalhy, O.; Elsayed, M.L.; Hou, S.; Su, M.; Chow, L.C. Physical properties and adsorption kinetics of silica-gel/water for adsorption chillers. Appl. Therm. Eng. 2018, 137, 368–376. [Google Scholar] [CrossRef]
  28. Younes, M.M.; El-Sharkawy, I.I.; Kabeel, A.E.; Uddin, K.; Miyazaki, T.; Saha, B.B. Characterization of silica gel-based composites for adsorption cooling applications. Int. J. Refrig. 2020, 118, 345–353. [Google Scholar] [CrossRef]
  29. Sircar, S.; Hufton, J. Why does the linear driving force model for adsorption kinetics work? Adsorption 2000, 6, 137–147. [Google Scholar] [CrossRef]
  30. Zeng, C.; Liu, S.; Yang, L.; Han, X.; Song, M.; Shukla, A. Investigation of a three-phase thermochemical reactor through an experimentally validated numerical modelling. Appl. Therm. Eng. 2019, 162, 114223. [Google Scholar] [CrossRef]
  31. Wang, F.-L.; He, Y.-L.; Tang, S.-Z.; Kulacki, F.A.; Tao, Y.-B. Particle filtration characteristics of typical packing granular filters used in hot gas clean-up. Fuel 2018, 234, 9–19. [Google Scholar] [CrossRef]
  32. Yu, Y.; Tao, Y.; He, Y.; He, Y.-L. Structure optimization of granular bed filter for industrial flue gas filtration containing coagulative particles: An experimental and numerical study. Adv. Powder Technol. 2020, 31, 2244–2256. [Google Scholar] [CrossRef]
  33. Bellia, L.; Błaszczak, U.; Fragliasso, F.; Gryko, L. Matching CIE illuminants to measured spectral power distributions: A method to evaluate non-visual potential of daylight in two European cities. Sol. Energy 2020, 208, 830–858. [Google Scholar] [CrossRef]
  34. DeLurgio, S.A. Forecasting Principles and Applications; McGraw-Hill/Irwin: Boston, MA, USA, 1998. [Google Scholar]
Figure 1. Processes in TCES cycle: charging, storing and discharging [11].
Energies 15 08377 g001
Figure 2. (a) The flow chart and (b) an image of the physical system.
Energies 15 08377 g002
Figure 3. (a) 3D stereogram and (b) dimensional diagram of the fixed-bed reactor (Unit: mm).
Energies 15 08377 g003
Figure 4. Fixed-bed reactor. (a) Three-dimensional geometric model; (b) two-dimensional geometric model; (c) computational mesh.
Energies 15 08377 g004
Figure 5. Comparison of experimental and numerical simulation results for (a) the charging and (b) discharging process of the fixed-bed reactor.
Energies 15 08377 g005
Figure 6. The change in the temperature at the reactor outlet, the average water content of materials and charging level with time.
Energies 15 08377 g006
Figure 7. Temperature at air outlet varies with time when (a) the direction of the charging and discharging air flow is the same and (b) the direction of the charging and discharging air flow is opposite.
Energies 15 08377 g007
Figure 8. Distribution cloud of (a) energy source phase and (b) water content of materials in the reactor after the charging and at 400 s of the discharging under the condition of a charging level of 40%.
Energies 15 08377 g008
Figure 9. (a) Temperature at the charging air outlet and (b) temperature at discharging air outlet varies with time at different air inlet velocities of charging.
Energies 15 08377 g009
Figure 10. Distribution cloud of the water content of materials in the reactor when the outlet temperature of the charging process reached 51.25 °C at different air inlet velocities of charging.
Energies 15 08377 g010
Figure 11. (a) Change in the average water content in the reactor during the charging process; (b) change in the air outlet temperature during the discharging process (mass fraction of water vapor during the charging process is 3.53%) varies with time.
Energies 15 08377 g011
Figure 12. Change in air outlet temperature with time in discharging process under different charging temperatures (mass fraction of water vapor in charging process is 1.45%).
Energies 15 08377 g012
Figure 13. Change of maximum discharging temperature with (a) mass fraction of water vapor in the air and (b) charging temperature.
Energies 15 08377 g013
Figure 14. Three-dimensional curved surface of maximum discharging temperature as a function of the water vapor mass fraction and charging temperature in the charging process.
Energies 15 08377 g014
Table 1. Operating conditions for charging and charging experiments.
ParameterUnitChargingDischarging
Temperature at air inlet°C10038
Relative humidity at air inlet-75% (25 °C)80%
Air inlet velocitym/s0.4280.428
Initial temperature in reactor°C2038
Initial water adsorption of silica gelg/g0.346-
Table 2. Calculation parameters of the numerical simulation and the basic operating conditions of air and water.
ParameterSymbolValueUnit
Bed porosity ε b 0.438-
Silica gel conductivity λ p 0.35 W / m · K
Silica gel density ρ p 1.2 × 10³ kg / m 3
Activation energy E a 4.15 × 10⁴ J / mol
Pre-exponential factor D 0 1.3 × 10⁻³ m 2 / s
Maximum adsorption capacity W 0 0.346 kg / kg
Characteristic energy of adsorptionE3800(J/mol)
Heterogeneity parametern1.6-
Silica gel particle diameter d p 4 × 10⁻³m
Table 3. Results of the mesh-independence test.
Grid TypeNumber of GridsCharging Completion TimeThe Total Energy Output
Rougher grid128810,687 s9847.53 kJ
Medium grid25769802 s9032.15 kJ
Finer grid51529934 s8723.97 kJ
Publisher’s Note: MDPI stays neutral with regard to jurisdictional claims in published maps and institutional affiliations.