Article

Total Cost of Ownership of Light Commercial Electrical Vehicles in City Logistics

by
Ewelina Sendek-Matysiak
1,*,
Dariusz Pyza
2,
Zbigniew Łosiewicz
3 and
Wojciech Lewicki
4
1
Faculty of Management and Computer Modeling, Kielce University of Technology, al. Tysiąclecia Państwa Polskiego 7, 25-314 Kielce, Poland
2
Faculty of Transport, Warsaw University of Technology, ul. Koszykowa 75, 00-662 Warsaw, Poland
3
Department of Maritime Technology, West Pomeranian University of Technology in Szczecin, al. Piastów 41, 71-065 Szczecin, Poland
4
Faculty of Economics, West Pomeranian University of Technology Szczecin, Zołnierska 47, 71-210 Szczecin, Poland
*
Author to whom correspondence should be addressed.
Energies 2022, 15(22), 8392; https://doi.org/10.3390/en15228392
Submission received: 30 August 2022 / Revised: 23 October 2022 / Accepted: 8 November 2022 / Published: 10 November 2022
(This article belongs to the Section E: Electric Vehicles)

Abstract

:
The process of urbanisation is one of the most characteristic features of the 20th century and the beginning of the 21st century. All economic and demographic forecasts indicate that the process of urbanisation will continue to develop dynamically. Continuous urbanisation generates a number of problems that are connected with issues such as urban freight transport, i.e., the problem of traffic congestion, noise and air pollution. Therefore, recent years have seen a dynamic growth in programmes intended to alleviate the negative impact of transport on the urban environment. A number of international projects have been implemented or initiated and resulted in the development of interesting solutions that enabled the rationalisation of transport and contributed to the development of sustainable urban logistics, e.g., BESTUFS, CITY PORTS, CityLog, CityMove, C-LIEGE, FREIGHTWISE, GRASS, NOVELOG, SMARTFREIGHT and SUGAR. Especially worthy of note amongst those initiatives are those which are concentrated on the implementation of BEVs (Battery Electric Vehicles). The authors of this paper have compared selected vehicles of the same brand and the same manufacturer, with the only difference being their N1 category power source (commercial vehicles with GVW of up to 3.5 tonnes), that are commonly used for the distribution of goods in urban conditions. The main purpose of the analysis was to answer the following question: can an electrical commercial vehicle compete in everyday use with a combustion-powered vehicle in the current market conditions? To this end, the authors developed a formula to calculate the total cost of ownership, in which all key criteria for vehicle use were taken into account, utilizing a scenario method. The utilitarian value of this research arises from the fact that Poland and its problems related to the issues analysed can serve as a source of preliminary analysis for other countries.

1. Introduction

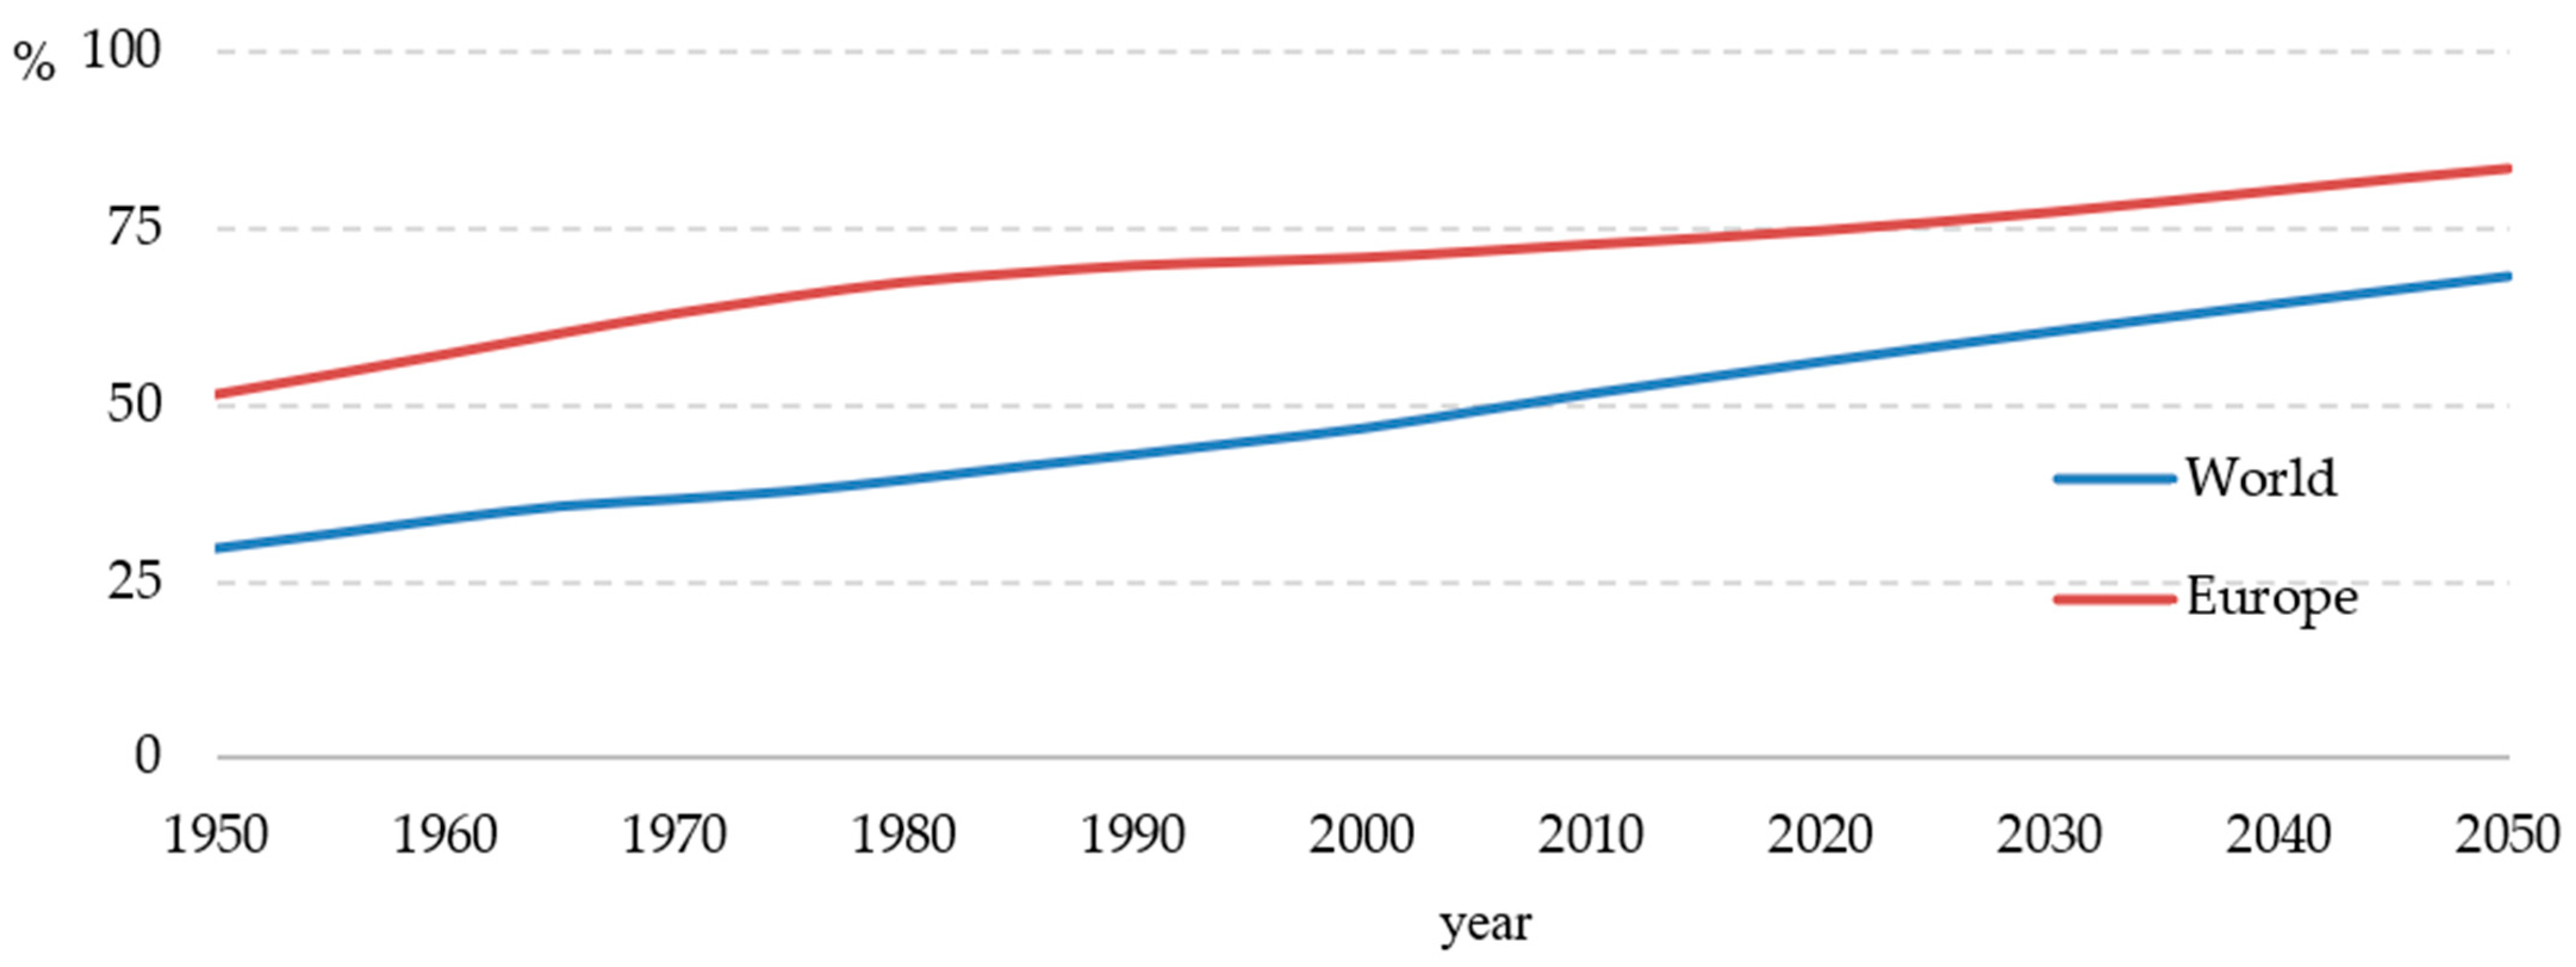
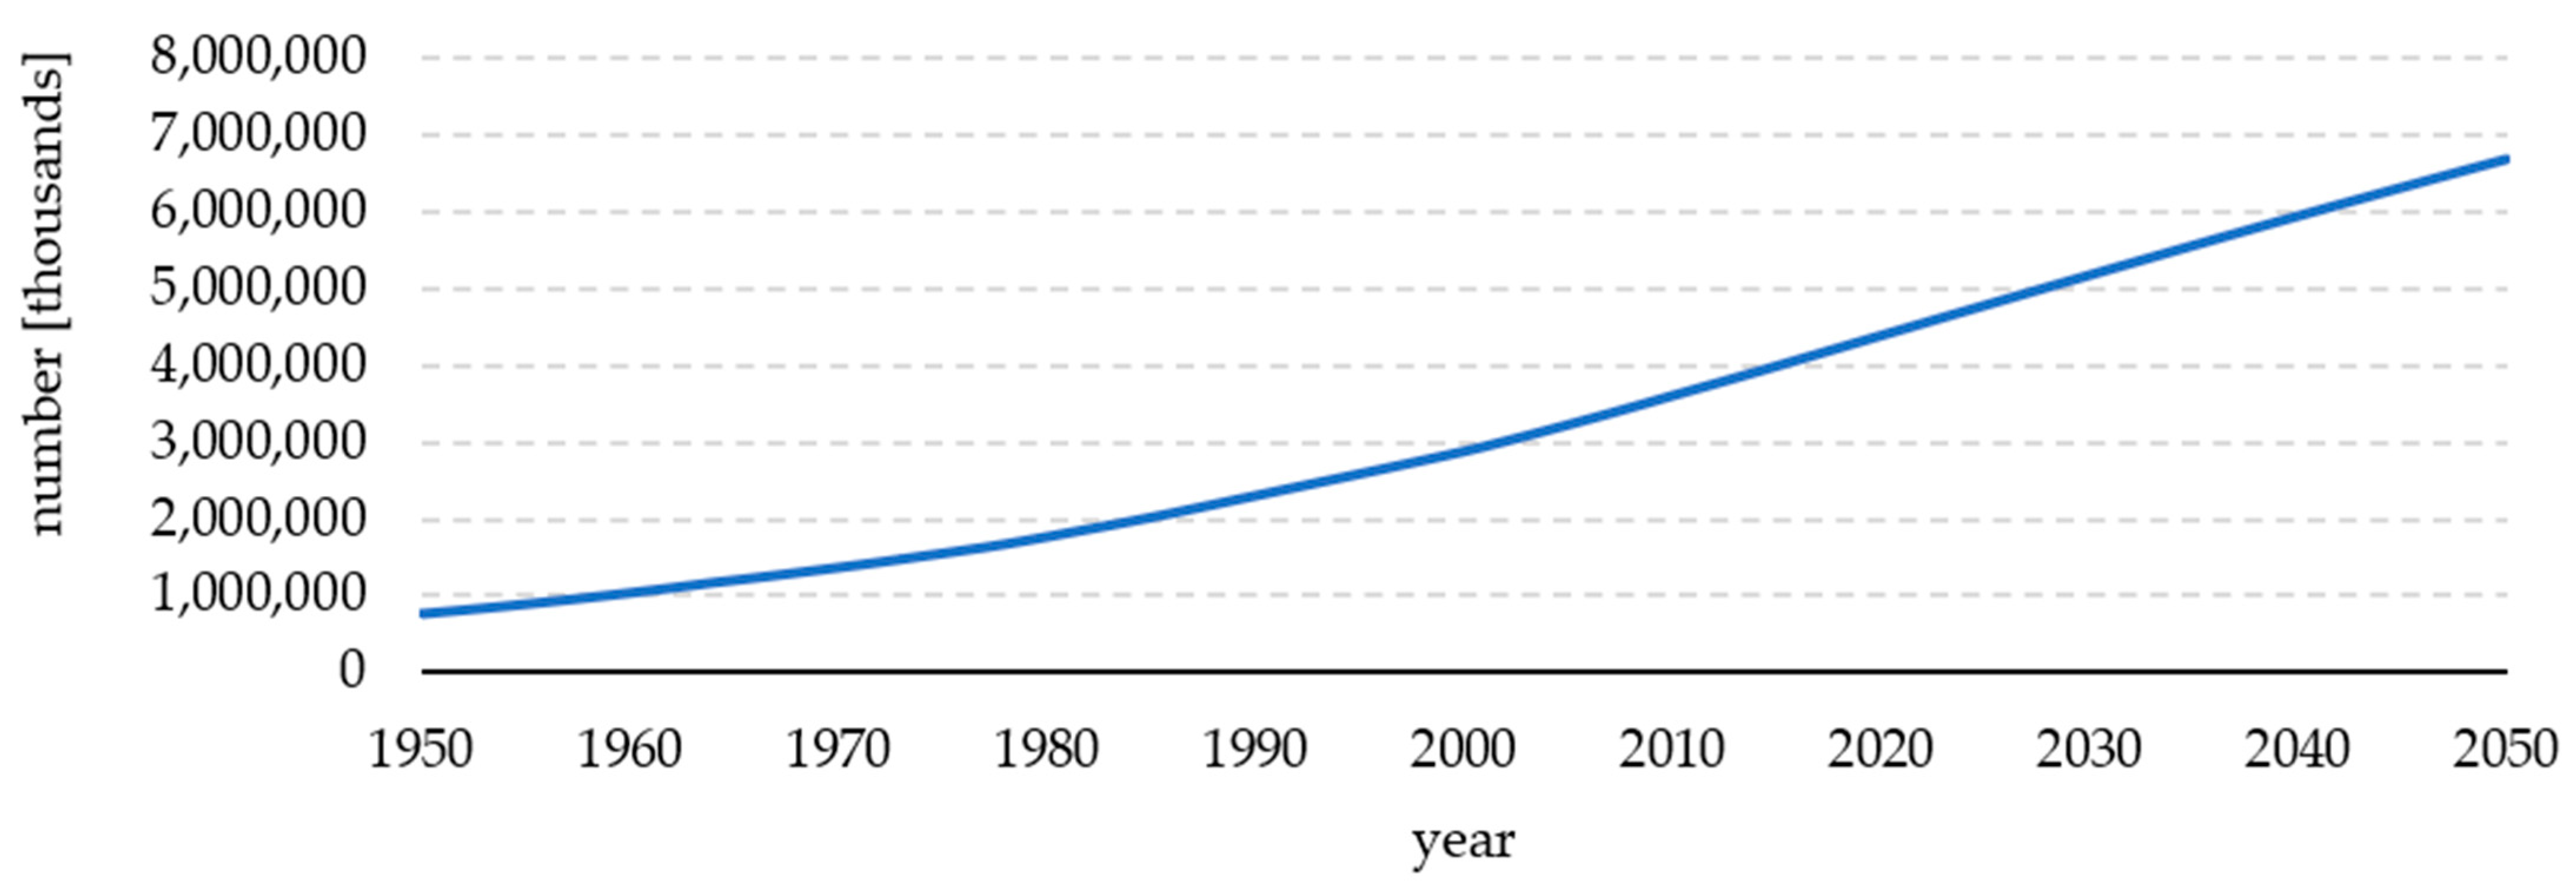
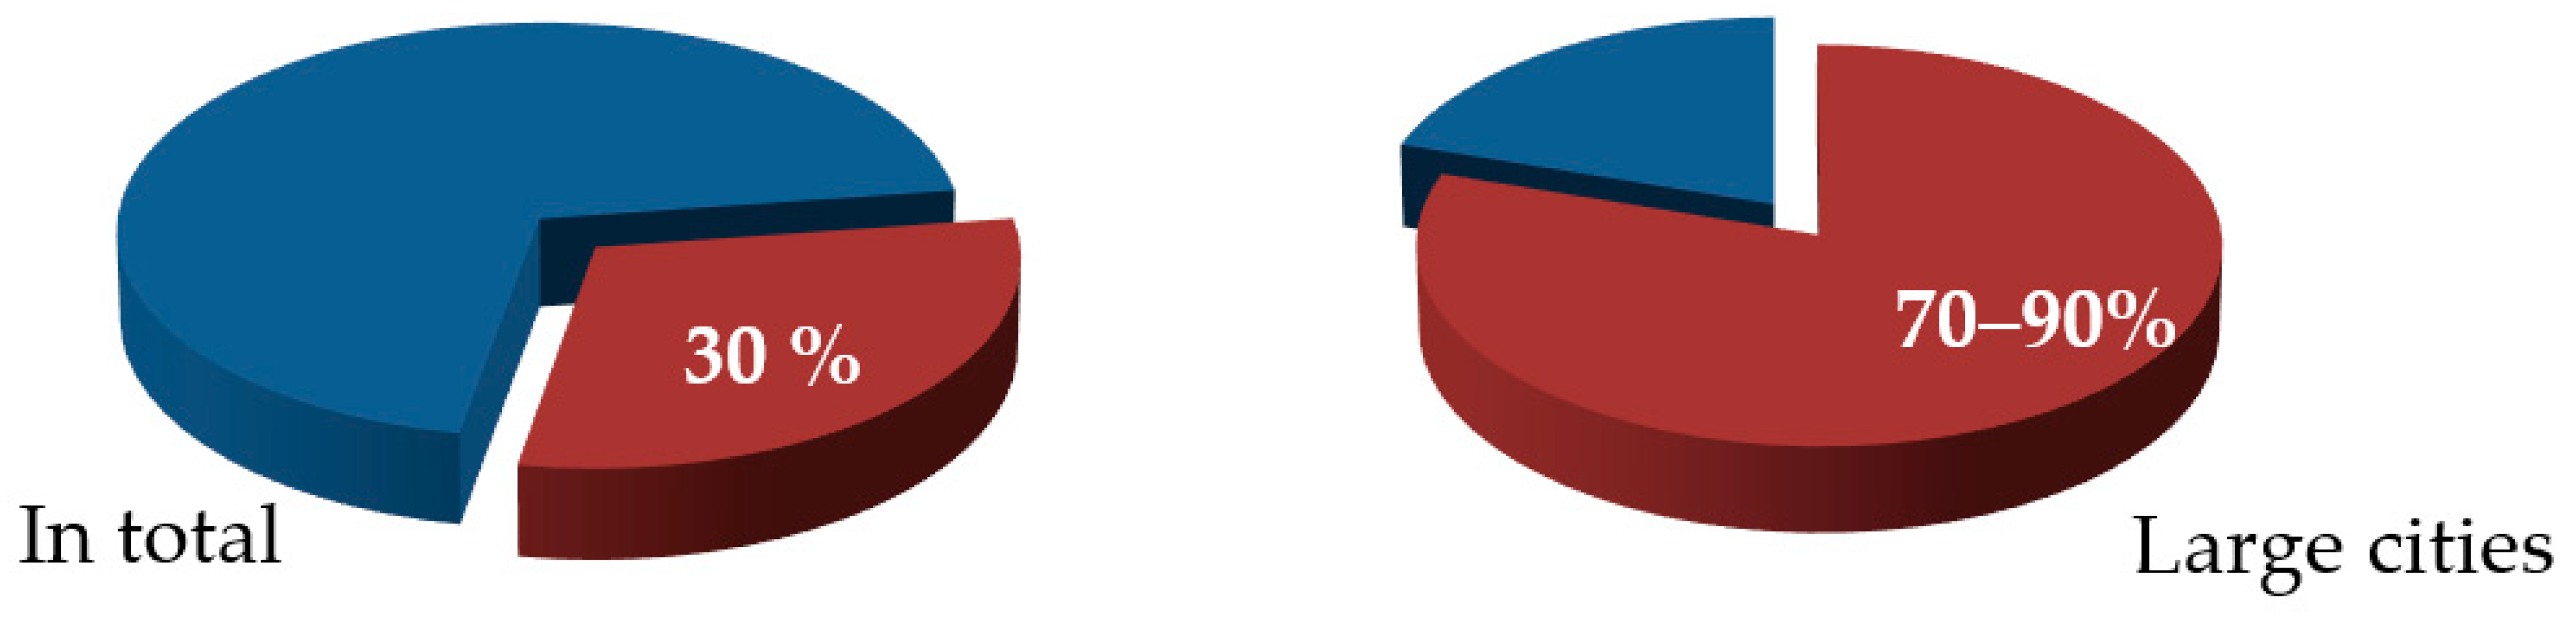
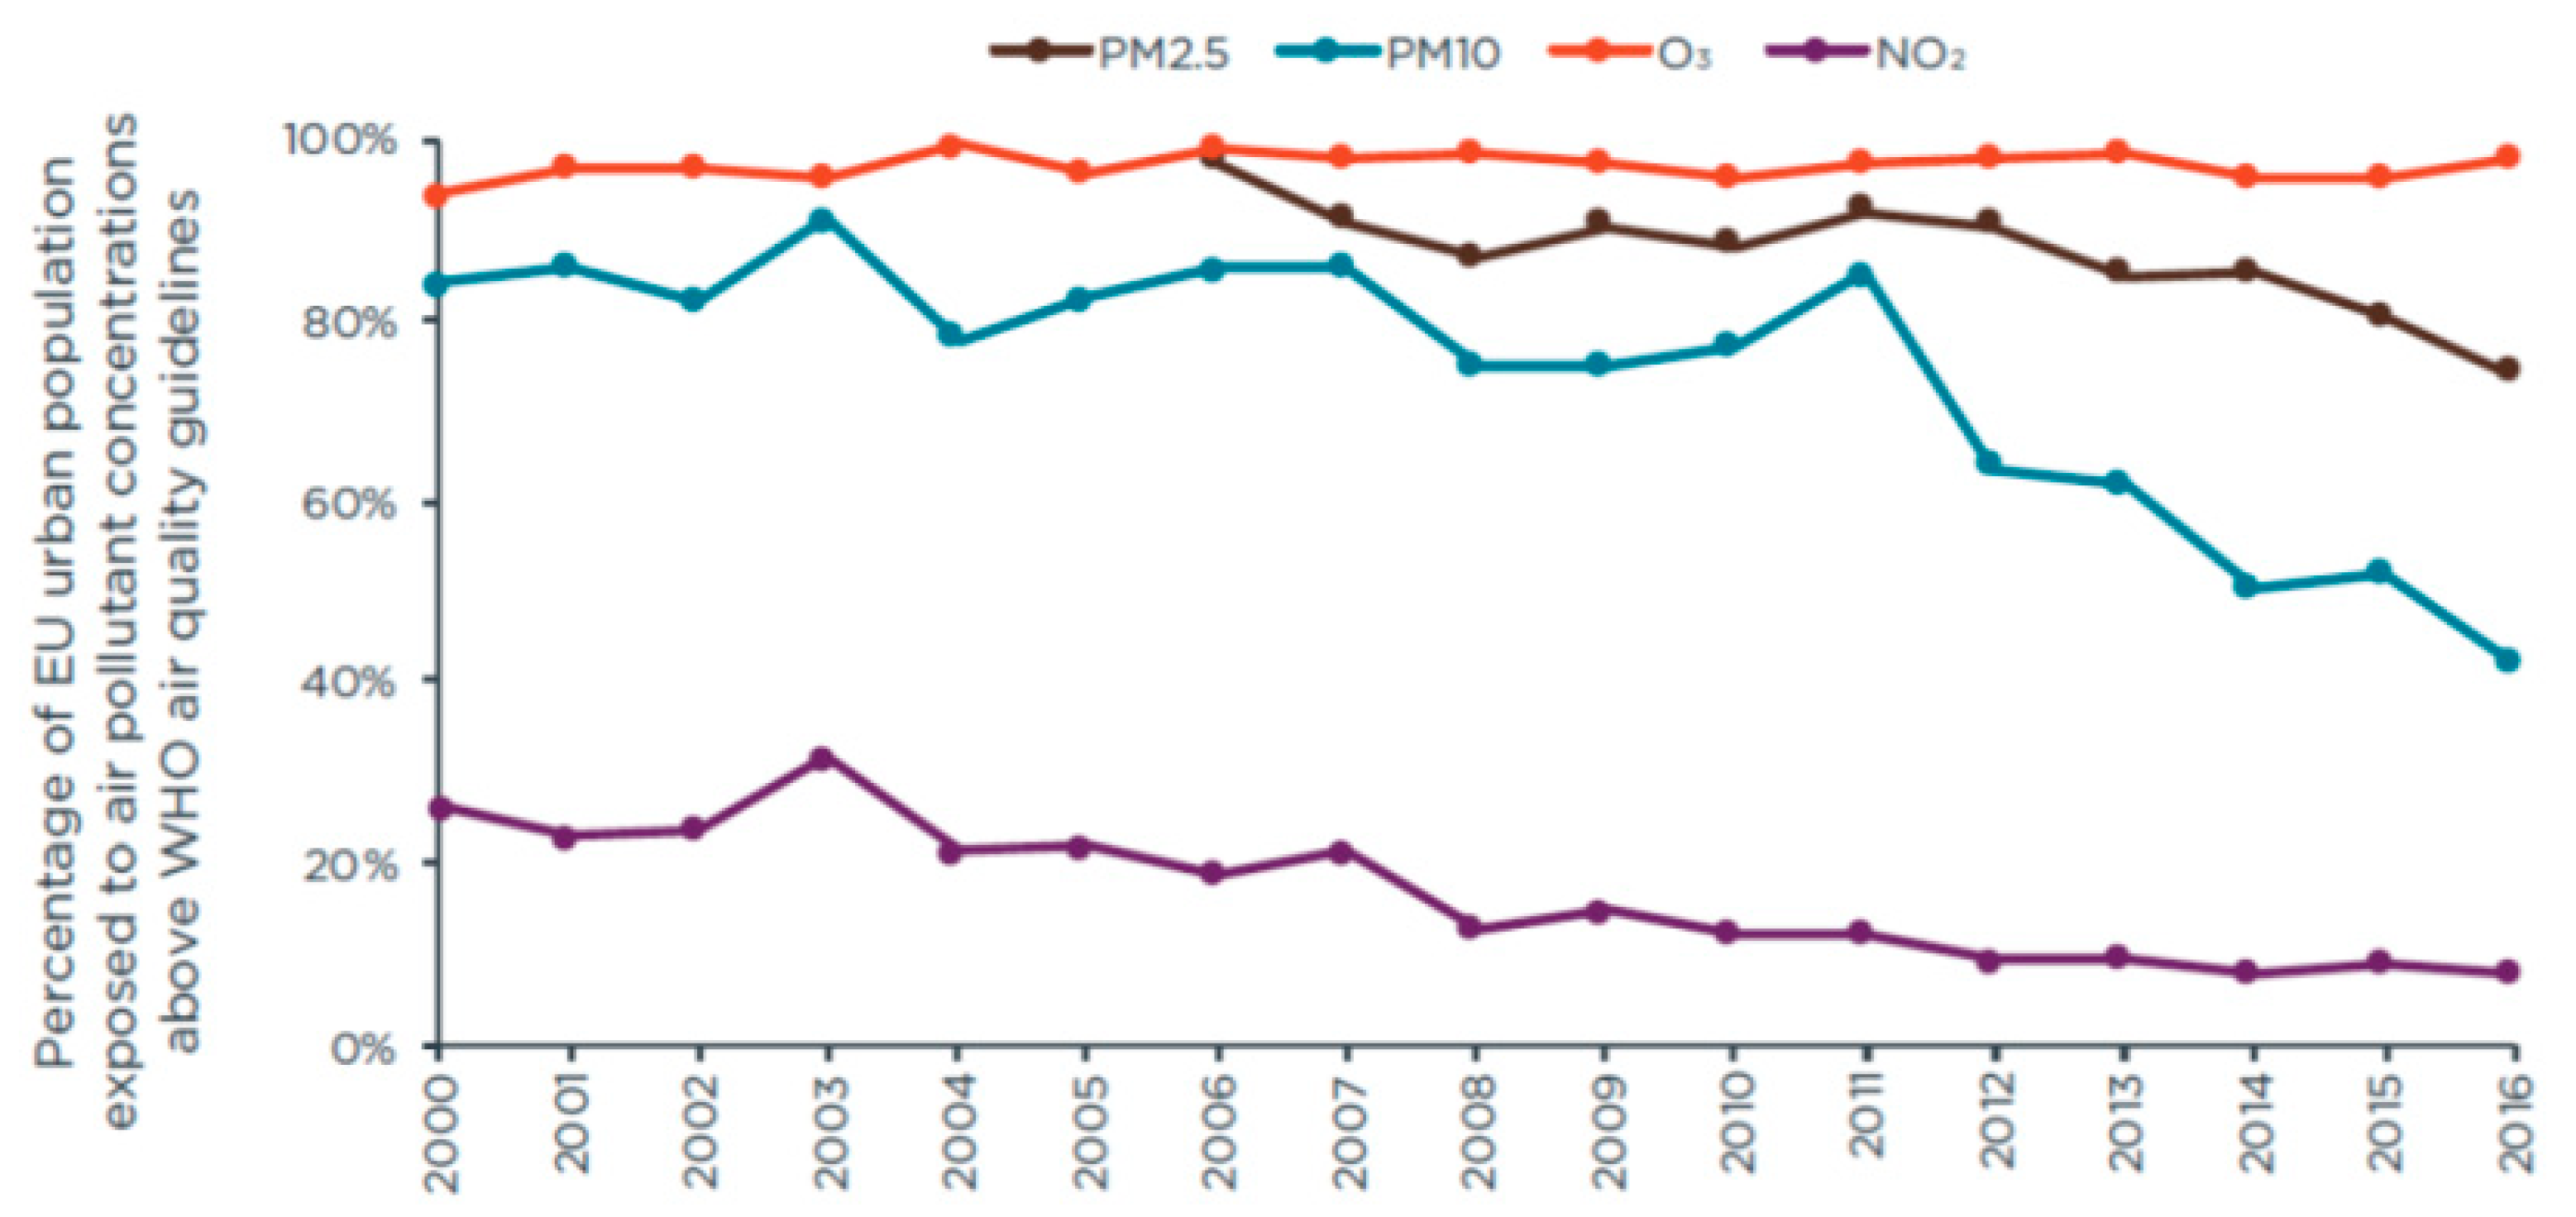
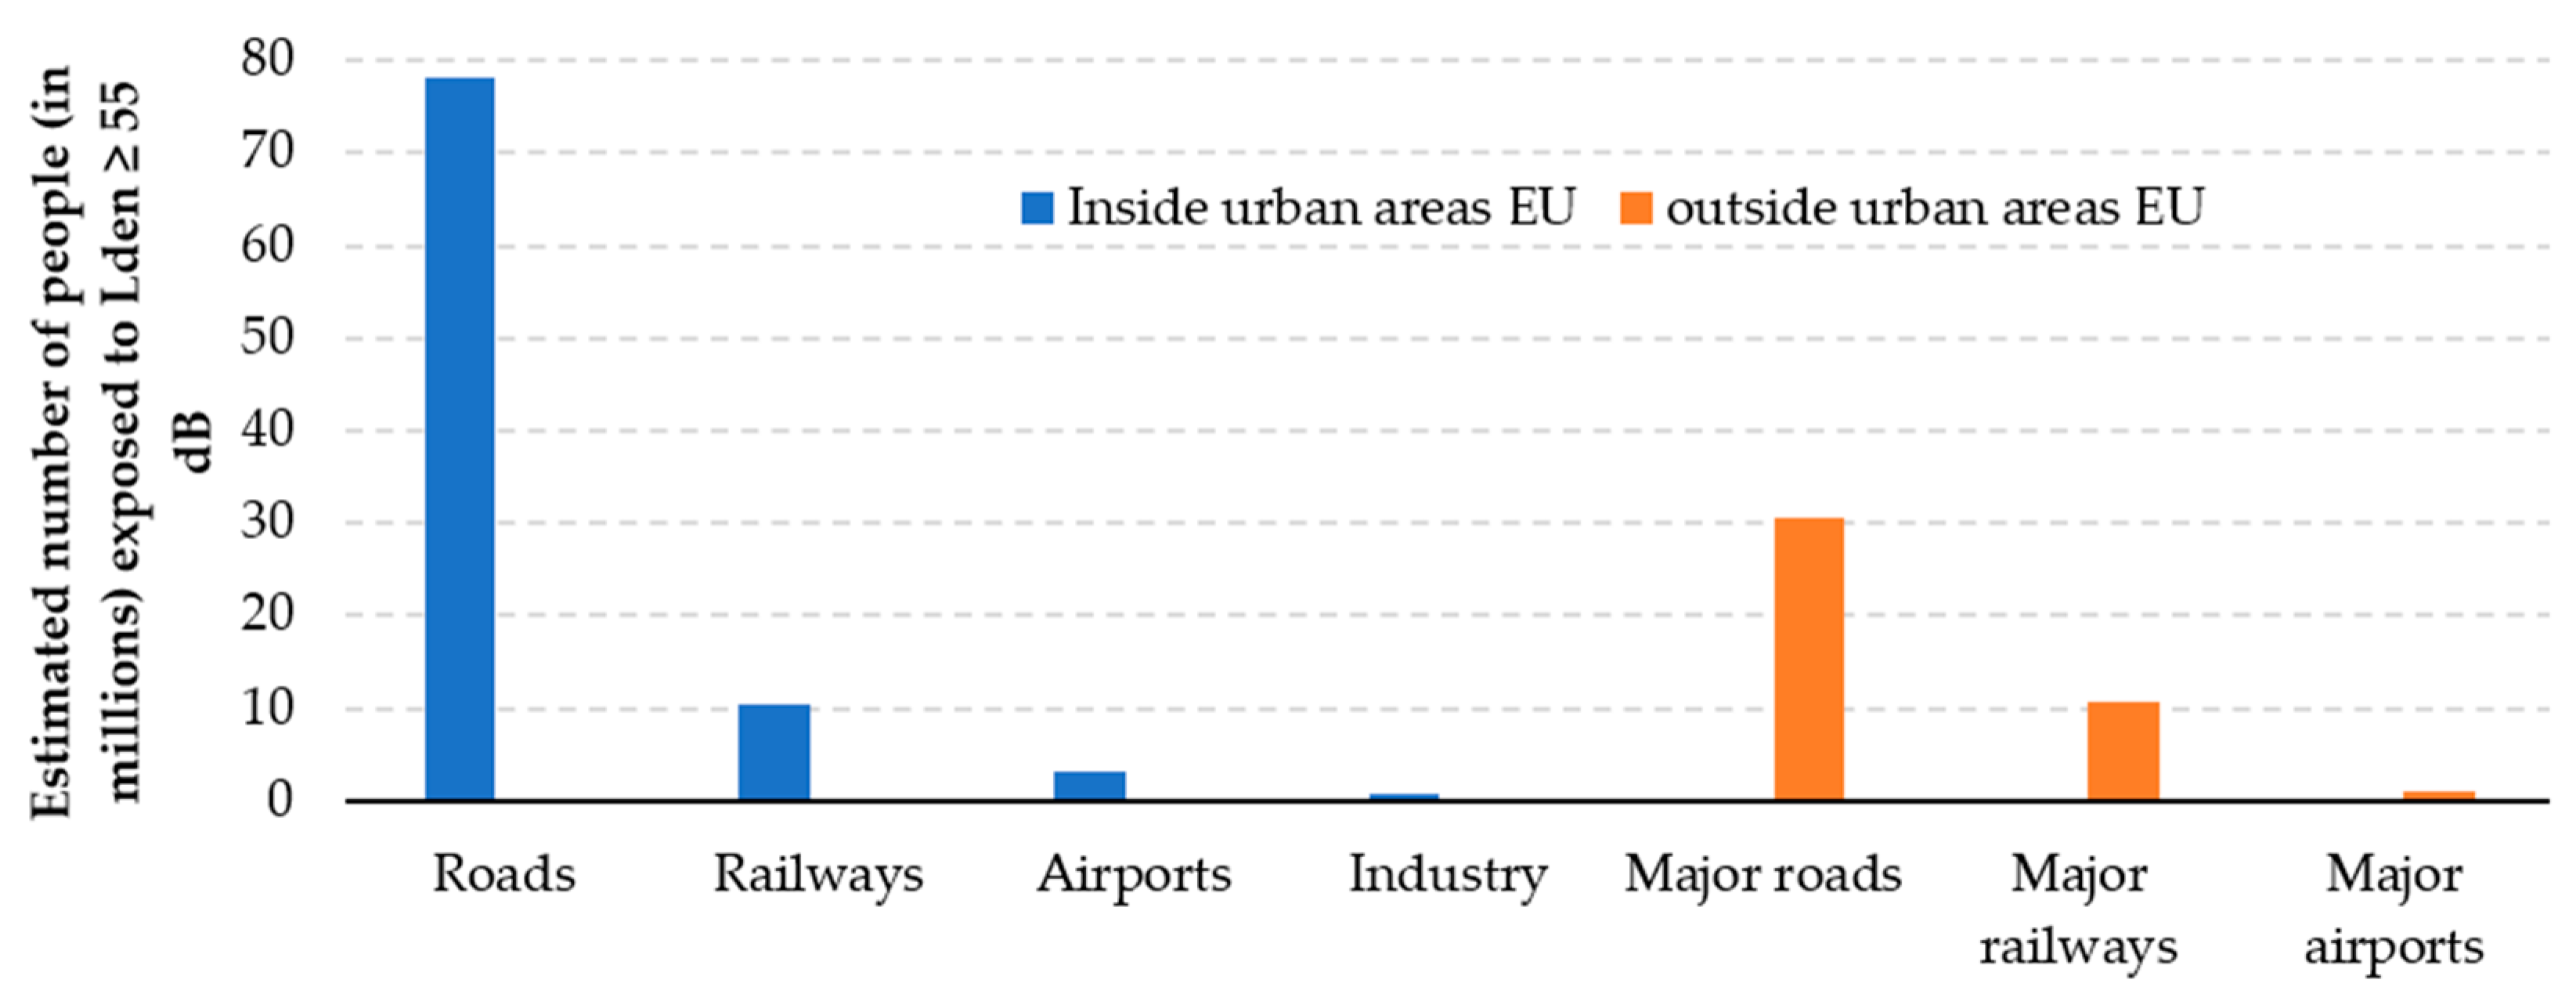
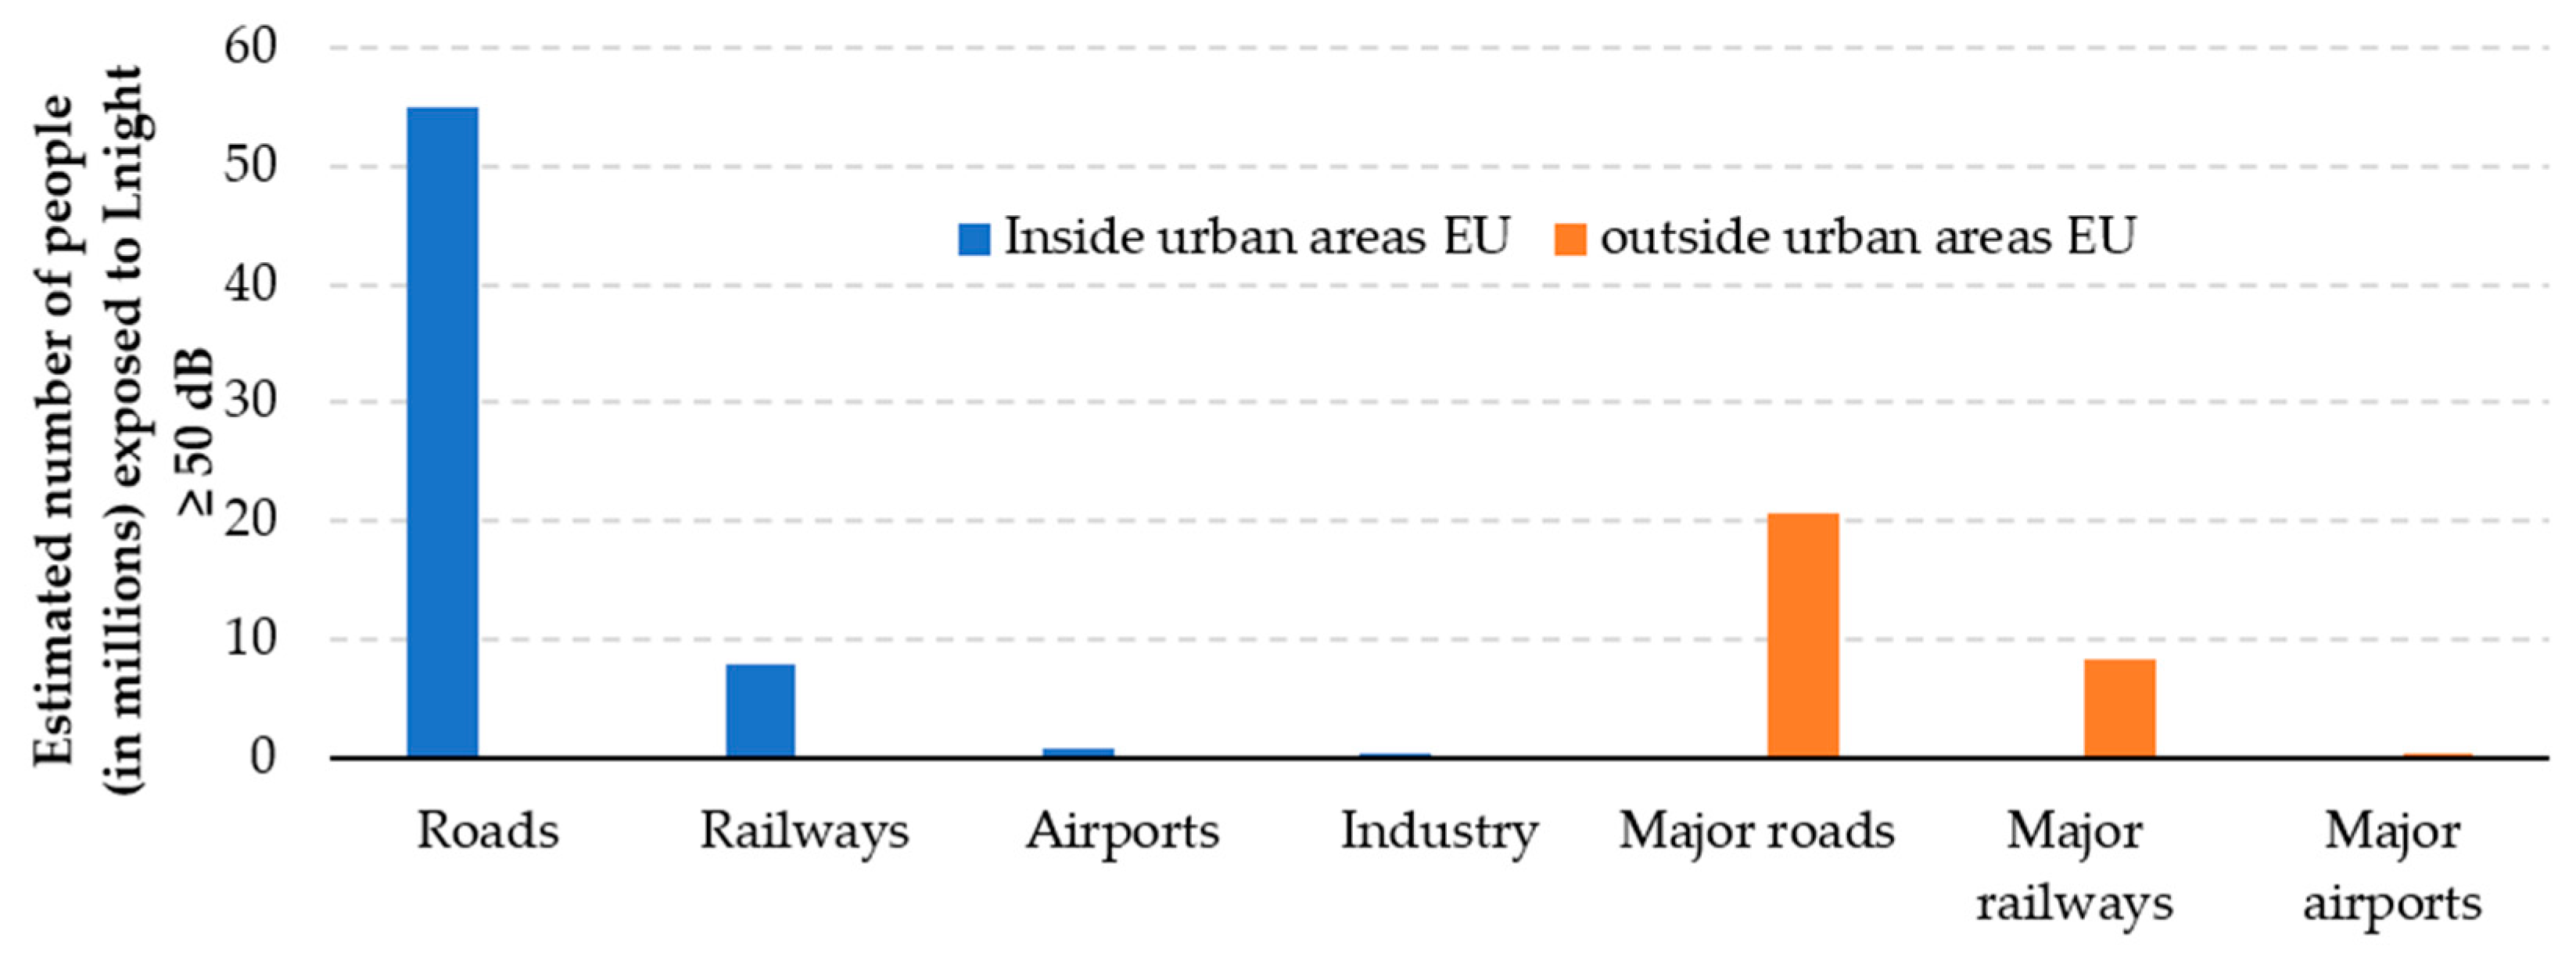
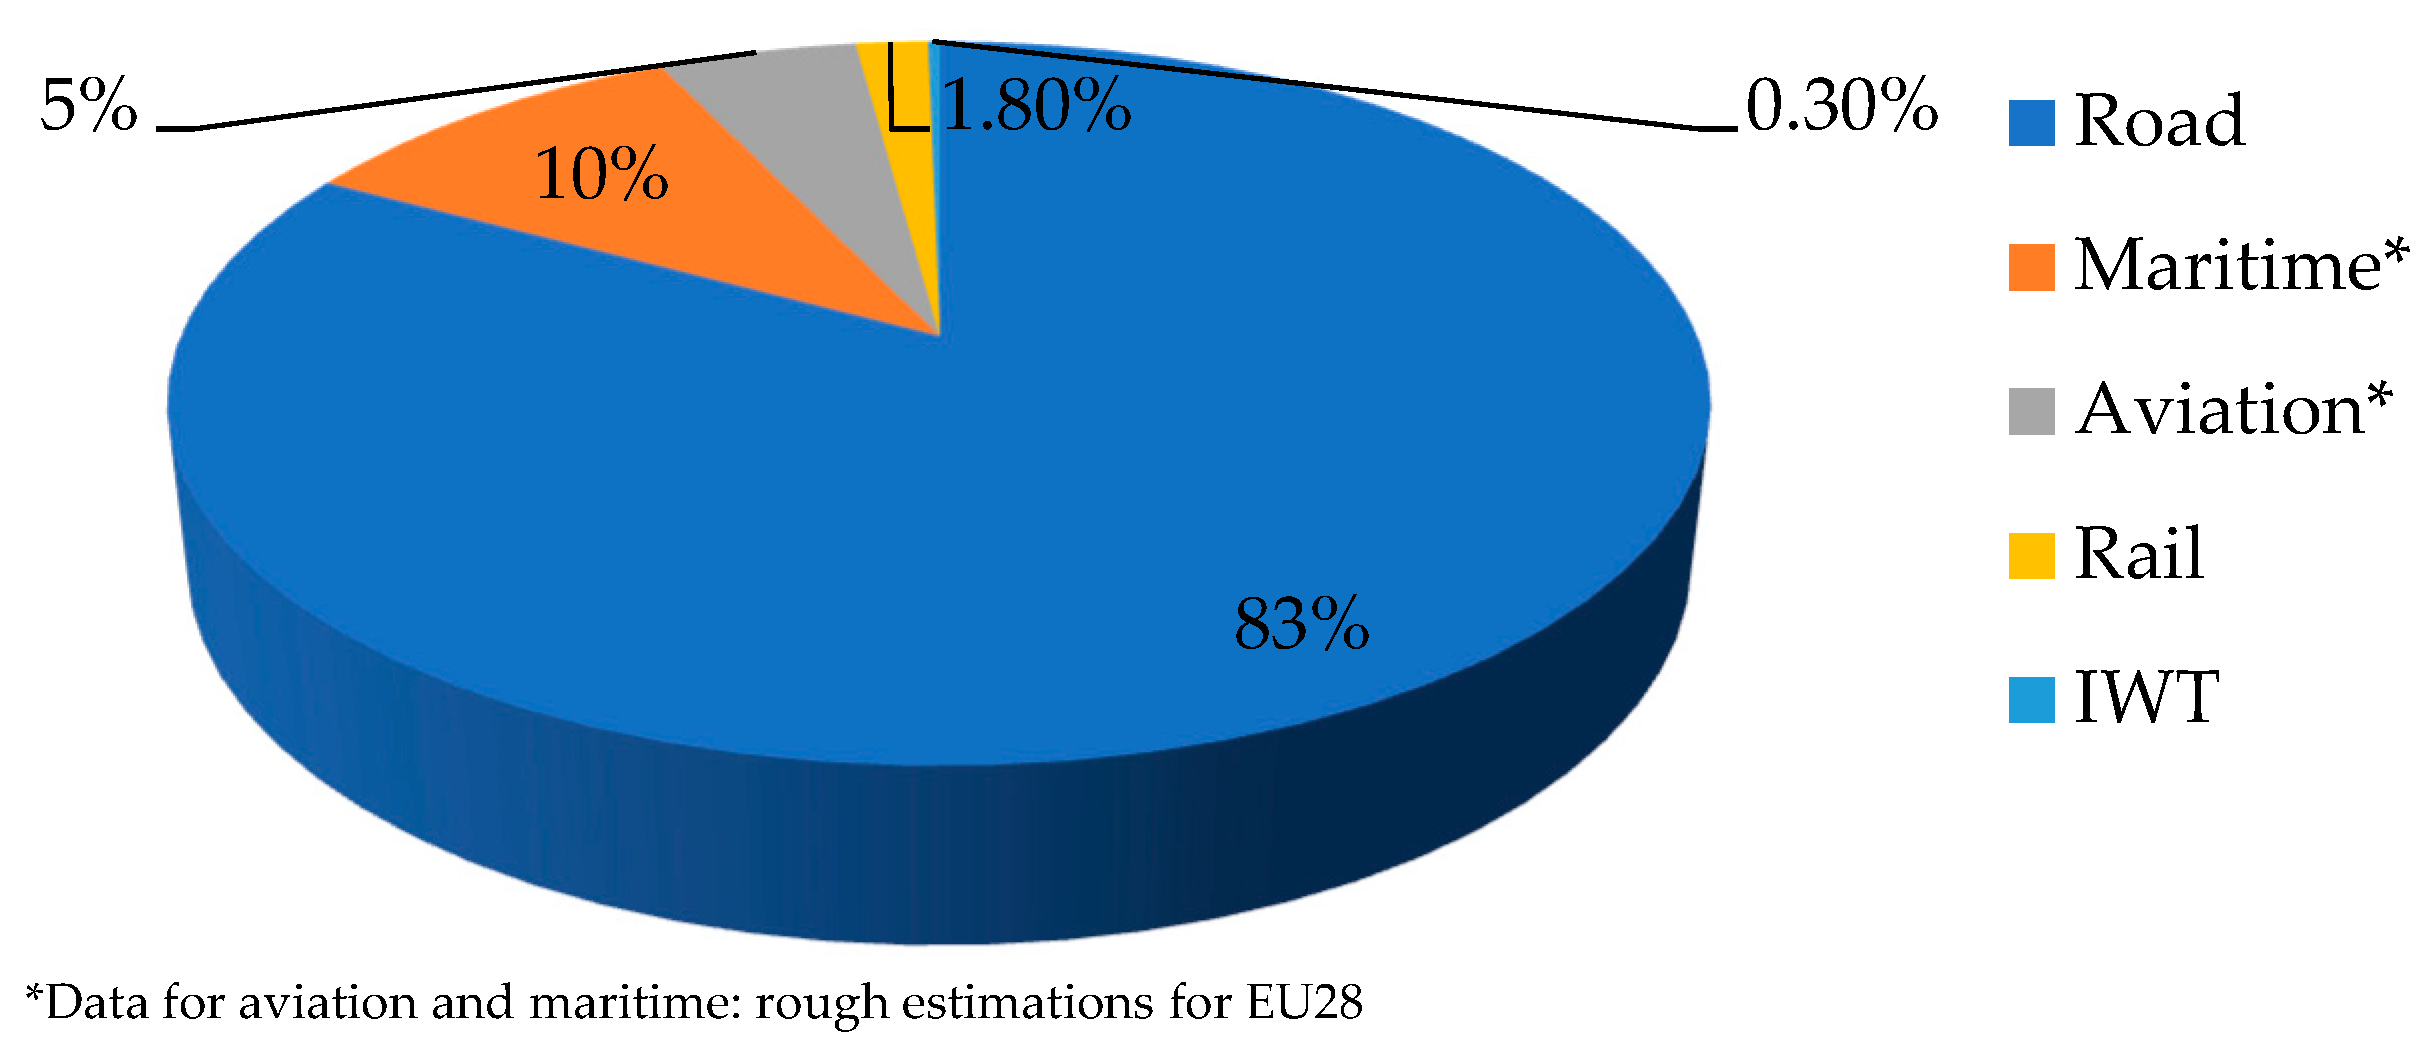
1.1. Environmental Hazards in Urban Areas Generated by Transport

Today’s cities and urban areas are facing numerous commercial, social, economic and environmental challenges as a result of their dynamic development. The global population is increasingly concentrated in cities. A total of 55% of the global population currently resides in urban areas, and according to UN estimates, this percentage is expected to rise to 68% in 2050 [1] (Figure 1).
Forecasts indicate that urbanisation resulting from the ongoing relocation of people from rural areas to cities, along with overall global population growth, could increase the total urban population by another 2.5 billion people by 2050 compared to 2018 (Figure 2) [1].
In the European Union, the progress of this concentration is even faster (Figure 3)—in 2050, the percentage of the total population living in cities will be almost 84% (Figure 1).
The growth of the population in cities generates other effects, such as the significant increase in passenger and freight transport, which in turn additionally generates certain unwanted side effects. A very high density of road traffic is detrimental to the efficiency of the transport system, due to extended travelling times and higher fuel consumption, among other things. This reinforces the negative effects of transport, i.e., its significant role in the increase in air pollution, the greenhouse effect and congestion.
Numerous economic research projects indicate that the costs of traffic jams to society are high. In the European Union, these costs are estimated at 270 billion euros per year [3]. It is believed that there is a direct relation between the fluency of traffic in urban areas and projected economic growth in these areas. Paper [4] demonstrates that in the locations of major traffic jams, more fluent traffic could improve the efficiency of employees by as much as 30% [5].
The growth in the number of vehicles in cities also contributes to higher transport-related noise and higher emissions of pollution resulting from car exhaust fumes.
According to the International Energy Agency, cities emit 69% of CO2 in Europe, while urban transport generates over 70% of pollution and 40% of greenhouse gases generated by road transport in Europe.
The contribution of vehicle transport equipped with combustion engines to atmospheric pollution in general and in cities is shown in Figure 4.
Incidentally, the World Health Organisation recognises air pollution as the biggest single environmental health risk in Europe [7,8]. In the EU, air pollution is responsible for over 1000 premature deaths daily on average, which is more than ten times the number of deaths resulting from traffic accidents. Additionally, further 6.5 million Europeans have been diagnosed with serious respiratory and cardiovascular diseases (strokes, asthma, bronchitis). In Poland, air pollution is responsible for 47.3 thousand premature deaths each year [9]. In 2013, the EU Commission estimated that the total external health costs from air pollution were between €330 billion and €940 billion annually [10].
It is worthy of note that air pollution generally affects city residents more than the residents of rural areas. A higher population density in cities means that air pollution is emitted on a bigger scale and is harder to disperse than in rural areas. Figure 5 shows the percentage of the EU urban population exposed to air pollutant concentration levels higher than World Health Organisation air quality guidelines.
Additionally, transportation is highly responsible for the deterioration of the “acoustic climate” in cities. According to a European Union report [12], more than 50% of people living in urban areas in most European states are exposed to road traffic noise at a level of at least 55 decibels, measured in a day–night–day cycle, while 20–30% are exposed to noise levels above 65 decibels during the day and above 55 decibels during the night.
Estimates of the number of people exposed to harmful noise levels are shown in Figure 6 and Figure 7.
It is estimated that long-term exposure to environmental noise is responsible for 12,000 premature deaths and each year contributes to 48,000 new cases of coronary artery disease in all of Europe. It is also estimated that 22 million people suffer from persistent high irritability and 6.5 million people suffer from persistent intense sleep disorders [14].
According to [15], road transport is the dominant type of transport and generates by far the highest external costs—83% (Figure 8), of which 31% of the total costs are generated by freight transport.
Despite the negative effects of transport, cities are obliged to ensure that their residents have general access to transport services and to guarantee the efficient urban distribution of goods with the consideration of economic and environmental factors. In this context, the sector of mobility in cities is changing rapidly, as new business models, new technologies and innovations are being developed, which is changing the existing approach to the shaping of the mobility policy in cities.
Cities are trying to raise the level of balance between ever higher challenges and the needs of residents and businesses through the development of local Sustainable Urban Logistics Plans (SULP) with the inclusion of modern infrastructural solutions and technologies, such as Battery Electric Vehicles (BEVs).

1.2. The Policy of the European Union in the Context of the Electromobility of Utility Vehicles

One of the factors that guarantees and accelerates changes in the automotive sector is undoubtedly the introduction of more rigid European Union exhaust emission standards. According to the Regulation (EU) of the European Parliament and of the Council (EU) of 17 April 2019 setting CO2 emission performance standards for new passenger cars and for new N1 commercial vehicles (vehicles designed to carry goods and with a total weight of maximum 3.5 t; commercial vehicles), the average level of emissions of the fleet of new commercial vehicles will have to be reduced by 15% until 2025 and by 31% until 2030 in comparison to 2021.
In December 2020, the European Commission presented a strategy for sustainable development and smart mobility [16], which represents a foundation for the further transformation of the transport sector. This document assumes that by 2030 there will be at least 30 million zero-emission passenger cars and 80,000 zero-emission heavy-duty vehicles in use, and that by 2050 almost all passenger cars, commercial vehicles, buses and new heavy-duty vehicles will be emission-free. The implementation of the set targets will be connected with the introduction of more restrictive fuel emission standards and ultimately with the prohibition of the sale of combustion-powered vehicles.
Additionally, in 2022, the European Commission, under the Fit for 55 package, approved new legislative proposals that involve the acceleration of the reduction inemissions from new commercial vehicles. By 2030, emissions have to be reduced by 55%, and by 2035, they have to be reduced by 100%. In practice, this means that all new commercial vehicles that are registered from 2035 onwards must be zero-emission vehicles. The agreed compromise is intended to assist in the fulfilment of the aims of the Paris Agreement, contributing to the reduction in the production of CO2 by approx. 54 million tonnes in the period 2020–2030.
The European Commission believes that the introduced changes will also bring about economic benefits, especially for small and medium enterprises. According to forecasts, in the course of a five-year operating period, a heavy-duty vehicle purchased in 2025 will generate savings of €25,000, and one purchased in 2030 will generate savings of €55,000. The consumption of petroleum in the period 2020–2040 will be reduced by as much as 170 million tonnes. Additionally, new laws are expected to improve the level of innovation of the European economy, and a higher GNP will result in the creation of new jobs.

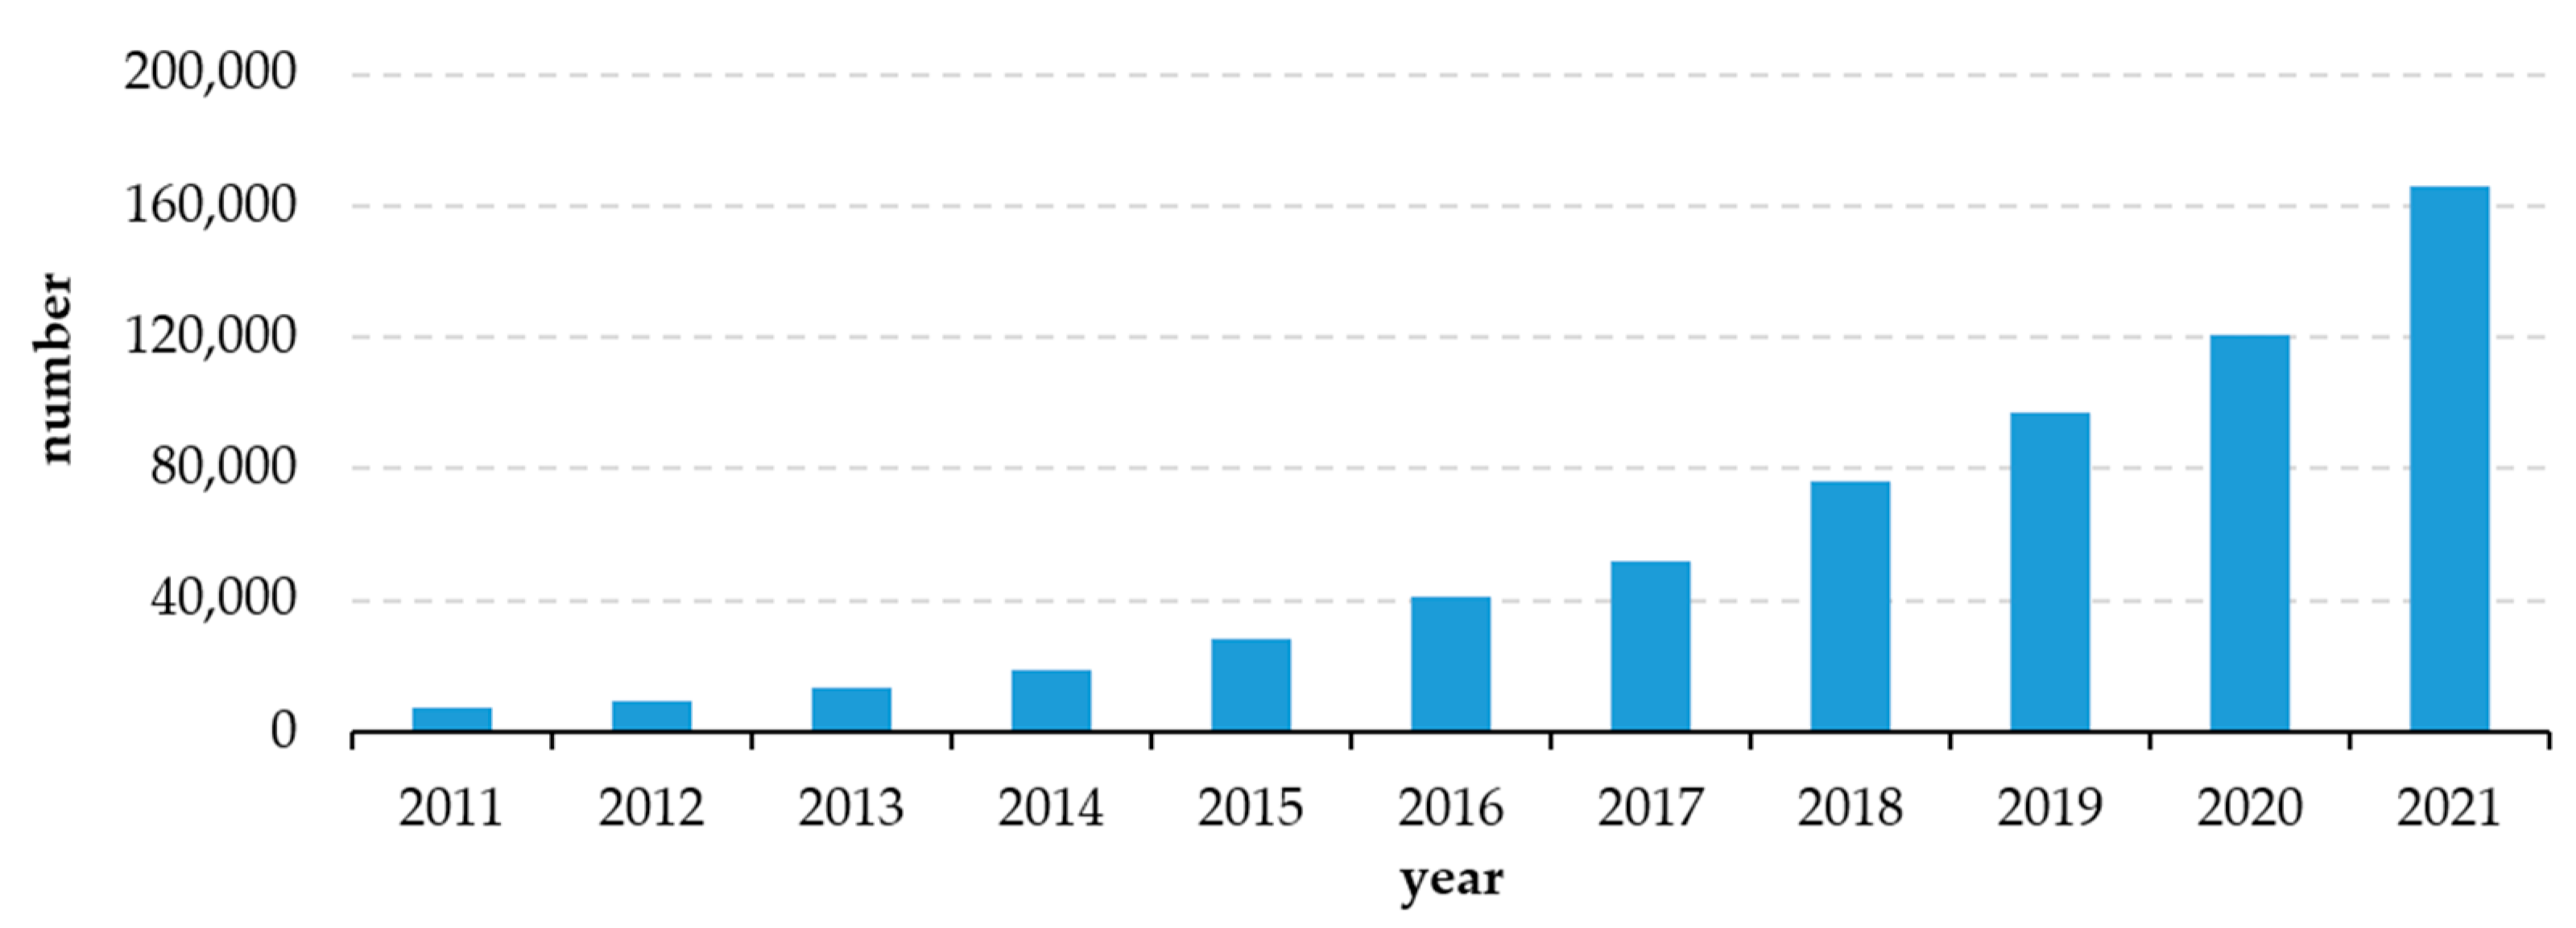
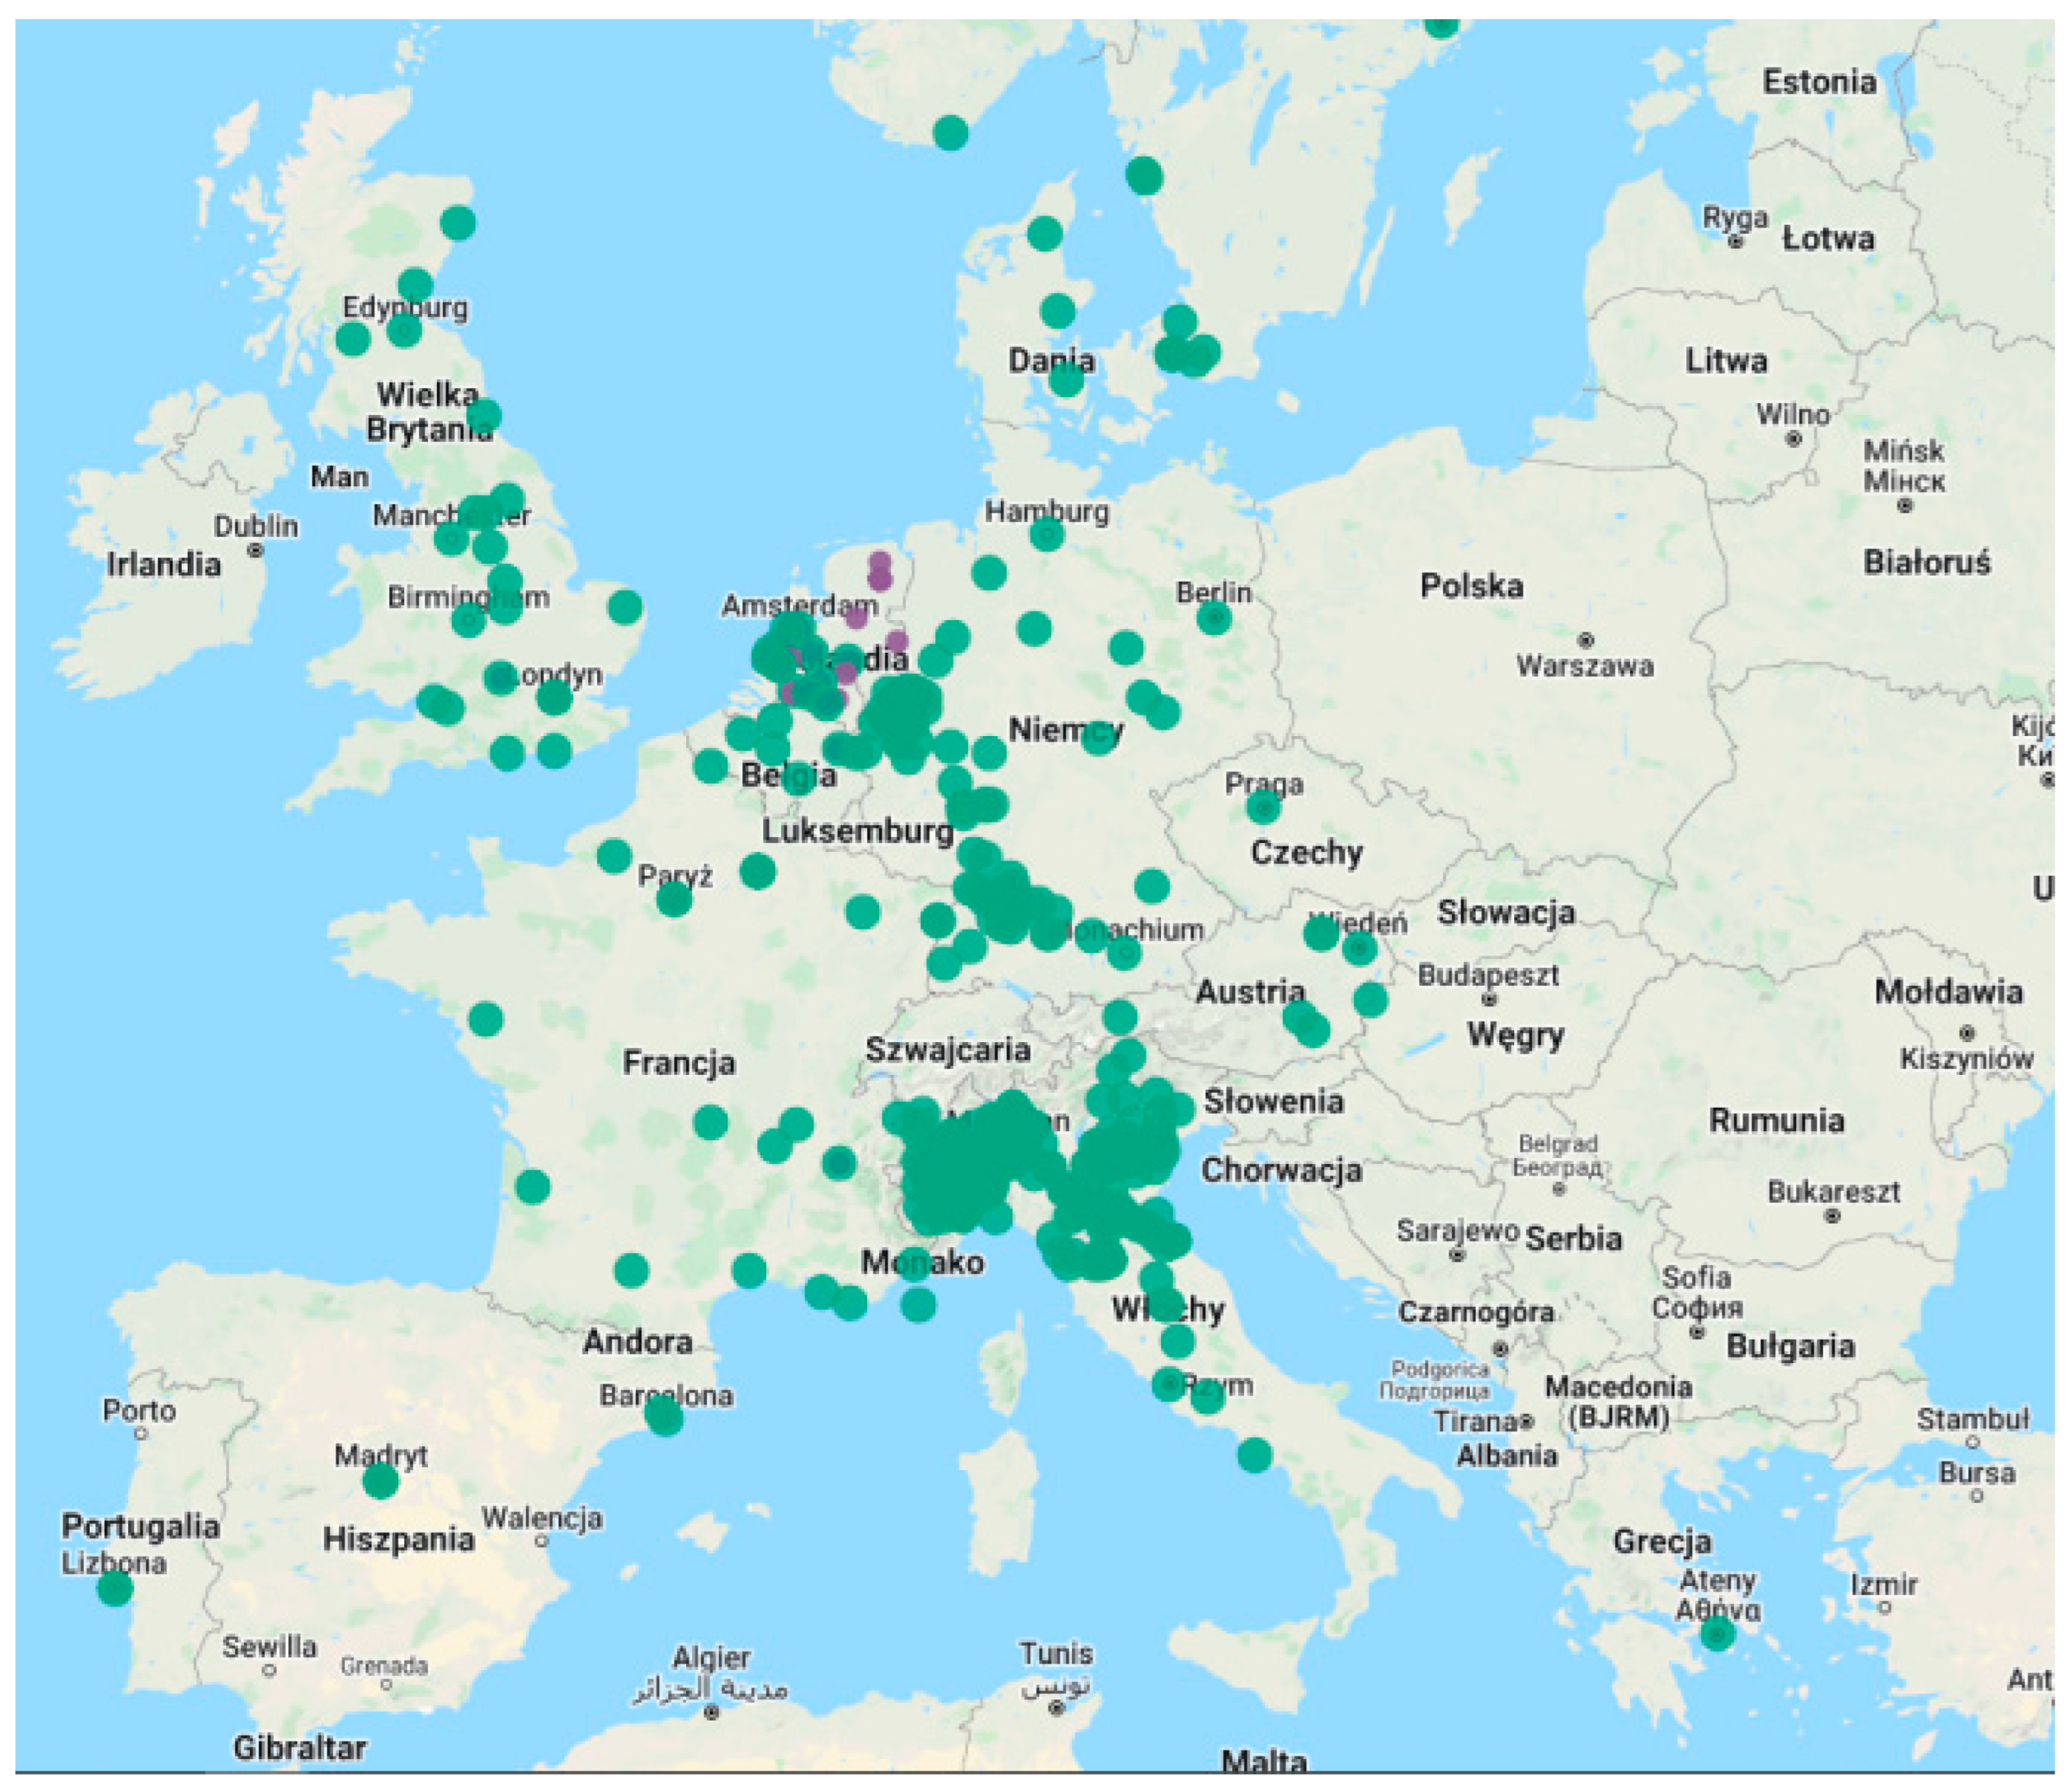
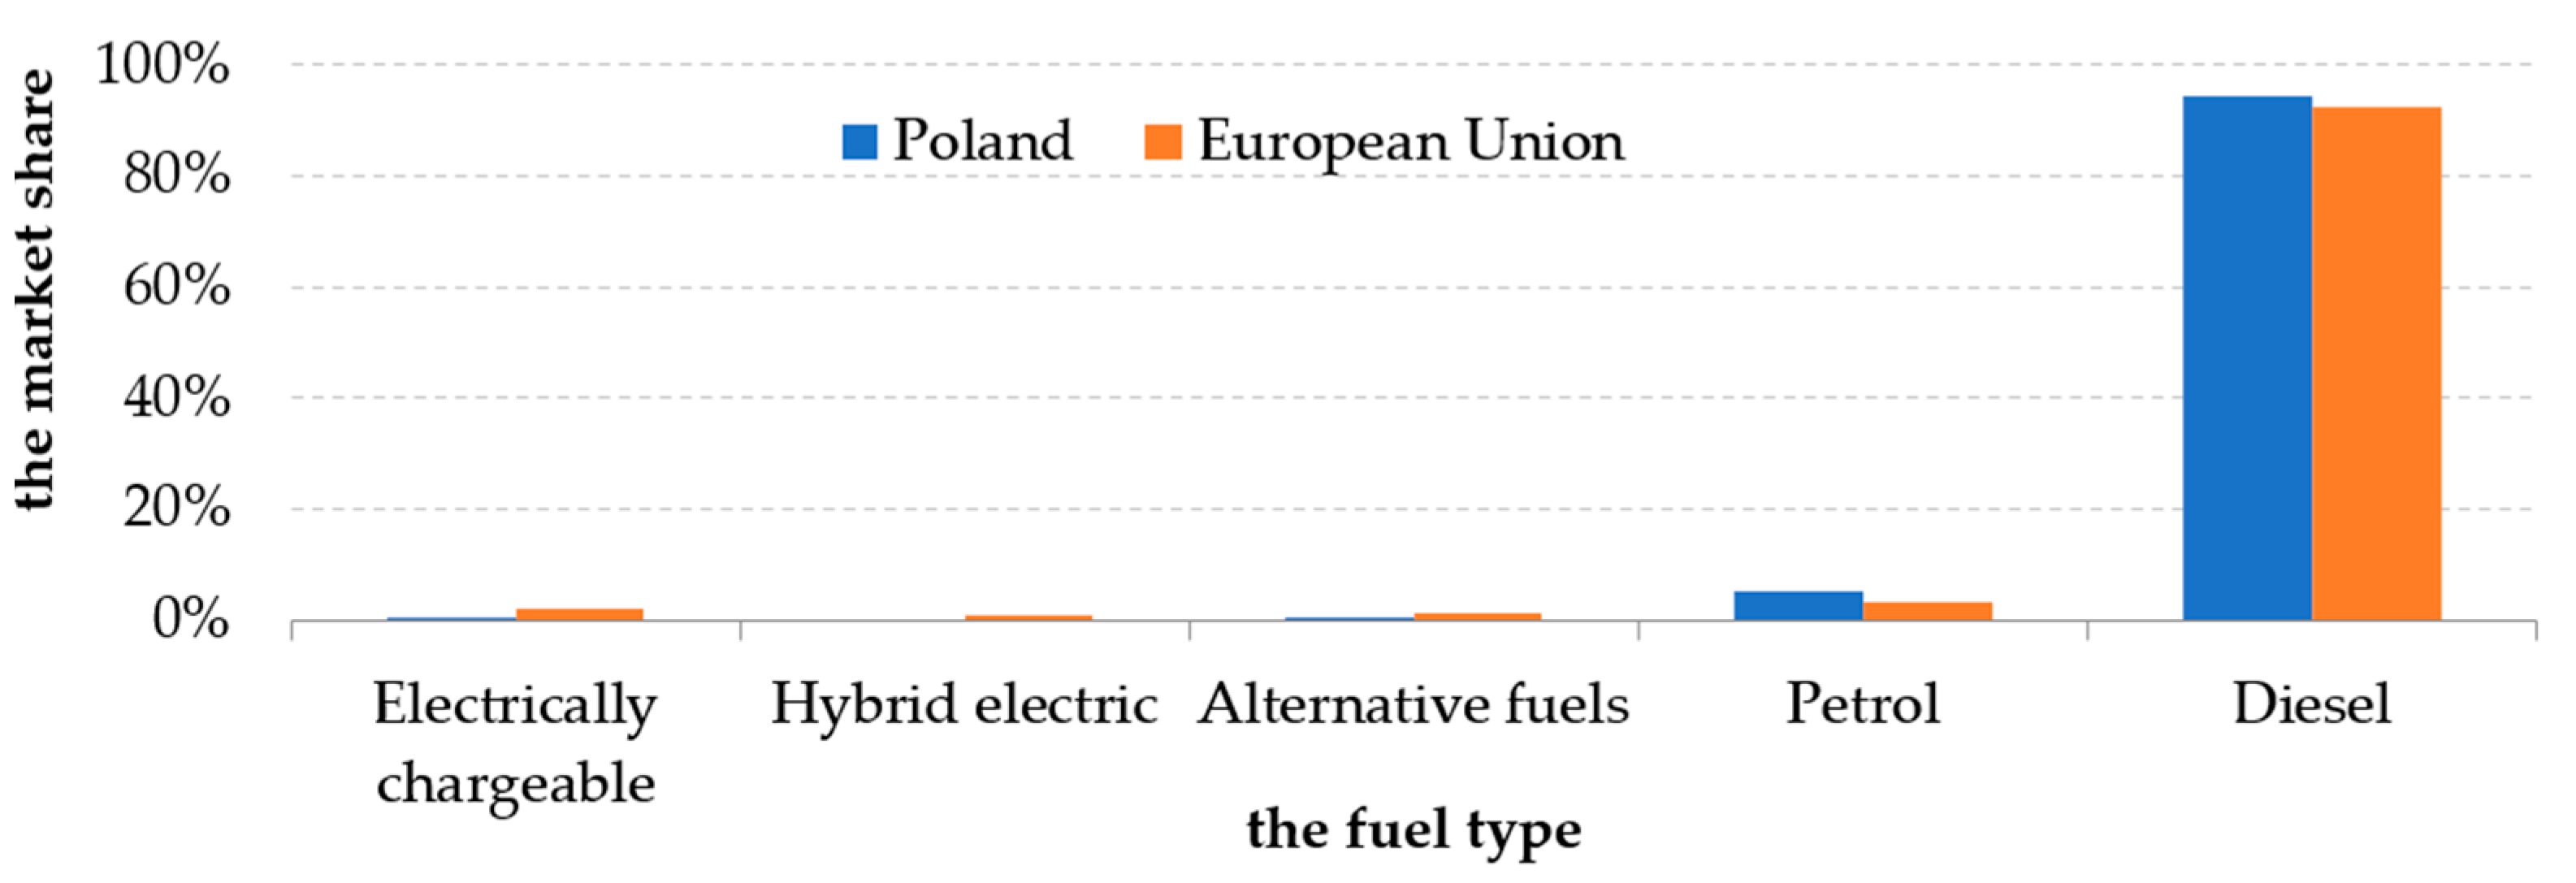
1.3. Light Commercial Vehicle (N1) Market in the European Union

The result of the implementation of an environmental policy aimed at reducing exhaust emissions in sectors such as urban logistics is the constant increase in the number of operated electrical light commercial vehicles of the N1 category in the European Union (Figure 9). Another effect is a wider range of vehicles offered by car manufacturers, e.g., in 2019 Polish entrepreneurs had the choice of six electric-only commercial vehicle models, whereas at the end of the first quarter of 2021, this number doubled to 12 models. However, the progress of electromobility in the commercial vehicle sector is slower than in the sector of electric-powered passenger cars. In total, 166,180 of such vehicles were registered in the EU in 2020, which represents a 38% increase in comparison to 2020, whereas in the case of M1 vehicles (passenger cars), this increase stood at 79%.
One of the major factors that dictate the modernization of the fleet of these urban-operated vehicles is the increasing introduction of low- and zero-emission zones in some EU countries. In addition, other restrictions on access to urban areas are being introduced there, either permanently or for specific periods of time. This is particularly true for the most polluting vehicle categories [17]. According to the European Cyclists Federation, there are currently more than 250 of such areas functioning within the European Union [18] (Figure 10). Low-emission zones have been already introduced in various European cities, e.g., in Lisbon, Madrid, London, Paris, Rome, Vienna, Berlin and Oslo.
In most urban areas, vehicle access restrictions apply to the oldest vehicles that emit the highest amount of pollutants and to specific areas, often covering the strict city centre. However, this is supposed to change in the near future. Many cities and administrative units around the world have announced plans to ban the entry of ICE vehicles (in some cases limited exclusively to diesel engines). These include cities such as Bergen, Brussels, London, Milan, Oslo, Paris, Rome and Strasbourg.
In Poland, along with the planned amendment of the act on electromobility and alternative fuels of 11 January 2018, the legislative authorities intend to introduce regulations that will enforce the creation of clean transport zones in cities with more than 100,000 residents in situations where the Chief Inspectorate of Environmental Protection has found that the maximum acceptable average values of the concentration of air pollutants have been exceeded. As a consequence, zones of restricted access for ICE vehicles (petrol and diesel) will also be introduced in Polish cities. From the perspective of entrepreneurs, this will necessitate the rapid electrification of commercial vehicle fleets, which currently consist mostly of vehicles equipped with diesel engines (Figure 11).
According to [21], in 2021 the electric commercial vehicle fleet in Poland consisted of 880 vehicles. As indicated in numerous research papers [22,23,24,25,26,27,28], the main obstacle for the dynamic electrification of the Polish vehicle fleet is the constantly high price of electric vehicles in comparison with their ICE counterparts. These findings have been confirmed in recent research [29], which indicates that the main factor considered by owners when buying a car is still its price (Figure 12).
The proponents of such vehicles, however, consider their high purchase price to be offset by the comparatively low operating costs of BEVs. They believe that a simplified approach to cost effectiveness, which puts its main emphasis on the cost of purchase, may lead to a predefined conclusion that a more expensive electric vehicle is not cost effective at the moment. This simplification, according to them, is baseless and may lead to incorrect requests, because it does not take into account many other cost elements besides the cost of purchase. They therefore propose a holistic approach, which is reflected in the total cost of ownership and takes into consideration the actual total costs connected with the purchase, start up, operation, maintenance and selling of a vehicle.
When studying the literature [30,31,32,33,34,35], the concept of the total cost of ownership is often used. The total cost of ownership (TCO) is a purchasing philosophy that aims to better understand the true cost of purchasing a particular product or service [36]. For a vehicle, this includes one-off costs, which include all ancillary costs, such as purchasing costs, but also recurring costs, such as fuel and maintenance costs [37]. As the TCO considers all costs throughout the life cycle, it can be used as an assessment tool to compare the costs of different products [38]. This is especially important when comparing conventional and electric vehicles, as the latter have relatively high upfront costs but may have lower running costs [35].
There is no single, universally recognised formula, especially in respect of the category of electric vehicles.
Authors of European analyses make different initial assumptions, whereby they frequently arrive at different conclusions. Most of these analyses, however, favour electric vehicles, although to a various degree.
Key to these considerations are economic and political conditions, which significantly affect the final calculation results. Consequently, the results of analyses having the same initial assumptions, performed for different countries, tended to be different (the presence and amount of subsidies, miscellaneous electric power and fuel prices, different provisions in terms of relief for electric vehicles, amount of deductible depreciation costs, taxes).
It should be noted that in their analyses, the authors usually compare the TCO of vehicles with different types of propulsion of a market segment (mini, city, compact or premium vehicles). Therefore, for each segment, the TCO curves for the multiannual analysis are different. For example, in a study conducted under Belgian conditions, vehicles were classified into three classes: city vehicles, midrange vehicles and premium vehicles [39]. According to these analysis results, electric city vehicles are not economically attractive without the possibility of battery leasing, offered only by selected manufacturers. In the remaining vehicle classes, the differences in TCO are much smaller, but again the TCO of electric vehicles is not the same as the TCO of conventionally driven vehicles after the assumed analysis period (7 years).
It was found in [40] that electric vehicles compete with conventional vehicles in the category of quadricycles and light vans with a load capacity of less than 1000 kg. The reverse is the case for electric vehicles with a battery capacity greater than 1000 kg, where the operating costs are always higher than for conventional vehicles due to the expensive purchase and cost of the batteries.
Another analysis, carried out for Swedish conditions, showed that the analysed electric vehicle can be profitable with appropriately selected amounts of government subsidies [41]. Moreover, it should be noted that thanks to the cofinancing of the purchase of an electric vehicle with 22% of the initial price, the TCO of an electric vehicle may be over 5% lower than that of a conventional or hybrid vehicle after only 3 years of use.
The authors of another publication [42] indicate that plug-in hybrid vehicles are the cheapest type of vehicle in Germany because the costs associated with their operation are relatively low compared with vehicles with conventional drive, and their purchase price is not as high as for electric vehicles. According to another study, the profitability of electric vehicles strongly depends on the distance travelled during the year. According to the authors, electric vehicles are a profitable solution if we take into account city vehicles that cover at least 41.6 km per day. Vehicles from other market segments may be useful when driving more than 77.9 km per day [35].
In Poland, the TCO analysis mainly concerns only electric passenger vehicles and buses [43,44,45,46,47,48].
Few publications include an assessment of the economic benefits and an estimate of the TCO for N1 vehicles (utility vehicles up to 3.5 t DVW). It should be noted that these are only general reports without detailed analyses, which only provide the final conclusions of the method used.
This article is therefore the first to discuss research related to TCO and BEV NI light commercial vehicles, taking into account aspects that are of fundamental importance to their potential users, especially for any entrepreneur who will sooner or later be faced with the question: “if the purchase of such the vehicle pays off?”, as well as for decision makers and local authorities that stimulate the development of electromobility by operating in urban areas. For manufacturers and dealers of electric vehicles, it is also important to shape the price of such vehicles.
The considerations in the article are organized as follows. Section 2 describes the background information on the subject of this research and a brief rationale for undertaking it. Section 3 presents a case study—an analysis of individual scenarios. Section 4 discusses the results of the study in detail. The article concludes with a presentation of the conclusions of the analysis.

2. Methodology

2.1. Assumptions for TCO Model Used for the Research

In the course of this research, an electrically powered N1 vehicle of a selected brand was compared with a conventionally powered vehicle in the condition of long-term, everyday use in an urban environment. Analyses were performed in order to verify whether an electric commercial vehicle can be competitive against a conventionally powered vehicle in existing market conditions. For the purpose of this research, dependencies and assumptions made in many publications were analysed in the context of the economic and political conditions currently present in Poland. On their basis, a TCO model was developed that took into account the total cost of the purchase, fuel costs, insurance, servicing and repairs, taxes and subsidies applicable in Poland (Figure 13). All individual constituents were determined on the basis of generally available data, legislative acts and the authors’ assumptions. In the performed analysis, all cash flows forecasted during the successive years of operation were discounted to the base year (i.e., 2022); therefore, a discount rate was determined and established at 1.29%, in compliance with the change in the method of establishing reference and discount rates, announced in the Communication of the European Commission and introduced on 1 July 2008.

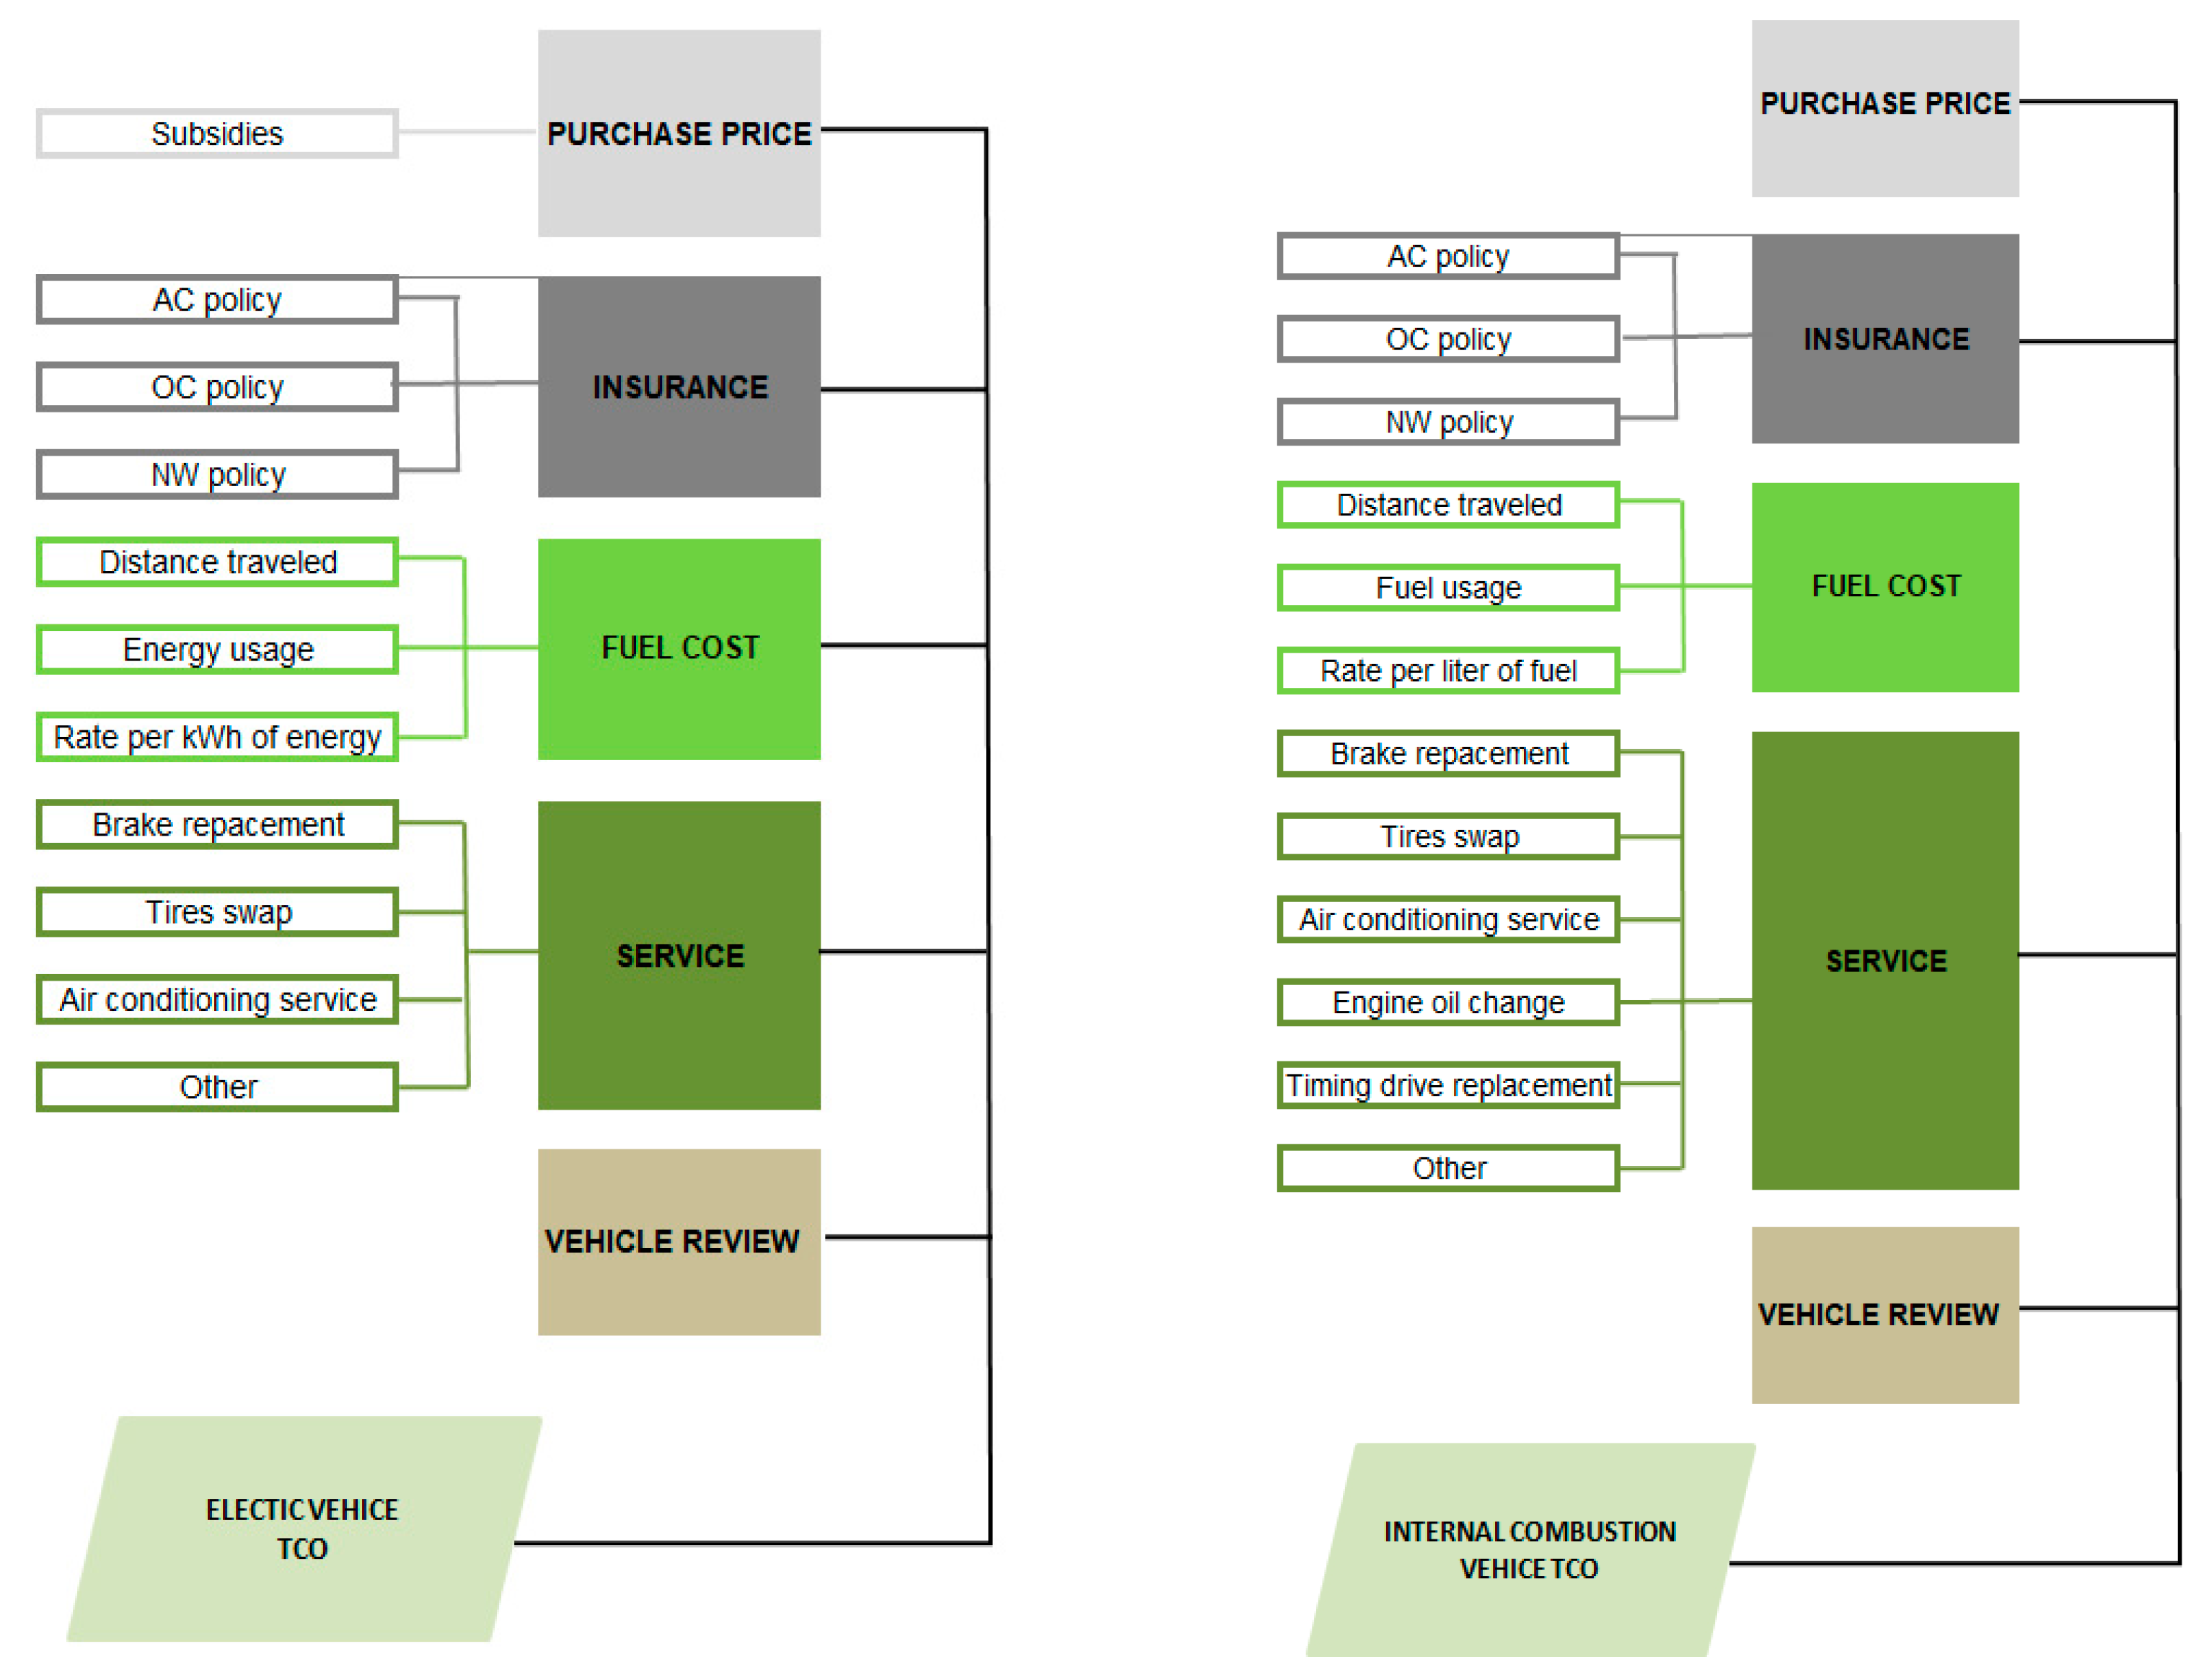
2.2. Costs Considered in the Analysis

Irrespective of the type of analysed vehicle, the TCO constituent costs considered in this research were divided into the following categories:
one-off costs: purchase of vehicle, administrative costs, costs of adapting the vehicle to fleet;
recurring costs: the purchase of vehicle insurance, vehicle’s technical inspections, operating budget (e.g., car wash);
variable costs: electric power (fuel), maintenance service, repair of damages not subject to insurance.
avoidable costs: public parking fees, clean transport zone entry fees, costs of saved time (ability to use bus lanes).

2.3. One-Off Costs

A vehicle’s purchase price is the biggest single cost incurred during the entire car ownership period. Independently of the catalogue price, the buyer can additionally receive a number of discounts and bonuses, for example due to the simultaneous purchase of a number of vehicles.
A wide and individual scope of the possibilities in this field means that for the purpose of this analysis, the cost of purchase of the analysed vehicles was established exclusively on the basis of the data provided by the manufacturer.
As the commercial vehicles were intended for use in urban logistics, it was assumed that the vehicles will be used exclusively for business purposes. In this case, entrepreneurs are allowed to deduct 100% of VAT tax costs from the cost of purchase of the vehicle (if they submit a VAT-26 tax form to the tax office and maintain a vehicle mileage logbook) and from operating costs, e.g., fuel or electricity costs [49].
Additionally, on the basis of existing regulations, commercial vehicles are exempt from excise tax. The original prices of both cars were therefore reduced by 3.1% of their value. The possibility of the amortisation of the cost of a fixed asset—the commercial vehicle—in the form of write offs was also included in the calculations. The amortisation of the cost of a commercial vehicle can be performed using: the linear amortisation method, the individual amortisation method and a one-off write off. Linear amortisation was implemented in the analysis, with an annual write-off rate based on the List of Annual Amortisation Rates that constitutes an appendix to the act on corporate tax. The implemented write-off rates are as follows: 20% for commercial vehicles of the maximum gross vehicle weight of less than 3.5 t with conventional engines, and 14% for the same type of vehicles with electric power [50].
On 22 November 2021, the National Fund for Environmental Protection and Water Management initiated the “My Electric” programme, under which entrepreneurs can apply for additional funding for the purchase of electric-only, factory new category N1 vehicles. Entrepreneurs wishing to purchase such a vehicle can apply for additional funding up to a maximum amount of PLN 50,000, but not exceeding 20% of eligible costs, or not exceeding 30% of eligible costs, but not more than PLN 70,000 in the case of the declaration of an average annual mileage of more than 20,000 km. The declared mileage will be checked after 2 years of operation [51].
It is notable that there is no maximum price for N1 electric vehicles, so any vehicle of this type is eligible for additional funding. Additional funding will be paid only in the form of a refund of already incurred costs, following the registration and insurance of the vehicle and following the submission of an application for additional funding. In the event of the expiry of allocated funds before the final deadline for the submission of applications (09/2025), the National Fund for Environmental Protection and Water Management will suspend the possibility of the submission of these applications.
This study determines the total cost of ownership of an electrical vehicle for two different variants:
(1)
without the consideration of any additional funding,
(2)
with the consideration of a maximum amount of additional funding, i.e., PLN 70,000.
Administrative costs and costs of adapting the vehicle to the fleet, which may consist of all expenses connected with the registration of vehicles, including branding, have been ignored in the TCO analysis, because they are the same for both electric and combustion-powered vehicles.

2.4. Recurring Costs

In the TCO analysis, it was assumed that recurring costs include all expenses that are repeatable at certain time intervals throughout the entire vehicle ownership period, such as the costs of insurance and technical maintenance of the vehicle.
In Poland, the insurance rate for a given vehicle is determined based on a number of factors, such as the value of vehicle, owner’s personal details (age, driving experience, years without accidents, place of residence), power of vehicle, type of vehicle and its intended use. The payment of OC insurance (obligatory third-party insurance for owners of mechanical vehicles) is obligatory, but in order to fully insure the vehicle against damage incurred as a result of accidents, forces of nature, vehicle theft or vandalism, and to ensure the protection of the driver’s and passengers’ life and health, it is also necessary to pay AC (Autocasco) comprehensive cover insurance, as well as the NNW (accidental death and injury) insurance. All of the mentioned constituents were included in the analysis.
Currently, insurance premiums for electric vehicles are higher than those for the same cars with other types of propulsion, which is mainly due to the higher initial value of electric vehicles. In the analysis, real-life costs for the analysed vehicles were taken into account, on the basis of data taken from their insurance policies.
Another recurring cost is connected with the periodic technical inspection of vehicles. The costs of technical inspections were established on the basis of the existing rate, which is PLN 99 per year (including the registration fee). Given that newly purchased vehicles are subject to analysis, it was taken into account that such a vehicle must undergo a technical inspection only after 3 years of operation, then 2 years after the first technical examination. After this period, further technical inspections are performed annually [52].
Additionally, routine vehicle maintenance was taken into account, with its frequency depending on the mileage or age of the vehicle. Its value was determined on the basis of [53].
Recurring costs also include expenses for the regular maintenance of a vehicle. This is a specific amount for the necessary maintenance of a vehicle in a clean condition and for the topping-up of main operating fluids (coolant, brake fluid, windshield washing fluid or transmission fluid). Most of the specified cost constituents affect the value of TCO, but do not differ between electric and combustion-powered vehicles; therefore, they were ignored in the presented TCO comparative analysis.

2.5. Variable Costs

Variable costs are all costs incurred by the owner of the vehicle throughout its entire operating period and they depend on many external factors that vary in time. The main expenses in this category include costs connected with the deterioration of energy carriers (fuel/electricity) and all costs connected with the servicing of a vehicle that are not covered by insurance or warranty and are caused by normal wear.
Servicing costs connected with vehicle maintenance depend on the type of car, its intended use, annual mileage and include all repair and replacement of the operating elements in a vehicle (brake pads, tyres, etc.) throughout the entire operating period of a vehicle.
Electric vehicles have fewer moving parts, e.g., engine oil and fuel filters are not changed (Table 1) therefore their service costs are lower than for cars with internal combustion engines. Brake disks and pads also wear down much more slowly due to the possibility of braking using the electric motor to a large extent [39,41].
The authors of this paper implemented specific market rates for various repairs and estimated the expected intervals of the replacement of parts on the basis of the manufacturer’s data and on the recommendations of service companies. Servicing costs were then evenly spread across all years covered by the analysis.
Among the recurring costs, operational costs connected with the degradation of the energy carrier used to propel the vehicle have the greatest impact on the final TCO [54].
Vehicles performing certain tasks in urban logistics travel along different routes with a different movement dynamic that depends on factors such as the nature of the performed task, driver’s driving style, weight of the load, road conditions, etc. In order to carry out a comparative analysis of the operational costs of vehicles, an average value of the consumption of energy and fuel was established and implemented as a constant throughout the whole period of analysis, and it was also assumed that the annual mileage was the same for the analysed vehicles. The costs of the refuelling of combustion vehicles and of the charging of electric vehicles were calculated as for the city cycle, with the assumption of fuel prices, the charging station network and average electricity prices for individual consumers valid for 2022.
The costs of charging were calculated based on the car’s initial and final charging parameters (current battery state of charge—20%, expected battery state of charge—80%), tariff rates offered by the operator and their components (amount of purchased energy, possible charging time), whereas the average consumption of energy was calculated on the basis of battery capacity data and the medium-range WLTP (Worldwide Harmonized Light-Duty Vehicles Test Procedure) claimed by the manufacturer.
The cost of a 100 km journey in an electric vehicle was calculated with the assumption that the amount of charged energy will be based on the average consumption of energy needed to travel 100 km, with the assumption of the calculation elements of a selected tariff and the maximum charging power specific for the vehicle under study.
Table 2 shows the costs connected with the refuelling/charging of the analysed vehicles at stations open to the public in Poland, while Figure 14 shows the cumulative costs connected with the charging/refuelling of the analysed vehicles during the analysed 10-year period.
For the sake of picture clarity, in the case of the costs determined for charging at public charging stations, only cumulative costs of charging established with the assumption of the minimum and maximum 1 kWh price implemented at public stations for charging with active current (AC) and direct current (DC) are shown.

3. Case Study—Analysis of Scenarios

3.1. Selection of Vehicles for Analysis

The analysis was based on the comparison of category N1 commercial vehicles of similar technical and operational parameters with different power sources and drivetrains.
The type of vehicle selected for analysis is the most popular commercial vehicle in Poland—the Renault Master (Figure 15).
The following variants were analysed:
variant 1—vehicle with an electric motor,
variant 2—vehicle with a diesel engine.
Table 3 includes technical parameters, costs such as the purchase of the vehicle and indexes connected with the analysed vehicles.

3.2. Analysed Scenarios for Electric Vehicles

The total cost of operation of an electrical vehicle was calculated for the following scenarios, and the results are presented in Figure 16, Figure 17, Figure 18, Figure 19, Figure 20, Figure 21, Figure 22, Figure 23, Figure 24 and Figure 25:
A. 
Without any refund for the purchase of an electric vehicle
Scenario A1—the electric vehicle is recharged only at home via an electrical socket;
Scenario A2—the electric vehicle is recharged only at public AC charging stations (the lowest price for 1 kWh was included in the calculations);
Scenario A3—the electric vehicle is recharged only at public AC charging stations (the maximum price for 1 kWh was included in the calculations);
Scenario A4—the electric vehicle is recharged only at public DC charging stations (the lowest price for 1 kWh was included in the calculations);
Scenario A5—the electric vehicle is recharged only at public DC charging stations (the maximum price for 1 kWh was included in the calculations);
B. 
With the consideration of a maximum possible refund for the purchase of an electric vehicle (PLN 70,000)
Scenario B1—the electric vehicle is recharged only at home via an electrical socket;
Scenario B2—the electric vehicle is recharged only at public AC charging stations (the lowest price for 1 kWh was included in the calculations);
Scenario B3—the electric vehicle is recharged only at public AC charging stations (the maximum price for 1 kWh was included in the calculations);
Scenario B4—the electric vehicle is recharged only at public DC charging stations (the lowest price for 1 kWh was included in the calculations);
Scenario B5—the electric vehicle is recharged only at public DC charging stations (the maximum price for 1 kWh was included in the calculations);

3.3. Results of Analysis
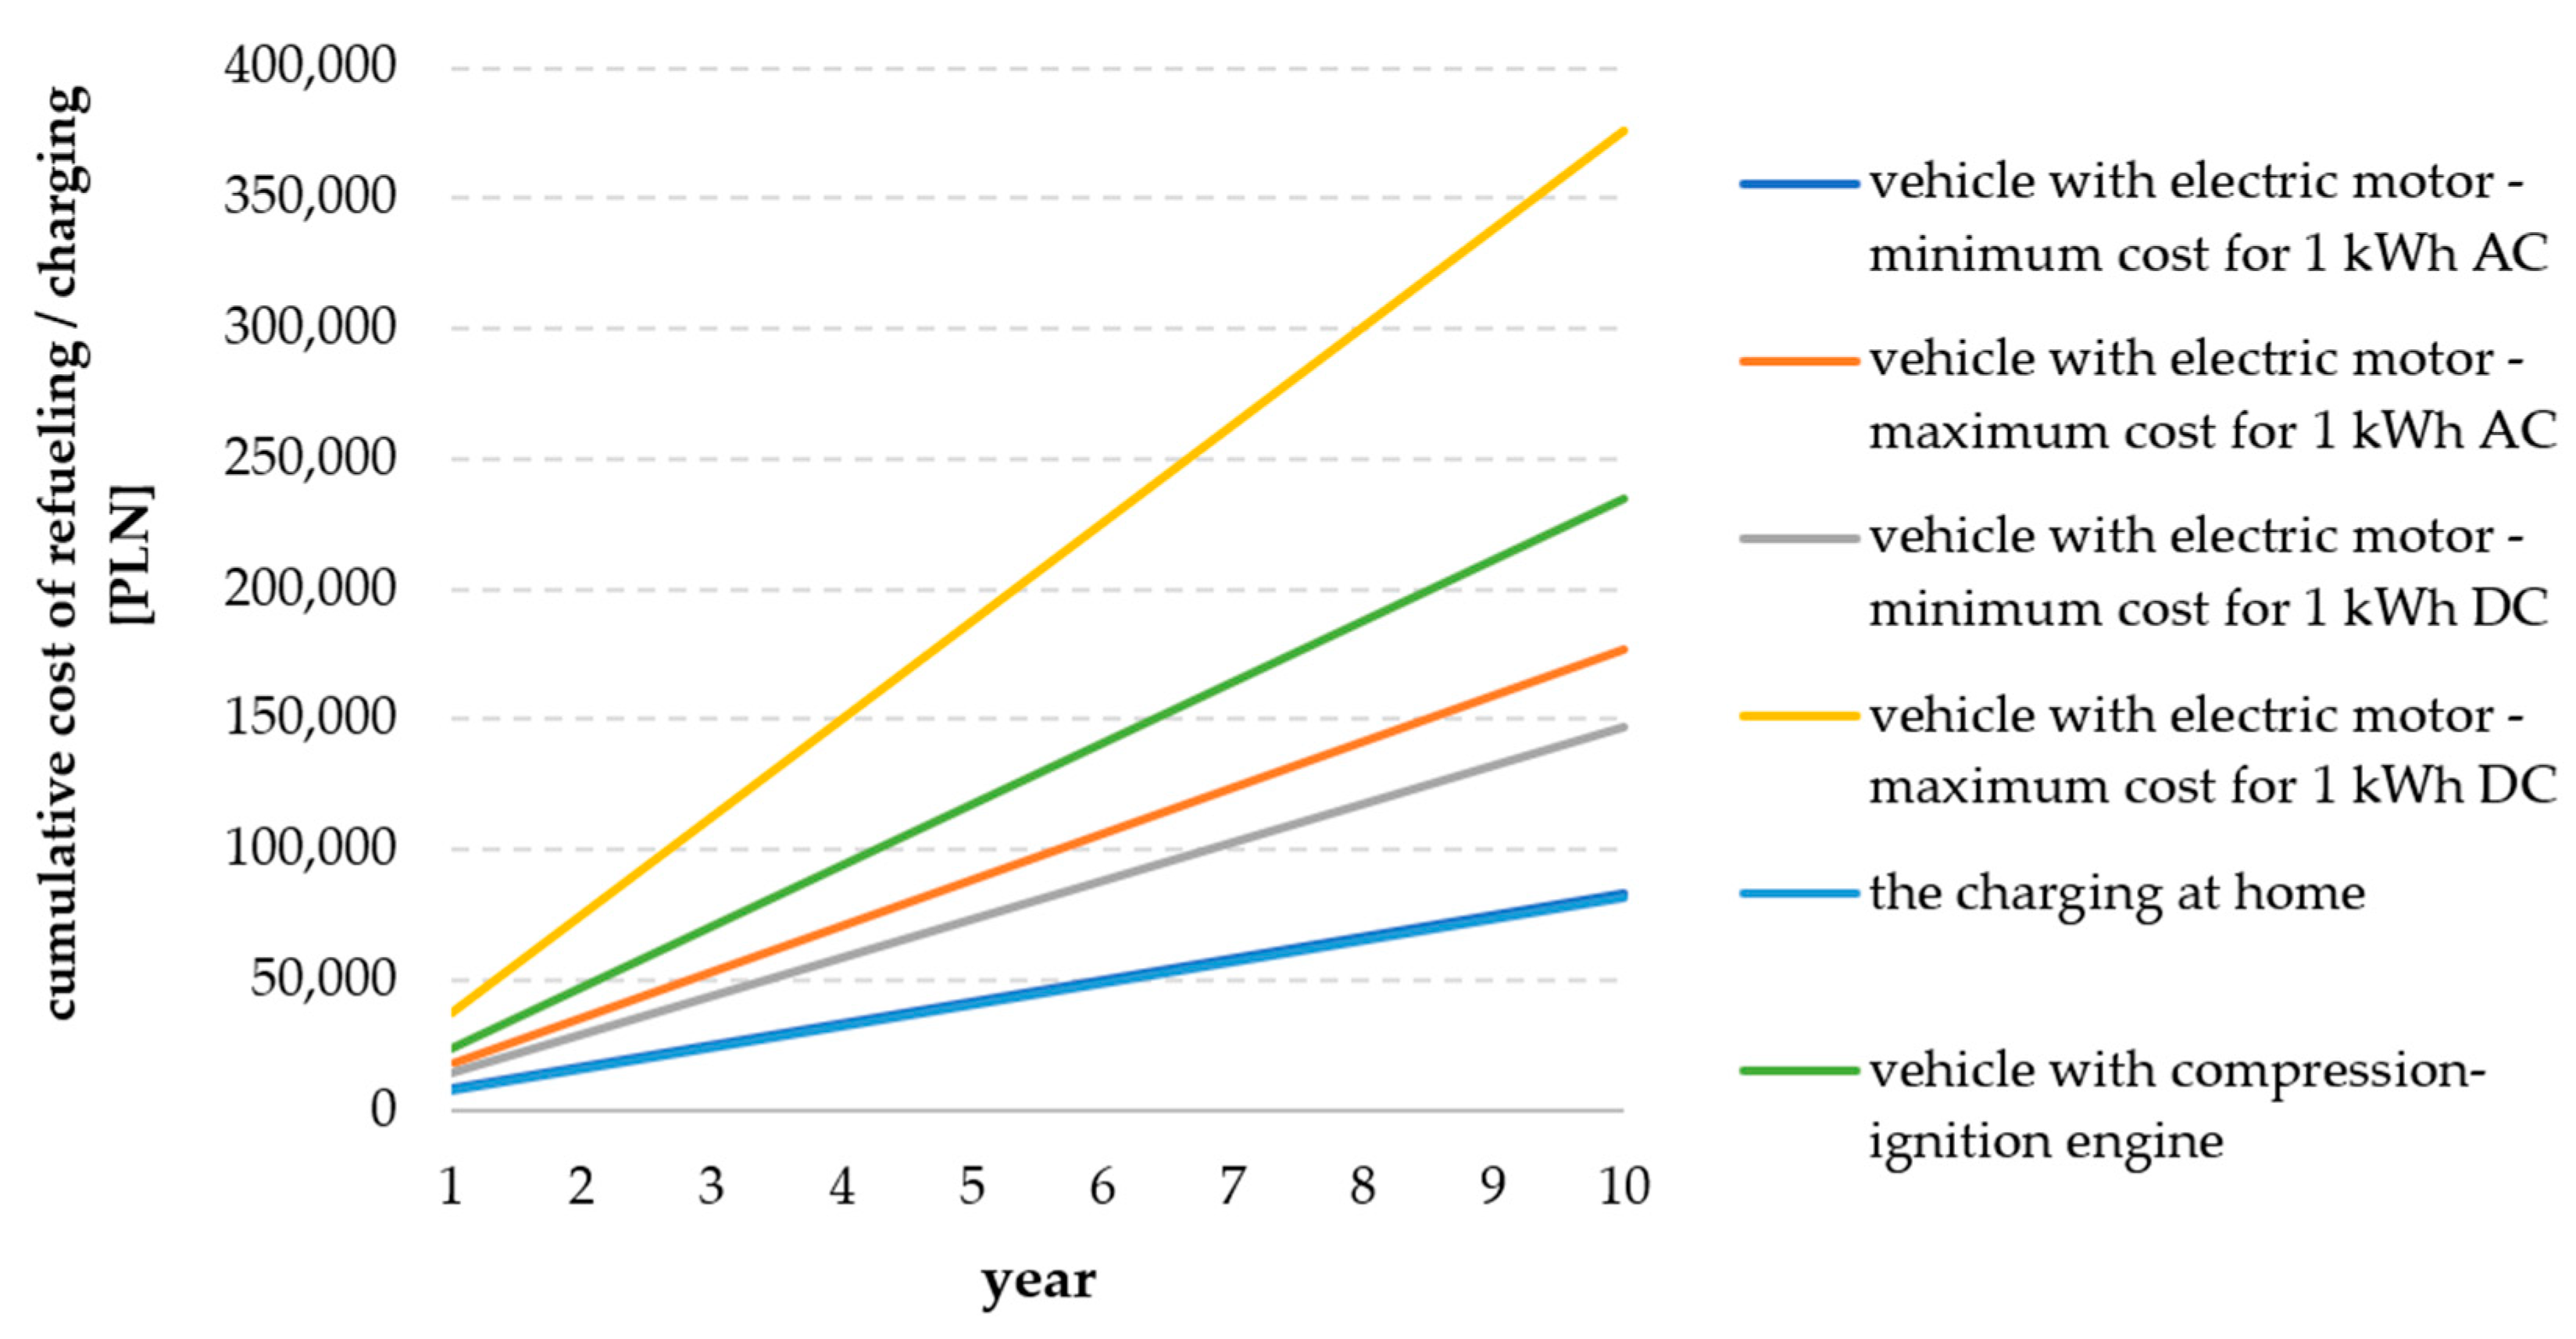
A. 
Without any refund for the purchase of an electric vehicle
Figure 16. Total cost of ownership of vehicle during the whole operating period (vehicle is recharged only at home via an electrical socket—Scenario A1).
Energies 15 08392 g016
Figure 17. Total cost of ownership of vehicle during the whole operating period—electric vehicle is recharged only at public AC charging stations (the lowest price for 1 kWh was included in the calculations—Scenario A2).
Energies 15 08392 g017
Figure 18. Total cost of ownership of vehicle during the whole operating period—electric vehicle is recharged only at public AC charging stations (the highest price for 1 kWh was included in the calculations—Scenario A3).
Energies 15 08392 g018
Figure 19. Total cost of ownership of vehicle during the whole operating period—electric vehicle is recharged only at public DC charging stations (the lowest price for 1 kWh was included in the calculations—Scenario A4).
Energies 15 08392 g019
Figure 20. Total cost of ownership of vehicle during the whole operating period—electric vehicle is recharged only at public DC charging stations (the highest price for 1 kWh was included in the calculations—Scenario A5).
Energies 15 08392 g020
B. 
With the consideration of a maximum possible refund for the purchase of an electric vehicle
Figure 21. Total cost of ownership of vehicle during the whole operating period (vehicle is recharged only at home via an electrical socket—Scenario B1).
Energies 15 08392 g021
Figure 22. Total cost of ownership of vehicle during the whole operating period—electric vehicle is recharged only at public AC charging stations (the lowest price for 1 kWh was included in the calculations—Scenario B2).
Energies 15 08392 g022
Figure 23. Total cost of ownership of vehicle during the whole operating period—electric vehicle is recharged only at public AC charging stations (the highest price for 1 kWh was included in the calculations—Scenario B3).
Energies 15 08392 g023
Figure 24. Total cost of ownership of vehicle during the whole operating period—electric vehicle is recharged only at public DC charging stations (the lowest price for 1 kWh was included in the calculations—Scenario B4).
Energies 15 08392 g024
Figure 25. Total cost of ownership of vehicle during the whole operating period—electric vehicle is recharged only at public DC charging stations (the highest price for 1 kWh was included in the calculations—Scenario B5).
Energies 15 08392 g025

4. Results

This research has revealed that in cases where no refund for the purchase of an electric vehicle, which is offered to the buyers of electric commercial vehicles in Poland, has been considered, with a scenario assuming that the electric vehicle will be recharged at home or at public AC charging stations and with the implementation of the lowest price of 1 kWh, the total cost of ownership of the vehicle is lower for an electric vehicle (Table 4) than for an equivalent combustion engine vehicle. This cost was lower by 0.8% for scenario A1 and by 0.4% for scenario A2. In the other scenarios, the TCO of an electric vehicle was higher than that of a combustion engine vehicle by 18.3% in the case of scenario A3, and by 12.3% in the case of scenario A4. The biggest difference between the TCOs for the two categories of vehicles was observed in scenario A5, in which the electric vehicle was recharged using DC chargers and which took into account the maximum price of 1 kWh. In this scenario, the total cost of ownership of an electric vehicle was higher than that of a combustion engine vehicle by 58.2%. Generally, it can be concluded that only in the cases of scenario A1 and A2 the total cost of ownership of the analysed vehicles will be equal after 10 years of operation. In the other scenarios (A3, A4, A5), the TCO after 10 years of operation is higher in the case of an electrical vehicle than in the case of a combustion engine vehicle.
In the second case, which takes into account a maximum possible refund for the purchase of an electric vehicle, the total cost of ownership of an electric vehicle and of a combustion engine vehicle will become equal already after 5 years in the case of scenarios B1 and B2. The TCO after 10 years in these scenarios was lower for an electric vehicle than for a combustion engine vehicle by 14.8%—scenario B1, and by 14.4%—scenario B2. The TCO for an electric vehicle was also lower after 10 years of operation in the case of scenario B4, in this case by 1.7%. In the case of this scenario, the TCO for an electric vehicle and for a combustion engine vehicle became equal after circa 9 years of operation. In the cases of scenarios B3 and B5, the total cost of ownership of an electric vehicle was higher by 4.29% in the case of scenario B3 and by 44.2% in the case of scenario B5 (Table 4).

5. Conclusions

None of the current investigators have any doubt that electromobility is currently the most important megatrend in the global automotive industry, which also applies to the segment of utility vehicles and to urban logistics. The popularisation of electric vehicles has the potential to improve the quality of life in Polish cities, through the reduction in pollution levels (in the case of the utilisation of energy from renewable sources, during the operational phase the commercial vehicle is 100% zero emission) and the reduction in noise emission levels [55]. The development of electromobility may also help to reduce traffic congestion (in Poland, electric-only vehicles are entitled to use bus lanes and are exempt from parking fees in toll parking zones in city centres). Additionally, in the near future, thanks to V2G technology, electric vehicles will be also used as mobile energy storage units. Additionally, through the electrification of the fleet of their vehicles, companies will be able to implement the policy of corporate social responsibility. However, electric vehicles cannot only be used for marketing purposes and as a way to improve a company’s image. Investing in a zero-emission fleet by entrepreneurs should be economically viable. The ownership of commercial cars generates substantial costs for companies, which are trying to optimise these costs in every way in the current economic crisis.
The comparative analysis carried out in this article points to an urgent need to introduce additional subsidies in the sector of N1 category commercial electric vehicles, in order to make them economically competitive against their combustion powered equivalents.
A potential buyer of an electric commercial vehicle is currently offered financial assistance only during the purchase of a new vehicle, which on the basis of the performed calculations is not effective enough. With the consideration of the maximum possible refund for the purchase price of a BEV, the total cost of ownership of such a vehicle will become lower than the TCO for an equivalent vehicle with a combustion engine only after at least 5 years. Therefore, it seems necessary to introduce subsidies, as in other European states, that would also apply to the purchase of second-hand electric vehicles. We must also bear in mind that most manufacturers, due to the process of degradation and loss of efficiency, recommend the replacement of the traction battery after the mileage of, for example, 160,000 km, which generates more additional costs for the user in the amount of between PLN 86,000 and 100,000. Investigators believe that this may be the answer to the question of the very limited popularity of electric vehicles on the market, despite the manufacturers’ declaration of the lower costs of their operation in comparison with ICE vehicles.
From the perspective of the legislative authorities, it would seem worthwhile to consider the introduction of certain tax benefits for electric commercial vehicles, in order to make them competitive against their combustion engine equivalents not only at the moment of purchase but also during their operation. One example of such a solution could be the possibility of the tax deduction of an amount higher than 100% of the purchase of a commercial vehicle (e.g., 125% or 150%) as company costs, by way of amortisation write offs, or at least the implementation of parity in the amortisation rates. The period of the amortisation of an electric commercial vehicle is currently longer, which may discourage a potential buyer from its purchase and convince them to purchase a combustion engine vehicle, because the purchase price of the latter can be deducted from the income as company costs faster.
Additionally, the authors of this article believe that the Polish legal system should implement one of the directives of the European Union, which allows an electric commercial vehicle of the weight between 3.5 t and 4.25 t to be driven by drivers with a category B license. Electric vehicles, due to the additional weight of the battery, are much heavier than their combustion engine equivalents. The implementation of the above solution would allow drivers to use electric commercial vehicles without the need to obtain a higher category driving license.
In conclusion, the presented research on the problem of the total cost of ownership of Light Commercial Electrical Vehicles in City Logistics does not fully resolve the subject of the research, but only acts as encouragement for further scientific discussion on the issue. In the near future there is bound to be the need for much more extensive research covering legislative, technological and environmental changes in order to identify the role of the TCO in the process of increasing the percentage of electric commercial vehicles in the context of the problems of urban logistics based on the idea of electromobility.

Author Contributions

Formal analysis, E.S.-M.; Visualization, Z.Ł.; Writing—original draft, W.L.; Writing—review & editing, E.S.-M., D.P. and Z.Ł. All authors have read and agreed to the published version of the manuscript.

Funding

This research received no external funding.

Conflicts of Interest

The authors declare no conflict of interest.

References

  1. United Nations. Departament of Economic and Social AFFairs. 2018 Revision of World Urbanization Prospects. Available online: https://www.un.org/development/desa/publications/2018-revision-of-world-urbanization-prospects.html (accessed on 20 April 2022).
  2. European Commission. The 2018 Ageing Report: Economic and Budgetary Projections for the EU Member States (2016–2070). Available online: https://ec.europa.eu/info/sites/info/files/economy-finance/ip079_en.pdf (accessed on 11 March 2022).
  3. European Commission. Sustainable Transport. Search This Website Internalisation of Transport External Costs. Available online: https://ec.europa.eu/transport/themes/sustainable-transport/internalisation-transport-external-costs_en (accessed on 10 May 2022).
  4. Hartgen, D.; Fields, G. Gridlock and Growth: The effect of Traffic Congestion on Regional Economic Performance. Policy Summary of Study (No. 371), Reason Foundation. 2009. Available online: http://66.113.237.135/Projects/National/USA/cong_region_performance/2009-06-22_Final_Summary_PS371.pdf (accessed on 18 April 2021).
  5. Izdebski, M.; Jacyna-Golda, I.; Golebiowski, P.; Golda, P.; Pyza, D.; Zak, J. Decision Problems in Designing Database Architecture for the Assessment of Logistics Services. Sci. J. Sil. Univ. Technol. Ser. Transp. 2020, 108, 53–72. [Google Scholar] [CrossRef]
  6. Ministry of the Environment. Energy Saving Trust—Leaseplan.pl. Ecology in Car Fleets. Available online: https://docplayer.pl/2732049-Ekologia-we-flotach-samochodowych-make-a-green-move-greenplan-there-is-a-lot-to-be-won.html (accessed on 7 November 2022).
  7. Europejska Agencja Środowiska. Airquality in Europe—2017 Report. Available online: https://www.eea.europa.eu/publications/air-quality-in-europe-2017 (accessed on 5 May 2022).
  8. WHO. Ambient Air Pollution: A Global Assessment of Exposure and Burden of Disease. Available online: https://www.who.int/phe/publications/air-pollution-global-assessment (accessed on 29 March 2022).
  9. Europejska Agencja Środowiska. Signals 2016—Towards Clean and Smart Mobility. Available online: https://www.eea.europa.eu/publications/signals-2016 (accessed on 16 May 2022).
  10. European Parliament and Council of the European Union. Directive of the European Parliament and of the Council on the Limitation of Emissions of Certain Pollutants into the Air from Medium Combustion Plants SWD(2013) 532 Final Dated 18/12/2013. Available online: https://eur-lex.europa.eu/ (accessed on 24 April 2022).
  11. Gmobility. Available online: https://gmobility.eu/air-quality-and-local-pollutants-part-1/ (accessed on 17 May 2022).
  12. World Health Organization. Data and Statistics. Available online: http://www.euro.who.int/en/health-topics/environment-and-ealth/noise/data-and-statistics (accessed on 9 April 2022).
  13. Europejska Agencja Środowiska. Data and Maps. Available online: https://www.eea.europa.eu/data-and-maps (accessed on 14 May 2022).
  14. European Environment Agency. Environmental noise in Europe—2020, Report No 22/2019. Available online: https://www.eea.europa.eu/publications/environmental-noise-in-europe (accessed on 7 November 2022).
  15. European Commission. Handbook on the External Costs of Transport VERSION 2019—1.1. Available online: https://op.europa.eu/o/opportal-service/download-handler?identifier=9781f65f-8448-11ea-bf12-01aa75ed71a1&format=pdf&language=en&productionSystem=cellar&part= (accessed on 16 April 2022).
  16. European Parliament. Communication from the Commission to the European Parliament, the Council, the European Economic and Social Committee and the Committee of the Regions Sustainable and Smart Mobility Strategy—Putting European Transport on Track for the Future COM/2020/789 Final. Available online: https://eur-lex.europa.eu/legal-content/EN/TXT/?uri=CELEX%3A52020DC0789 (accessed on 7 November 2022).
  17. European Parliament. Alternative Fuel Infrastructures for Heavy-Duty Vehicles. Available online: https://www.europarl.europa.eu/RegData/etudes/STUD/2021/690888/IPOL_STU(2021)690888_EN.pdf (accessed on 9 March 2022).
  18. European Cyclists’ Federation. Available online: https://ecf-com.translate.goog/news-and-events/news/low-emission-zones-european-success-story?_x_tr_sl=auto&_x_tr_tl=pl&_x_tr_hl=pl (accessed on 17 April 2022).
  19. Urban Access Regulations in Europe. Available online: https://urbanaccessregulations.eu/userhome/map (accessed on 3 April 2022).
  20. European Automobile Manufacturers’ Association. Available online: https://www.acea.auto/files/ACEA_vans_by_fuel_type_full-year_2020.pdf (accessed on 17 March 2022).
  21. Polski Związek Przemysłu Motoryzacyjnego. Available online: https://www.pzpm.org.pl (accessed on 7 November 2022).
  22. Zaniewska-Zielińska, D. Problemy rozwoju elektromobilności w Polsce. Eur. Reg. 2018, 2, 63–78. [Google Scholar]
  23. Krawiec, S.; Krawiec, K. Rozwój elektromobilności w Polsce. uwarunkowania, cele i bariery. Zesz. Nauk. Uniw. Ekon. W Katowicach 2017, 332, 17–24. [Google Scholar]
  24. Nikołajewka, A.; Adey, P.; Cresswell, T.; Lee, J.Y.; Nóvoa, A.; Temenos, C. Commoning mobility: Towards a new politics of mobility transitions. Trans. Inst. Br. Geogr. 2019, 44, 346–360. [Google Scholar]
  25. Correa, D.F.; Beyer, H.L.; Fargionec, J.E.; Hill, J.D.; Possingham, H.P.; Thomas-Hall, S.R.; Schenka, P.M. Towards the implementation of sustainable biofuel production systems. Renew. Sustain. Energy Rev. 2019, 107, 250–263. [Google Scholar] [CrossRef]
  26. Standing, C.; Standing, S.; Biermann, S. The implications of the sharing economy for transport. Transp. Rev. 2018, 39, 226–242. [Google Scholar] [CrossRef]
  27. Pisonia, E.; Christidis, P.; Thunis, P.; Trombetti, M. Evaluating the impact of “Sustainable Urban Mobility Plans” on urban background air quality. J. Environ. Manag. 2019, 231, 249–255. [Google Scholar] [CrossRef]
  28. Sendek-Matysiak, E. Najważniejsze bariery rozwoju elektromobilności w Polsce. Przegląd Komun. 2020, 3, 8–14. [Google Scholar]
  29. Polskie Stowarzyszenie Paliw Alternatywnych. Barometr Nowej Mobilności 2020/21. Available online: https://pspa.com.pl/wp-content/uploads/2022/01/barometr_nowej_mobilnosci_2021_raport.pdf (accessed on 3 June 2022).
  30. Thiel, C.; Perujo, A.; Mercier, A. Cost and CO2 aspects of future vehicle options in Europe under new energy policy scenarios. Energy Policy 2010, 38, 7142–7151. [Google Scholar] [CrossRef]
  31. Weiss, M.; Patel, M.; Junginger, M. On the electrification of road transport—Learning rates and price forecasts for hybrid-electric and battery-electric vehicles. Energy Policy 2012, 48, 374–393. [Google Scholar] [CrossRef]
  32. Lee, H.; Lovellette, G. Will Electric Cars Transform the US Vehicle Market? s.l., Energy Technology Innovation Policy Research Group. 2011. Available online: https://www.belfercenter.org/sites/default/files/legacy/files/Lee%20Lovellette%20Electric%20Vehicles%20DP%202011%20web.pdf (accessed on 7 November 2022).
  33. Crist, P. Electric Vehicles Revisited—Costs, Subsidies and Prospects. In Proceedings of the International Transport Forum, Paris, France, 6 March 2012. [Google Scholar]
  34. Palencia, J.; Furubayashi, T.; Nakata, T. Techno-economic assessment of lightweight and zero emission vehicles deployment in the passenger car fleet of developing countries. Appl. Energy 2014, 123, 129–142. [Google Scholar] [CrossRef]
  35. Wu, G.; Inderbitzin, A.; Bening, C. Total cost of ownership of electric vehicles compared to conventional vehicles: A probabilistic analysis and projection across market segments. Energy Policy 2015, 80, 196–214. [Google Scholar] [CrossRef]
  36. Ellram, L.; Siferd, S. Total cost of ownership: A key concept in strategic cost management decisions. J. Bus. Logist. 1988, 1, 55–80. [Google Scholar]
  37. Redelbach, M.; Friendrich, H. Competitive Cost Analysis of Alternative Powertrain Technologies. In Proceedings of the International Advanced Mobility Forum 2012 (IAMF), Geneva, Switzerland, 7–8 March 2012. Research Gate. [Google Scholar]
  38. Hurkens, K.; van der Valk, W.; Wynstra, F. Total cost of ownership in the services sector: A case study. J. Supply Chain Manag. 2006, 42, 27–37. [Google Scholar] [CrossRef]
  39. Lebeau, K.; Lebeau, P.; Macharis, C.; Mierlo, J.V. How expensive are electric vehicles? A total cost of ownership analysis. World Electr. Veh. J. 2013, 6, 996–1007. [Google Scholar] [CrossRef]
  40. Macharis, C.; Lebeau, P.; Van Mierlo, J.; Lebeau, K. Electric versus conventional vehicles for logistics: A total cost of ownership. In Proceedings of the 2013 World Electric Vehicle Symposium and Exhibition (EVS27), Barcelona, Spain, 17–20 November 2013; pp. 1–10. [Google Scholar]
  41. Hagman, J.; Ritzen, S.; Janhager, J.; Susilo, Y. Total cost of ownership and its potential implications for battery electric vehicle diffusion. Res. Transp. Bus. Manag. 2016, 18, 11–17. [Google Scholar] [CrossRef] [Green Version]
  42. Plotz, P.; Gnann, T.; Wietschel, M. Total Ownership Cost Projection for the German Electric Vehicle’ with Implications for its Future Power and Electricity Demand, 7th Conference on Energy Economics and Technology Infrastructure for the Energy Transformation. 2021. Available online: https://www.researchgate.net/publication/267825503_Total_Ownership_Cost_Projection_for_the_German_Electric_Vehicle_Market_with_Implications_for_its_Future_Power_and_Electricity_Demand (accessed on 3 March 2022).
  43. The Team of Economic Advisors (TOR). The Electromobility in Poland, Development Prospects, Opportunities and Threats. 2017. Available online: https://netprstorage.s3.eu-west-1.amazonaws.com/6/3006/1137349/raport_elektromobilnosc.pdf?response-content-disposition=inline&X-Amz-Algorithm=AWS4-HMAC-SHA256&X-Amz-Date=20221109T211953Z&X-Amz-SignedHeaders=host&X-Amz-Expires=1800&X-Amz-Credential=AKIAUOC4YS7FFVDQ7L33%2F20221109%2Feu-west-1%2Fs3%2Faws4_request&X-Amz-Signature=9ab6f55c3b57f2ae32fcc2478c0b5997b05f184be64b833f51385941fafc2983 (accessed on 7 November 2022).
  44. Innogy Polska. The Highway to Electromobility. 2017. Available online: https://docplayer.pl/54141438-Autostrada-do-elektromobilnosci-czy-jestesmy-gotowi-na-samochody-elektryczne.html (accessed on 7 November 2022).
  45. Sendek-Matysiak, E.; Grysa, K. Assessment of the Total Cost of Ownership of Electric Vehicles In Poland. Energies 2021, 14, 4806. [Google Scholar]
  46. Szymaniak, W. Ocena opłacalności samochodu elektrycznego w porównaniu z samochodem benzynowym. Deb. Nauk. Stud. Wyższej Szkoły Bank. 2020, 20. Available online: https://www.wydawnictwo.wsb.pl/sites/wydawnictwo.wsb.pl/files/czasopisma-tresc/07_Szymaniak.pdf (accessed on 7 November 2022).
  47. Szumska, E.; Pawełczyk, M. TCO comparison for city buses equipped with hybrid and conventional propulsion drive. Pr. Nauk. Politech. Warsz. Transp. 2017, 118, 277–285. [Google Scholar]
  48. Szumska, E.; Jurecki, R.; Pawełczyk, M. Assessment of Total Costs of Ownership for Midsize Passenger Cars with Conventional and Alternative Drive Trains. Commun.—Sci. Lett. Univ. Zilina 2019, 21, 21–27. [Google Scholar] [CrossRef]
  49. Infor.pl, Odliczenie 100% VAT od Samochodów a Ewidencja Przebiegu (Kilometrówka). Available online: https://ksiegowosc.infor.pl/podatki/vat/odliczanie-i-zwrot-podatku/699780,Odliczenie-100-VAT-od-samochodow-a-ewidencja-przebiegu-kilometrowka.html (accessed on 8 March 2022).
  50. Kancelaria Sejmu, R.P. Ustawa z Dnia 15/02/1992 r. o Podatku Dochodowym od Osób Prawnych. Available online: https://isap.sejm.gov.pl/isap.nsf/DocDetails.xsp?id=wdu19920210086 (accessed on 7 November 2022).
  51. Narodowy Fundusz Ochrony Środowiska i Gospodarki Wodnej. eVAN—Funding for the Purchase of an Electric Van (N1). Available online: https://www.nfosigw.gov.pl (accessed on 17 April 2022).
  52. Rozporządzenie Ministra Infrastruktury z Dnia 29 Września 2004 r. w Sprawie Wysokości Opłat Związanych z Prowadzeniem stacji Kontroli Pojazdów Oraz Przeprowadzaniem Badań Technicznych Pojazdów. Available online: https://isap.sejm.gov.pl/isap.nsf/DocDetails.xsp?id=WDU20042232261 (accessed on 1 June 2022).
  53. Renault.pl. Cars. Available online: https://www.renault.pl/ (accessed on 20 May 2022).
  54. Palmer, K.J.; Tate, E.; Wadud, Z.; Nellthorp, J. Total cost of ownership and market share for hybrid and electric vehicles in the UK, US and Japan. Appl. Energy 2018, 209, 108–119. [Google Scholar] [CrossRef]
  55. Pyza, D.; Gołda, P.; Sendek-Matysiak, E. Use of hydrogen in public transport systems. J. Clean. Prod. 2022, 335, 130247. [Google Scholar] [CrossRef]
Figure 1. Predicted percentage of total population living in cities (own research on the basis of [1]).
Energies 15 08392 g001
Figure 2. Predicted number of people living in cities relative to the world’s total population (own research on the basis of [1]).
Energies 15 08392 g002
Figure 3. Predicted number of people living in cities in relation to the total population of the European Union (own research on the basis of [2]).
Energies 15 08392 g003
Figure 4. The share of road transport in air pollution [6].
Energies 15 08392 g004
Figure 5. Percentage of EU urban population exposed to air pollutant concentrations above WHO air quality guidelines [11].
Energies 15 08392 g005
Figure 6. Number of people exposed to average day–evening–night noise levels (Lden) ≥ 55 db in Europe, 2019 [13].
Energies 15 08392 g006
Figure 7. Number of people exposed to night-time noise (Lnight) ≥ 50 db in Europe, 2019 [13].
Energies 15 08392 g007
Figure 8. Share of the different modes on total external costs 2016 for EU28 [15].
Energies 15 08392 g008
Figure 9. Total number of AF light commercial vehicles (N1) in the European Union.
Energies 15 08392 g009
Figure 10. Zero- and low-emission zones within the European Union, 2022 [19].
Energies 15 08392 g010
Figure 11. Market share of new light commercial vehicles (up to 3.5 t) by fuel type in 2020 [20].
Energies 15 08392 g011
Figure 12. Answers to the question: “Which factor mostly affected your decision when choosing the car you most often use?” stated in the course of the “New Mobility Barometer 2020/2021” study [29].
Energies 15 08392 g012
Figure 13. TCO model for the vehicles analysed.
Energies 15 08392 g013
Figure 14. The cumulative cost of refuelling/charging of the analysed vehicles.
Energies 15 08392 g014
Figure 15. The most popular models in terms of the number of new registered N1 commercial vehicles in Poland in 2021 [21].
Energies 15 08392 g015
Table 1. Maintenance service of an electric and combustion-powered vehicle.
Electric VehicleCombustion Powered Vehicle
Annual service
Oil changeNoYes
Oil filter changeNoYes
Air filter changeNoYes
Cabin air filter changeYesYes
General diagnosticsYesYes
Maintenance service
Valvetrain elements replacementNoYes
Clutch replacementNoYes
Replacement/cleaning of spark plugsNoYes
Replacement of beltsNoYes
Replacement of sealsNoYes
Replacement of traction batteryYes (if efficiency falls below 70%)No
Replacement of brake pads and disksYes (ca. every 80,000 km)Yes
Replacement of operating fluidsYesYes
Incidental service
Turbocharger failureNoYes
Cylinder head gasket damage NoYes
DPF filter replacementNoYes
Gearbox damageNoYes
Failure of accessoriesYesYes
Table 2. Cost of a 100 km journey in the analysed vehicles [PLN].
Cost of Refuelling
Diesel78.29
Cost of Charging
OperatorType of charging
ACDC
Greenway45.24–58.6849.05–97.73
PKN Orlen34.4060.86–73.03
EV+28.20–50.9364.44–100.02
PGE Nowa Era27.9249.40–51.91
REVNET30.7464.44
Lotos59.0059.00
GO + Eauto32.4357.28
TAURON34.12–36.9471.24–82.70
IONITY-53.70–125.30
charging at home27.21-
Table 3. Technical parameters and costs of the purchase of analysed vehicles [53].
ParametersVariant 2Variant 1
Kerb weight [kg]17571969
Loading capacity [kg]10431131
Total length [m]5.055.07
Total width [m]2.072.07
Type of “fuel”diesel oilelectricity
Average consumption of diesel oil [L]/electricity [kWh] needed to cover a distance of 100 km9.2035.80
Maximum power [kW]7456
Maximum torque [Nm]285225
Maximum speed [km/h]135100
Acceleration to 100 km/h [s]21.5022
Maximum range [km]1012117
Cost of purchase of vehicle [PLN] *168,313317,586
Price of 1 L of diesel oil/1 kWh [PLN] *8.510.76
Mileage [km/year]30,00030,000
Analysed period [years]1010
* Prices valid as of 12 June 2022.
Table 4. Difference between the total cost of ownership (TCO) for an electric vehicle and for a combustion engine vehicle [%].
BEV Charging MethodWith Compression Ignition Engine
w/o RefundMax Refund
at home via electrical socket−0.8−14.8
public AC charging stations (lowest price for 1 kWh considered in the calculations)−0.4−14.4
public AC charging stations (highest price for 1 kWh considered in the calculations)18.34.29
public DC charging stations (lowest price for 1 kWh considered in the calculations)12.3−1.7
public DC charging stations (highest price for 1 kWh considered in the calculations)58.244.2
Publisher’s Note: MDPI stays neutral with regard to jurisdictional claims in published maps and institutional affiliations.

