Abstract
The growing demand for energy is accelerating the process of consuming non-renewable energy sources, so special attention should be paid to the development of renewable energy as the energy obtained from renewable energy sources (RES) will reduce the consumption of primary raw materials and reduce emissions of harmful substances entering the atmosphere. The aim of this article is thus to investigate the attitude of Polish consumers towards renewable energy sources and to discover the relationship between the level of awareness and other factors such as age and education. The results of the research revealed that there was a correlation between the age and level of education of the respondents and their willingness to consider the issues related to renewable energy sources and implement solutions in their households that take into account the consumption of natural energy sources (p-value of the significance test for age is 0.0001227, and p-values of independence test for the level of education are 0.00013). The discovery of such correlations will allow knowing in which direction the efforts should be intensified in order to reach the largest part of society.
1. Introduction
The European Union’s energy policy is not only limited to the energy sector, but also takes into account the environment and taxation, trade, and competition [1,2]. It is aimed at building a common energy market, ensuring the security of the energy supply, and protecting the environment. Increased demand for energy, related to the progress of civilization and the level of population growth, forces people to seek alternative energy sources [3,4,5,6]. From the perspective of sustainable energy strategies, they typically include three main technologies of change: demand-side savings [7], improving the energy efficiency of production [8], and replacing fossil fuels with various renewable energy sources [9].
First, a major challenge for all energy economies is to increase the amount of renewable energy, which is considered one important resource in many countries around the world [10,11,12]. With regard to ensuring energy stability, sustainable economy, and environmental aspects, Directive 2009/28/EC of the European Parliament and of the Council of 23 April 2009 on the promotion of the use of energy from renewable sources [13] was promulgated, requiring Member States to ensure a certain share of energy from renewable sources in the gross final consumption of energy in 2020. Pursuant to the above-mentioned directive, the EU countries are obliged to achieve a 20% share of energy from renewable sources in the gross final consumption of energy. For Poland, this share was assumed at the level of 15%. The indicator was met at the level of 16.10%.
The European Union’s climate-neutral economy with a net zero greenhouse gas emission is a European Union target for the future and should be achieved by 2050. In pursuit of this target, greenhouse gas emission is expected to drop by 55% by 2030 compared to 1990. These aims are formulated within the European Green Deal [14] and are the result of the Paris Agreement where the UE is committed to climate action [15]. The Paris Agreement that came into force in 2016 assumes limitation in global warming below 2 °C, preferably below 1.5 °C compared to preindustrial levels. The only way to achieve the set goals is to develop the economy based on RES.
In 2020, for the first time, the EU achieved an advantage in using renewable energy (38%) over fossil fuels (37%) as a source of electricity [16]. The situation in Poland is not similar; currently, 64.95% of power production is obtained from coal, and the share of RES in the energy mix is only 12.7% [17,18].
Non-renewable or conventional energy sources with limited availability include hard coal and lignite, natural gas, crude oil, and uranium, which are used in nuclear power plants. Non-renewable raw materials for energy production can be divided into three groups: solid, liquid, and gaseous. From these raw materials, we can produce electricity, heat, and mechanical energy.
Hard emission coal and lignite as carriers are considered to be the dirtiest types of fuels. During the combustion of these fuels large amounts of carbon oxides, sulfur, nitrogen, mercury, and lead are released into the atmosphere [19,20]. The main causes of pollutant emissions in Poland [21] are shown in Figure 1.
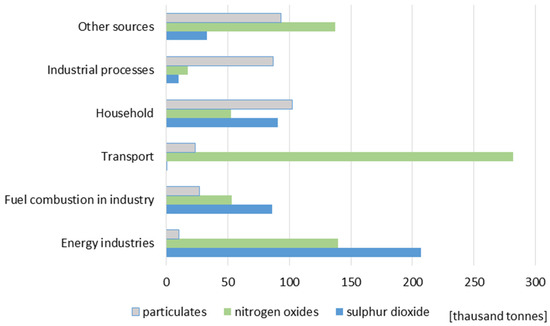
Figure 1.
Balance of main air pollutants emission in Poland in 2019.
Polish and global power generation still relies mainly on fossil fuels, but there is a growing shift away from this type of energy generation. The production of electricity from coal in Poland reached its highest value in 2021 and increased by 26% compared to 2020 [22]. The authors also cite International Energy Agency (IEA) estimates that after a slight decline in 2020, electricity demand growth in 2021 was 6%, and CO2 emissions increased by a record 7%. Optimistically, coal production is forecast to fall by 8 Mt by 2024, from 107 Mt to 99 Mt. Burning more coal, in addition to emitting carbon dioxide and sulfur dioxide, involves depositing millions of tons of ash in landfills [23].
Rapid economic and population growth has meant that resources of non-renewable raw materials used in energy production have rapidly begun to dwindle. Fossil fuels are rapidly depleting and contributing to environmental pollution. This is why there is an extremely strong emphasis on increasing the use of RES, which are accessible to everyone and do not pollute the environment [24]. Sometimes a source cannot be fully exploited even though it is available. This may be due to technical or economic constraints, which determine whether a particular source will be available. At present, energy is mainly produced from fossil fuels due to lower costs. However, more and more attention is being paid to RES. This has necessitated the search for other alternative methods [25]. In the near future, Poland, in order to achieve the goals formulated by the EU must focus more on the development of RES based on wind, solar, water, hydrogen, biomass, biogas, geothermal, and decarbonized gases [26]. Due to the COVID pandemic and, above all, the war in Ukraine, the rapid development of RES seems to be particularly necessary. The transformation from the Polish economy based on coal to that based on the RES is conditioned by many factors of political, geographic, social, economic, and technological nature.
For several decades, significant development of RES has been observed in Poland. The increase in the total installed capacity obtained from RES over the decade from 2010 was over 43%. At the end of 2020, wind energy had the largest share in the total installed capacity—64%, followed by biomass—15%, hydropower—10%, photovoltaics—9%, and biogas—3%. The highest increase over the decade was recorded by photovoltaics—almost 1149%, wind—39%, biomass—35%, biogas—20%, and a slight decrease of 1% was recorded by hydropower [27,28,29]. The dynamics of changes in individual types of RES installations in Poland since 2005, based on information on installations that have obtained a license to generate electricity [27], is shown in Figure 2. Additionally, the percentage changes of individual installations year on year, starting with the changes in 2006 in relation to 2005, are shown in Figure 2. It is clear that wind energy in particular has had the greatest power increase. For several years, energy based on photovoltaic installations has also started to play a leading role.
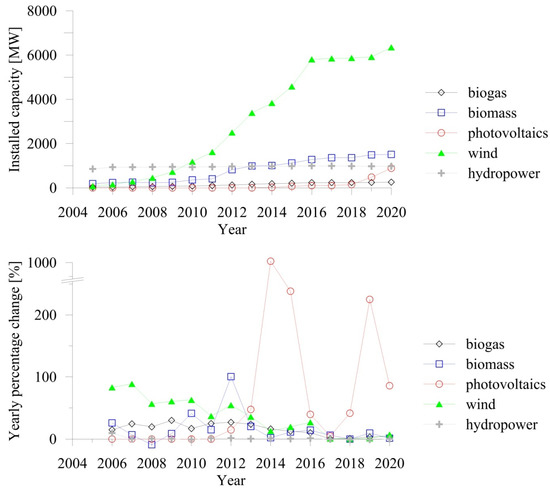
Figure 2.
Dynamics of RES installations in Poland: installed capacity in MW from 2005 (top), yearly percentage change from 2006/2005 (bottom).
Wind installations were growing fast until 2016 when the new regulations came into force. According to the new law, a minimum distance of 10 heights of the wind turbine with blades between the turbine and the buildings had to be maintained. The requirements practically stopped the development of onshore wind installations [30,31]. In 2021, this situation slightly changed. Taking into account EU politics, and perhaps the relaxation of regulations in Poland, there is possible faster development of onshore wind farms. In Poland, good conditions for the development of wind installations are provided in coastal areas [29] but also in the central and southern parts of the country [29,32]. In addition to large wind farms, small installations in cities or along the roads [33] will provide opportunities for further development of this sector. In the near future, the most rapid growth will be seen in offshore wind installations when many large projects will be finished [34].
Photovoltaics is the second RES that probably will develop quite fast in the near future. Such installation is cheaper compared to other RES, and there are some central projects that aim to help its growth. The higher potential of solar energy is in the southern territory of Poland [32].
The potential of renewable energy systems for the combined production of electricity and heat in Poland in RES installations is very high. It depends primarily on the geographical location of the installation. For solar and photovoltaic installations, latitude related to the location of the sun will play the biggest role in energy production. Wind energy potential depends on the geographical location of the installation and the prevailing wind conditions. In the case of hydropower systems that exploit the potential of inland waters, the terrain and the multitude of rivers in the area under consideration will be extremely important. Renewable energy systems also include installations producing energy from biomass, which mainly depend on economic conditions related to the proximity of the raw material. As can be seen, renewable energy sources cannot be defined unambiguously because each of these sources is different from the others [35].
In Poland, the current state of RES and various aspects of their development was investigated by many researchers. An example is the study described in [26], in which a survey was conducted between decision makers. According to sociometric surveys conducted among experts, solar, wind, and biomass energy have the greatest potential for growth [36]. The development of wind energy has been the most widely discussed in the literature, e.g., [37,38]. Recently, Reference [39] presented a broad overview of the possibilities of RES development in the Mazowieckie voivodship in Poland, based on a survey conducted among the inhabitants of this voivodeship.
This article deals with the issue of the impact of social determinants on the perception of energy transformation and the development of RES. It is based on a survey conducted on a representative group of Polish respondents. The article is structured as follows: Section 1 provides an introduction to the European Union’s energy policy, Section 2 deals with the materials and methods used, and in Section 3, the results of the studies conducted are presented and discussed.
The research described in the article concentrated on the subject of energy consumption in Polish households. The main goal is to investigate the attitude of Polish consumers towards renewable energy sources and to discover the relationship between the level of awareness and other factors such as age and education. Within the structure of the conducted research authors decided to assess the following objectives:
- O 1—Assessment of the perceptions of the importance of global threats;
- O 2—Assessment of energy consumers’ awareness of pro-environmental activities;
- O 3—Assessment of the tendency to track energy consumption by households;
- O 4—Assessment of the influence of education on the use of RES.
2. Materials and Methods
In the conducted study, the case study method was used from the data collection methods. This means that all written and electronic resources were collected, analyzed, and interpreted in accordance with the stated objectives O1–O4 of the conducted study [40]. The researcher model used is shown in Figure 3
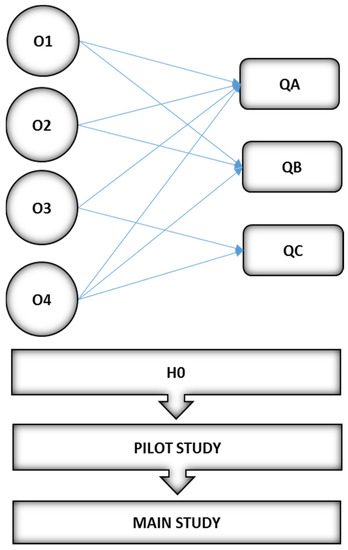
Figure 3.
Research model.
Theoretical and empirical deliberations will verify Hypothesis H0 formulated as follows: The level of awareness of the importance of issues related to energy sources is high among consumers.
The research was conducted according to the classical scheme: theoretical research, empirical research, and conclusion.
The study was conducted using a standardized online questionnaire that included the following sections:
- (a)
- A block of questions QA concerning sociodemographic variables, including age, gender, place of residence, and education level;
- (b)
- A block of questions QB on awareness of global risk issues;
- (c)
- A block of questions QC on awareness of RES.
The questions regarding the perception and evaluation of the studied phenomena could be answered on a scale from 1 to 5, where 1 meant the lowest level of evaluation by the respondents, and 5 meant the highest.
Designing a pilot study is a very important stage. A pilot study is a type of preliminary study and is designed to test and evaluate the tool to be used in the main study, which is implemented using the chosen questionnaire technique [41]. In the pilot study, it is most often checked whether the proposed way of measuring the phenomenon; that is, the formulated questionnaire question, arranged in such a way and not differently, having a specific wording and structure, brings information that can become the basis for legitimate conclusions [42].
A pilot study was conducted on a sample of 45 respondents, which made it possible to eliminate formal and merit-related errors and to create the final version of the research tool. Such a procedure led to obtaining a high level of reliability of the used tool.
In order to examine the level of Polish consumers’ knowledge of global risk factors and awareness of RES, the BioStat research agency was used. BioStat is a highly specialized agency that carries out research on representative samples of the Polish population using the Opinion Research Panel. The project surveyed 1000 respondents, whose participation structure by gender, age, and education reflects the image of Polish citizens. In order to determine the weights allowing the authors to obtain parameters representative of the population of users of the Internet opinion poll panel, the percentage of people using the Internet was determined on the basis of the CBOS survey using the Internet [43], according to assumed differentiation criteria (age, gender, and education). According to this research, 68% of adult Polish citizens were Internet users, and below the age of 44, more than 88%. The number of Internet users increases with the education level from 19% for primary education to 94% for higher education, with the financial situation up to 75% for well-off citizens and with the size of the city they live in, and up to 82% among citizens of large cities. The resulting conversion factors were applied to correct the population for the purpose of providing a complete picture of a representative sample of Polish citizens.
The survey was conducted between 18 February and 3 March 2021 on a sample of 1000 respondents. Table 1 shows the sociodemographic variables of the research sample. Thanks to the panel research method, it is possible to assume that the results obtained are representative in relation to the population of Polish Internet users. The results obtained can therefore be regarded as reflecting the assumed sample structure in terms of age, gender, education level, and income of the respondents.

Table 1.
Sociodemographic variables of the research sample.
To illustrate the distribution of values, histograms will be used when dealing with one or two distributions, and for more distributions, box plots will be used. To illustrate the percentage of yes–no responses across multiple groups, mosaic plots will be used.
In this paper, a few selected statistical tests will be referred to. The Spearman correlation is a non-parametric test that is used to measure the degree of association between two variables that do not necessarily have a normal distribution. It is a rank-based method and therefore also gives good results when outliers are present. It is very insensitive to outliers because each observation is first ranked, and it is the ranks that are correlated with each other, not the raw scores, so outliers are then no longer as significant. The Spearman rank correlation test is a suitable correlation analysis when the variables are measured on a scale of at least an ordinal scale and the results of one variable are monotonically related to the other variable. The closer the value of the Spearman coefficient is to 0, the weaker the monotonic relationship is between the characteristics under study.
The Kendall correlation test is also a non-parametric test for measuring the degree of relationship between two variables [44]. The Spearman rank correlation is satisfactory for testing the null hypothesis of no monotonic relationship between variables, but is more difficult to interpret if the null hypothesis is rejected. Kendall’s rank correlation improves this by reflecting the strength of the relationship between the variables being compared. In this method, the data must also be expressed on at least an ordinal scale. Kendall’s rank correlation is used when variables have the same values repeatedly [45,46].
In both cases, a correlation coefficient value significantly greater than zero indicates a strong positive monotonic (increasing) relationship, i.e., an increase in the independent variable is matched by an increase in the dependent variable. A significantly negative value of the correlation coefficient indicates a strong negative monotonic (decreasing) relationship, i.e., an increase in the independent variable corresponds to a decrease in the dependent variable. If the rank correlation coefficient takes a value equal to or very close to zero, there is no monotonic relationship between the parameters under study (but a non-monotonic relationship may exist).
The χ2 independence test (Pearson’s χ2 test) is used to test the relationship between two nominal (categorical) variables. It is based on comparing observed frequencies with expected frequencies, which is what the test would assume if there were no relationship between the variables. If the difference between the observed and expected frequencies is large (statistically significant), it can be said that there is a relationship between one variable and another. When applying the χ2 test of independence, it is important that the size of each subgroup tested is not less than 5. Otherwise, smaller subgroups are combined, which may distort the observed relationships [47].
The Mann–Whitney U test is used to compare differences between two independent groups. The dependent variable must be measured on at least an ordinal scale. The Mann–Whitney U test does not require equality of groups, a normal distribution, or homogeneous variances. This makes it widely applicable. The Mann–Whitney U test involves ranking the scores of the dependent variable (from the smallest to the largest) in the study groups. The groups are then compared with each other [48].
In the process of statistical inference, we use the concept of p-value. Every statistical test consists of verifying the so-called null hypothesis H0 against the alternative hypothesis H1. The p-value calculated on a given test, which always belongs to the interval [0, 1], is used to quantify the statistical significance of the test result. The closer the p-value is to zero, the more confidently the null hypothesis H0 is rejected.
3. Results and Discussion
In this section, in order to achieve the objectives, analyses were made of the collected research material. First, the level of respondents’ awareness of overall global risks was analyzed, and the perceived greatest risks were identified. This was followed by an assessment of respondents’ propensity to track household energy consumption. In the next step, the declarative willingness to use renewable energy sources is presented, and the most important factors determining this willingness are outlined.
3.1. Awareness of the Importance of RES Issues
The first research objective was to analyze the respondents’ level of awareness of global threats. This was the basis for determining whether environmental threats are perceived as important by the respondents. All threats could be rated on a scale of 1–5, where 1 represented the lowest level of the subjectively perceived threat index, while 5 represented the highest level. Threats listed included both economic and environmental factors as well as other threats. Figure 4 presents the importance of global threats as perceived by respondents. There is a mean value of the threat index based on answers to particular questions and its standard deviation.
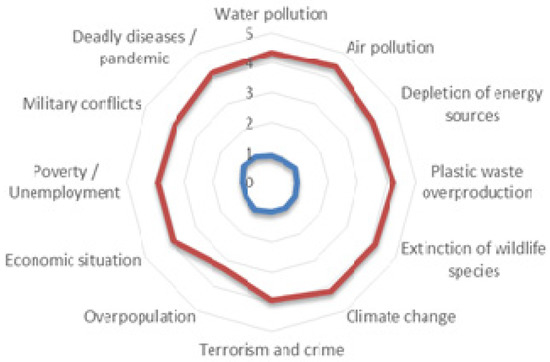
Figure 4.
The importance of global threats.
All the risks mentioned were rated very highly, but it can be noted that all risks that can be associated with environmental and climate risks are rated slightly higher than the others, as seen in Table 2.
Table 2.
The importance of global threats—mean and standard deviation.
It is noticeable that the awareness of respondents is quite high when it comes to the risks of pollution and climate change. Despite conducting the survey during the time of the global COVID-19 pandemic, this response did not score the highest, but it should still be noted that respondents definitely perceive the threat from diseases. It should also be added that the survey was at a time before the war and the rise of inflation. It can therefore be presumed that it is likely that, now, those taking part in the survey would rate the military conflict and economic situation as factors with a higher degree of threat.
The questions in parts (a), (b), and (c) ask about the importance of problems related to RES. The answers in relation to the problems mentioned in the questionnaire (water pollution, air pollution, depletion of energy sources) are expressed on the same 5-point Likert scale, so it is assumed that the sum of points from these answers is a measure of awareness of the importance of RES. In the following figures, this sum is denoted by sum1.
Figure 5 shows a large percentage of people for whom the sum of the scores from these three responses is close to the maximum value of 15. This sum was 12 or more for 76% of the respondents. Only 3% of survey participants had a total of 7 or less.
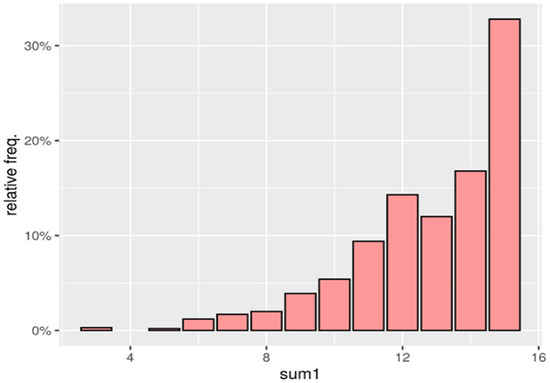
Figure 5.
Frequency of repetitions to answers contained in sum1.
It would be interesting to see if this awareness is at a similar level across age-differentiated groups. Figure 6 shows the boxplots for the magnitude of sum1 across age groups. One can see a slight increase in value as age increases. Both the sum1 value and the age group numbers are expressed on an ordinal scale, the relationship between the data appears to be monotonic, so it makes sense to calculate the rank correlation coefficient, which measures the strength and direction of the relationship that exists. Due to the repeated values of the ranks, it is not possible to apply the Spearman correlation test, so the Kendall correlation coefficient was chosen [49], whose value is 0.0955154. This value is not large, but it confirms the observed direction of influence of these variables. Moreover, the p-value of the significance test (a test confirming that the coefficient is significantly different from zero) is 0.0001227, so we accept with high confidence the hypothesis of an existing relationship consisting in the fact that, on average, an increase in age means a (slight) increase in awareness of the importance of RES.
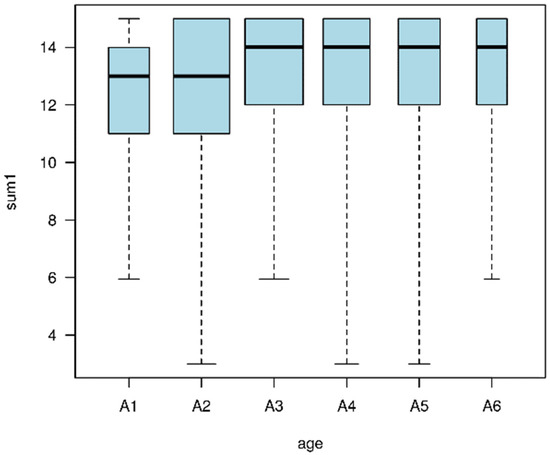
Figure 6.
Distribution of sum1 among age groups.
Figure 7 illustrates the distribution of the sum1 trait by gender. Again, gender dependence is evident. To confirm this, we will use the Mann–Whitney U test [50], due to the fact that gender is a binary type trait, so a rank correlation coefficient is not advisable; on the other hand, there are too many values of the sum1 trait for the χ2 independence test [51]. The assumptions of the test are fulfilled because, in our case, the dependent variable, including Likert-scale items, is ordinal, and the independent variable consists of two independent categorical groups (women, men). In addition, the observation independence condition is met because there are different participants in each group, with no participant belonging to more than one group.
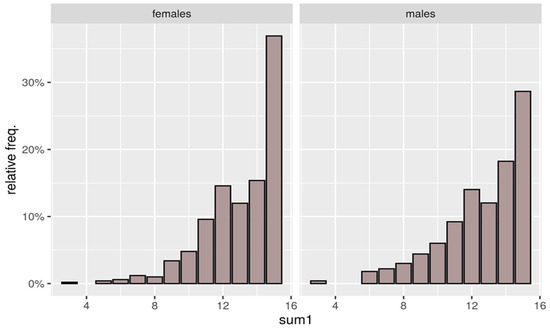
Figure 7.
Frequency of repetitions to answers contained in sum1 by gender. Source: own research.
For the Mann–Whitney U test, the p-value is 0.0042765, so the difference between the distributions of the trait under study for women and men is statistically significant. We can also see a slightly higher average awareness in the women group: the median of the trait sum1 is 14 for women and 13 for men.
3.2. Tracking Household Energy Consumption
The answer to the question of tracking household energy use can be determined by many factors. It can range from a far-sighted concern for the environment and energy sources to simply having trouble paying your bills.
Figure 8, however, shows quite the opposite—those with higher material status are more likely to admit to closely tracking their energy consumption. Perhaps this is simply due to the fact that greater environmental awareness depends largely on education, which in turn has an undoubtedly positive effect on income. Note also the very small size of the extremely low- or high-income groups highlighted in the figure. In the remaining groups, the fraction of positive answers is at a fairly similar level. To test the statistical significance of the relationship between income and the propensity to track energy consumption, we use the χ2 test of independence. It turns out that the p-value of the test is 0.8757332, so on the basis of these data, no significant relationship between the answer to the question considered here, and the income can be shown.
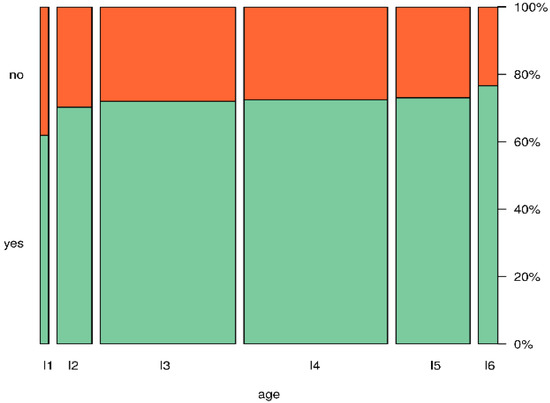
Figure 8.
Propensity to track energy use by income.
Figure 9 is an illustration of a possible relationship between the answer to the question about tracking energy and the level of education. As can be seen, such a relationship is certainly not monotonic with respect to education ranks. There is a significant decrease of “yes” answers when moving from the level of “vocational education” (E2) to the level of “secondary education” (E3) and a minimal decrease when moving from the level of “higher education 1st degree” [E4] to the level of “higher education 2nd degree” [E5]. In addition, the 100% “yes” response rate among those with a doctorate [E7] may be somewhat random due to the small size of this group.
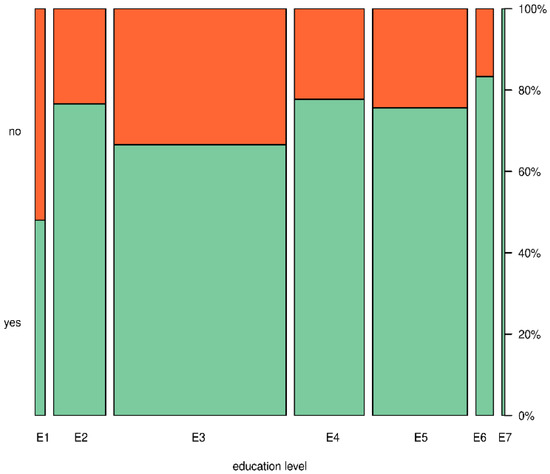
Figure 9.
Propensity to track energy consumption by education level.
The χ2 independence test [52], which is used when testing the independence of non-measurable (qualitative) characteristics or when testing the independence of a qualitative characteristic with a quantitative one was used. When checking with the χ2 independence test, due to the insufficient number of responses in the group with the highest level of education, we combined the last two groups so that the assumptions of the test were met. Despite this combination (combining groups usually blurs the observed relationships), the p-value of the test is 0.0003, so the data clearly indicate a significant relationship between the answer to the question considered here and the level of education.
3.3. Declaration on the Use of RES
Figure 10 illustrates the relationship between the answer to the question about the use of RES (“Do you use RES?”) and the income level of the respondents. The p-value of the χ2 independence test is 0.1396865. For the assumptions of the test to be met, it was necessary to combine the first two groups representing different income levels. The obtained value of the test statistic does not give grounds to state a statistically significant relationship between declaration of RES usage and income level; however, Figure 10 presents evident monotonicity of RES usage fraction with the increase in average income.
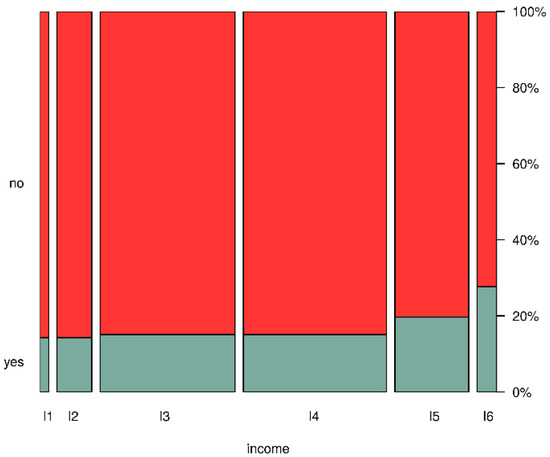
Figure 10.
Declaration on the use of RES by income.
Figure 11 illustrates the relationship between the answer to the question about the use of RES and the educational level of the respondents. In order to correctly perform the χ2 independence test, due to too small numbers in the cells of the contingency tables, it was necessary to combine the first two and the last two groups representing different levels of education. The p-value of the χ2 independence test is 0.00013, which clearly indicates a significant relationship between the answer to the question under consideration and the level of education of the respondents.
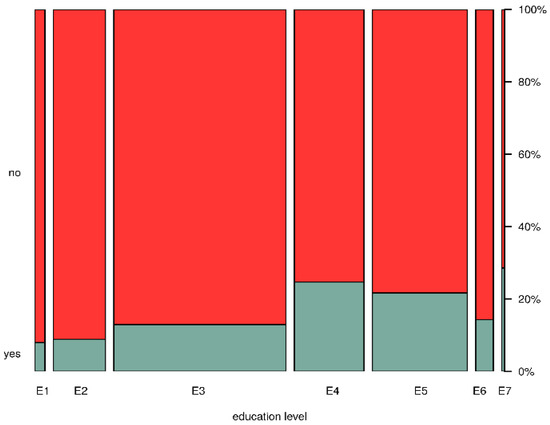
Figure 11.
Declaration on the use of RES by education level.
4. Conclusions
This paper presents the perception of RES by consumers. Statistical analysis led to determining the awareness of consumers about RES depending on their age, gender, education level, or income.
Based on the survey responses, it can be seen that the vast majority of respondents show high awareness of the importance of RES. Awareness increases slightly with the age of respondents. It was also found that women show a slightly higher awareness than men.
The interest in tracking household energy consumption appears to be increasing within a group of respondents with a higher income. However, statistical significance tests indicate no significant relationship between these variables. On the other hand, statistical methods show a significant relationship between interest in tracking energy consumption and education level. In that case, no visible monotonic dependence between the two variables was observed.
Declaration of using RES increases with the increase in the income of respondents; however, statistical analysis did not indicate a significant relationship between these variables. No monotonic relationship was observed between the use of RES and education level, but on the basis of statistical tests, answers about the use of RES were clearly dependent on the education level.
Taking into account the shortcomings of the described research, it seems reasonable to conduct further research in the discussed field. Raising public awareness in all consumer groups is the basis for implementing a policy of caring for and using renewable energy sources. This is important especially today, when, due to the military conflict in Ukraine, the energy crisis is growing. This is a real threat to the energy stability of Europe and the whole world. Additionally, given the political situation, it would be worthwhile to conduct the study again, as it seems that the perception of risks and the correlations studied could turn out to be quite different from those discovered in this study.
Author Contributions
Conceptualization, M.M., A.C.-K. and T.L.; methodology, M.M.; software, E.Ł. and P.W.; validation, M.M., A.C.-K., T.L. and A.R.; formal analysis, M.M., E.Ł. and P.W.; investigation, M.M., E.Ł. and P.W.; resources, M.M. and A.R.; data curation, M.M., E.Ł. and P.W.; writing—original draft preparation, M.M., A.C.-K. and T.L.; writing—review and editing, M.M.; visualization, M.M., E.Ł. and P.W.; supervision, M.M. and A.R.; project administration, M.M., A.C.-K., A.R. and E.Ł.; funding acquisition, A.C.-K. All authors have read and agreed to the published version of the manuscript.
Funding
This research received no external funding.
Data Availability Statement
Not applicable.
Conflicts of Interest
The authors declare no conflict of interest.
References
- Szulecki, K.; Fischer, S.; Gullberg, A.T.; Sartor, O. Shaping the ‘Energy Union’: Between National Positions and Governance Innovation in EU Energy and Climate Policy. Clim. Policy 2016, 16, 548–567. [Google Scholar] [CrossRef]
- Langsdorf, S. EU Energy Policy: From the ECSC to the Energy Roadmap 2050; Green European Foundation: Brussels, Belgium, 2011. [Google Scholar]
- Kónya, I.; Ohashi, H. International Consumption Patterns among High-Income Countries: Evidence from the OECD Data*. Rev. Int. Econ. 2007, 15, 744–757. [Google Scholar] [CrossRef]
- Tomas Bata University in Zlin; Horakova, M. Consumer Behavior of College Students in the Czech Republic. JOC 2015, 7, 68–85. [Google Scholar] [CrossRef]
- Razminiene, K. Circular Economy in Clusters’ Performance Evaluation. Equilibrium. Q. J. Econ. Econ. Policy 2019, 14, 537–559. [Google Scholar] [CrossRef]
- Jankiewicz, M.; Pietrzak, M.B. Assesment of Trends in the Share of Expenditure on Services and Food in the Visegrad Group Member States. Int. J. Bus. Soc. 2020, 21, 977–996. [Google Scholar] [CrossRef]
- Blok, K. Enhanced Policies for the Improvement of Electricity Efficiencies. Energy Policy 2005, 33, 1635–1641. [Google Scholar] [CrossRef]
- Lior, N. Thoughts about Future Power Generation Systems and the Role of Exergy Analysis in Their Development. Energy Convers. Manag. 2002, 43, 1187–1198. [Google Scholar] [CrossRef]
- Afgan, N. Sustainability Assessment of Hydrogen Energy Systems. Int. J. Hydrogen Energy 2004, 29, 1327–1342. [Google Scholar] [CrossRef]
- Kaldellis, J.K.; Vlachou, D.S.; Korbakis, G. Techno-Economic Evaluation of Small Hydro Power Plants in Greece: A Complete Sensitivity Analysis. Energy Policy 2005, 33, 1969–1985. [Google Scholar] [CrossRef]
- El-Sayed, M.A.H. Solar Supported Steam Production for Power Generation in Egypt. Energy Policy 2005, 33, 1251–1259. [Google Scholar] [CrossRef]
- Huacuz, J.M. The Road to Green Power in Mexico—Reflections on the Prospects for the Large-Scale and Sustainable Implementation of Renewable Energy. Energy Policy 2005, 33, 2087–2099. [Google Scholar] [CrossRef]
- Official Journal of the European Union. Directive 2009/28/EC of the European Parliament and of the Council of 23 April 2009 on the Promotion of the Use of Energy from Renewable Sources and Amending and Subsequently Repealing Directives 2001/77/EC and 2003/30/EC; L140; Official Journal of the European Union: London, UK, 2009; Volume 52, pp. 16–62. ISBN 978-1-137-54506-0. [Google Scholar]
- A European Green Deal. Available online: https://ec.europa.eu/info/strategy/priorities-2019-2024/european-green-deal_en (accessed on 19 June 2022).
- The Paris Agreement. UNFCCC. Available online: https://unfccc.int/process-and-meetings/the-paris-agreement/the-paris-agreement (accessed on 19 June 2022).
- European Commission. Report from the Commission to the European Parliament, the Council, the European Economic and Social Committee and the Committee of the Regions. State of the Energy Union 2021—Contributing to the European Green Deal and the Union’s Recovery (Pursuant to Regulation (EU) 2018/1999 on the Governance of the Energy Union and Climate Action); European Commission: Brussels, Belgium, 2021; Available online: https://eur-lex.europa.eu/legal-content/EN/TXT/?uri=COM:2021:950:FIN (accessed on 8 June 2022).
- Szumilas-Kowalczyk, H.; Giedych, R. Analysis of Regulatory Possibilities and Obstacles to Expand Renewable Energy and Preserve Landscape Quality in the Silesian Voivodship. Resources 2022, 11, 23. [Google Scholar] [CrossRef]
- Fuksa, D. Opportunities and Threats for Polish Power Industry and for Polish Coal: A Case Study in Poland. Energies 2021, 14, 6638. [Google Scholar] [CrossRef]
- Hafeznia, H.; Aslani, A.; Anwar, S.; Yousefjamali, M. Analysis of the Effectiveness of National Renewable Energy Policies: A Case of Photovoltaic Policies. Renew. Sustain. Energy Rev. 2017, 79, 669–680. [Google Scholar] [CrossRef]
- Wang, Z.; Song, H.; Liu, H.; Ye, J. Coupling of Solar Energy and Thermal Energy for Carbon Dioxide Reduction: Status and Prospects. Angew. Chem. Int. Ed. 2020, 59, 8016–8035. [Google Scholar] [CrossRef]
- GUS Environment 2021. Available online: https://stat.gov.pl/en/topics/environment-energy/environment/environment-2021,1,13.html (accessed on 6 April 2022).
- W Polsce w 2021 Roku o 26-Proc. rdr Wzrosło Zużycie Węgla do Produkcji Energii Elektrycznej. Available online: https://forsal.pl/biznes/energetyka/artykuly/8345070,polska-2021-o-26-proc-rdr-wzrost-zuzycia-wegla-energia-elektryczna.html (accessed on 6 April 2022).
- Gupta, R.; Mishra, A.; Thirupathaiah, Y.; Chandel, A. Biochemical Conversion of CO2 in Fuels and Chemicals: Status, Innovation, and Industrial Aspects. Biomass Convers. Biorefinery 2022. [Google Scholar] [CrossRef]
- Ng, C.F.; Choong, C.K.; Ching, S.L.; Lau, L.S. The Impact of Electricity Production from Renewable and Non-Renewable Sources on CO2 Emissions: Evidence from Oecd Countries. Int. J. Bus. Soc. 2019, 20, 365–382. [Google Scholar]
- Furlan, C.; Mortarino, C. Forecasting the Impact of Renewable Energies in Competition with Non-Renewable Sources. Renew. Sustain. Energy Rev. 2018, 81, 1879–1886. [Google Scholar] [CrossRef]
- Horzela, I.; Gromadzki, S.; Gryz, J.; Kownacki, T.; Nowakowska-Krystman, A.; Piotrowska-Trybull, M.; Wiśniewski, R. Energy Portfolio of the Eastern Poland Macroregion in the European Union. Energies 2021, 14, 8426. [Google Scholar] [CrossRef]
- Potencjał Krajowy OZE w Liczbach. Available online: www.ure.gov.pl/pl/oze/potencjal-krajowy-oze/5753,Moc-zainstalowana-MW.html (accessed on 10 June 2022).
- Aydin, O.; Igliński, B.; Krukowski, K.; Siemiński, M. Analyzing Wind Energy Potential Using Efficient Global Optimization: A Case Study for the City Gdańsk in Poland. Energies 2022, 15, 3159. [Google Scholar] [CrossRef]
- Zalewska, J.; Damaziak, K.; Malachowski, J. An Energy Efficiency Estimation Procedure for Small Wind Turbines at Chosen Locations in Poland. Energies 2021, 14, 3706. [Google Scholar] [CrossRef]
- Ustawa z Dnia 20 Maja 2016 r. o Inwestycjach w Zakresie Elektrowni Wiatrowych, Dz.U. Poz. 961. 2016. Available online: https://isap.sejm.gov.pl/isap.nsf/DocDetails.xsp?id=WDU20160000961 (accessed on 10 June 2022).
- Wyrobek, J.; Popławski, Ł.; Dzikuć, M. Analysis of Financial Problems of Wind Farms in Poland. Energies 2021, 14, 1239. [Google Scholar] [CrossRef]
- Jurasz, J.; Mikulik, J.; Dąbek, P.B.; Guezgouz, M.; Kaźmierczak, B. Complementarity and ‘Resource Droughts’ of Solar and Wind Energy in Poland: An ERA5-Based Analysis. Energies 2021, 14, 1118. [Google Scholar] [CrossRef]
- Bohatkiewicz, J.; Dębiński, M.; Marciniuk, M.; Cybulska, A. The Use of Renewable Energy Sources in a Road Lane on the Example of the Network of National Roads and Highways in Poland. Energies 2021, 14, 4660. [Google Scholar] [CrossRef]
- Ziemba, P. Uncertain Multi-Criteria Analysis of Offshore Wind Farms Projects Investments—Case Study of the Polish Economic Zone of the Baltic Sea. Appl. Energy 2022, 309, 118232. [Google Scholar] [CrossRef]
- Alrikabi, N.K.M.A. Renewable Energy Types. J. Clean Energy Technol. 2014, 61–64. [Google Scholar] [CrossRef]
- Pietrzak, M.B.; Igliński, B.; Kujawski, W.; Iwański, P. Energy Transition in Poland—Assessment of the Renewable Energy Sector. Energies 2021, 14, 2046. [Google Scholar] [CrossRef]
- Igliński, B.; Iglińska, A.; Koziński, G.; Skrzatek, M.; Buczkowski, R. Wind Energy in Poland—History, Current State, Surveys, Renewable Energy Sources Act, SWOT Analysis. Renew. Sustain. Energy Rev. 2016, 64, 19–33. [Google Scholar] [CrossRef]
- Gnatowska, R.; Moryń-Kucharczyk, E. Current Status of Wind Energy Policy in Poland. Renew. Energy 2019, 135, 232–237. [Google Scholar] [CrossRef]
- Igliński, B.; Skrzatek, M.; Kujawski, W.; Cichosz, M.; Buczkowski, R. SWOT Analysis of Renewable Energy Sector in Mazowieckie Voivodeship (Poland): Current Progress, Prospects and Policy Implications. Environ. Dev. Sustain. 2022, 24, 77–111. [Google Scholar] [CrossRef]
- Yin, R.K. Case Study Research and Applications; Sage: Thousand Oaks, CA, USA, 2018. [Google Scholar]
- Yin, R.K. Designing Case Studies. Qual. Res. Methods 2003, 5, 359–386. [Google Scholar]
- Aberdeen, T.; Yin, R.K. Case Study Research: Design and Methods; Sage: Thousand Oaks, CA, USA, 2009. [Google Scholar]
- Korzystanie z Internetu. Komunikat z Badań. CBOS—Cent. Bad. Opinii Społecznej 2020, 85. Available online: https://www.cbos.pl/SPISKOM.POL/2020/K_085_20.PDF (accessed on 9 November 2022).
- Yücel, A.; Markovic, M.; Atilgan, A.; Rolbiecki, R.; Ertop, H.; Jagosz, B.; Jakubowski, T. Investigation of Annual Lake Water Levels and Water Volumes with Şen Innovation and Mann-Kendall Rank Correlation Trend Tests: Example of Lake Eğirdir, Turkey. Water 2022, 14, 2374. [Google Scholar] [CrossRef]
- Acion, L.; Peterson, J.J.; Temple, S.; Arndt, S. Probabilistic Index: An Intuitive Non-Parametric Approach to Measuring the Size of Treatment Effects. Stat. Med. 2006, 25, 591–602. [Google Scholar] [CrossRef] [PubMed]
- Puth, M.-T.; Neuhäuser, M.; Ruxton, G.D. Effective Use of Spearman’s and Kendall’s Correlation Coefficients for Association between Two Measured Traits. Anim. Behav. 2015, 102, 77–84. [Google Scholar] [CrossRef]
- Franke, T.; Ho, T.; Christie, C. The Chi-Square Test Often Used and More Often Misinterpreted. Am. J. Eval. 2012, 33, 448–458. [Google Scholar] [CrossRef]
- MacFarland, T.W.; Yates, J.M. Mann–Whitney U Test. In Introduction to Nonparametric Statistics for the Biological Sciences Using R; MacFarland, T.W., Yates, J.M., Eds.; Springer International Publishing: Cham, The Switzerland, 2016; pp. 103–132. ISBN 978-3-319-30634-6. [Google Scholar]
- Kendall, M.; Gibbons, J.D. Rank Correlation Methods Edward Arnold. Div. Hodder Stoughton Charles Griffin Title Lond. 1990, 29–50. [Google Scholar]
- Sheskin, D.J. Handbook of Parametric and Nonparametric Statistical Procedures, 5th ed.; Chapman and Hall/CRC: Boca Raton, FL, USA, 2020; ISBN 978-0-429-18619-6. [Google Scholar]
- Moayedikia, A.; Ong, K.-L.; Boo, Y.L.; Yeoh, W.G.; Jensen, R. Feature Selection for High Dimensional Imbalanced Class Data Using Harmony Search. Eng. Appl. Artif. Intell. 2017, 57, 38–49. [Google Scholar] [CrossRef]
- Weaver, K.F.; Morales, V.C.; Dunn, S.L.; Godde, K.; Weaver, P.F. An Introduction to Statistical Analysis in Research: With Applications in the Biological and Life Sciences; John Wiley & Sons: Hoboken, NJ, USA, 2017; ISBN 978-1-119-29968-4. [Google Scholar]


Publisher’s Note: MDPI stays neutral with regard to jurisdictional claims in published maps and institutional affiliations. |
© 2022 by the authors. Licensee MDPI, Basel, Switzerland. This article is an open access article distributed under the terms and conditions of the Creative Commons Attribution (CC BY) license (https://creativecommons.org/licenses/by/4.0/).