Article

Estimating the Useful Energy of a Launcher’s Pneumatic Launch System UAV

by
Grzegorz Jastrzębski
* and
Leszek Ułanowicz
Air Force Institute of Technology, Księcia Bolesława Street 6, 01-494 Warsaw, Poland
*
Author to whom correspondence should be addressed.
Energies 2022, 15(22), 8424; https://doi.org/10.3390/en15228424
Submission received: 4 October 2022 / Revised: 21 October 2022 / Accepted: 4 November 2022 / Published: 10 November 2022

Abstract

:
The motivation behind solving the issue of estimating the flow parameters of the pneumatic system of a launcher was the need to obtain the take-off energy with a value exceeding 80 kJ. The take-off energy and the initial speed of the unmanned aerial vehicle (UAV) depends on the pressure drop time in the launcher’s pneumatic system. The aim of the research was to estimate the flow parameters of the trigger system of the UAV launchers in order to achieve the shortest time of its operation. Due to the lack of a description of the selection of pneumatic elements and their flow characteristics in the available literature, the article attempts to analytically describe the air flow through pneumatic units. The trigger system is described using the sonic conductivity and the critical pressure ratio. Due to the lack of numerical data on the flow parameters of pneumatic units, a test stand was designed and constructed to determine these parameters. The values of the sound conductivity and the critical pressure ratio were determined for each of the pneumatic units and for the entire system. The proposed method makes it possible to determine the relationship between the operating time and the values of the flow parameters of the pneumatic launch tube release system. It also provides guidelines for design and technological solutions for the trigger system of any pneumatic launcher.

1. Introduction

Many unmanned aerial vehicles (UAVs), due to their weight and dimensions, as well as high wing loads, require assistance during the take-off process. Aircraft-type UAV take-off devices are called launchers. The use of catapults also increases the operational capabilities of UAVs and eliminates the need to use airport runways for their take-off. Due to their operational qualities, pneumatic launchers are the most widely used [1,2,3,4]. Kondratiuk [3] and Gan et al. [4] showed that, due to the power and take-off efficiency as well as operational values, pneumatic launchers were the most used.

1.1. Status of the Issue

In the scientific and technical literature, the issues of construction and operation of pneumatic launchers have been widely and thoroughly considered. The problem of the selection of pneumatic elements and their flow characteristics is presented only marginally. This hinders the objective and proper selection of pneumatic components, i.e., motors, actuators, valves, and conduits. One of the most important scientific and technical problems relates to the obtaining of useful analytical tools for describing the work cycle of pneumatic systems. It is particularly difficult to describe a launcher’s trigger system, to understand the nature of the physical operation of these systems, and to determine the influence of the flow parameters on the time of its operation. According to the authors, the solution to the above issues is up to date and has not been previously described in the literature. The presented results are based entirely on the authors’ own research.

1.2. Formulation of the Research Problem

The main problem in designing pneumatic launch tubes comes down to the selection of the flow parameters of the pneumatic components of the trigger system. The value of the flow parameters depends on their design features. Knowing the numerical values of the parameters makes it possible to estimate the shortest opening time of the main valve of the pneumatic drive of the launch launcher. The trigger system should therefore enable as soon as possible to obtain a full flow (maximum flow rate) of the working medium from the air tank to the starting cylinder. It should also be remembered that, with an increase in the diameter of the starting cylinder, the speed of the trigger mechanism must increase. Due to the long time required to open and close the typical large pneumatic valves available on the market, special constructions, individually designed for launchers, should be used. The research problem required the development of a useful analytical tool to describe the operation cycle of the pneumatic release system and to determine the influence of the flow parameters on its operation time. This problem was realized based on modeling the flow characteristics of pneumatic elements (resistors), linking the pressure drop on the element with the volume flow flowing through it. This made it possible to determine the relationship between the operating time and the values of the flow coefficients of the control and drive system of the pneumatic launch launcher as well as to establish guidelines for design and technological solutions for the pneumatic control system of the launcher.

1.3. Description of the Research Subject

The operation sequence of a pneumatic starter launcher (see Figure 1) consists of accelerating the starter trolley, kinematically connected via a steel cord to a piston located in the starter cylinder as a result of the expansion of compressed air accumulated in the pneumatic tank in the starter cylinder. The launcher’s starter carriage drive system is a closed loop system (starting piston, steel rope, starting trolley, steel rope). The end of the piston is connected to the starter trolley by a steel cable. The force generated on the starting piston is proportional to the pressure of the compressed air and the active surface area of the piston. Force generated on the piston is transferred directly to the starter trolley by means of a roller and cable system. The starter cart functions as the main landing gear for the UAV during acceleration along the launcher’s track. Trigger that closes or opens the air flow between the start cylinder and the pneumatic tank is a ball valve. The volume of air accumulated in the pneumatic tank and the flow rate through the pneumatic assemblies and conduits determine the speed of the launcher’s launch carriage.
The available take-off energy of the pneumatic launcher is equal to the energy of the compressed air accumulated in the main tank, minus losses resulting from the external and internal leaks of the pneumatic launcher [5,6,7]. External leaks, which cause a significant drop in air pressure in the pneumatic system of the launcher, as well as the available air capacity in the system, are related to the technological clearances in the steel cable passages in the starter trolley drive. Thus, the amount of compressed air energy loss is directly related to the operation time period of the trigger system controlling the speed of the opening of the ball valve of the drive system of the launcher’s starting car [8,9]. The trolley is released after the end of the trigger system operation cycle, i.e., complete opening of the ball valve of the trolley drive system. The longer the time required to open the ball valve, the greater the pressure losses in the pneumatic system of the launcher. Thus, the starting energy is smaller [10]. The faster the ball valve opens, the more stored air will be effectively used to propel the starter cart.
The most important module of the launch launcher, affecting the final launch energy and which is responsible for the required launch speed of the UAV, is its pneumatic trigger system, which controls the opening cycle of the ball valve of the launcher’s propulsion system. The main problem comes down to the selection of the flow parameters of the pneumatic units of the trigger system (motors, actuators, valves, conduits, etc.) that will provide the shortest opening time of the ball valve of the starter trolley drive system [11]. The problem of the speed of operation of the trigger mechanism becomes more difficult as the diameter of the launch cylinder of the launcher increases. The trigger system should enable the fastest possible full flow of the working medium through the ball valve from the compressed air tank to the starting cylinder. Due to long opening and closing times of typical large pneumatic valves, special constructions are used, individually designed for pneumatic launchers. The selection of pneumatic units should take into account design features that ensure the adequate performance of the pneumatic system. In turn, the operation time of the pneumatic release system depends on the flow parameters of its units [12].
Therefore, there is a need for an analytical description of the operation cycle of the pneumatic control and drive system of the launcher and the influence of the flow parameters on its operation time. In addition, to determine the flow properties of the pneumatic assembly, it is necessary to understand its flow characteristics.
Based on analyses of the available literature, two basic approaches can be distinguished in modeling the flow characteristics of pneumatic assemblies. The first approach utilizes models in the form of a system of differential or integral equations, built using the basic principles of compressible fluid mechanics (the most common starting point are various forms of Navier–Stokes equations), which are numerically solved for specific initial and boundary conditions [10,11,12,13,14,15]. The second approach involves models of flow characteristics linking the pressure drop on the element with the volume of flow through it [10,13,14]. Many different air models are used in pneumatics, and some models are described in rank documents of the standard. The models most often found in the literature and used in engineering practice are the mass flux models: the St. Venant–Wanzel [16,17], the model for the flow through orifices [5], the model of Miatluk and Awtuszka [8], the model of Woelke [11], the model for the flow through conduits [4,14], and the models of the volume flow [10,14,18,19,20].
The aim of the work is to present a description of the model of the pneumatic control and drive system of the launch launcher with the use of air stream models and to determine the influence of the flow parameters on the time of its operation.
In order to determine a criterion for the selection of individual pneumatic elements, and to estimate the operation time of the entire system, a mathematical model was developed based on the air model. In order to achieve the goal of the work, a model of the operation cycle of the pneumatic control and drive system was developed. Stands for determining the flow parameters of pneumatic elements were developed and constructed. A stand for determining the operating time of the control and drive system and pressure changes in the drive system in the idle section of the starting cylinder was developed and constructed. Experimental tests of pneumatic control system units were carried out and the developed model was implemented, considering the flow parameters obtained from the tests. The above works allowed for the development of guidelines for design and technological solutions for pneumatic control systems.

2. Materials and Methods

2.1. Research Object

The diagram of the proprietary pneumatic trigger system of the starter launcher is shown in Figure 2.
The ball valve of the starter trolley drive system is controlled by the trigger system. The compressed air discharge system consists of a VL 140F ball valve, AT 551 UT shuttle actuator, which controls the opening of the ball valve, and a 5/2 spool valve. The trigger system is controlled by a pneumatic system. The 5/2-way valve opens the pressure flow path to the working chamber of the shuttle actuator, and this opens the ball valve. A stream of compressed air flows through the ball valve into the dead part of the starting cylinder. After the ball valve is fully opened, the lock of the trolley is released by a pneumatic actuator controlled by the 3/2 valve. The take-off energy from the launch tube largely depends on the pressure losses in the propulsion system during the filling of the launch cylinder. For the presented trigger system, a method of selecting the flow parameters of pneumatic components has been developed, which enables the achievement of the shortest operating time.
The principle of operation of the pneumatic release system shown in Figure 3 is as follows. After the control signal is applied to the 5/2 manifold, the air (red color) from the bus through the control channel in the manifold is directed to the control spool. Under the action of compressed air pressure, the manifold slider moves left/right and takes the position shown in Figure 3. Appropriate manifold channels connect the compressed air main with the external chambers of the shuttle actuator and the internal chamber of the shuttle actuator with the atmosphere. At the initial moment, the pressure in the outer chambers of the shuttle actuator is equal to the atmospheric pressure, and the pressure in the inner chamber is equal to the pressure in the compressed air main. The compressed air flows to the outer chambers of the swing cylinder through the appropriate manifold channel (red color). In the outer chambers of the shuttle actuator, the pressure begins to increase. The air flows into the atmosphere through a suitable distributor channel from the inner chamber of the shuttle actuator. The pressure in it begins to decrease. Under the action of the force caused by the pressure difference in the chambers of the shuttle actuator, the pistons move inwards, overcoming the resistance forces (the drag forces consist of the force against the pressure in the emptied chamber and the mass moment of inertia of the moving parts, i.e., the ball valve ball, ball drive pin, and shaft with a spline of the actuator shuttle). The ball of the VL 140 F ball valve, mechanically connected to the shaft of the shuttle actuator, is turned in the direction of the opening. The movement of the swing actuator is technologically limited by the thrust screws in the range of 0–90°.
In order to calculate the working cycle time of the entire control and drive system, it is necessary to determine the operation time of each element separately and the time of the signal course between elements. The signal in this case is the pressure of the compressed air flowing through the connecting lines. Calculation of the cycle time of the pneumatic drive system comes down to the calculation of the operating time of the elements it consists of, i.e., to the dynamic analysis of these elements [3,9,10,11,12].
The following assumptions were adopted for the description of the operation cycle of the pneumatic release system: the swinging cylinder is treated as a double-acting cylinder in which the chambers are filled and emptied at the same time; the 5/2 distributor and inlet channels in the body of the shuttle actuator were treated as pneumatic resistors for which substitute flow coefficients were determined, treating them as a set; the heat exchange between the contents of the chamber and the environment was omitted (short cycle time of less than 0.5 s), with no air leakage between the chambers (the tightness tests of the AT 451 UT swing actuator chambers proved its tightness).
The operating cycle of the control and drive system is described by equations: change of pressure in the working chamber (1) [10], change of pressure in the evacuated chamber (2) [3,6,10,14], equation of motion (3) [3,7,10,14].
d p r d t = κ x q M R T M F p r d x d t
d p o d t = κ l x q W R T W F + p o d x d t
d 2 x d t 2 = 1 m F p r p o P
To solve Equations (1) and (2), it is necessary to determine the mass intensity of the air stream flowing into the working chamber and the air stream flowing from the emptied chamber. Based on the analysis of the literature [3,7,10,14], the general form of the mass flow rate equation was adopted:
q m = p 1 T 1 ρ N T N Y
In order to determine the flow function Y, the flow model described in the ISO 6358 standard was adopted. The flow function Y can be defined by the flow coefficients: sound conductivity C and the critical pressure ratio b.
For the condition: 0 ≤ p2/p1 ≤ b-critical flow, the flow function Y takes the form:
Y = C
For the condition: b < p2/p1 ≤ 1-subcritical flow, the flow function Y takes the form:
Y = C 1 p 2 p 1 b 1 b 2
where
  • C-sonic conductivity is the ratio of the mass flow rate of the gas through the element to the product of the inlet pressure and the density of this gas under conditions of a standardized reference atmosphere ANR at critical flow, described by Formula (9).
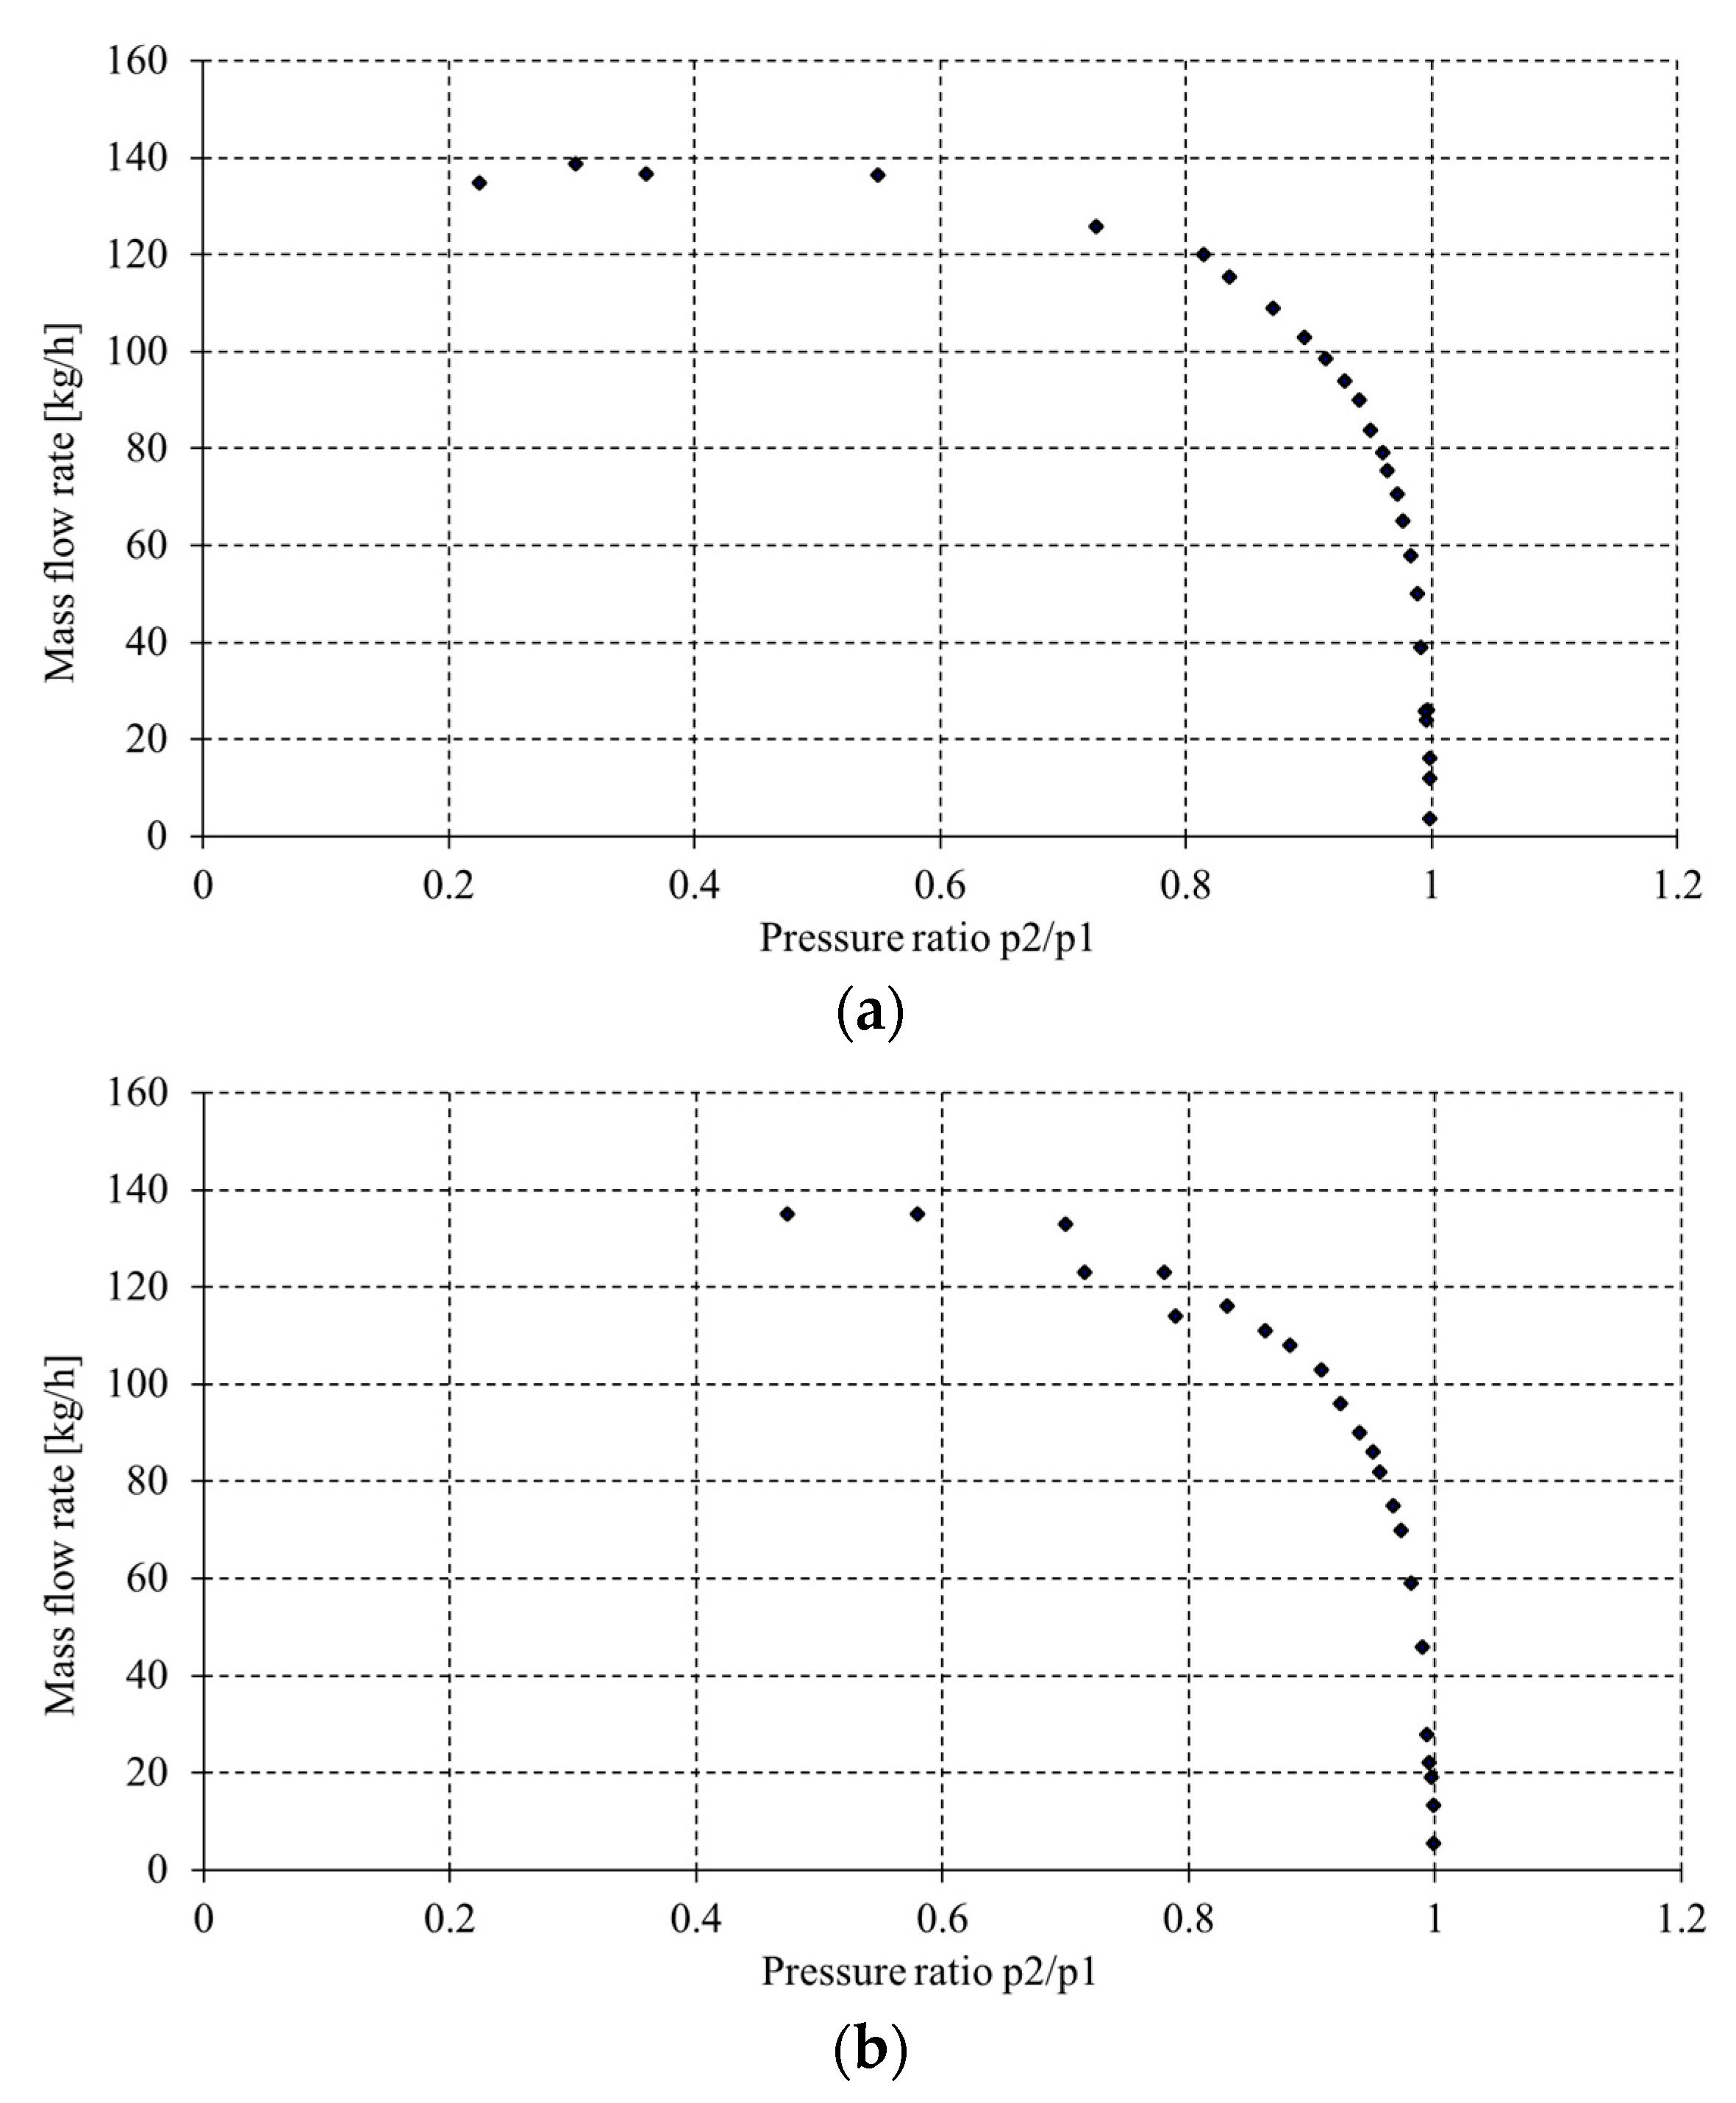
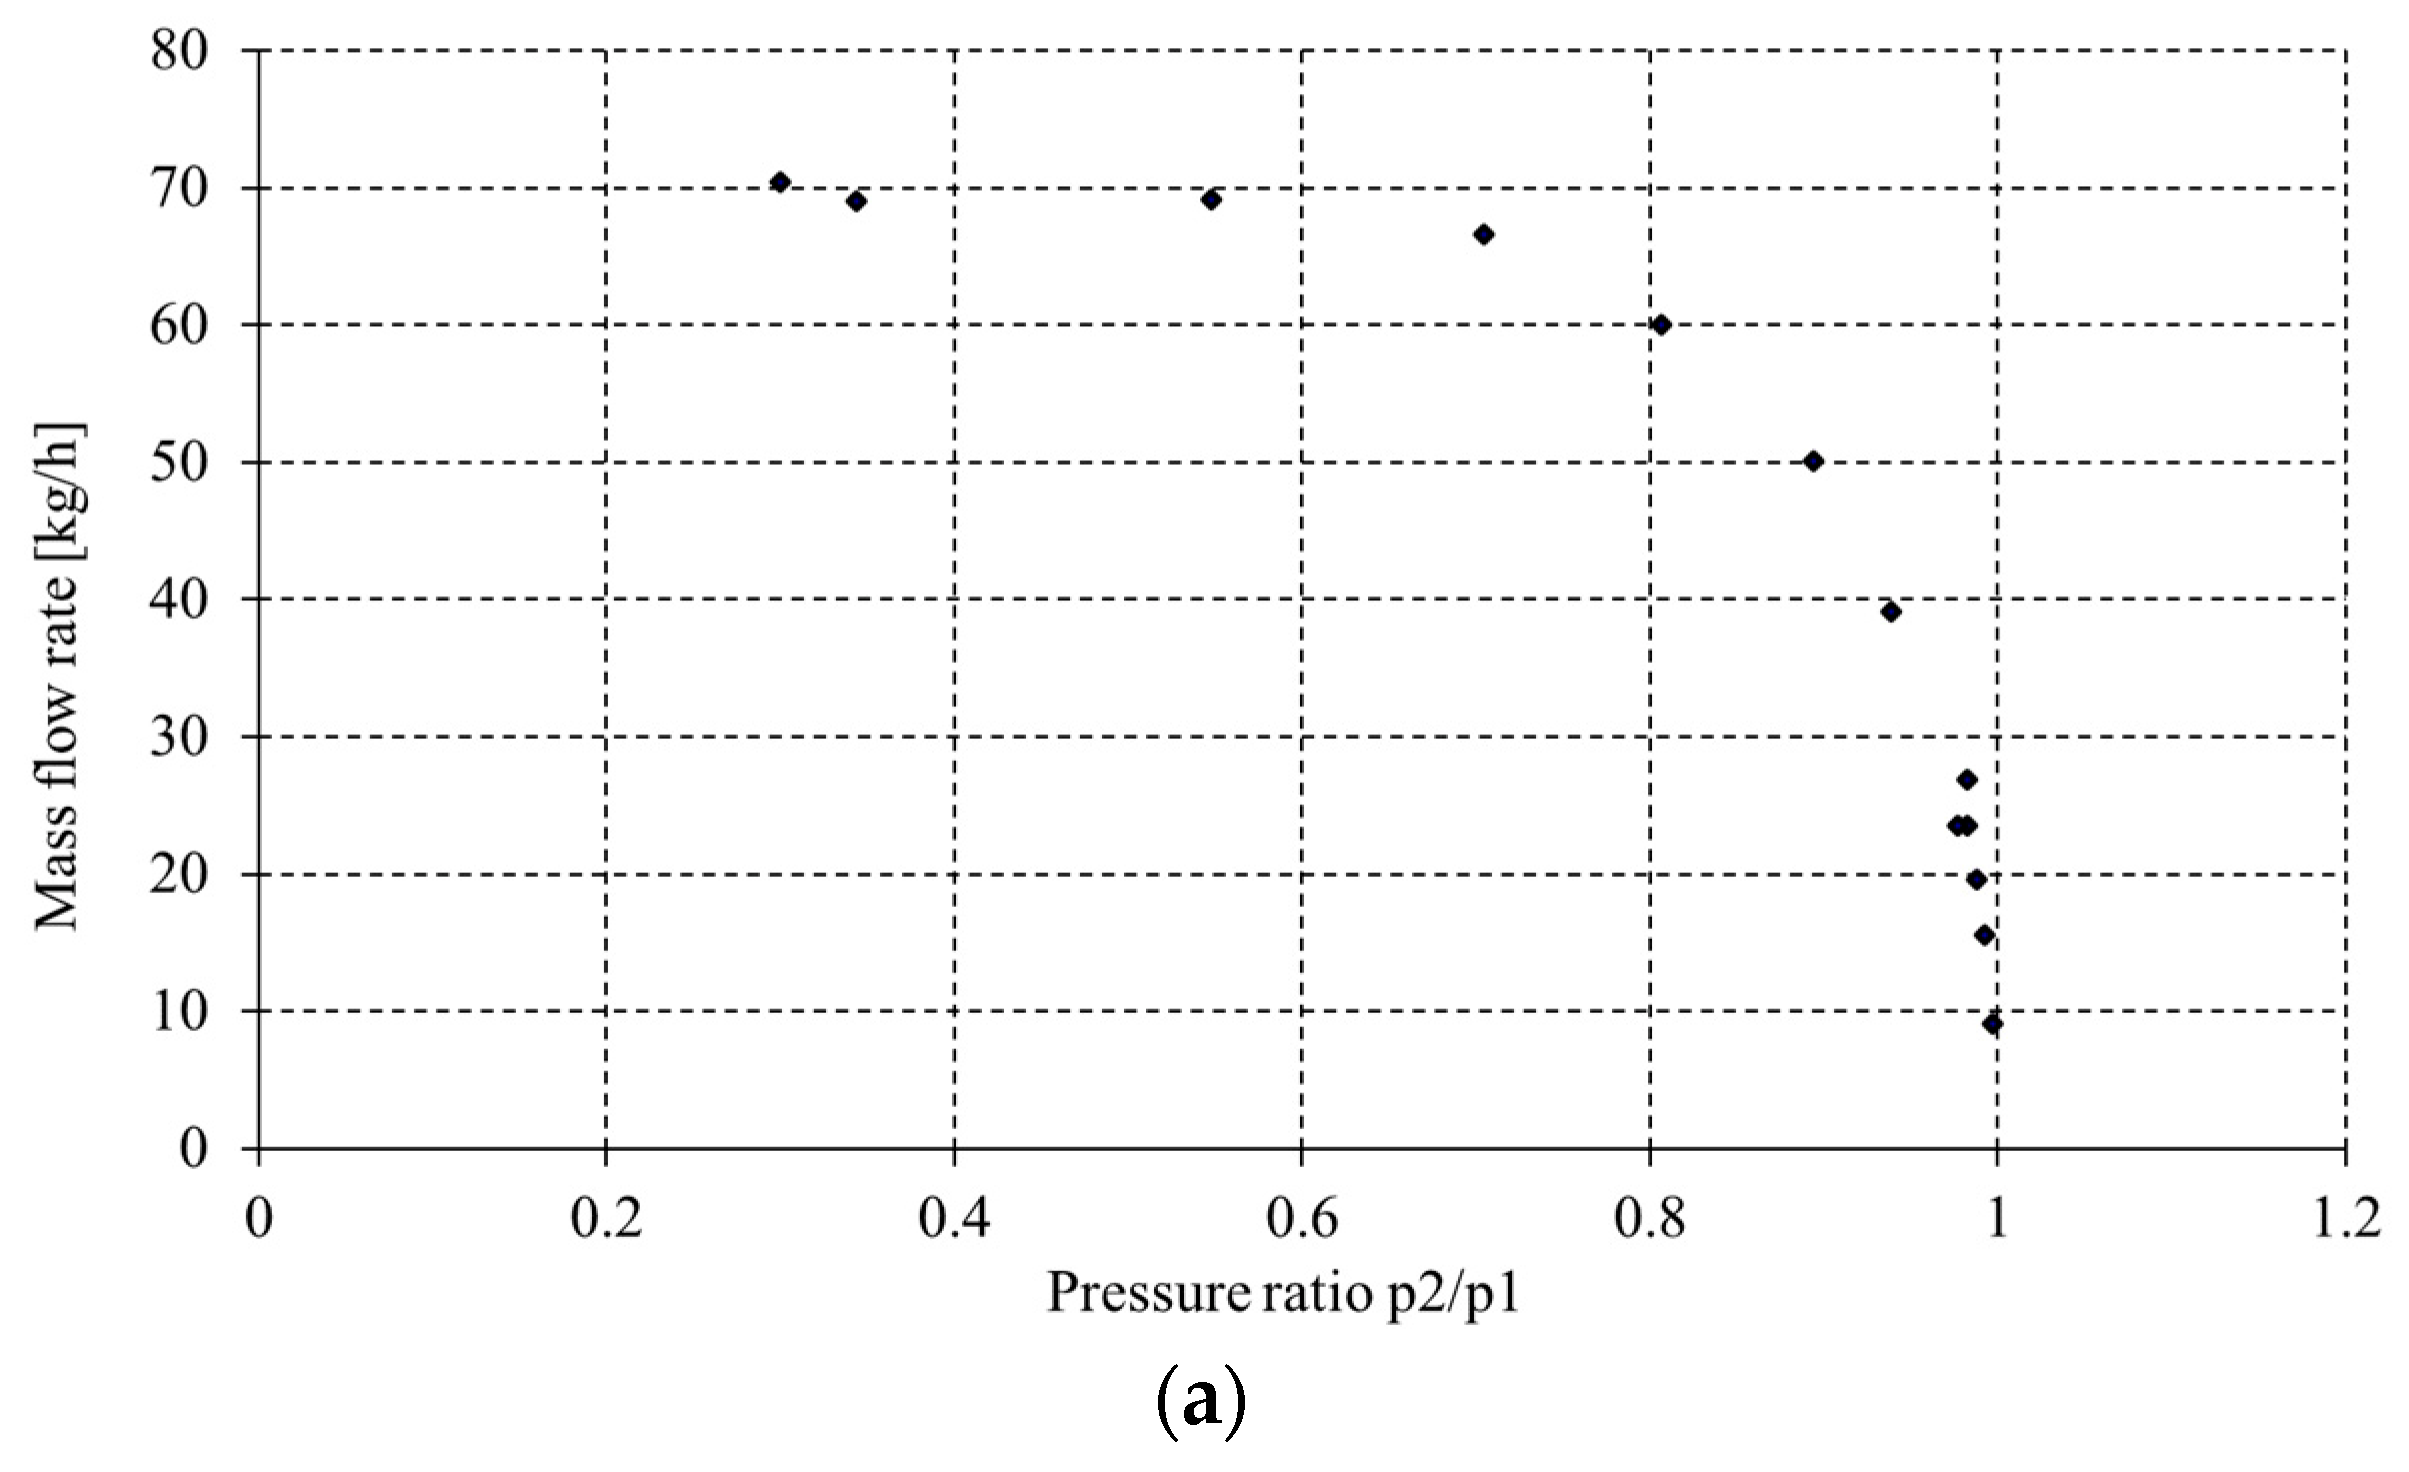
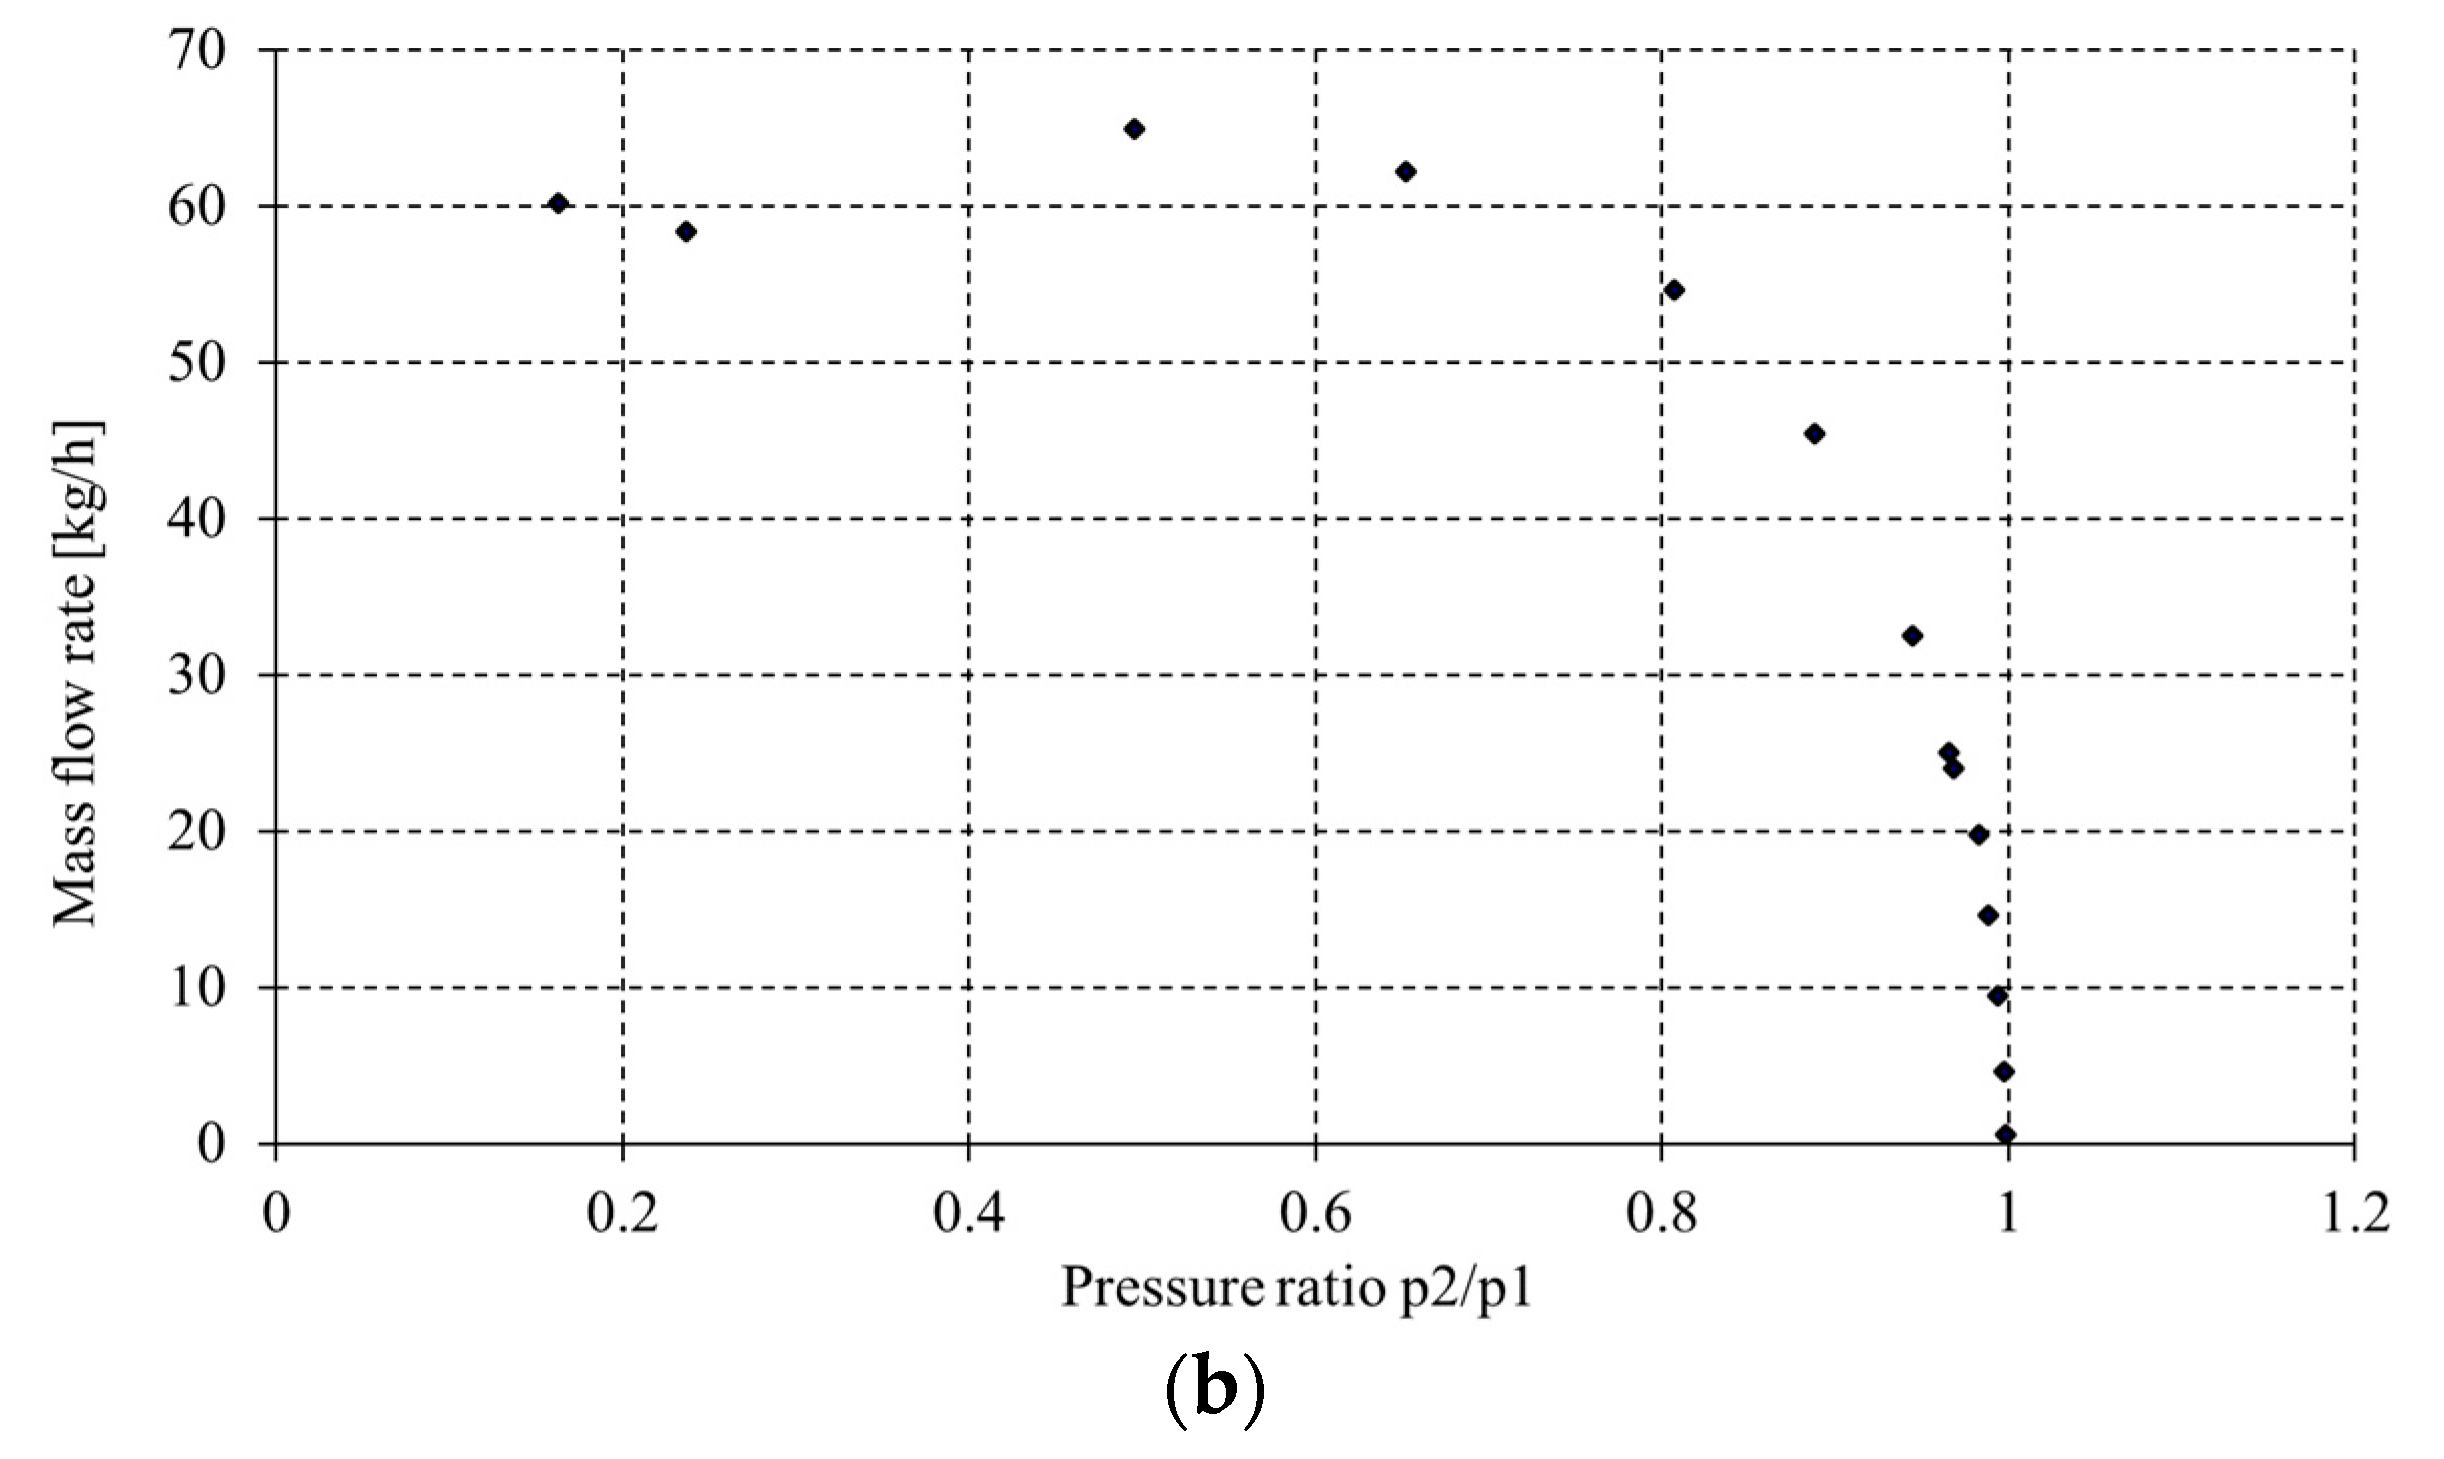
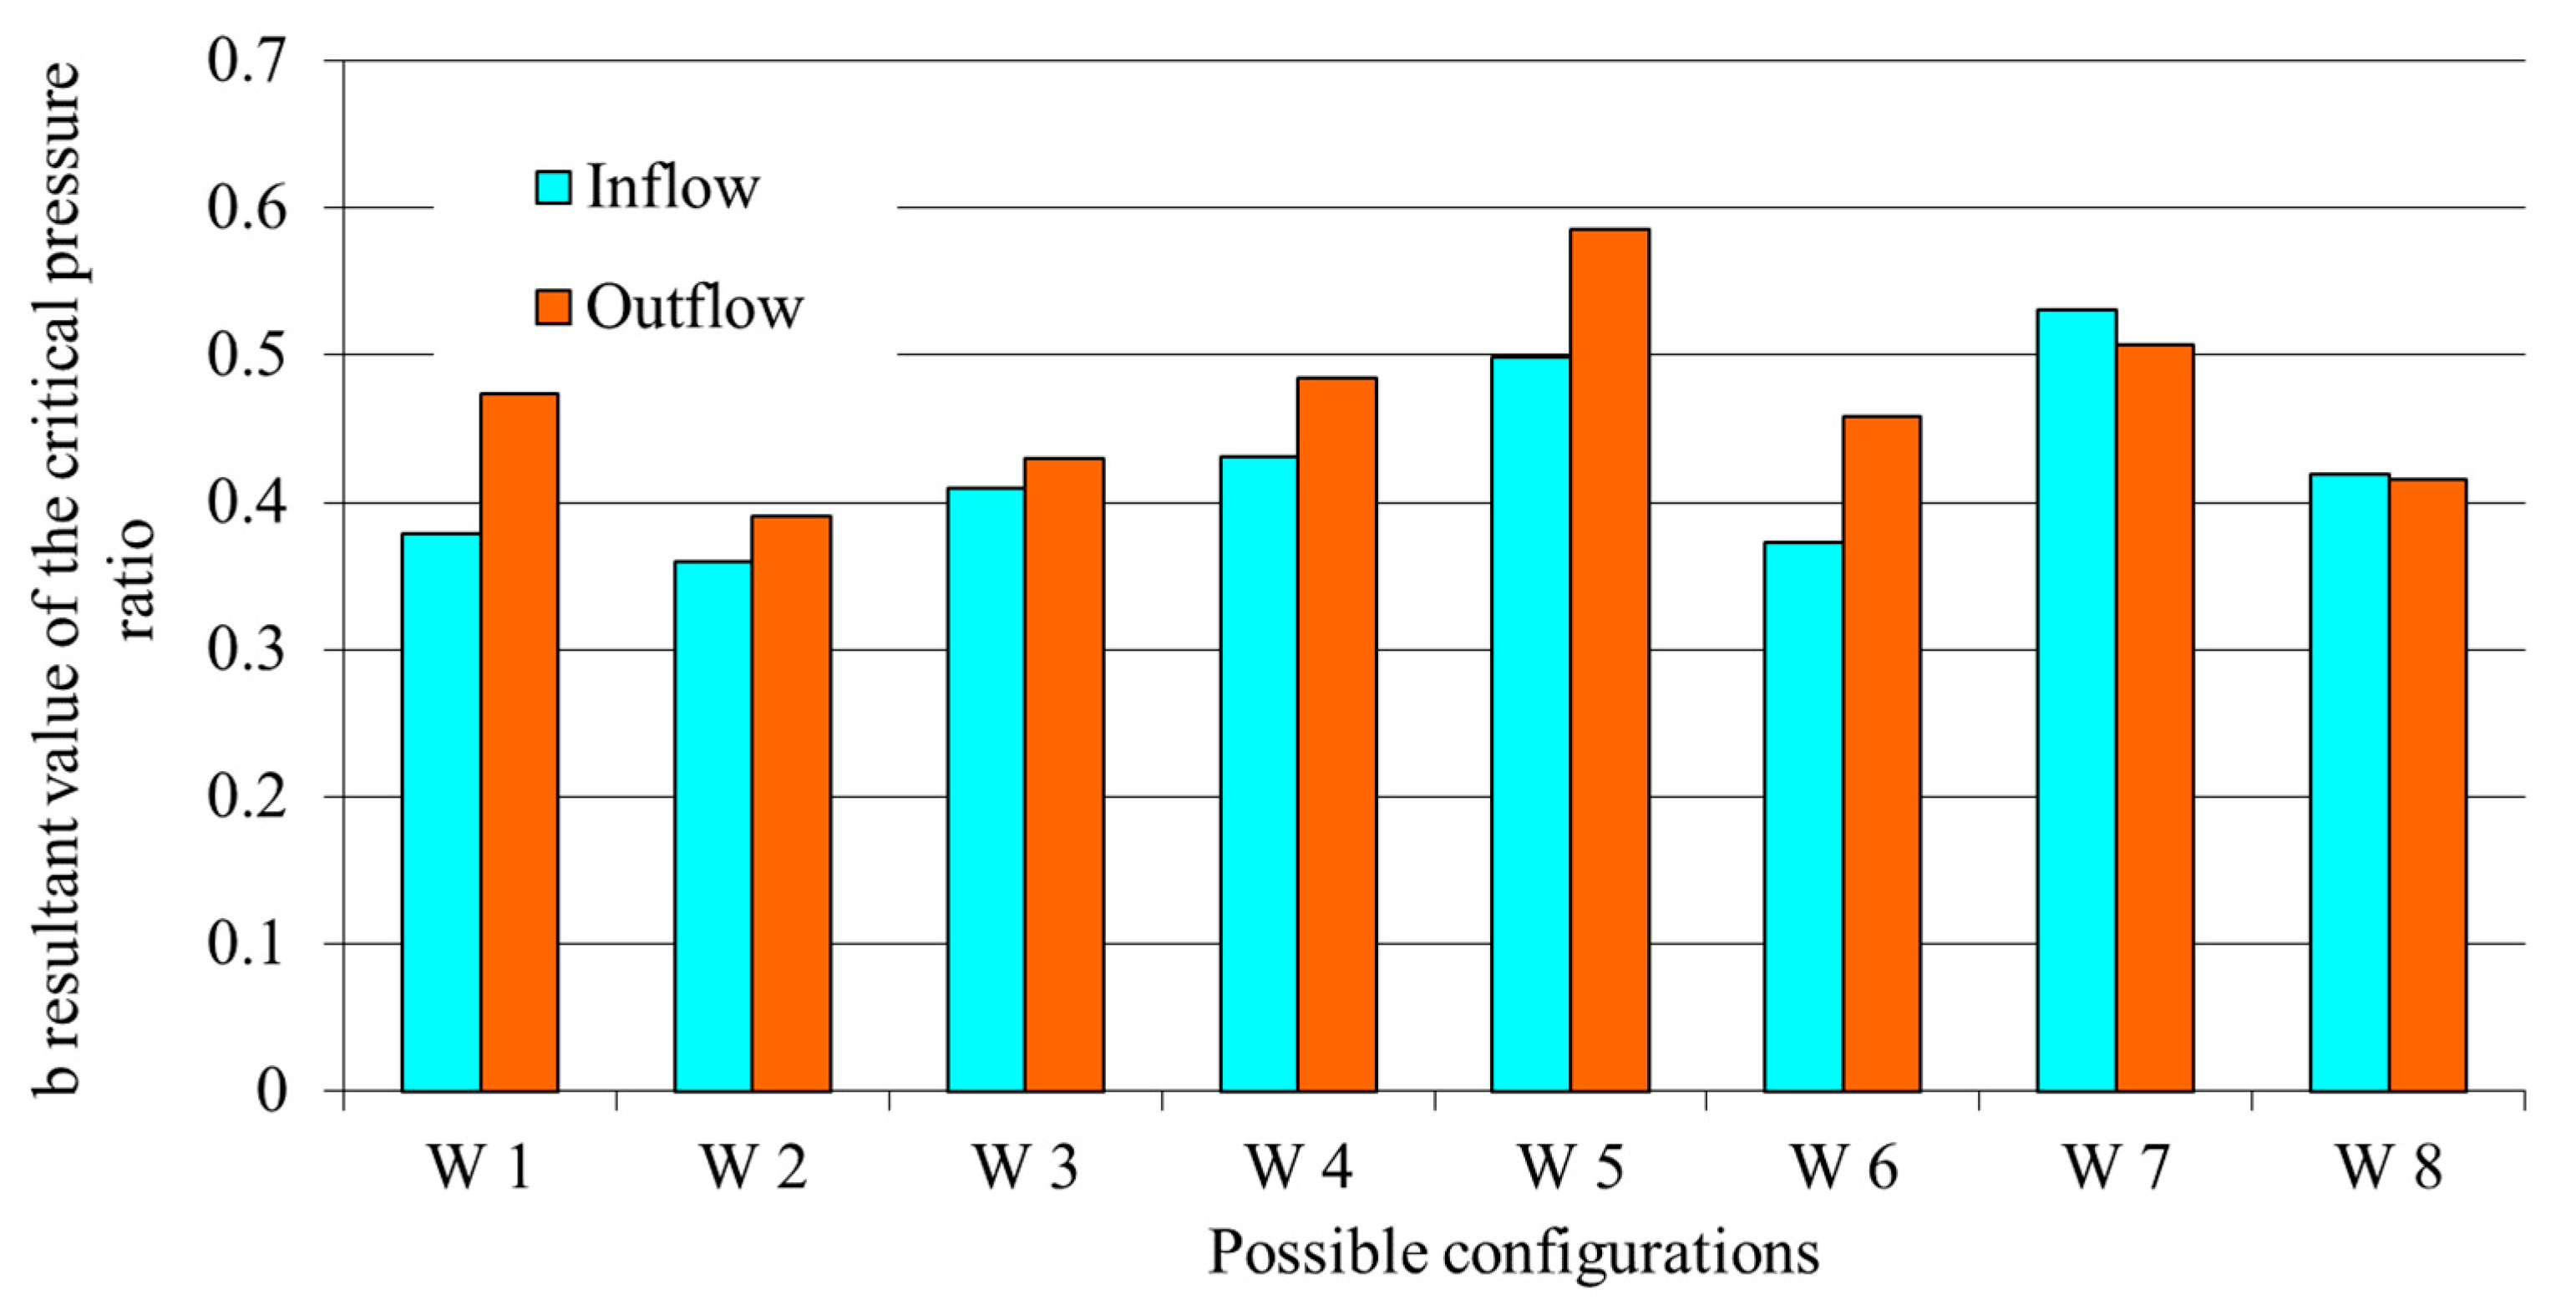
  • b-critical pressure ratio is the highest ratio value outlet presser to inlet presser, at which critical flow occurs in the tested element.
The flow properties of the pneumatic element are determined by the sound conductivity C and the critical ratio of static pressures b. By denoting the ratio of the static pressure p2 at the exit of the element to the static pressure p1 at the inlet of the element as η, the mass flow of the compressible fluid is determined by the formula:
m ˙ = C * p 1 T 0 * ρ N T N * Y η
Y η =         1                       f o r   0 η b 1 η b 1 b         f o r   b < η 1
The sonic conductivity C in the pneumatic elements results from Equation (9). This is the ratio of the mass flow rate of the gas q m * through the element to the product, and the density of this gas ρ 0 under the conditions of a standardized reference atmosphere ANR [10] at critical flow η b :
C = q m * p 1 * * ρ 0       w h e n   T 1 = T 1 * = T 0
The C sound conductivity is calculated for the critical flow at which the inlet temperature T 1 * gas is equal to the temperature T 0 .
The critical pressure ratio b is the highest pressure ratio value p 2 / p 1 , at which critical flow occurs in the tested element.
Critical flow is a condition wherein the gas flow velocity in a certain area of an element is equal to the local speed of sound. This occurs when the inlet pressure p 1 is sufficiently high in relation to the outlet pressure p 2 . The mass flow of gas is then proportional to the inlet pressure p 1 and inversely proportional to the square root of the inlet temperature T 1 and does not depend on the pressure at the outlet p 2 .
In the case of determining the flow resistance by the two pneumatic elements connected in parallel, the following relations can be used [5,10,12]:
C w = C 1 + C 2
C w 1 b w = C 1 1 b 1 + C 2 1 b 2
These equations make it possible to determine the resultant sound conductivity C w and the resultant critical pressure ratio b w .
There are two methods for series-connected components. According to the first one, the resultant sound conductivity C w can be determined from dependencies [6,12]:
1 C w 3 = 1 C 1 3 + 1 C 2 3
and according to the second dependence [10]:
C w =                                                   C 1                                   f o r   α 1   α * C 2 * α * b 1 + 1 b 1 * α 2 + 1 b 1 b 1 2 1 α 2 + 1 b 1 b 1 2   f o r   Δ p p 1 < 1 s  
where α is an auxiliary variable expressed as a relationship:
α = C 1 b 1 * C 2
The value of the resultant critical ratio of pressures b w in both cases is determined from the formula [6,10]:
1 b w C w 2 = 1 b 1 C 1 2 + 1 b 2 C 2 2
It is important that, in the case of Equation (13), the sequence of connecting the pneumatic elements has an influence on the calculated resultant value. This means that C w 1 , 2 C w 2 , 1 .

2.2. The Developed Method of Determining the Flow Coefficients

In order to determine the flow properties of a pneumatic resistor, it is necessary to know its flow characteristics, i.e., the dependence of the mass flow qm, or the gas volume flow qV flowing through its channels, on the factors causing this flow [3,7,9,14].
Table 1 summarizes the catalog data of leading manufacturers’ pneumatic components (valves, distribution valves, shuttle actuators, pneumatic conduits). There are no flow parameters among the data provided by the manufacturers. With this type of component catalog data, it is not possible to implement a known air flow model. In order to calculate the operation time of pneumatic systems with the use of known air stream models, information on the flow coefficients is necessary. Due to the above, a proprietary stand for testing the flow parameters of pneumatic elements was developed for the pneumatic trigger system of the launcher under consideration. These test results fill the absence of information about the flow parameters of the pneumatic elements used. Knowledge of the flow parameters will allow for calculating pneumatic systems and comparing solution variants already at the stage of designing a pneumatic system solution.
The developed stand (Figure 4 and Figure 5) was used to determine the flow parameters C and b of the components of the pneumatic release system (5/2 diverter valve, inlet channels in the body of the shuttle actuator, pneumatic connection conduits). In the tests on the stand, the value of the supply pressure is determined with the use of a reduction valve. During the experiment, the value of the mass flow qm or the volume flow qV (flow meter), the temperature value T0 (thermometer), the value of the static pressure p1 (manometer) in front of the test element, and the static pressure p2 behind the element (flow elements) are measured for ambient pressure pa (discharge elements).
In the case of the stand for testing flow elements, the throttle is used to change the value of pressure p2 downstream of the tested element. For outflow elements, the flow parameters are changed using a reducer. The presented stand was built on the basis of normative requirements, and its structure is the original achievement of the authors.
Figure 6 shows the built-in system for processing and recording measurement data, used to measure the flow parameters on the stand for testing pneumatic elements (Figure 5). The measuring system is configured with the following elements: TPXG16 pressure sensor (Figure 6, item 7, 8, 9, 10), temperature sensor TP 995 (Figure 6, item 4), flow meter EE7471-A6D2DN15 HA079015 (Figure 6, item 5), PSA-24mA analog signal converter (Figure 6, item 2, ITWL product), power supply (Figure 6, item 1), and computer (Figure 6, item 3).
The specified pneumatic elements were selected for the bench tests in Table 2. From the individual pneumatic elements, it is possible to configure the variants of the pneumatic trigger system of the launcher. For 5/2 spool valves, the flow parameters were measured in two possible operating states: in a state without a current signal on the control coil and with a current signal on the control coil.
The research was carried out according to the following developed research methodology: Fill the main tank of the compressed air source (pos. 1 Figure 4) to the working pressure (0.6 or 0.8 MPa) using the control panel. Set the inlet pressure to a constant pressure by means of the pressure-reducing valve p1 = 0.4 MPa. Use the throttle valve (item 12 Figure 4) to reduce the pressure at outlet p2 until its further reduction no longer increases the mass flow rate qm* (in practice, this means reaching a critical flow). Read the values of temperature T1*, inlet pressure p1*, flow rate qm*, i, and outlet pressure p2*. Close the throttle valve (pos. 12 Figure 4) so that the flow rate qm, reaches the value of 80% of the critical flow stream qm*. Use the reduction valve (pos. 3 Figure 4) to maintain a constant value of pressure p1 during the test. Read off the values: flow qm, temperature T1 and changes in pressure values Δpp = p1p2). Repeat the operations for the value of the flow rate qm equal to 60% (40%, 20%) of the value of the flow of the critical flow qm*.
During the tests, for each of the tested elements, a change in pressure (upstream and downstream of the tested element) and a change in the mass flow of air intensity were recorded.

3. Results

On the basis of the tests performed and the recorded courses of pressure changes and the mass flow of air flow for each of the tested elements, the dependence of the mass flow rate on the pressure ratio was determined (Figure 7, Figure 8, Figure 9, Figure 10, Figure 11 and Figure 12).
From the obtained dependences of the mass flow rate (Figure 7, Figure 8, Figure 9, Figure 10, Figure 11 and Figure 12), in accordance with the relationships described in Section 2.2., for each of the tested pneumatic elements, flow parameters were determined: sound conductivity C and critical pressure ratio b. The determined values of parameters C and b of the tested pneumatic elements are presented in Table 3.
The pneumatic discharge system of the launcher is a configuration consisting of several pneumatic assemblies. In order to determine the flow parameters for a system consisting of several pneumatic units (distributor and conduits), the dependencies on the resultant coefficients are described in Section 2.2. The calculations were made for the possible configurations of the trigger system and the graphic interpretation of the obtained results of the flow coefficients is presented in the bar charts presented in Figure 13 and Figure 14.

4. Discussion

The selection of the components of the steering and drive system can be resisted with the value of the C sound conductivity coefficient and the critical pressure ratio b. The analysis of changes in the air flow stream flowing into the valve working chamber shows a strong influence of the C coefficient on the operating time of the control and drive system, while there is no significant influence of the b coefficient on the flow rate. The sound conductivity coefficient C directly defines the value of the pneumatic resistance of the pneumatic element, while the parameter b directly affects the boundary between the critical and subcritical flow. With the knowledge of the coefficients C and b for each of the pneumatic units separately, it is possible to determine the equivalent coefficient of C and b for the control and drive system composed of these units. Mating the components of the control and drive systems should be selected according to rules for similar values of parameters C and b. For pneumatic conduits, the rule of similarity and approximation of the curve can be used for conduit diameters for which the values of C and b are known, while maintaining the similar surface roughness criterion. In the case of increasing the flow entering the working chamber of the actuator, the flow values of all elements of the system are important, and in the case of reducing the flow, it is enough to reduce the flow parameters of only one of the elements with the lowest value.
The proprietary test determines the flow parameters, and the developed methodology allows one to determine the desired flow parameters. The determined flow parameters of the pneumatic elements, being components of the launcher’s trigger system, complement the significant gaps in the catalog data of the manufacturers of pneumatic units.
From the cognitive point of view, the results of the work allow for an in-depth analysis of the models describing the air stream in pneumatic elements and the assessment of the usefulness of flow parameters (sound conductivity C and the critical pressure ratio b) in determining the working time of the actuator.
It is predicted that mathematical models developed based on the air stream model determined by parameters C and b can be used in the design, configuration, and evaluation of various pneumatic systems.
The results of the work can be used in the following problem areas:
Determining the pneumatic resistance of pneumatic elements and systems;
Determining the working time of the pneumatic system;
Determination of pressure losses in pneumatic systems;
Selection of components of the designed pneumatic system.
Further research should be directed toward the assessment of the influence of the geometry and shape of the channels of control elements (distributors), the extension of the mathematical model with the influence of loads coming from pneumatic loads (air stream flowing through the ball valve), the coupling of the impact of ball valve loads on the operation of a shuttle actuator, and an evaluation of the method of determining the flow parameters with the use of alternative methods.
The current study can be extended by using neutrosophic statistics [21] in future research. The proposed study can be extended with neutrosophic statistics, presented in detail in several publications.

Author Contributions

Conceptualization, G.J. and L.U.; methodology, G.J. and L.U.; software, G.J.; validation, G.J. and L.U.; formal analysis, G.J. and L.U.; investigation, G.J.; resources, G.J.; data curation, G.J.; writing—original draft preparation, G.J. and L.U.; writing—review and editing, L.U.; visualization, G.J.; supervision, L.U.; project administration, G.J.; funding acquisition, L.U. All authors have read and agreed to the published version of the manuscript.

Funding

This research received no external funding.

Data Availability Statement

Not applicable.

Conflicts of Interest

The funders had no role in the design of the study; in the collection, analyses, or interpretation of data; in the writing of the manuscript; or in the decision to publish the results.

References

  1. Jurczyk, K. The prospect for the launche of a mini unmanned aerial vehicle. Sci. J. Pol. Nav. Acad. 2018, 1, 1–26. [Google Scholar] [CrossRef] [Green Version]
  2. Novaković, Z.; Vasić, Z.; Ilić, I.; Medar, N.; Stevanović, D. Integration of Tactical—Medium Range UAV and Catapult Launch System. Sci. Tech. Rev. 2016, 66, 22–28. [Google Scholar] [CrossRef]
  3. Kondratiuk, M.; Ambroziak, L. Design and Dynamics of Kinetic Launcher for Unmanned Aerial Vehicles. Appl. Sci. 2020, 10, 2949. [Google Scholar] [CrossRef]
  4. Gan, L.; Fang, X.; Zhang, Z.; Chen, H.; Wei, X. Modular Clustering of UAV Launch System Architecture Based on HDDSM. Aerospace 2022, 9, 168. [Google Scholar] [CrossRef]
  5. Liu, D.; Liu, G.; Hong, G. Analysis of onboard takeoff and landing characteristics for unmanned aerial vehicles. In Proceedings of the AIAA Modeling and Simulation Technologies Conference, Washington, DC, USA, 13–17 June 2016. [Google Scholar] [CrossRef]
  6. Zhang, M.; Nie, H.; He, Z. Parameter optimization of nose landing gear considering both take-off and landing performance of catapult take-off carrier-based aircraft. Trans. Nanjing Univ. Aeronaut. Astronaut. 2016, 33, 187–198. [Google Scholar]
  7. Munk, D.J.; Auld, D.J.; Steven, G.P.; Vio, G.A. On the benefits of applying topology optimization to structural design of aircraft components. Struct. Multidiscip. Optim. 2019, 60, 1245–1266. [Google Scholar] [CrossRef]
  8. Jastrzębski, G. Description of the pneumatic work cycle of the starting unit of the UAV launcher. J. KONES 2017, 4, 61–70. [Google Scholar]
  9. Zhang, Z.; Peng, Y.; Wei, X.; Nie, H.; Chen, H.; Li, L. Research on parameter matching characteristics of pneumatic launch systems based on co-simulation. Aeronaut. J. 2022, 126, 381–400; [Google Scholar] [CrossRef]
  10. Jastrzębski, G. Impact of opening time of the take-off pneumatic launcher main valve on take-off pressure losses. J. KONES 2016, 23, 175–182. [Google Scholar]
  11. Szczepaniak, P.; Jóźko, M. Research of Pneumatic Distributors for Launcher of Unmanned Aerial Vehicle (UAV). J. Konbin 2022, 43, 249–276. [Google Scholar] [CrossRef]
  12. Cesco, N.; Dupas, M.; Renaud, L.; Rossi, C.; Vales, M. The pyronumeric, a new technology to answer to the future launchers challenges. In Proceedings of the 9th European Conference for Aerospace Sciences (EUCASS-3AF), Lille, France, 27 June–1 July 2022. [Google Scholar]
  13. Grymek, S. Air Stream Models in Pneumatics; Publishing House of the Gdańsk University of Technology: Gdańsk, Poland, 2012. [Google Scholar]
  14. Thomas, L.D.; Burris, K. Generational Evolution in Complex Engineered Systems. In Disciplinary Convergence in Systems Engineering Research; Springer: Cham, Switzerland, 2018; pp. 751–764. [Google Scholar]
  15. Yang, F.; Li, G.; Hu, D.; Kagawa, T. A new method for calculating the sonic conductance of airflow throug a short-tube orifice. Adv. Mech. Eng. 2017, 2, 1–13. [Google Scholar]
  16. Dindorf, R.; Woś, P. Application of the indirect tank method to measure static characteristics of pneumatic valves. Hydraul. Pneumatyka 2015, 3, 9–13. [Google Scholar]
  17. Taraila Walter, M. Model Based Systems Engineering for a Venture Class Launch Facility. Master’s Thesis, Old Dominion University, Norfolk, VA, USA, 2020. [Google Scholar] [CrossRef]
  18. Huang, M.; He, C.; Pei, J. Dynamic Analysis and Optimization of Pneumatic Wedge-Shaped Launcher for UAV. Trans. Nanjing Univ. Aeronaut. Astronaut. 2018, 35, 866–873. [Google Scholar]
  19. ISO 8778:2003; Pneumatic Fluid Power—Standard Reference Atmosphere. ISO: Geneva, Switzerland, 1990.
  20. ISO 6358-2:2019; Pneumatic Fluid Power Components Using Compressible Fluids Determination of Flow-Rate Characteristics. ISO: Geneva, Switzerland, 1989.
  21. Saber, Y.; Alsharari, F.; Smarandache, F. An introduction to single-valued neutrosophic soft topological structure. Soft Comput. 2022, 26, 7107–7122. [Google Scholar] [CrossRef]
Figure 1. General view of the pneumatic launch tube.
Energies 15 08424 g001
Figure 2. Diagram of the pneumatic control and drive system of the launch tube: 1—main ball valve, 2—shuttle actuator (main ball valve drive), 3—5/2 valve, 4—silencer, 5—power cord, 6—starter carriage release lock, 7—single-acting pneumatic actuator, 8—valve 3/2.
Energies 15 08424 g002
Figure 3. View of the pneumatic discharge system with marked compressed air paths (red—high pressure; blue—low pressure), where: pa—atmospheric pressure, po—pressure in the evacuated chamber, pr—pressure in the working chamber, To—ambient temperature, T1—supply air temperature, TM—air temperature in the working chamber, TW—air temperature in the evacuated chamber.
Energies 15 08424 g003
Figure 4. Diagram of the measuring stand: 1—computer, 2—recorder of signals from measuring sensors, 3—control panel, 4—compressed air, 5—filter, 6—reduction valve, 7—source cut-off valve, 8—flow meter, 9—temperature sensor, 10—pressure sensor, 11—measuring tube, 12—tested valve, 13—pressure sensor, 14—measuring tube at the outlet from the tested element, 15—throttle valve.
Energies 15 08424 g004
Figure 5. Stand for testing flow parameters of pneumatic elements: 1—control panel, 2—tested manifold, 3—pressure sensor, 4—laboratory power supply, 5—measuring pipe, 6—cut-off valve, 7—computer, 8—flowmeter, 9—signal and power cables, 10—control panel, 11—pneumatic tube, 12—compressor.
Energies 15 08424 g005
Figure 6. Measuring system with a set of sensors: 1—temperature sensor TP 995/A, 2—power supply, 3—thermodynamic flow meter EE741, 4—angular position sensor, 5—PSA-24mA analog signal converter, 6, 7, 8, 9—pressure sensors TPXG16, 10—computer.
Energies 15 08424 g006
Figure 7. Dependence of mass flow rate on pressure ratio for 5/2 PARKER No. 341NO3 manifold, working position: (a) currentless, (b) coil energized.
Energies 15 08424 g007
Figure 8. Dependence of mass flow rate on pressure ratio for 5/2 PARKER No. 341NO3 manifold with bored channels (Ø 8 mm), working position: (a) currentless, (b) with coil energized.
Energies 15 08424 g008
Figure 9. Dependence of the mass flow rate on the pressure ratio for the OBREiUP G1/8 manifold No. 611.012.949, working position: (a) currentless, (b) coil energized.
Energies 15 08424 g009aEnergies 15 08424 g009b
Figure 10. Dependence of the mass flow rate on the pressure ratio for the OBREiUP G1/2 manifold No. 611.012.964, working position: (a) currentless, (b) coil energized.
Energies 15 08424 g010
Figure 11. Dependence of the mass flow rate on the pressure ratio for the conduit: (a) 12 × 8 × 5, (b) 12 × 8 × 15.
Energies 15 08424 g011
Figure 12. Dependence of the mass flow rate on the pressure ratio for the conduit: (a) 8 × 6 × 5, (b) 8 × 6 × 15.
Energies 15 08424 g012aEnergies 15 08424 g012b
Figure 13. The value of C sound conductivity as a function of the trigger system variant.
Energies 15 08424 g013
Figure 14. The value of the critical pressure ratio b as a function of the trigger system variant.
Energies 15 08424 g014
Table 1. List of catalog parameters of pneumatic elements.
ProducerParameter
OBREiUPCompressed air, max. working pressure
HafnerNominal flow [l/min], operating pressure
ParkerOperating pressure [bar], operating time [ms]
HoerbigerNominal flow [l/min], working pressure [bar]
MaraniWorking pressure [bar]
Table 2. List of catalog parameters of pneumatic elements.
O.n.Pneumatic ElementType/Number/Dimensions
1Valve 5/2 PARKER341NO3
2Valve 5/2 PARKER341NO3 with tube (Ø 8 mm)
3Valve 5/2 OBREiUP G1/8611.012.949
4Valve 5/2 OBREiUP G1/2611.012.964
5Pneumatic conduit12 × 8 × 5 (Øext × Øint × len.)
6Pneumatic conduit12 × 8 × 15 (Øext × Øint × len.)
7Pneumatic conduit8 × 6 × 5 (Øext × Øint × len.)
8Pneumatic conduit6 × 6 × 15 (Øext × Øint × len.)
Table 3. List of catalog parameters of pneumatic elements.
O.n.Pneumatic Element C   s m 4 k g b
1Valve 5/2 PARKER 341NO3-not powered2.99 × 10−80.6135
2Valve 5/2 PARKER 341NO3-powered up2.99 × 10−80.5185
3Valve 5/2 PARKER 341NO3 with tube (Ø 8 mm) not powered3.22 × 10−80.3922
4Valve 5/2 PARKER 341NO3 with tube (Ø 8 mm) powered up3.03 × 10−80.4860
5Valve 5/2 OBREiUP G1/8 611.012.949-not powered2.01 × 10−80.5198
6Valve 5/2 OBREiUP G1/8 611.012.949-powered up2.22 × 10−80.5433
7Valve 5/2 OBREiUP G1/2 611.012.964-not powered7.28 × 10−80.5057
8Valve 5/2 OBREiUP G1/2 611.012.964-powered up7.32 × 10−80.4277
9Pneumatic conduit 12 × 8 × 5 (Øext × Øint × len.)1.09 × 10−70.5492
10Pneumatic conduit 12 × 8 × 15 (Øext × Øint × len.)9.22 × 10−80.7
11Pneumatic conduit 8 × 6 × 5 (Øext × Øint × len.)3.11 × 10−80.5476
12Pneumatic conduit 6 × 6 × 15 (Øext × Øint × len.)2.83 × 10−80.4952
Publisher’s Note: MDPI stays neutral with regard to jurisdictional claims in published maps and institutional affiliations.

