Article

Method Construction and Evaluation: A More Comprehensive and Reliable Classification of Coal Mine Gas Explosion Causes

1
School of Emergency Management and Safety Engineering, China University of Mining and Technology—Beijing, Beijing 100083, China
2
Department of Engineering Physics, Tsinghua University, Beijing 100080, China
3
Gas Office, Changshu Housing and Urban-Rural Development Bureau, Suzhou 215500, China
*
Authors to whom correspondence should be addressed.
Energies 2022, 15(22), 8443; https://doi.org/10.3390/en15228443
Submission received: 13 October 2022 / Revised: 1 November 2022 / Accepted: 9 November 2022 / Published: 11 November 2022

Abstract

:
Coal is an important fossil fuel energy that occupies a high position in the energy use of China and even the world. However, gas explosions are still the deadliest coal mine accident in China, which has long plagued the safety of energy mining. Only through accident cause analysis can we know the exact cause of the accident so as to make targeted policies, safety trainings, etc. However, the lack of detailed accident cause classification in current coal mine gas explosion accidents affects the comprehensiveness and accuracy of energy mining safety strategies. Therefore, in this study, a classification method for coal mine gas explosion accident causes based on the sixth edition 24Model and the three-element classification of gas explosions was proposed. Then, the consistency and validity of the newly established classification system were evaluated based on the three indicators, i.e., observer consistency, content validity, and criterion validity, and the performance of the classification system was verified. The results showed that the classification method exhibits good consistency and validity, and, compared with other classification methods, it can significantly improve the comprehensiveness of accident cause analysis results so as to obtain a more scientific energy mining safety strategy. In addition, the process used in this study to construct the classification and evaluate the performance of the classification is transferable, and it can provide a reference for the construction and evaluation of accident cause classifications in other fields.

1. Introduction

Coal is an important fossil fuel energy that occupies a high position in the energy use of China and even the world. Because of the objective reason of coal occurrence, underground coal mining is always one of the most dangerous forms of work, and gas explosion accidents are the most serious issue for the safety of China’s coal mine production [1,2]. Although the safety of coal mine production has improved gradually in recent years, the situation remains complex and grim [3]. Statistics show that from 2013 to 2020, a total of 280 coal mine accidents in large coal mines occurred in China, resulting in 1943 deaths, including 73 gas explosion accidents (including gas and coal dust explosion accidents, gas outbursts, and explosion accidents). This accounts for 26.07% of all the accidents in this period, resulting in 673 deaths, which accounts for 34.64% of all accident deaths in the current period, as shown in Figure 1 [4]. Thus, gas explosions are a major kind of coal mine accident, and, in recent years, the death toll from gas explosions has been the highest, highlighting the need to focus on the prevention and control of such accidents to ensure the safe exploitation of energy.
Accident analysis is the basic means of accident prevention. By taking accidents as a guide and drawing lessons from them, we can formulate regulations, risk management strategies, impart knowledge and training, and perform other accident prevention-related activities [5,6,7]. Therefore, to realize the long-term prevention mechanism of gas explosion accidents, it is necessary to continue the relevant accident cause analysis.
At present, a large number of scholars have conducted accident statistical analyses and research on coal mine gas explosion accidents, which have made great contributions to the prevention of gas explosion accidents. Chen, Qi, and, Tan [2] analyzed and studied 410 major gas explosion accidents in China and concluded that human factors were the main cause of these accidents. Yin [8] analyzed 201 heavy and extremely large gas explosion accidents in China from 2000 to 2009 and put forward relevant prevention suggestions for unsafe high-frequency actions. Zhang et al. [9] analyzed the causes of 126 particularly major gas explosions in China from 1950 to 2015 and found that the chaotic management of ventilation equipment was the most common cause of gas accumulation, and illegal blasting was the main cause of ignition. Liu et al. [10] analyzed the causes of gas explosions in China from 2000 to 2020, identifying the highest frequency locations and causes of underground gas explosions and exploring the trend and correlation between the causes of accidents. Tong et al. [11] analyzed the causes of 200 coal mine gas explosion accidents in China and constructed a probabilistic risk assessment model by classifying unsafe behaviors according to the type of work, which provided a basis for risk management and control. Because of the complexity of the accident, the causes of the accident had many commonalities and some main characteristics. In order to strengthen this logic and facilitate its application, the above research often classifies the causes of accidents. Classification is not only an effective tool to deepen the statistical analysis results of accidents and explore the correlation between their causes but is also a necessary prerequisite for risk evaluation index quantification and risk assessment.
In the era of big data, it is an indisputable objective fact that computationalism (using the perspective of computing to examine, analyze, and solve security problems) and dadaism (using data to speak) is widely applied within various fields and different disciplines [12]. The complexity of security and system problems promotes the transformation of related research from low dimensional to high dimensional, from linear to nonlinear, from small to large, and from scalar to vector. Artificial intelligence, data mining, and machine learning are frequently used [13]. Previous models for coal mine gas explosion accident statistics do not meet the demand of the current analysis, such as the correlation between the cause of the accident and the exploration and classification of hazard control. Further, an accurate prediction of the risk value of the accident prevention work is required to support the cause of the accident categories, along with a more detailed classification of the coal mine gas explosion accident, which has become an inevitable requirement. However, there is a lack of a set of detailed accident cause classifications in the field of coal mine gas explosion accidents.
Therefore, in this study, we developed a coal mine gas explosion accident cause classification tool to improve the comprehensiveness of the current accident analysis, providing a basis for formulating a more scientific energy mining safety strategy. In addition, we prepared a set of methodologies to evaluate classification performance through the construction of the accident cause classification method, providing a reference for the construction of accident cause classifications in other fields.
The sections of this paper are arranged as follows. First, the basic structure of the proposed classification is clarified and explained in Section 2. Then, based on the theoretical and methodological basis established in Section 2, the classification system is constructed. In Section 3, three experiments are presented to test the performance of the classification method and verify whether the classification method can achieve the proposed goals. Finally, Section 4 summarises the results obtained in this study.

2. Theoretical Basis and Concept Definition

2.1. Classification Basic Structure

In this paper, the basic structure of the classification method is mainly referred to as the 24Model and the three-element classification of gas explosion. The former provides the framework for setting the classification categories, whereas the latter provides the basis for setting the classification subclasses.

2.1.1. 24Model

The 24Model was first proposed in 2005 and is mainly based on Heinrich domino theory [14], Bird’s linear causative model [15], Stewart’s MMOS [16], Reason’s Swiss cheese model [17], and partially nonlinear models [18]. Unlike the well-known systemic accident causation models, the 24Model has undergone an evolutionary process from a linear model to a system theory model; the early 24Model belongs to the epidemiological model (first edition, second edition, and third edition), and its systematism began to emerge after the fourth edition [19], and it matured in the latest sixth edition of the 24Model [20,21] (see Figure 2).
Organization and accident are the most basic concepts in the 24Model; “organization” is short for social organization, which has its own management functions and administrative structure and is a part of the administrative structure. Combined with the emphasis of the model on the concept of ‘organization’, the 24Model indicates that any accident occurs in at least one social organization; thus, any accident is an organizational accident, and the organization is the subject of accident prevention [22]. On this basis, the 24Model defines an accident as “a series of negative effect events prescribed by an organization and not expected by people that cause damage to life, health, property, or the environment”. Thus, the 24Model divides the causes of accidents into two behavioral levels: organization and individual. The causes of accidents at the organizational level are divided into two stages: culture and system, while at the individual level, they are divided into two stages: ability and individual action. Overall, it divides the causes of accidents into two levels and four categories, which is why it is called the 24Model.
The 24Model is a systematic accident cause model which can provide a more comprehensive and systematic perspective for accident prevention [23]. As it has experienced an evolutionary process from being a linear model to a systematic model, when compared with the most widely used classical systematic models such as STAMP [23], AcciMap [24], FRAM [25], it also has some unique advantages:
(1)
The 24Model is suitable for the analysis of large samples and big data. Owing to the limited number of accident causes in an accident case, only a large number of accidents can be analyzed to develop comprehensive and systematic accident prevention measures [26]. Therefore, the cause model of systemic accidents should be able to adapt to the statistics of large samples and big data. The logic of the 24Model is simple, and each module has a clear definition and boundary, so it is more suitable for accident statistics analysis with large samples and big data. In addition, the 24Model has been widely applied in related fields [27,28,29,30,31], and its performance in accident cause analysis based on a large number of accident cases has been verified;
(2)
The 24Model has a flexible demand for the abundance of accident case information. The comprehensive presentation of the accident causes and logic between the causes is the advantage of the systematic accident causation model, but the above advantages are based on sufficient information on accident cases. According to a relevant study [32], the current accident investigation report of coal mine gas explosion accidents has different degrees of detail descriptions of accident causes. The demand of the systematic accident cause model for the abundance of accident case information should be flexible to avoid a situation in which the accident cause model cannot be completed because the accident investigation report is too brief. The 24Model has low requirements on accident cases, and there is no need to build a system control chart similar to STAMP or a functional network diagram of FRAM in advance. Analysts collect information related to accidents (as far as is possible), and then analyze them individually according to the cause module of the model to complete the accident analysis. Even if the accident case information is not sufficiently comprehensive, the accident can also be analyzed according to the existing information, and the cause of the accident can be classified. Thus, an insufficiently comprehensive accident case does not make the accident analysis work difficult [33,34];
(3)
Each module of the 24Model exhibits strong scalability. As mentioned in the introduction section, to improve the consistency of the accident analysis results, it is necessary to perform index refinement based on the accident causation model. Therefore, the accident cause model must have a certain extensibility. The definition of each module leading the system block of the 24Model is derived from long-term practical experience or authoritative standards and has high adaptability with other theories, models, and methods. At the same time, each module, as a separate concept, has a very rich connotation in the field of safety science. At present, relevant studies have been extended based on the 24Model. For example, Miao [35] used the classification of unsafe acts in HFACS as the subindex of the unsafe action module in the 24Model, which not only enriches the index division of the 24Model but also retains the significant advantages of the 24Model for clearly defining various modules. Suo [36] built the 24Model-MGE based on the 24Model. The unsafe condition was divided into gas accumulation, ignition source, technical facilities, and environmental conditions; the unsafe acts and personal abilities were classified according to the coal mine functional departments, and the safety management system causes were subdivided by reference to OHSAS 18,001. The above application studies have proved that each module of the 24Model has strong scalability;
(4)
The output of the 24Model is relatively concise, which is beneficial to the popularization of scientific research achievements and the application of field personnel. Due to the characteristics of the early linear accident cause model, the 24Model can not only complete the complex system modelling but can also show the accident analysis results in a concise diagram [37].
Based on the above analysis, the systematic accident cause model, i.e., the sixth edition 24Model, was selected as the main framework for the coal mine gas explosion accident cause classification proposed in this paper.

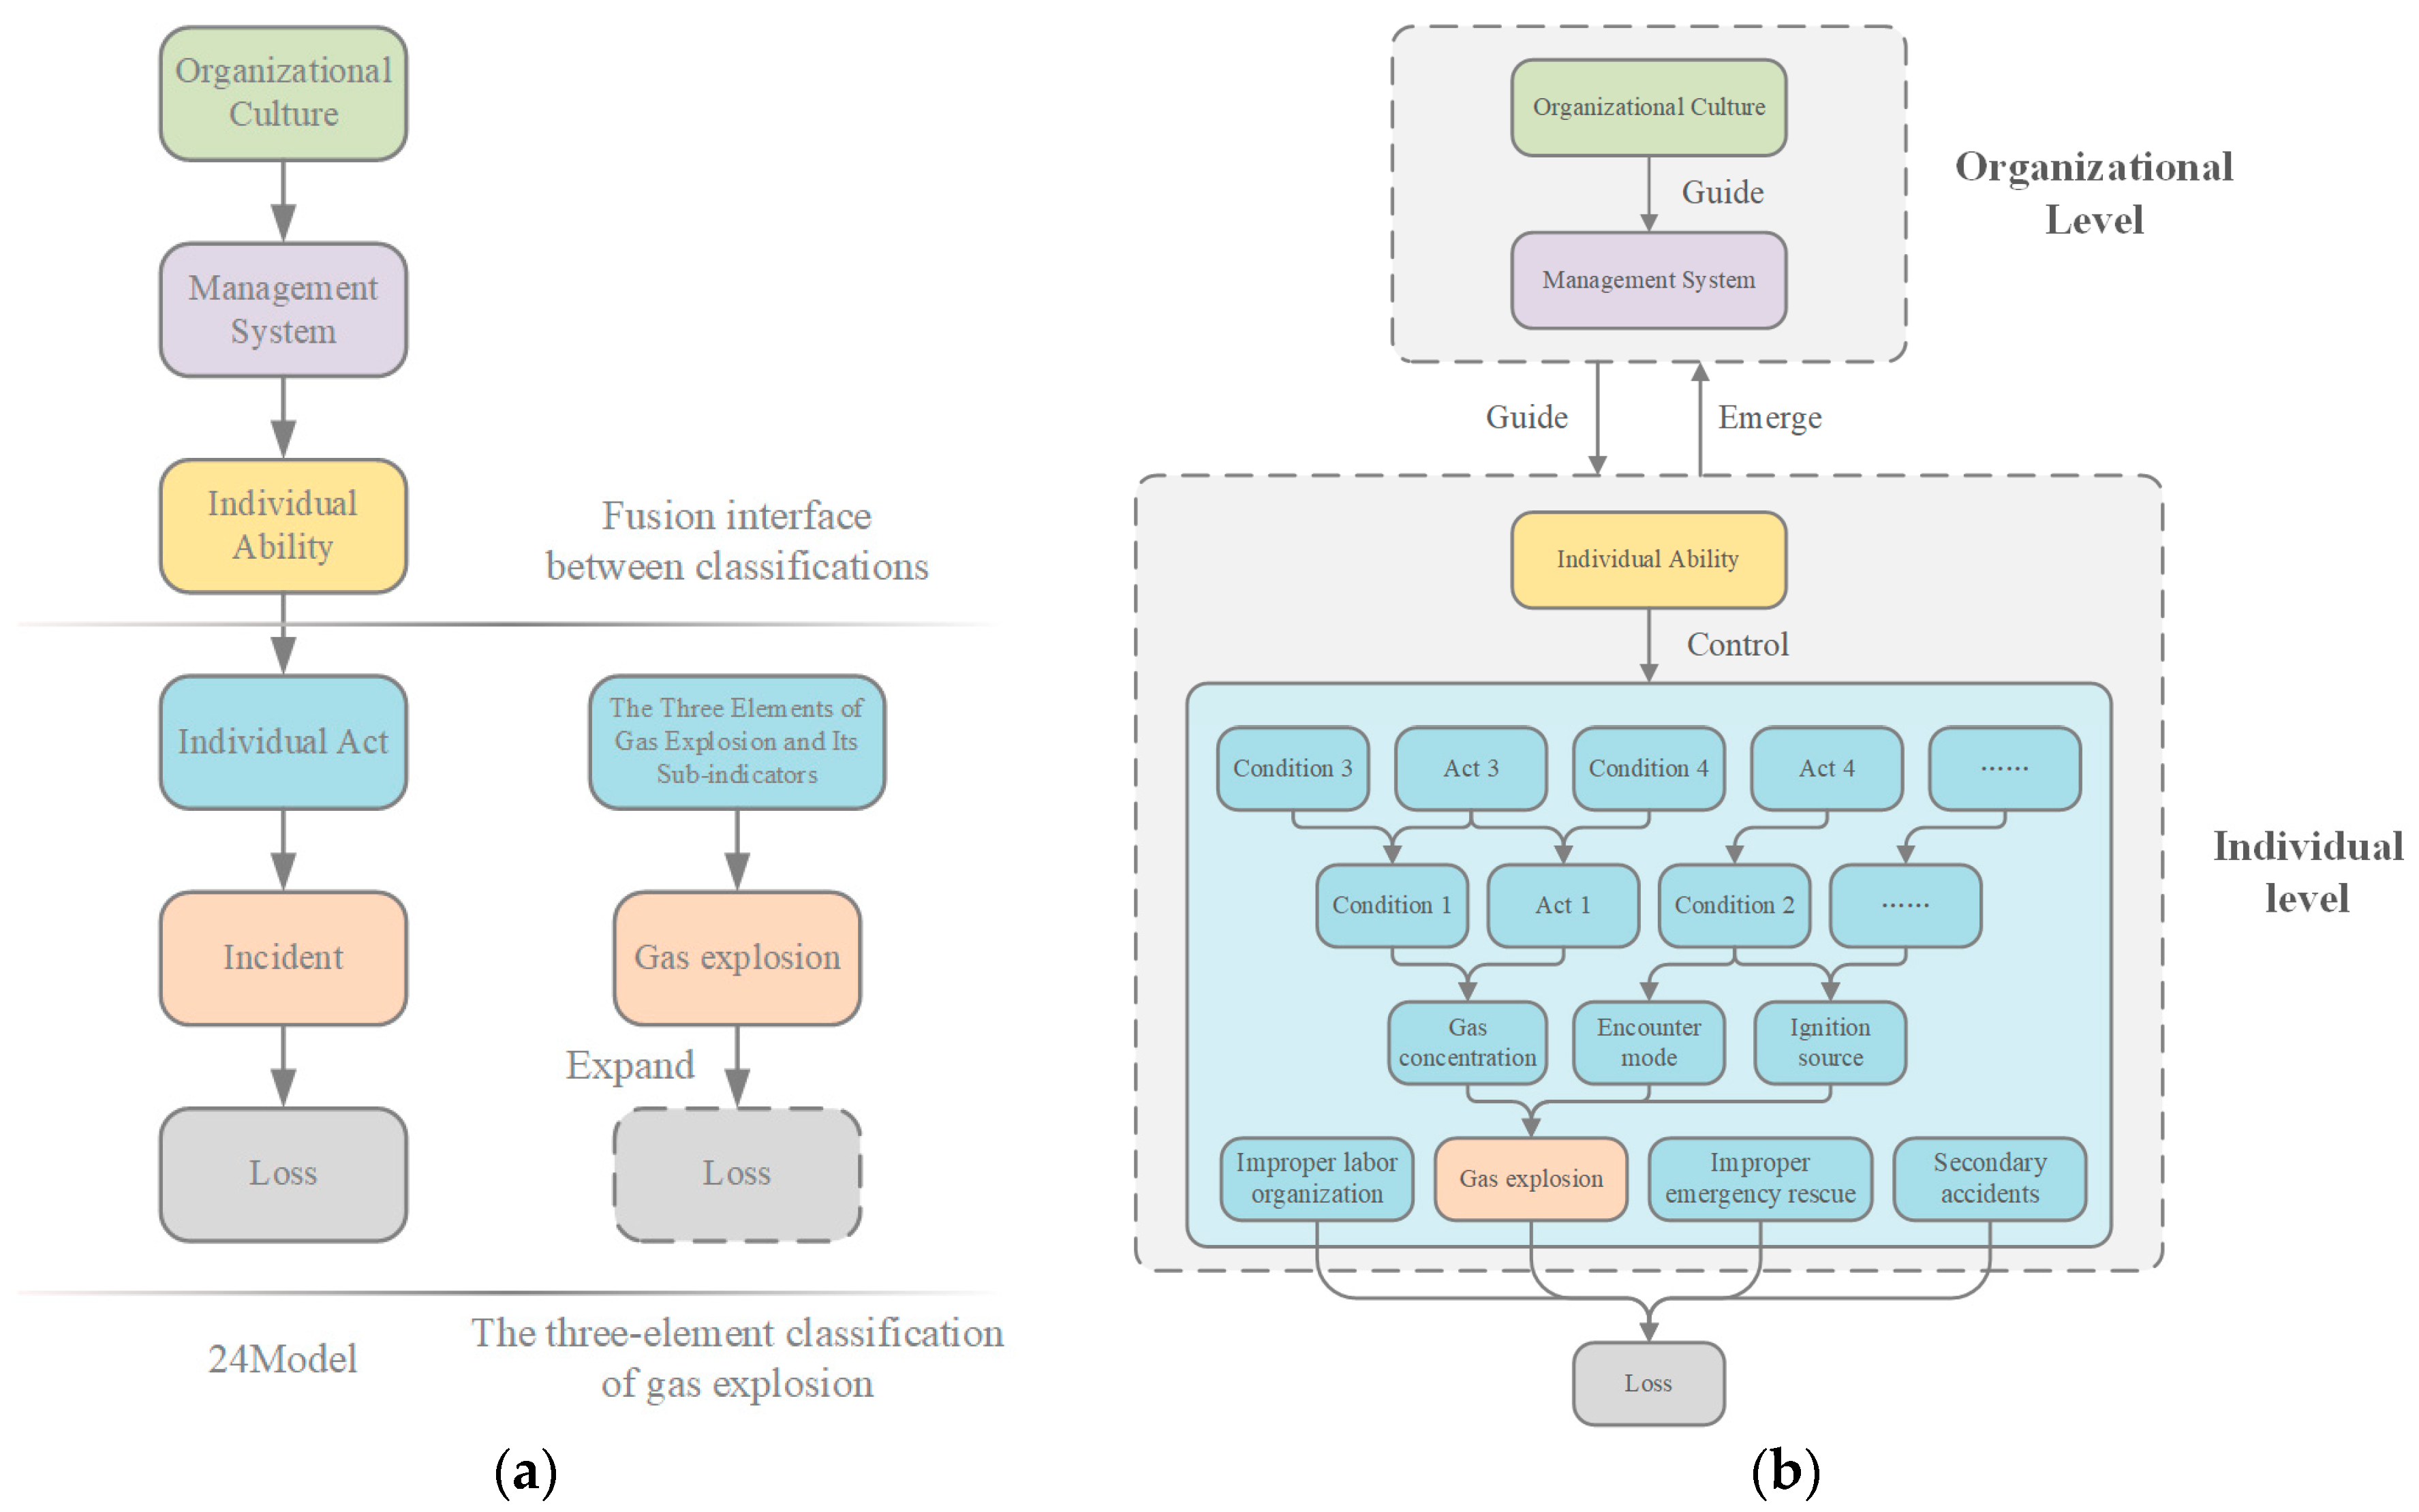
2.1.2. Three-Element Classification of Gas Explosion

The three elements of gas explosion refer to the three necessary conditions for gas explosion: (1) a cumulative gas concentration of 5–16%. (2) An ignition energy greater than 0.28 mJ, a temperature higher than 595 °C, and a fire source that is maintained throughout the explosion. (3) An oxygen concentration greater than 12% with CO2 as an inert gas or greater than 9% with N2 as an inert gas [38]. In the workplace, the oxygen concentration always exceeds 12%, so the main consideration for gas explosion accidents is gas concentration accumulation and the ignition source [39].
The three-element classification of gas explosion is highly consistent with the aim of the present study because of the following three points:
(1)
The use of consequences as the basis for classification. The establishment of accident cause classification based on consequences can explain the logical relationship between the accident causes through the category level and can then improve the consistency of the accident analysis results and the readability of the accident cause classification;
(2)
High recognition in the industry. The industry has basically reached a consensus on the physical conditions of a gas explosion and the division of the ignition sources, which is highly accepted and is simple and easy to use by onsite personnel;
(3)
Adding details to the 24Model. The classification of the three-element classification of gas explosions is exclusive to the field of gas prevention and control. The subindex division based on this method can improve the practicability of the 24Model in the analysis of coal mine gas explosion accidents.
Based on the above analysis, the three-element classification of gas explosions was selected as the main basis for establishing the classification method for the coal mine gas explosion accident causes presented in this paper.

2.1.3. Fusion Interface between Classifications

When considering the communication between classes as the basis of the fusion of different classifications, although there is obvious complementary relationship between the 24Model and the three-element classification of gas explosion, they do not have a condition of category compatibility from top to bottom. In order to integrate the two, it is necessary to clarify the interface where the two integrate.
The three elements of gas explosion usually take the event of ‘gas explosion’ as the starting point of accident analysis and accident cause classification, but this approach misses a series of causes and events that contribute to further losses, including unreasonable labor organization, improper emergency rescue, and secondary accidents. The investigation report of coal mine gas explosion accidents considered the data source and the 24Model as the basis for the classification method, with both taking the final loss event as the starting point for accident analysis, while expanding the top event of the three elements of a gas explosion to improve the scope of locating the accident cause and make it fit the classification system of the 24Model.
From the causes obtained in the process of accident analysis, the corresponding parts of the three elements of a gas explosion and the 24Model are mainly focused on individual acts (acts and conditions). The organizational factors (management factors) are difficult to reflect in the three-element classification of gas explosions due to the characteristics of the complex social and technical configurations of coal mine systems and the limitations of the classification method itself, which, alone, cannot correspond to the 24Model. Therefore, after extending the analysis starting point of the three elements to the loss events, the main interface for the fusion of the two classifications is the individual acts, as shown in Figure 3a.
Notably, the occurrence of coal mine accidents involves many organizations, mainly including the accident of the coal mine, the contract unit, the superior unit, and the regulatory department. Considering the information of accident causes shown in accident case reports and the main responsibility of accident prevention, in this paper, coal mining enterprises are considered to be the main organization for the accident analysis. In turn, the causes of the accidents in other organizations become external to the organization. According to the 24Model, after determining the main organization of accident analysis, factors outside the organization can be understood as the deficiency of internal response measures, which can then be included in the consideration of internal causes, and the deficiency of response measures can be divided into the four types accident cause. Therefore, the causes of the accidents, except for the coal mines, are uniformly classified as factors outside the organization, and no category is set.
The established basic structure of the classification is shown in Figure 3b. Afterward, based on the classification framework (subcategory construction principles and basic concepts), the classification of Coal Mine Gas Explosion Causes was constructed through accident analysis. The classification includes three categories and 138 subcategories in total, and the upper-level index structure is shown in Figure 4. The construction process and the description of the classification subclasses are detailed in the Supplementary Material.

3. Classification Performance Evaluation

Guiding accident cause analysis and accident cause classification and improving the comprehensiveness and accuracy of accident analysis results are the expected functions of the classification constructed in this study. The application value of the classification system was determined by its performance when it reaches a certain level. Therefore, the performance (above) must be fully evaluated and verified before the classification can be used.

3.1. Evaluation Metrics

On the one hand, the usefulness of the method depends on its ability to provide reproducible results, and on the other hand, on its ‘plug and play’ performance, which can provide results comparable to experts even if the user is not yet experienced [40]. The above two aspects can be summarized considering two indicators: consistency and validity, both of which are concepts in statistics and have been applied by many researchers to test and validate accident analysis methods [41,42,43,44].

3.1.1. Consistency

Consistency refers to the degree of similarity between the results obtained by the same method under similar conditions over a given period of time. According to previous studies, interobserver reliability and test–retest reliability are used as a representation of the consistency of accident analysis results (that is, the degree to which similar results are produced by different analysts analyzing the same case or the same analyst analyzing the same case at different times) [45,46,47]. Considering the controllability of the variables, interobserver reliability was chosen as the index to evaluate the consistency of the accident analysis results [48].

3.1.2. Validity

Validity refers to how accurate a measurement is, i.e., how close it is to what it is trying to measure. Regarding the validity of accident analysis methods, Igene and Johnson [41] believe that the validity of accident analysis methods refers to the degree of difference between the output results of the analysts and the experienced experts. According to Underwood, Waterson, and Braithwaite [44], the validity of an accident analysis method refers to the ability of the analyst to correctly identify the accident causes when applying the method. Jacinto [42] believes that a valid accident analysis method should promote (as much as possible) the consistency between the analysis results and reality. Katsakiori, Sakellaropoulos, and Manatakis [43] believe that the validity and consistency of accident analysis methods are closely related. If different investigators can reach the same conclusion through accident analysis methods, and the method proves that the accident analysis results will appear in future accident scenarios, the validity of the method can be proved. To sum up, the validity of an accident analysis method mainly refers to the consistency between the accident analysis results obtained by applying the method and the reality or expert results.
There are three main evaluation indicators of validity: construct validity, content validity, and criterion validity, which are aimed at different inspection objectives:
(1)
Construct validity refers to the degree to which the method can actually achieve the theoretical structure and characteristics of the target [49], corresponding to the classification established in this paper, i.e., assessing whether the structure or theoretical basis of the method is reasonable;
(2)
Content validity, which refers to whether the measurement content is suitable for the measurement target or whether it can reflect the characteristics or attitudes of the measurement target [50], corresponding to the classification established in this paper, that is, whether the categories in the classification can achieve comprehensive coverage of the coal mine gas explosion accident causes;
(3)
Criteria validity refers to the degree of correlation between the test results and the validity criteria. Validity criteria are a reference standard for measuring the validity of the test. It is a standard that is independent of the test method and can reflect the purpose of the test. When corresponding to the classification established in this paper, the validity criteria is the correct result of the classification, and the criterion validity can be regarded as the deviation between the user’s classification result and the correct result.
Since the classification proposed in this paper is established based on accident analysis, all subcategories can find their corresponding reasons in the accident investigation report, and both the 24Model and the three-element classification of gas explosions, as the theoretical basis, have been verified and applied for a long time. Therefore, construct validity is not within the scope of this chapter. Combining the definitions of content validity and criterion validity, it can be seen that both are important evaluation indicators to measure the performance of classification.
To summarize, this chapter uses interobserver reliability, content validity, and criterion validity as evaluation indicators for the consistency and validity of the classification results.

3.2. Evaluation Process

To evaluate the performance of the classification, three groups of experiments were designed using the classification to evaluate the consistency and validity of the classification under different usages. The specific design contents are as follows:
(1)
Experiment 1: two groups of analysts, A and B, were recruited to analyze the same batch of accident cases. Among them, the analysts of Group A used the sixth version of the 24Model to conduct accident analysis (as the control group); the analysts of Group B used the classification to conduct accident analysis (the experimental group). Observer consistency was calculated based on the accident analysis results obtained by the two groups of analysts to assess the consistency of the classification as an accident analysis tool;
(2)
Experiment 2: We organized professionals to analyze a batch of accident cases, discuss and reach a consensus on the accident analysis results, and use them as ‘validity criteria’. Afterward, the classification information of the accident analysis results was withheld, and a group of analysts was recruited to apply the classification to classify them. The validity criterion is verified based on the accident classification results obtained by the analyst to assess the validity of the classification as a guiding tool for accident causes classification;
(3)
Experiment 3: Professionals organized and applied the classification system to classify the accident analysis results of Group A in experiment 1, testing whether they achieved a high degree of coverage of the accident causes for the coal mine gas explosion accidents. This experiment verifies the content validity to evaluate the validity of the classification as an accident cause analysis tool.

3.3. Participants

To save labor costs, the participants in the three groups of experiments were reused, and the participants in each group of experiments were arranged as follows:
(1)
The analysts participating in experiment 1 were divided into two groups, A and B. Each group was composed of six graduate students majoring in safety science and engineering. The analysts received courses related to the 24Model;
(2)
The analysts participating in experiment 2 were divided into the expert group and the analyst group. Among them, the expert group was composed of the author and two experts in the field of coal mine accident analysis, who participated in the construction of the classification; the analyst group consisted of six analysts, all of whom were members of Group B of experiment 1;
(3)
The analysts who participated in experiment 3 were the three members of the expert group who also participated in experiment 2.
In summary, a total of 12 analysts and three experts participated in the three experiments to assess the performance of the classification system; the specific research background and demographic variables are shown in Table 1.

3.4. Accident Cases

A total of two groups of accident cases were used as the samples in the three groups of experiments, denoted as a and b. The accident cases were randomly selected from major coal mine gas explosion accidents in China from 2000 to 2016, and the source of the accident information was the official accident investigation report. Among them, the first and third experiments used the accident cases of Group I, and the number of accident cases was 14; experiment 2 used the accident cases in Group II, and the number of accident cases was six. Details of the 20 accident cases are shown in Table 2.
In addition, an instruction manual of the 24Model [18,19], details of the subcategory descriptions of the classification system (Section 3 of this paper), and the Coal Mine Safety Regulations (2018) were provided to the analysts as reference materials for accident analysis.

3.5. Indicator Calculation Method

3.5.1. Interobserver Reliability Calculation Method

Intraclass correlation coefficient (ICC), Kappa coefficient, and percentage concordance are commonly used statistical variables to evaluate interobserver reliability [51]. In the field of accident analysis, the number of accident analysis results obtained by different analysts may be inconsistent, and the intragroup correlation coefficient and Kappa consistency coefficient both regard the observation results of the observers as quantitative and disordered categorical variables, so they cannot be used. Therefore, percentage concordance was chosen as the statistical variable for evaluating the interobserver reliability of the accident analysis results, and the concordance index was used as the method for calculating interobserver reliability.
C-index was proposed by Harrell Jr. et al. [52], and it is mainly used to calculate the degree of discrimination between the predicted value and the true value of the COX model in survival analysis; corresponding to this article, the formula is stated as follows:
C-index = C C + D ,
where C is the number of reasons for consensus among the analysts, and D is the number of reasons for disagreement among the analysts. It can be seen from the formula that the value of C-index is [0,1]. According to a previously reported study [53], 0.7 is the smallest reasonable value for the consistency criterion.

3.5.2. Content Validity Calculation Method

As mentioned above, content validity is a measure of the coverage of the coal mine gas explosion accident causes. A classification with good content validity should strive to avoid overlapping and missing categories. Therefore, in an ideal outcome, the causes from the accident analysis should all be successfully classified using the classification system. This paper uses the ratio of the number of causes for successful categorization to the number of causes obtained by analysis as an indicator to characterize content validity, and calls it “causes coverage”, which is defined as follows:
p = m n ,
where:
  • n is the number of all accident causes obtained through an analysis;
  • m is the number of accident causes that can be classified into the classification;
  • p is located in the interval [0,1] and the closer it is to 1, the higher the causes coverage rate, indicating that the classification can cover all accident causes, and its content validity is higher.

3.5.3. Criterion Validity Calculation Method

The calculation method for criterion validity refers to a recent study. Hulme et al. [54] used a confusion matrix as an evaluation method to test the validity of the accident causation model. Our study was inspired by that of Hulme et al. and is based on the confusion matrix, using the indicators in machine learning to evaluate the performance of the classification and utilizing the accident analysis results obtained by expert analysis as the validity criterion to evaluate the validity of the classification system established previously. The details are presented in this section.
The confusion matrix is a standard format for representing the prediction results of a classifier, and it is represented in the form of a matrix with n rows and n columns (n represents the number of categories). The confusion matrix puts the predicted results of all categories and the real results into the same table by category. The table indicates the number of correct identifications and the number of misidentifications for each category. Table 3 is a confusion matrix for binary classifications, where n = 2; that is, there are only two categories: positive and negative. According to the combination of real results and model prediction results, it can be divided into True Positive (TP), True Negative (TN), False Positive (FP), and False Negative (FN). The meanings of the four combinations are:
TP: the result classified into the positive class is the same as the real result, and the classification is correct; TN: the result classified into the negative class is the same as the real result, and the classification is correct; FP: the result classified into the positive class is different from the real result, and the classification is wrong; FP: the result classified into the negative class is different from the real result, and the classification is wrong.
The indicators for evaluating the classification performance based on the confusion matrix are accuracy, precision, recall, and the F1-Score.
(1)
Accuracy refers to the ratio of correctly classified samples to the total number of samples. Accuracy is a statistic for all samples [55]. It is defined as:
Accuracy = TP + TN TP + FP + TN + FN = Number   of   correctly   classified Total   number   of   items   classified .
(2)
Precision indicates the ratio of the number of samples classified as positive by the user and correctly classified to the number of samples classified as positive by the user [55]. It is defined as:
Precision = TP TP + FP = Number   of   classified   as   positive   and   correctly   classified Number   of   classified   as   positive .
(3)
Recall refers to the proportion ratio of the number of correctly classified positive samples to the number of positive samples. It can be expressed as:
Recall = TP TP + FN = The   number   of   correctly   classified   positive   samples The   number   of   positive   samples .
(4)
F1-Score is the harmonic mean of precision and recall, taking into account the precision and recall of the classification [55], and is defined as:
F 1 = 2   ×   Precision   ×   Recall Precision + Recall .
The maximum and minimum values of the F1-Score are 1 and 0, respectively. The larger the value, the better the model’s performance. Numerous variant formulas of the F1-Score have been subsequently derived in order to deal with different task types, such as Macroaverage F1-score, Microaverage F1-score, weighted F1-score, and Matthews correlation coefficient (MCC). [56]
Because experiment 2 involves many categories and belongs to a multiclassification task, the accuracy and Macroaverage F1-score are selected as indicators to assess the validity. The calculation idea of the Macroaverage F1-score is to split the N classification problem into N binary classification problems and calculate the precision and recall of each category separately. After that, it is added and averaged to get Macroaverage Precision and Macroaverage Recall; then, in order to obtain the Macroaverage F1-score, the following formula is used [57]:
Macro   avg   F 1 - Score = 2   ×   Macro   avg   Precision   ×   Macro   avg   Recall Macro   avg   Precision + Macro   avg   Recall ,
where:
Macro   avg   Precision = Precision i L ,
Precision i = TP i TP i + FP i ,
Macro   avg   Recall = Recall i L ,
Recall i = TP i TP i + FN i ,
where L is the total number of labels (categories), and i is the ith label.
When calculating the index, the validity criterion is used as the standard classification result, and the classification results provided by other analysts are used as the classifier prediction result.
In summary, to test the consistency and validity of the classification, interobserver consistency, content validity, and criterion validity were used as evaluation indicators to evaluate the classification system. Among them, the C-index is used to calculate interobserver consistency, the causes coverage is used to test the content validity, and the Accuracy, Macroaverage Precision, Macroaverage Recall, and the Macroaverage F1-score are used to test the criterion validity.

3.6. Specific Process

3.6.1. Preanalytical Training

Two groups of analysts were first trained before the accident analysis. Different groups of analysts received different training contents. The Group A analysts mainly explained the format of the accident analysis results, the limitations in the accident analysis process, answering any questions; the Group B analysts primarily explained the definitions of the concepts of the classification system, the basis for dividing it into subcategories, examples of accident analysis, the format of the accident analysis results, and the limitations of the accident analysis process, while also answering any questions.

3.6.2. Accident Analysis

Subsequently, the three groups of personnel analyzed the cause of the accidents:
(1)
Expert group. The expert group only analyzed the six accident cases of sample B, and the accident analysis time was limited to 4 days, during which the accident analysis could be communicated at any time to correct the accident analysis results. Finally, a consensus was reached on each accident cause, which was used as the validity criterion to test the criterion validity of the classification in experiment 3;
(2)
Group A analysts. The Group A analysts only analyzed 14 accident cases in sample A, and the accident analysis time was limited to 10 days. During this period, the analysts could not communicate with each other about the accident analysis and could only use accident investigation reports as information sources. After the accident analysis was completed, the accident analysis results of each analyst were collected, and all participants were called through to a seminar to judge whether the accident analysis results obtained by the different analysts reached a consensus through discussion;
(3)
Group B analysts. The Group B analysts participated in experiment 1 and experiment 2 successively. The accident analysis time of experiment 1 was limited to 10 days, and that of experiment 2 was limited to 4 days. The two studies continued uninterrupted, but the material and incident analysis results were recovered and distributed into stages:
(1)
The relevant materials of experiment 1 were distributed at the beginning of the study;
(2)
On the 10th day, the accident analysis results of experiment 1 were recovered, and the relevant materials from experiment 2 were distributed;
(3)
On the 14th day, the accident classification results of experiment 2 were recovered.
During this period, the analysts could not communicate with each other on the accident analysis and could only use the accident investigation reports as a source of information. After the accident analysis was completed, the accident analysis results from each analyst were collected, all the analysts convened in the form of a seminar, and the accident analysis results obtained by the different analysts in Group B were evaluated to judge whether a consensus could be reached through discussions.

3.6.3. Summary and Calculation of Analysis Results

A total of two sets of data were obtained from experiment 1, which were the analysis results of the Group I accident cases by the two groups of analysts (A and B). in order to facilitate the calculation of the C-index, the accident causes of the two sets of data were deduplicated and coded respectively, and the accident analysis results were marked with the coding. Afterward, the interanalyst C-index was calculated pairwise for each accident. There were six analysts in each group, so 15 C-indexes were available for each accident in each group.
A total of two sets of data were obtained from experiment 2. The first set of data was the result of the expert group applying the classification system to analyze the accident causes from Group II of the accident cases. The data format was a two-tuple set consisting of accident investigation report paragraphs and accident cause categories; the second set of data was a two-tuple set consisting of accident investigation report paragraphs and accident cause categories (after the first group of data was classified by the first group of data using the classification).
In order to facilitate the calculation of the accuracy and Macroaverage F1-Score, the original paragraphs of the accident investigation report and the accident causes were coded in order to label the two sets of data. After that, the first set of data was used as the criterion, and the second set of data, along with the established criterion, were used to construct a confusion matrix in the unit for the analyst. There were six analysts in total, so a total of six confusion matrices were obtained. Criterion validity was tested using accuracy, Macroaverage Precision, Macroaverage Recall, and Macroaverage F1-Score.
Experiment 3 involved two sets of data. The first set of data contained the results of the analysts from Group A in experiment 1 after deduplication. The second set of data was the result of the secondary classification of the first set of data by the expert group using the classification system. During this period, the reasons and quantities that could not be classified (marked as ‘NONE’) were recorded and checked by two professionals. Causes coverage was calculated using the formula contained in Section 3.5.2.
In all the three experiments, Python was used as a tool for the indicator calculations.

3.7. Evaluation Result

3.7.1. Results of Experiment 1

The accident analysis results obtained by the two groups of analysts for experiment 1 were uploaded to the Mendeley Data database [58]. The calculation results for the C-index are shown in Figure 5 and Figure 6.
In the Group A samples, the average value of the C-index calculation results was 0.34, the highest value was 0.83, and the lowest value was as low as 0.00, which is far below the threshold of 0.7. It was found that the consistency of the accident analysis results from the Group A samples was at a low level, which further verifies the necessity of this study; in the Group B samples, except for accident case 3 (0.63) and accident case 8 (0.67), for which the average C-index scores were lower than the threshold of 0.7, the average C-index scores of the other accident cases were all higher than the threshold. The average C-index score was 0.78. Among them, the average C-index score of a single accident was 0.86 (the highest) and 0.63 (the lowest), and the C-index score of some analysts achieved excellent results, as high as 0.97. Comparing the C-index calculation results of the two groups, it can be seen that the interobserver reliability of the classification is high, which can significantly improve the consistency of the accident analysis results.

3.7.2. Results of Experiment 2

The coding table from the accident investigation report, the coding table from the accident causes, and the accident causes classification results have all been uploaded to the Mendeley database [58]. The Accuracy, Macro-average Precision, Macroaverage Recall, and Macroaverage F1-score of each confusion matrix in experiment 2 are shown in Figure 7. Due to the large size of the constructed confusion matrix (a total of 61 accident cause categories appears in the summary results, so each matrix size is 61 × 61), the total number is six, which is no longer listed to save the paper layout.
It can be seen from Figure 7 that the classification results of the six analysts achieved high scores for the four indicators. Among them, the accuracy rate scores of the six analysts are all above 0.9, and the average score is 0.94, indicating that the correct classification of all accident causes accounts for more than 90% of the total; the minimum value of the Macroaverage Precision rate is 0.85, the maximum value is 0.91, and the average value is 0.88, indicating that, for a specific reason, the probability of using the classification to classify a case correctly is 88% on average. The minimum value of the Macroaverage Recall rate is 0.86, the maximum value is 0.91, and the average value is 0.89, indicating that, for a specific cause, the probability of successfully finding the correct accident cause is 89% on average. Finally, the Macroaverage F1-score is the combined performance of the first two indicators, with a minimum value of 0.85, a maximum value of 0.90, and an average value of 0.88. The classification method proposed in this paper has as many as 140 categories, but from the perspective of the four indicators for evaluating classification accuracy, the settings between the categories can ensure that users maintain a low rate of missed judgments and misjudgements and shows good criterion validity.

3.7.3. Results of Experiment 3

A total of 1033 items were coded into the results of experiment 1. After the classification was applied, a total of 139 accident cause chains were obtained. The original accident analysis results and the secondary classification results using the classification system have been uploaded to the Mendeley Data database [58]. After the deduplication of the data obtained in experiment 1, the resulting total number of original accident causes is shown in Table 4. Taking the accident case as the unit, the lowest causes coverage rate is 89.36%, the highest is 98.00%, and the average causes coverage rate is 93.15%; that is, 93.15% of the accident causes found by the analyst in the accident investigation report can be successfully classified into the classification system. Currently, there is no criterion for evaluating the causes coverage of the classification. However, considering that there are nearly 920 accident causes included in experiment 3, while ensuring certain classification details, it is believed that the current causes coverage rate of the classification reached a relatively satisfactory level and has good content validity.

4. Conclusions

At present, the cause analysis of coal mine gas explosion accidents lacks detailed accident cause classification, which affects the comprehensiveness and accuracy of gas explosion accident prevention. In order to solve the above problems and ensure the safe exploitation of energy, we first analyzed the characteristics of the three-element classification of gas explosions and the 24Model, and clarified the process and basic structure of the fusion of the two classifications. Next, classification for the causes of the coal mine gas explosion accidents was constructed through accident analysis and cause generalization.
In order to evaluate the performance of the newly established classification and establish its consistency and validity, interobserver reliability, content validity, and criterion validity were used as the evaluation indicators. By organizing three experiments, the above indicators were calculated using the C-index, causation coverage and accuracy, Macroaverage Precision, Macroaverage Recall, and Macroaverage F1-score.
These three experimental results showed that the classification system exhibited good consistency and validity regarding the results. Some analysts without a coal mining background even obtained results that were comparable to those obtained by the professionals in terms of consistency and validity. In addition, the classification of the coal mine gas explosion accident causes could be displayed using the accident cause chain. The simplicity of the accident analysis results was maintained, whereas the readability was drastically improved. In the case of skilled classification, the approximate information of an accident can be inferred from the chain of the accident causes alone. The main findings of this study are as follows:
(1)
Based on the 24Model and the three-element classification for gas explosions, a classification system for coal mine gas explosion accident causes, including three categories and 138 subcategories, was constructed. This constructed classification system can effectively improve the consistency and comprehensiveness of the analysis results and can then obtain a more scientific accident prevention strategy;
(2)
The general construction process of accident cause classification was presented, including the determination standard of the basic structure of the classification system, the construction principles of the classification subclasses, and the construction method of the classification subclasses. Many of the above basic concepts can be transferred to other fields as well;
(3)
A general process for evaluating the performance of the classification was constructed using the two indicators: consistency and effectiveness, including the criteria for determining the evaluation indicators, the design of the evaluation process, the calculation method for the evaluation indicators, and the specific implementation process, which can provide a reference for evaluating other accident analysis methods.

Supplementary Materials

The following supporting information can be downloaded at: https://www.mdpi.com/article/10.3390/en15228443/s1. The construction process and subclasses of the taxonomy in Section 2 are presented as supplementary materials. References [59,60,61,62,63,64,65,66,67,68,69,70] are cited in the supplementary materials

Author Contributions

Conceptualization, Q.J.; methodology, Q.J.; validation, Q.J., G.F. and X.X.; writing—original draft preparation, Q.J.; writing—review and editing, X.X. and S.H.; data curation, S.H.; funding acquisition, G.F. All authors have read and agreed to the published version of the manuscript.

Funding

This research was funded by the National Natural Science Foundation of China (Grant No. 51534008), the National Natural Science Foundation of China (Grant No. 72204139), and the Curriculum Construction project of ‘Introduction to Safety Science and Engineering’ (No. J20ZD03).

Institutional Review Board Statement

Not applicable.

Informed Consent Statement

Not applicable.

Data Availability Statement

The data of the three experiments in this paper have been uploaded to Mendeley Data database at https://data.mendeley.com/datasets/pf65d6r7v6/1 (accessed on 31 August 2022) for peer reference.

Conflicts of Interest

The authors declare no conflict of interest.

References

  1. Yin, W.; Fu, G.; Yuan, S.; Dong, J. Study on Basic Characteristics and Occurrence Regularity of Major Gas Explosion Accidents in Chinese Coal Mines during 2001–2012. China Saf. Sci. J. 2013, 23, 141–147. [Google Scholar]
  2. Chen, H.; Qi, H.; Tan, H. Comparative Research on China Coal Mine Fatal Gas Explosion Accidents Rules. China Min. Magzine 2005, 14, 64–68. [Google Scholar]
  3. Zhang, J.; Xu, K.; Reniers, G.; You, G. Statistical analysis the characteristics of extraordinarily severe coal mine accidents (ESCMAs) in China from 1950 to 2018. Process Saf. Environ. Prot. 2020, 133, 332–340. [Google Scholar] [CrossRef]
  4. Administration, N.M.S. 2013–2020 China Coal Mine Accident Analysis Report; National Mine Safety Administration: Beijing, China, 2020.
  5. Li, W.; Zhang, L.; Liang, W. An Accident Causation Analysis and Taxonomy (ACAT) model of complex industrial system from both system safety and control theory perspectives. Saf. Sci. 2017, 92, 94–103. [Google Scholar] [CrossRef]
  6. Dechy, N.; Dien, Y.; Funnemark, E.; Roed-Larsen, S.; Stoop, J.; Valvisto, T.; Arellano, A.L.V. Results and lessons learned from the ESReDA’s accident investigation working group: Introducing article to “safety science” special issue on “Industrial events investigation”. Saf. Sci. 2012, 50, 1380–1391. [Google Scholar] [CrossRef] [Green Version]
  7. Benner, L., Jr. Accident data for the Semantic Web. Saf. Sci. 2012, 50, 1431–1437. [Google Scholar] [CrossRef] [Green Version]
  8. Yin, W. Study on Unsafe Act of Coal Mine Gas Explosion Accidents in China. Ph.D. Thesis, China University of Mining & Technology, Beijing, China, 2014. [Google Scholar]
  9. Zhang, J.; Cliff, D.; Xu, K.; You, G. Focusing on the patterns and characteristics of extraordinarily severe gas explosion accidents in Chinese coal mines. Process Saf. Environ. Prot. 2018, 117, 390–398. [Google Scholar] [CrossRef] [Green Version]
  10. Liu, Z.; Chu, X.; Lin, S.; Tian, J.; Li, X.; Gu, Z. Trends and correlation characteristics of coal mine gas explosion accident factors: A case study. Energy Sources Part A Recovery Util. Environ. Eff. 2022, 44, 1–15. [Google Scholar] [CrossRef]
  11. Tong, R.; Yang, Y.; Ma, X.; Zhang, Y.; Li, S.; Yang, H. Risk assessment of Miners’ unsafe behaviors: A case study of gas explosion accidents in coal mine, china. Int. J. Environ. Res. Public Health 2019, 16, 1765. [Google Scholar] [CrossRef] [Green Version]
  12. Wang, B.; Hua, X.; Hu, G. A Model for Public Health Emergency Risk Intelligence Work in the Big Data Environment. Inf. Sci. 2022, 39, 43. [Google Scholar]
  13. Wang, B.; Wu, C.; Sun, S. Discussion on Three Basic Issues of Safety—Related Information Oriented to Safety Management: Connotation, Properties, and Functions. J. Intell. 2019, 5, 22–28. [Google Scholar]
  14. Heinrich, H.W.; Stone, R.W. Industrial Accident Prevention; McGraw-Hill Book Company: New York, NY, USA, 1980. [Google Scholar]
  15. Bird, F.E.; Germain, G.L. Damage Control: A New Horizon in Accident Prevention and Cost Improvement; American Management Association: New York, NY, USA, 1966. [Google Scholar]
  16. Stewart, J.M. Managing for World Class Safety; John Wiley & Sons: Hoboken, NJ, USA, 2012. [Google Scholar]
  17. Reason, J. Human Error; Cambridge University Press: Cambridge, UK, 1990. [Google Scholar]
  18. Fu, G.; Chen, Y.; Xu, S.; Chen, P.; Yuan, C.; Wu, Y. Detailed Explanations of 24Model and Development of Its 6th Version. China Saf. Sci. J. 2022, 32, 12–19. [Google Scholar] [CrossRef]
  19. Fu, G.; Fan, Y.; Tong, R.; Gong, Y.; Cao, J. A Universal Method for the Causation Analysis of Accidents (Version 4.0). J. Accid. Prev. 2016, 2, 7–12. [Google Scholar]
  20. Fu, G.; Chen, P.; Zhao, Z.; Li, R. Safety is about doing the right thing. Process Saf. Prog. 2019, 38, e12044. [Google Scholar] [CrossRef]
  21. Fu, G.; Zhao, Z.; Hao, C.; Wu, Q. The accident path of coal mine gas explosion based on 24Model: A case study of the Ruizhiyuan gas explosion accident. Processes 2019, 7, 73. [Google Scholar] [CrossRef]
  22. Fu, G.; Yin, W.; Dong, J.; Fan, D.; Zhu, C.J. Behavior-based accident causation: The “2–4”model and its safety implications in coal mines. J. China Coal Soc. 2013, 38, 1123–1129. [Google Scholar]
  23. Leveson, N. Engineering a Safer World: Systems Thinking Applied to Safety; The MIT Press: Cambridge, MA, USA, 2012. [Google Scholar] [CrossRef]
  24. Rasmussen, J. Risk management in a dynamic society: A modelling problem. Saf. Sci. 1997, 27, 183–213. [Google Scholar] [CrossRef]
  25. Hollnagel, E. FRAM: The Functional Resonance Analysis Method: Modelling Complex Socio-Technical Systems; Ashgate Publishing: Farnham, UK, 2012. [Google Scholar]
  26. Raviv, G.; Fishbain, B.; Shapira, A. Analyzing risk factors in crane-related near-miss and accident reports. Saf. Sci. 2017, 91, 192–205. [Google Scholar] [CrossRef]
  27. Fu, G.; Cao, J.; Wang, X. Relationship Analysis of Causal Factors in Coal and Gas Outburst Accidents Based on the 24Model. Energy Procedia 2017, 107, 314–320. [Google Scholar] [CrossRef]
  28. Fu, G.; Suo, X.; Wang, C. Study on the systematic characteristics of 24Model. Syst. Eng. Theory Pract. 2018, 38, 263–272. [Google Scholar]
  29. Xue, Y.; Fu, G. A modified accident analysis and investigation model for the general aviation industry: Emphasizing on human and organizational factors. J. Saf. Res. 2018, 67, 1–15. [Google Scholar] [CrossRef]
  30. Li, J.; Qin, Y.; Wang, Z.; Xin, Y. How to analyse the injury based on 24Model: A case study of coal mine gas explosion injury. Inj. Prev. 2021, 27, 542–553. [Google Scholar] [CrossRef] [PubMed]
  31. Zhou, L. Safety Management System Failures of Chinese Hazardous Chemical Accidents Doctor. Ph.D. Thesis, China University of Mining and Technology (Beijing), Beijing, China, 2019. [Google Scholar]
  32. Lyu, Q. A Comparative Study on Accident Investigation Reports of Coal Mines in China and the United States Master. Master’s Thesis, China University of Mining and Technology (Beijing), Beijing, China, 2020. [Google Scholar]
  33. Jia, Q.; Fu, G.; Xie, X.; Hu, S.; Wu, Y.; Li, J. LPG leakage and explosion accident analysis based on a new SAA method. J. Loss Prev. Process Ind. 2021, 71, 104467. [Google Scholar] [CrossRef]
  34. Zhang, S. A Comparative Research on Theory and Application of STAMP and 24Model. Master’s Thesis, China University of Mining and Technology (Beijing), Beijing, China, 2020. [Google Scholar]
  35. Miao, Y. Analysis on Unsafe Acts of Gas Coal Mines Gas Explosion Accidents in China. Ph.D. Thesis, China University of Mining and Technology (Beijing), Beijing, China, 2016. [Google Scholar]
  36. Suo, X. Causation Analysis Method and Application Research of Gas Explosion Accidents in Coal Mines. Ph.D. Thesis, China University of Mining and Technology (Beijing), Beijing, China, 2018. [Google Scholar]
  37. Wu, Y.; Fu, G.; Han, M.; Jia, Q.; Lyu, Q.; Wang, Y.; Wu, Z. Comparison of the theoretical elements and application characteristics of STAMP, FRAM, and 24Model: A major hazardous chemical explosion accident. J. Loss Prev. Process Ind. 2022, 80, 104880. [Google Scholar] [CrossRef]
  38. Zhang, G. Ventilation and Safety; China University of Mining and Technology Press: Xuzhou, China, 2007. [Google Scholar]
  39. Chen, M.; Wang, J. Progress in Prevention and Cure Technoogy of Colliery Gas Calamity. Coal Technol. 2009, 28, 1–3. [Google Scholar]
  40. Stanton, N.A.; Young, M.S. Giving ergonomics away? The application of ergonomics methods by novices. Appl. Ergon. 2003, 34, 479–490. [Google Scholar] [CrossRef] [Green Version]
  41. Igene, O.O.; Johnson, C. Analysis of medication dosing error related to Computerised Provider Order Entry system: A comparison of ECF, HFACS, STAMP and AcciMap approaches. Health Inform. J. 2020, 26, 1017–1042. [Google Scholar] [CrossRef]
  42. Jacinto, M.C.R. A Structured Method for the Investigation and Analysis of Occupational Accidents. Ph.D. Thesis, University of Birmingham, Birmingham, UK, 2003. [Google Scholar]
  43. Katsakiori, P.; Sakellaropoulos, G.; Manatakis, E. Towards an evaluation of accident investigation methods in terms of their alignment with accident causation models. Saf. Sci. 2009, 47, 1007–1015. [Google Scholar] [CrossRef]
  44. Underwood, P.; Waterson, P.; Braithwaite, G. ‘Accident investigation in the wild’–A small-scale, field-based evaluation of the STAMP method for accident analysis. Saf. Sci. 2016, 82, 129–143. [Google Scholar] [CrossRef]
  45. Cohen, T.; Wiegmann, D.; Shappell, S. Evaluating the Reliability of the Human Factors Analysis and Classification System. Aerosp. Med. Hum. Perform. 2015, 86, 728–735. [Google Scholar] [CrossRef]
  46. Goncalves Filho, A.P.; Jun, G.T.; Waterson, P. Four studies, two methods, one accident—An examination of the reliability and validity of Accimap and STAMP for accident analysis. Saf. Sci. 2019, 113, 310–317. [Google Scholar] [CrossRef]
  47. Pounds, J.; Isaac, A. Validation of the JANUS Technique: Causal Factors of Human Error in Operational Errors; Federal Aviation Administration Oklahoma City Ok Civil Aeromedical Inst.: Oklahoma City, OK, USA, 2003; p. 12. [Google Scholar]
  48. Jia, Q.; Fu, G.; Xie, X.; Hu, S.; Wang, Y.; Lyu, Q. Study on the reliability of accident analysis results: Taking two groups of four accident analysis references with the 24Model as samples. Proc. Inst. Mech. Eng. Part O-J. Risk Reliab. 2022. [Google Scholar] [CrossRef]
  49. Kantowitz, B.H.; Roediger, H.L., III; Elmes, D.G. Experimental Psychology; Cengage Learning: Boston, MA, USA, 2014. [Google Scholar]
  50. Zhu, P. How to Analyze the Content Validity of Psychological Tests. Prim. Second. Sch. Abroad 2004, 11, 32–34. [Google Scholar]
  51. Lampe, K.G.; Mulder, E.A.; Colins, O.F.; Vermeiren, R.R. The inter-rater reliability of observing aggression: A systematic literature review. Aggress. Violent Behav. 2017, 37, 12–25. [Google Scholar] [CrossRef]
  52. Harrell, F.E., Jr.; Lee, K.L.; Mark, D.B. Multivariable prognostic models: Issues in developing models, evaluating assumptions and adequacy, and measuring and reducing errors. Stat. Med. 1996, 15, 361–387. [Google Scholar] [CrossRef]
  53. Wallace, B.; Ross, A. Beyond Human Error: Taxonomies and Safety Science; CRC Press: Boca Raton, FL, USA, 2016. [Google Scholar]
  54. Hulme, A.; Stanton, N.A.; Walker, G.H.; Waterson, P.; Salmon, P.M. Are accident analysis methods fit for purpose? Testing the criterion-referenced concurrent validity of AcciMap, STAMP-CAST and AcciNet. Saf. Sci. 2021, 144, 105454. [Google Scholar] [CrossRef]
  55. He, H.; Choi, J.D. The stem cell hypothesis: Dilemma behind multi-task learning with transformer encoders. arXiv 2021, arXiv:2109.06939. [Google Scholar]
  56. Derczynski, L. Complementarity, F-score, and NLP Evaluation. In Proceedings of the Tenth International Conference on Language Resources and Evaluation (LREC’16), Portorož, Slovenia, 23–28 May 2016; pp. 261–266. [Google Scholar]
  57. Opitz, J.; Burst, S. Macro F1 and Macro F1. arXiv 2019, arXiv:1911.03347. [Google Scholar]
  58. Jia, Q. Three Sets of Experimental Data to Evaluate Taxonomy Performance, V1 ed.; Mendeley Data: Amsterdam, The Netherlands, 2022. [Google Scholar] [CrossRef]
  59. Zhou, Z. Machine Learning; Tsinghua University Press: Beijing, China, 2016. [Google Scholar]
  60. Wang, X. Study on the Relationship between Gas Explosion Accident Causations and Equipment or Facilities. Master’s Thesis, China University of Mining and Technology (Beijing), Beijing, China, 2017. [Google Scholar]
  61. Wang, X.; Fu, G.; Zhu, K.; Yin, W.; Liu, X.; Shao, P.; Li, Z. Causes Analysis of Gas Explosion Accident from Perspective of Equipment and Facilities Classification. Saf. Coal Mines 2015, 46, 241–244. [Google Scholar]
  62. Popescu, F.D.; Radu, S.M.; Andraș, A.; Brînaș, I.; Budilică, D.I.; Popescu, V. Comparative Analysis of Mine Shaft Hoisting Systems’ Brake Temperature Using Finite Element Analysis (FEA). Materials 2022, 15, 3363. [Google Scholar] [CrossRef]
  63. Zhang, Z. Study on the Synergic Management System and Methods of Under-Well Project in Coal Mine Based on Interface. Ph.D. Thesis, China University of Mining and Technology (Beijing), Beijing, China, 2014. [Google Scholar]
  64. Zhang, Z.; Gao, J.; Zhang, R.; He, J. Cognitions of the regional distribution of coal bed gas in china. Geol. Sci. Technol. Inf. 1999, 18, 67–70. [Google Scholar]
  65. Deng, J.; Xu, J.; Chen, X. Perspectives on spontaneous combustion mechanism and prediction theory of coal. J. Liaoning Tech. Univ. 2003, 22, 455–459. [Google Scholar]
  66. Fu, G. Safety Management; Science Press: Beijing, China, 2013. [Google Scholar]
  67. Fu, G.; Xie, X.; Jia, Q.; Li, Z.; Chen, P.; Ge, Y. The development history of accident causation models in the past 100 years: 24Model, a more modern accident causation model. Process Saf. Environ. Prot. 2020, 134, 47–82. [Google Scholar] [CrossRef]
  68. Ge, J.; Zhang, Y.; Chen, S.; Xu, K.; Yao, X.; Li, J.; Liu, B.; Yan, F.; Wu, C.; Li, S. Accident causation models developed in China between 1978 and 2018: Review and comparison. Saf. Sci. 2022, 148, 105653. [Google Scholar] [CrossRef]
  69. Zhao, J. Brief Discussion on Main Geological Factors Affecting Coal Seam Gas Occurrence. Coal Mine Mod. 2011, 4, 29–31. [Google Scholar]
  70. Tian, G. Experimental study on control effect of ground stress on damage of coal seam mining floor. China Energy Environ. Prot. 2022. [Google Scholar] [CrossRef]
Figure 1. Distribution of coal mine accident frequency and deaths in China from 2013 to 2020.
Energies 15 08443 g001
Figure 2. (a) Sixth edition of the 24Model (static); (b) sixth edition of 24Model (dynamic).
Energies 15 08443 g002
Figure 3. (a) Fusion interface between the 24Model and the three-element classification of gas explosions; (b) basic structure of the composite classification.
Energies 15 08443 g003
Figure 4. Summary of subcategories for the classification of coal mine gas explosion accident causes.
Energies 15 08443 g004
Figure 5. Data distribution of C-index calculation results among Group A. ‘×’ in the figure represents the average value.
Energies 15 08443 g005
Figure 6. Data distribution of C-index calculation results among Group B. ‘×’ in the figure represents the average value.
Energies 15 08443 g006
Figure 7. Data distribution of the settlement results of the four indicators for criterion validity. ‘×’ in the figure represents the average value.
Energies 15 08443 g007
Table 1. Analysis of specific information.
GroupAnalyst IDGenderAgeEducationProficiency of 24ModelResearch Background
Group AAnalyst A1Male24DoctorProficientAccident analysis
Analyst B1Female25MasterGeneralCoal spontaneous combustion
Analyst C1Male26DoctorProficientGas explosion
Accident analysis
Analyst D1Female27DoctorProficientProcess chemical accident
Accident analysis
Analyst E1Female25MasterProficientAccident analysis
Analyst F1Female24MasterGeneralSafety disciplines system
Group BAnalyst A2Female25MasterGeneralSafety culture
Analyst B2Female25MasterGeneralSafety culture
Analyst C2Male30DoctorProficientCoal mine accident
Accident analysis
Analyst D2Male27DoctorGeneralCoal spontaneous combustion
Analyst E2Female25MasterProficientAccident analysis
Energy Model
Analyst F2Male32DoctorGeneralCoal spontaneous combustion
Expert GroupExpert AMale33DoctorProficientCoal mine accident
Accident analysis
Accident causation theory
Expert BFemale33DoctorProficientCoal mine accident
Accident analysis
Accident causation theory
The proficiency of the 24Model is divided into skilled and general. ‘Proficient’ means that the number of accidents analyzed by the 24Model exceeds 20; ‘General’ means that the number of accidents analyzed by the 24Model is greater than 10 but less than or equal to 20.
Table 2. Accident case information.
NumberName of Accident CaseAccident Time
1Hunan Province “3.29” Gas Explosion Accident2001
2Inner Mongolia “5.8” Gas Explosion Accident2001
3Heilongjiang Province “1.20” Gas Explosion Accident2003
4Shanxi Province “4.30” Gas Explosion Accident2004
5Liaoning Province “2.14” Gas Explosion Accident2005
6Xinjiang “10.4” Gas Explosion Accident2005
7Shanxi Province “2.1” Gas Explosion Accident2006
8Gansu Province “10.31” Gas Explosion Accident2006
9Liaoning Province “8.18” Gas Explosion Accident2008
10Heilongjiang Province “11.21” Gas Explosion Accident2009
11Jilin Province “3.29” Gas Explosion Accident2013
12Xinjiang “7.5” Gas Explosion Accident2014
13Chongqing “10.31” Gas Explosion Accident2016
14Inner Mongolia “12.3” Gas Explosion Accident2016
15Chongqing “6.26” Gas Explosion Accident2000
16Henan Province “11.19” Gas Explosion Accident2000
17Yunnan Province “5.14” Gas Explosion Accident2001
18Heilongjiang Province “2.5” Gas Explosion Accident2001
19Guizhou Province “2.24” Gas Explosion Accident2003
20Shaanxi Province “4.29” Gas Explosion Accident2006
Table 3. Example of a dichotomous confusion matrix.
Confusion MatrixPredicted as PositivePredicted as Negative
The category is positiveTrue Positive, TPFalse Negative, FN
The category is negativeFalse Positive, FPTrue Negative, TN
Table 4. Accident cause quantity statistics and causes coverage calculation results (based on accident cases).
Accident NumberIndividual Act
(De-Duplication)
Management SystemTotal Number of Accident CausesNumber of Causes UncategorizedCauses Coverage
Case 1203353394.34%
Case 2203757689.47%
Case 3133346589.13%
Case 4324880396.25%
Case 5264975297.33%
Case 6315586396.51%
Case 7123547589.36%
Case 8173350198.00%
Case 9275885594.12%
Case 10163349393.88%
Case 11224062395.16%
Case 123065951089.47%
Case 13335386989.53%
Case 14242549589.80%
Total3235979206393.15%
Publisher’s Note: MDPI stays neutral with regard to jurisdictional claims in published maps and institutional affiliations.

