Article

An Economical Boil-Off Gas Management System for LNG Refueling Stations: Evaluation Using Scenario Analysis

1
Korea National Oil Corporation, 305, Jongga-ro, Jung-gu, Ulsan 44538, Republic of Korea
2
Graduate School of Energy Science and Technology, Chungnam National University, 99 Daehak-ro, Yuseong-gu, Daejeon 34134, Republic of Korea
*
Author to whom correspondence should be addressed.
Energies 2022, 15(22), 8526; https://doi.org/10.3390/en15228526
Submission received: 7 September 2022 / Revised: 20 October 2022 / Accepted: 31 October 2022 / Published: 15 November 2022

Abstract

:
The use of liquefied natural gas (LNG) in the transportation sector is increasing, and boil-off gas (BOG) management systems are considered viable options to increase economic efficiency and reduce greenhouse gas emissions at LNG refueling stations. The present study proposed an economically optimized method by investigating four refueling station scenarios, including different BOG management systems. Among the four scenarios, the scenario in which compressed natural gas was produced from BOG had the lowest minimum selling price (MSP) and was the most economical. Sensitivity and uncertainty analyses were conducted for the economically optimal scenario, which identified the factors with the most influential impact and their uncertainties on the MSP. Finally, to determine the feasibility of the business through profitability analysis, the net present value, discounted payback period, and present value ratio due to changes in the discount rate were presented, and the discounted cash flow rate of return was found to be 13.22%. As a result of this study, a BOG management system can contribute to improving the economic feasibility for LNG refueling stations by reliquefying BOG and re-selling it (the most efficient way is scenario 4) and will provide an economical guide for countries with much demand for LNG in the transport sector.

1. Introduction

Climate change is one of the most pressing issues of the 21st century [1]. However, energy generation systems still highly depend on fossil fuels [2]. Consequently, greenhouse gas (GHG) emissions are steadily increasing every year from various sectors, such as power generation, industry, transportation, and commerce [3]. For example, emissions of GHGs from medium and large trucks in the United States increased by 90% between 1990 and 2019, reaching 444.4 Mt. CO2-eq [4]. Immediate and important changes are required in each area to mitigate global climate change and limit global warming to 1.5 °C in 2050 [5].
Replacing fossil fuels with low-carbon fuels such as natural gas can reduce GHGs and mitigate global climate change [6]. Natural gas power systems are more sustainable than coal and petroleum power systems owing to their low carbon emissions and small footprint [7]. Therefore, the use of natural gas has increased over the past decades [8]. Although carbon-free energy, such as renewable energy, is required to meet the net-zero goal of 2050 in the long term, the demand for natural gas with lower GHG emissions would increase in the short term [9] Liquefied natural gas (LNG) is a condensed form of natural gas with 60% of the volumetric energy density of diesel [10]. Compared with ultra-low sulfur diesel, when LNG is combusted, CO2, NOx, and particulate matter emissions can be reduced by up to 20%, 90%, and 100%, respectively [11]. Owing to these advantages, LNG has attracted specific attention as a potential fuel to reduce GHG emissions in large transportation sectors, such as heavy-duty trucks [12], trains [13] and ships [14]. LNG is stored at a low temperature of −162 °C, and it is continuously evaporated owing to loss of cold energy, generating BOG. Therefore, appropriate strategies must be established for managing excessive BOG generation to save energy and reduce greenhouse gas emissions [15].
China has the largest number of LNG refueling stations worldwide, which increased from 100 in 2010 to 3200 in 2015 [16] (China Gas, 2016). This accounted for 94% of the world’s LNG use in 2015 [17]. The number of LNG refueling stations in Europe has increased by 60% from 250 in 2019 to 400 in 2020, and is expected to increase to 2000 by 2030 [18]. In addition, 70 LNG refueling stations were operating in the United States in 2020 [19]. Recently, the number of hydrogen refueling stations have been growing; however, they are still small compared to LNG refueling stations. In 2021, there were 685 hydrogen refueling stations in the world. Specifically, 86% are concentrated in Germany and Asia (Japan, Korea, China), and 591 hydrogen charging stations are in operation in those countries [20]. LNG usage in the transportation sector is increasing and will continue in the next decade, and a BOG management system for refueling stations and vehicles should be implemented to obtain the short- and long-term benefits of transitioning from conventional petroleum fuel to LNG [17].
Through following surveys, we found that the BOG release rate (BOR) of the LNG refueling stations varied from 0.3 to 5.3 vol%. According to Burnham et al. [21], the average BOR of LNG refueling stations was approximately 0.32 vol% per delivery of LNG. Powars [22] reported that the average BOR from stations was approximately 1 vol% per delivery of unsaturated LNG. According to a survey of 2400 LNG charging stations in China, the BOR exceeds 5% at more than 1600 gas stations, and in some cases, 10%, owing to inadequate insulation [23]. Another study measured the BOR at two LNG refueling stations in the United States and found them to be 0.1–1.5% and 0.9–5.3% [24]. This shows that the requirement for a BOG management system should be appropriately reviewed because of the increase in GHG emissions originating from the BOG and the economic loss of refueling stations.
An analysis of various design technologies of LNG refueling stations among the patents currently issued revealed that 56% of the refueling station designs had BOG management systems and 44% had no BOG management system. Among them, 28% of the refueling station designs had BOG management systems that compressed the BOG to produce compressed natural gas (CNG), and 28% of the total patents of refueling station include the liquefier or LN2 condenser that uses the low liquefaction point of LN2 to liquefy the BOG. [17]. The research on LNG refueling stations has focused on BOG management technology and explosion safety. In particular, a lot of research has focused safety, such as the evaluation on the characteristics of flash fire from an accidental release of LNG [25], modeling of the gas explosion process to predict the extent of the damage [26] and reasonable safety zone setting according to the gas leakage rate [27]; however, the economic aspect has not been studied systematically [22,24,28,29]. Therefore, we designed four scenarios for representative LNG refueling stations with BOG management systems and found through techno-evaluation which one is the most economically feasible. In addition, a wide range of techno-economic analyses were conducted to investigate the effect of key parameters on economic feasibility.

2. Materials and Methods

2.1. LNG Storage Tank Design

The LNG storage tank model was based on the data obtained from the literature, as listed in Table 1. Based on this, we predicted the amount of BOG generated. LNG storage tanks at refueling stations usually have a capacity of 22.7 to 113.5 m3 [22]. For unsaturated LNG, the storage tank of the LNG refueling station should be filled to 80% of the maximum tank volume, and for saturated LNG, more than 90% should not be filled [22].
Figure 1 shows the double-wall LNG storage tank model with a net capacity of 57.2 m3 [30]. In this study, 80% of the net volume of the LNG tank was assumed to be filled, and the pressure and temperature of LNG in the tank increased owing to heat transfer from the external environment, resulting in BOG. In addition, the BOG was released into the atmosphere after reaching the maximum allowable working pressure. The time when the LNG was not refueled in the vehicle, that is, the time when there was no flow into or out of the storage tank, was defined as the “BOG release time” of the tank.
The heat transfer rate Q = 430 W to the tank and the heat transfer coefficient of the storage tank can be obtained through Equations (1) and (2). UAtank and Uinsulation are the overall heat transfer coefficient and thermal conductance of the storage tank that calculated based on base on LNG at −162 °C, and 101.325 kPa [22].
U A t a n k = Q T a m b i e n t T L N G = 430   W 25 162 = 2.3   W / K
U i n s u l a t i o n = U A t a n k A t a n k = 2.3   W / K 104.35   m 2 = 0.022   W m 2 K  
Therefore, the average daily BOR can be obtained using Equations (3) and (4). In Equation (3), BORi, Qi, andti are the BOG generation, the heat leak rate for the LNG storage tank, and time step, respectively. VLNG is the net volume of the storage tank. ρLNG and hfg are LNG density and heat of evaporation at the given temperature and pressure.
B O R i % = Q i × Δ t i ρ L N G × V L N G × h f g × 100  
B O R % / d a y = i = o i = t B O G   r e l e a s e   t i m e B O G i % t B O G   r e l e a s e   t i m e × 24 × 3600  
In this study, the operating conditions of the refueling station were as follows. We assumed that LNG vehicles refuel 0.45 m3 [32] at a time, and that 50 vehicles refuel daily. The refueling station was started at 8 a.m. every day, and it had a fuel delivery rate of 0.09 m3/min, which required 5 min per vehicle. The fuel-supply interval for each vehicle was 10 min. For example, when refueling four vehicles, they required 20 min to charge and 30 min to refuel. Therefore, a total of 50 min was required per vehicle. Figure 2 shows the amount of BOG released during the day at an operating refueling station.

2.2. Scenario Development

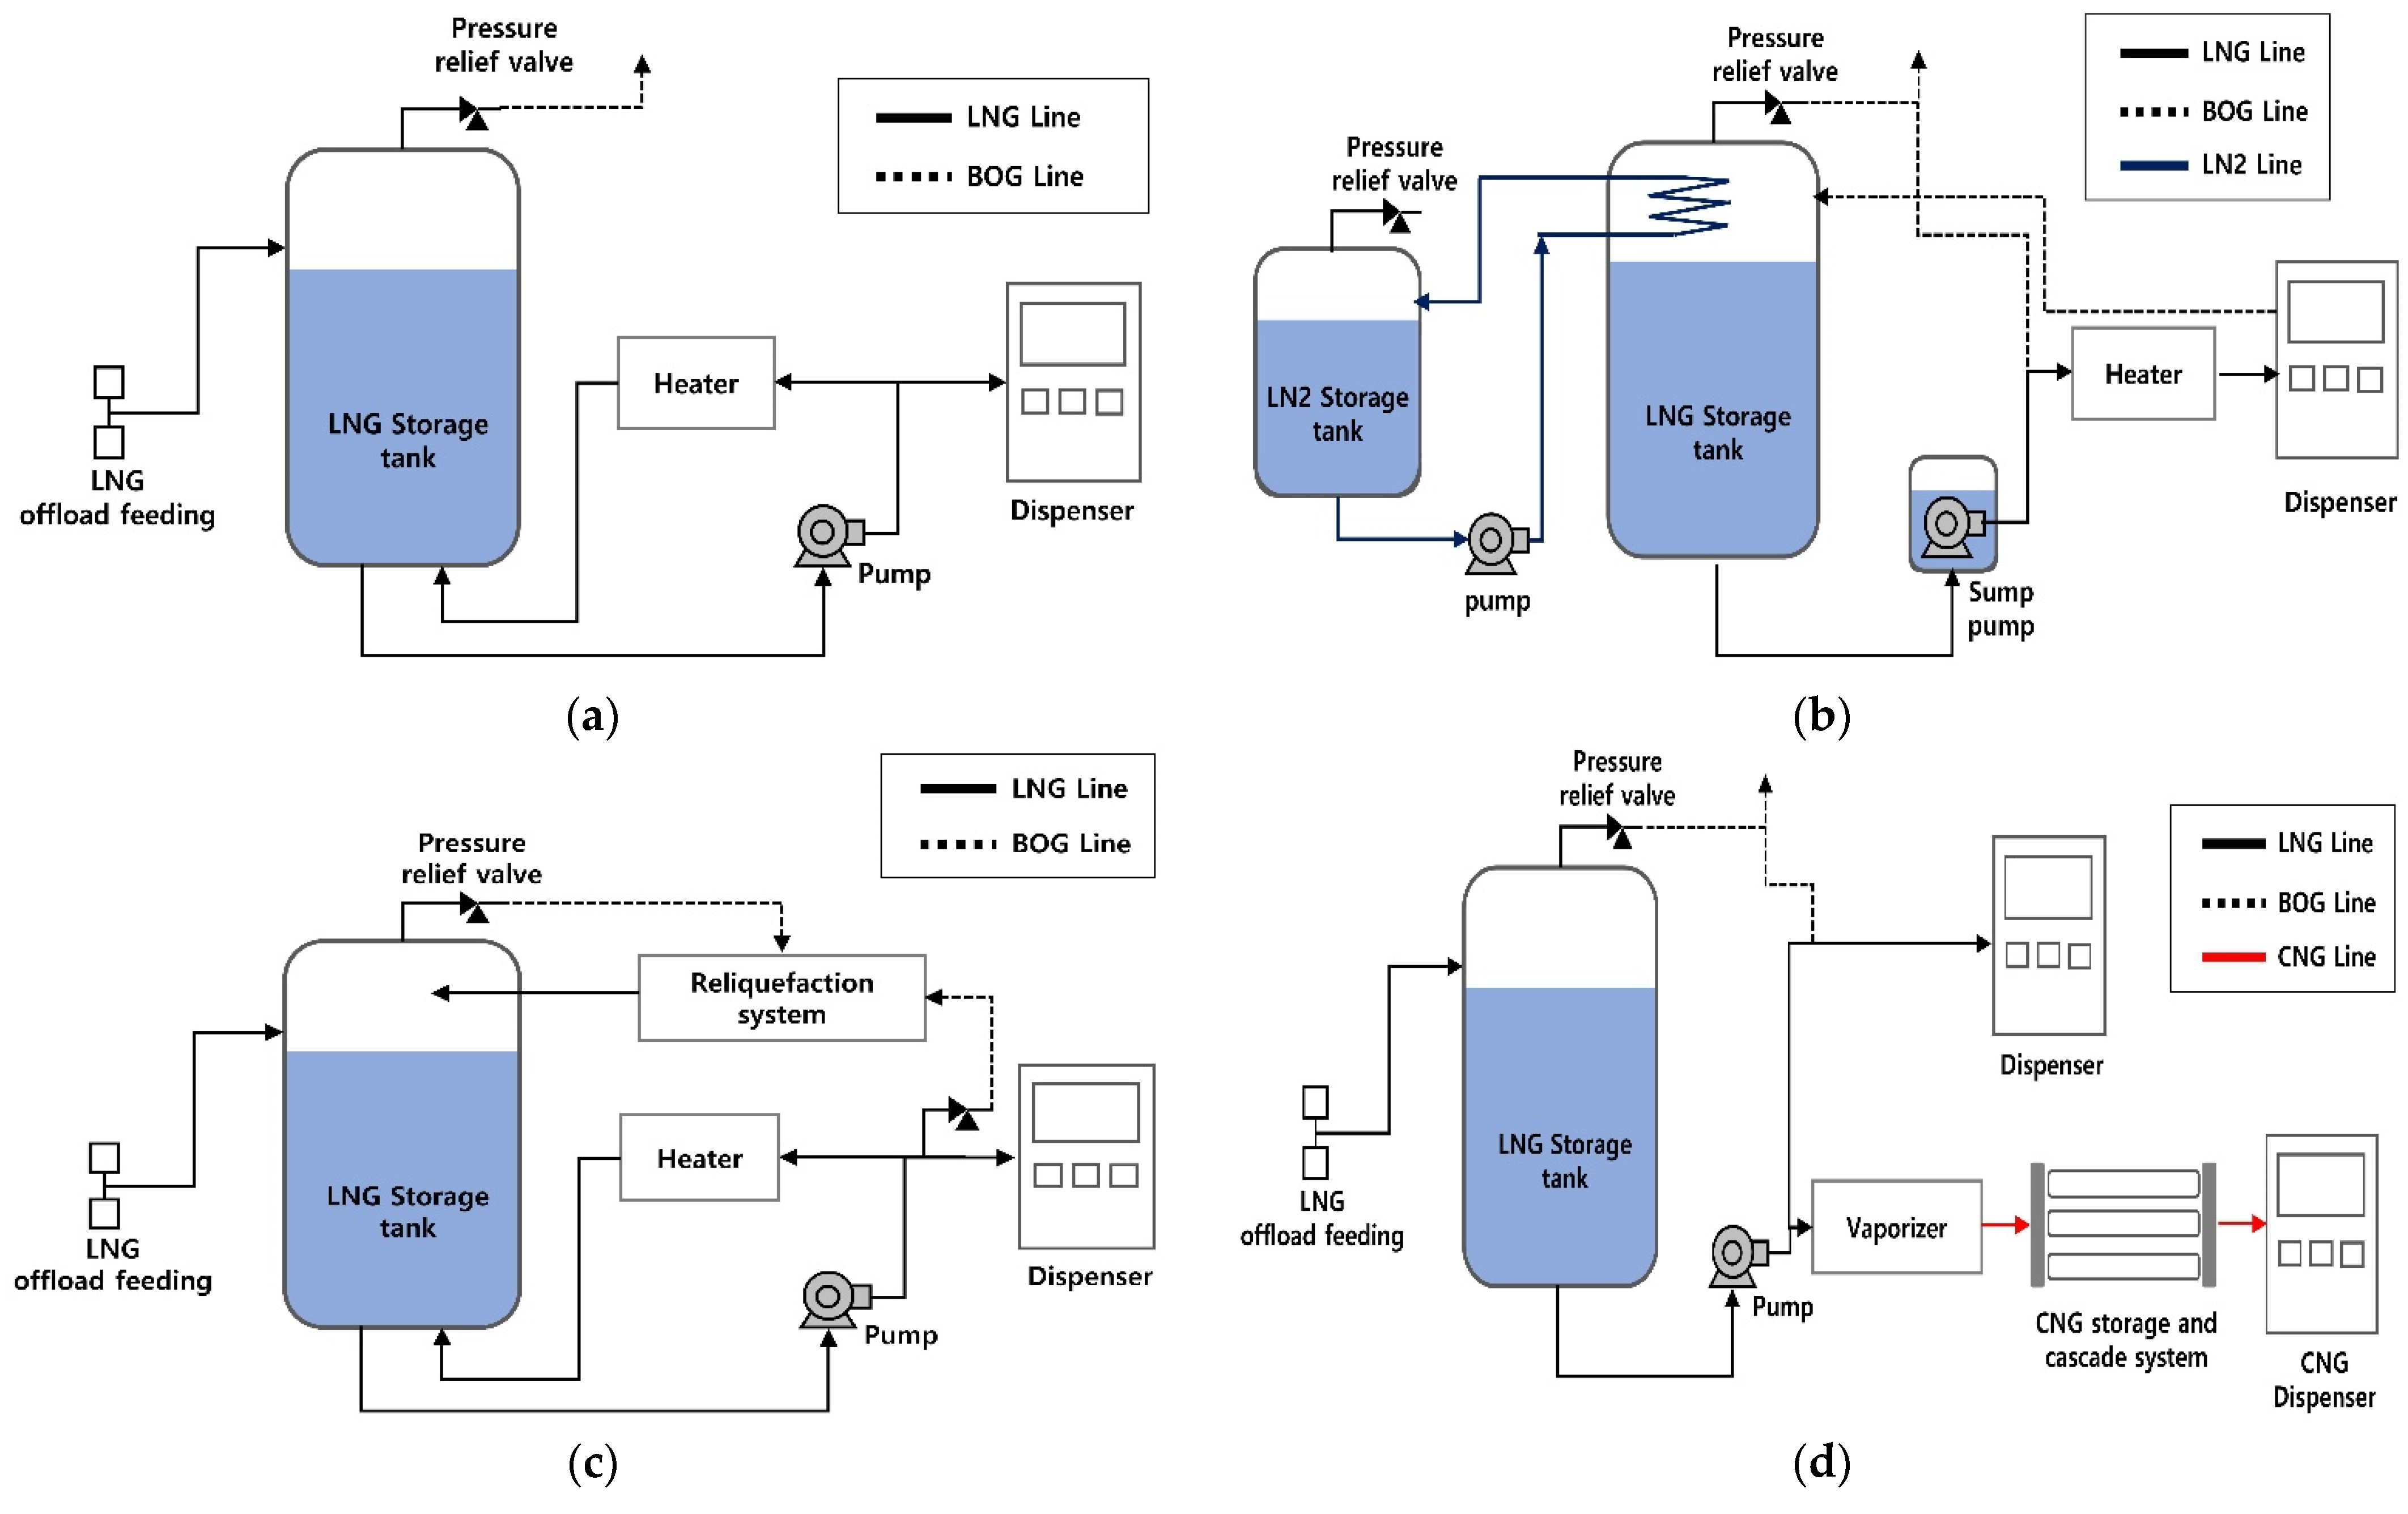
We developed four scenarios to investigate the effect of the BOG management system on the economic feasibility of LNG refueling stations. Table 2 and Figure 3 show the equipment component, characteristic, and schematic for each of the four scenarios. We considered several factors (carbon tax, BOG reliquefaction cost, and re-sales) depending on the type and presence of the BOG management system.
Scenario 1 (Sc1) is a basic LNG refueling station consisting of a storage tank, pump, and dispenser without a BOG management system (Figure 3a) [33]. The generated BOG is released into the atmosphere. Because this caused environmental and economic losses, LNG refueling stations that combined BOG management systems, such as Sc2 to 4, were considered. Scenario 2 (Sc2) re-liquefied BOG using a low temperature of liquefied nitrogen (LN2; −192 °C) and released vaporized nitrogen into the atmosphere (Figure 3b) [34]. In this case, continuous consumption of liquefied nitrogen occurs, and 1.92 kg-LN2 is required to re-liquefy 1 kg of BOG [29]. In Scenario 3 (Sc3), the microliquefaction system is a package-type equipment that liquefies BOG using electricity, and 0.7 kWh/kg-BOG [35] of energy is consumed (Figure 3c). Scenario 4 (Sc4) is a BOG management system in which the BOG (10 bar) is compressed to a high pressure (250 bar) in the storage tank and supplied to a CNG vehicle (Figure 3d) [36]. In this case, the energy used in the compressor is calculated by applying Equation (5) for the ideal condition of the required power using the specific work of the compressor unit (LC is specific work (kJ/kg) of the compressor unit):
L c = k k 1 × R L N G × T i n × P o u t k 1 k P i n 1  
where k (1.4) is the ratio of the specific heats (cp and cv), RLNG is the BOG (natural gas) constant (0.518 kJ/kg K), Tin (K) is the BOG inlet temperature (−100 °C), and Pin and Pout are the inlet (10 bar) and outlet (250 bar) pressures, respectively. The calculated specific work was 0.473 kJ/g. The required electric power is calculated using this value by assuming that the isentropic efficiency (ηis), mechanical efficiency (ηm), and electric generator efficiency (ηe) are 80%, 98%, and 96%, respectively [37]. Consequently, the power required for the compressor ( P c o m p r e s s o r ) of Sc4 was calculated to be 0.629 kWh/kg-BOG.
P c o m p r e s s o r = m L N G × L c η i s × η m × η e  

2.3. Process Economic Evaluation

First, the total capital investment (TCI) and operating costs were determined. Second, using these costs, a discounted cash flow analysis was conducted, and the minimum selling price (MSP) was determined based on the net present value (NPV) of zero, assuming an internal rate of return (IRR).
Table 3 presents the economic parameters and cost assumptions used in this study. The equipment costs were obtained by referring to the Blue Corridors report (Flavio, 2016) and previous research data [29], and for economic assumption, we referred to the National Renewable Energy Laboratory (NREL) report [38]. In addition, raw material and utility costs were assumed to be the base of 2022 [39,40].
The sum of fixed capital investment, working capital, and land is defined as the TCI. Fixed capital investment consists of total direct costs (TDC: equipment costs, warehouse, additional piping, and site development) and total indirect costs (TIC: prorateable expenses, field expenses, home office and construction fees, and project contingency) [41]. The total operating cost is calculated as the sum of variable operating costs, including raw materials and utility costs, and fixed operating costs, such as labor, maintenance, and property insurance costs [38]. Labor costs were adjusted for each scenario based on the Blue Corridors report [42], whereas other overhead costs (maintenance and property insurance) were calculated based on capital costs.

2.4. Sensitivity, Uncertainty, and Profitability Analyses

In this study, we conducted a sensitivity analysis (SA) to identify the single parameter that has the greatest impact on MSP. A total of seven parameters, including LNG purchase cost, IRR, capital investment, and BOG selling cost, were investigated. The remaining parameters were kept constant, with a maximum change of ±20% in each parameter, and the effect on MSP was studied.
The effect of a single parameter can be identified by SA, but the overall effect on uncertainty cannot be confirmed. Therefore, an uncertainty analysis (UA) was performed to quantify the risk and uncertainty within the proposed range using the Monte Carlo simulation method. Three key parameters (LNG purchase cost, IRR, and capital investment) were identified in the SA [45]. We assumed that the selected variables had a distribution within an identical range. The IRR was fixed at 10%, and LNG purchase prices and investment costs were changed to ±5%, ±10%, ±15%, ±20%, and ±25%, respectively. In addition, the IRR was changed from 5% to 20%, while the two parameters were changed to ±20%.
Finally, to perform an economic evaluation (profitability analysis) of Sc4, a cumulative cash flow diagram was prepared to identify the correlation between capital investment and profit.

3. Results and Discussion

3.1. Capital and Operating Costs

Table 4 lists the total costs for the four scenarios. Among all the scenarios, Sc1 had the lowest TCI at USD 694,452 and the highest operating cost at USD 3,299,576/y. This was because a BOG management system was not installed, and thus, the operating cost increased to account for carbon tax and LNG loss owing to BOG release into the atmosphere. If the BOG management system was installed, it increased additional capital and operating costs for using reliquefaction or compression, but the overall operating costs were reduced because the business did not have to pay carbon taxes. Therefore, compared to Sc1, Sc2 increased the TIC by 16.4% and reduced the total operating cost by 9.1%. The TIC of Sc3 and Sc4 were 89.4% and 79.1% higher and the total operating costs 9.9% and 10.0% lower than Sc1. In addition, the reason the total operating cost was lower in Sc3 than in Sc2 is that even though the BOG liquefaction process using electricity is more expensive, it is more efficient than the method using liquid nitrogen.
In the four scenarios, the BOG management system accounted for 14%, 47%, and 44% of TIC in Sc2, Sc3, and Sc4. In Sc2, the storage tanks, heat exchangers, and pumps for liquid nitrogen were added, and in Sc3, the BOG reliquefaction system accounted for most of the increase in TIC. In Sc4, a compressor, storage tank, and dispenser for the CNG were added. LNG purchase costs accounted for 86.0%, 87.1%, 95.4%, and 95.5% of the total operating costs in Sc1, Sc2, Sc3, and Sc4. If the cost of processing BOG is lower, the LNG purchase costs is higher and it increases with the total operating cost.
Among the four scenarios, Sc3 and Sc4 were economically advantageous in terms of capital and operating costs. In the next section, we investigate the most economical of the four scenarios through an MSP comparison, including the BOG resale.

3.2. MSP of LNG Refueling Station

Figure 4 shows a comparison of the MSP according to the detailed configuration of Sc1 to Sc4 and the number of vehicles refueled per day. The lowest MSP was observed for Sc4 at USD 892.
Figure 4a shows the cost, revenue, and MSP of the four scenarios. The MSP is the breakeven point of an LNG refueling station, which was calculated using the discounted cash flow methodology presented in the NREL report [46,47] (see Tables S1–S4 in the Supplementary Materials for detailed discounted cash flows for Sc 1–4, respectively). The MSP consists of LNG purchase costs, capital depreciation, operating costs, etc., and the return on investment is calculated by the formula [48]. Sc2 to Sc3 included the cost of reliquefaction of BOG and the cost of reselling CNG with LNG, and SC4 included the cost of processing BOG with CNG and the credit for selling it.
Sc1 had the highest MSP because the cost of the carbon tax and BOG loss was USD 115, as the BOG was released into the atmosphere. The MSP of Sc2 was the second highest because liquid nitrogen was used for BOG reliquefaction, which accounted for 9.7% of MSP. Sc3 had a higher MSP than Sc4 because of the capital depreciation and loan payments. Therefore, the lowest MSP was achieved by compressing the BOG and selling it as CNG, as shown in Sc4.
Figure 4b shows the MSP according to the change in the number of vehicles refueled per day in Sc1 to Sc4, and reveals that the MSP of Sc4 is the lowest and most economically attractive. The BOR and volume of LNG in the tank affects the amount of BOG generated. Relatively, if the number of vehicles refueled was few, more BOG was caused, which affects the increase in MSP of the LNG refueling station.

3.3. Sensitivity Analysis (SA)

In Figure 5, a SA was performed for Sc4 to investigate the effect of changing the main parameters on the MSP (±20%). The most important factor among the main parameters was the LNG purchase price; a variation of ±20% led to an MSP of ±17.9%. The second most important factor was IRR; a variation of ±20% led to a change in MSP of ±1.9%. The third parameter was capital investment, leading to a ±1.5% change in the MSP with a ±20% change. The other parameters in their order of importance were the BOG selling cost, fixed operating cost, and interest rate for debt financing. Thus, the economic feasibility of LNG refueling stations could be sufficiently improved by decreasing the LNG purchase price, IRR, and capital investment.
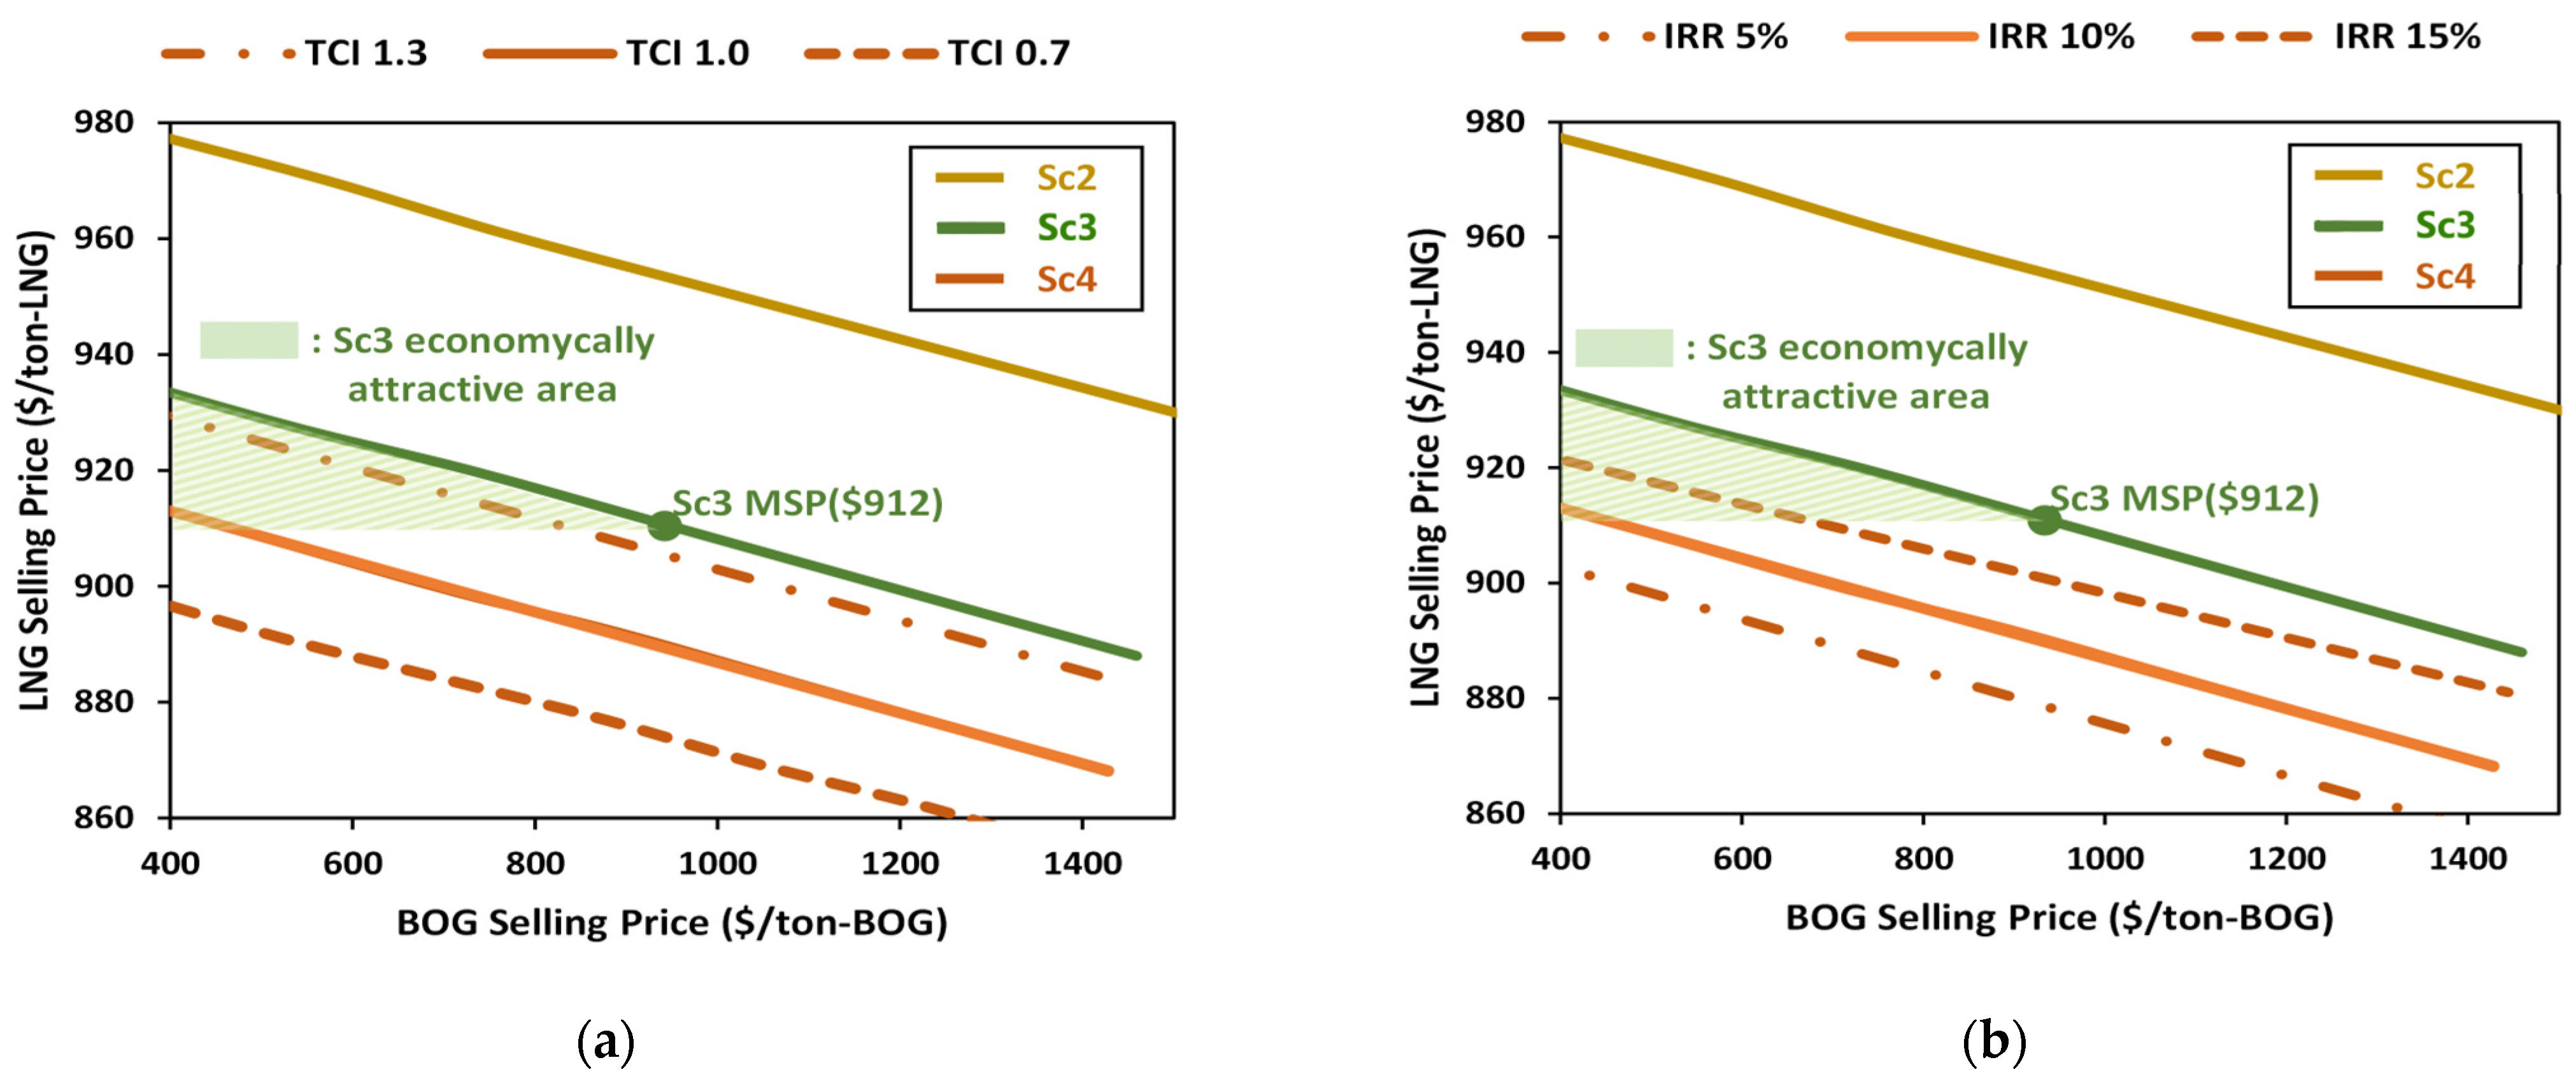
Figure 6 shows the changes in the MSPs of LNG refueling stations according to changes in the BOG (CNG) selling price, TCI, and IRR as viability envelope curves for comparing Sc4 with Sc2 to Sc3. Figure 6a shows the MSP comparison according to the TCI change (0.7 to 1.3 times), and Figure 6b shows the change in the MSP from 5% to 15% IRR. In the absence of changes in the TCI and IRR of Sc4, if the BOG (CNG) selling price was higher than USD 411/ton-BOG, it had an MSP lower than Sc3 and was economical. If the TCI increased by 1.3 times, the BOG (CNG) selling price must be higher than USD 817/ton-BOG, which was economically attractive. When the TCI increased by 1.4 times, Sc3 was more economically attractive than Sc4. Even if the IRR increased by 15.0%, the MSP of Sc4 would be lower than that of Sc3 if the BOG (CNG) selling price was higher than USD 685/ton-BOG. In addition, if the IRR increased by 19.15%, the MSP of Sc4 was higher than Sc3.

3.4. Uncertainty Analysis (UA)

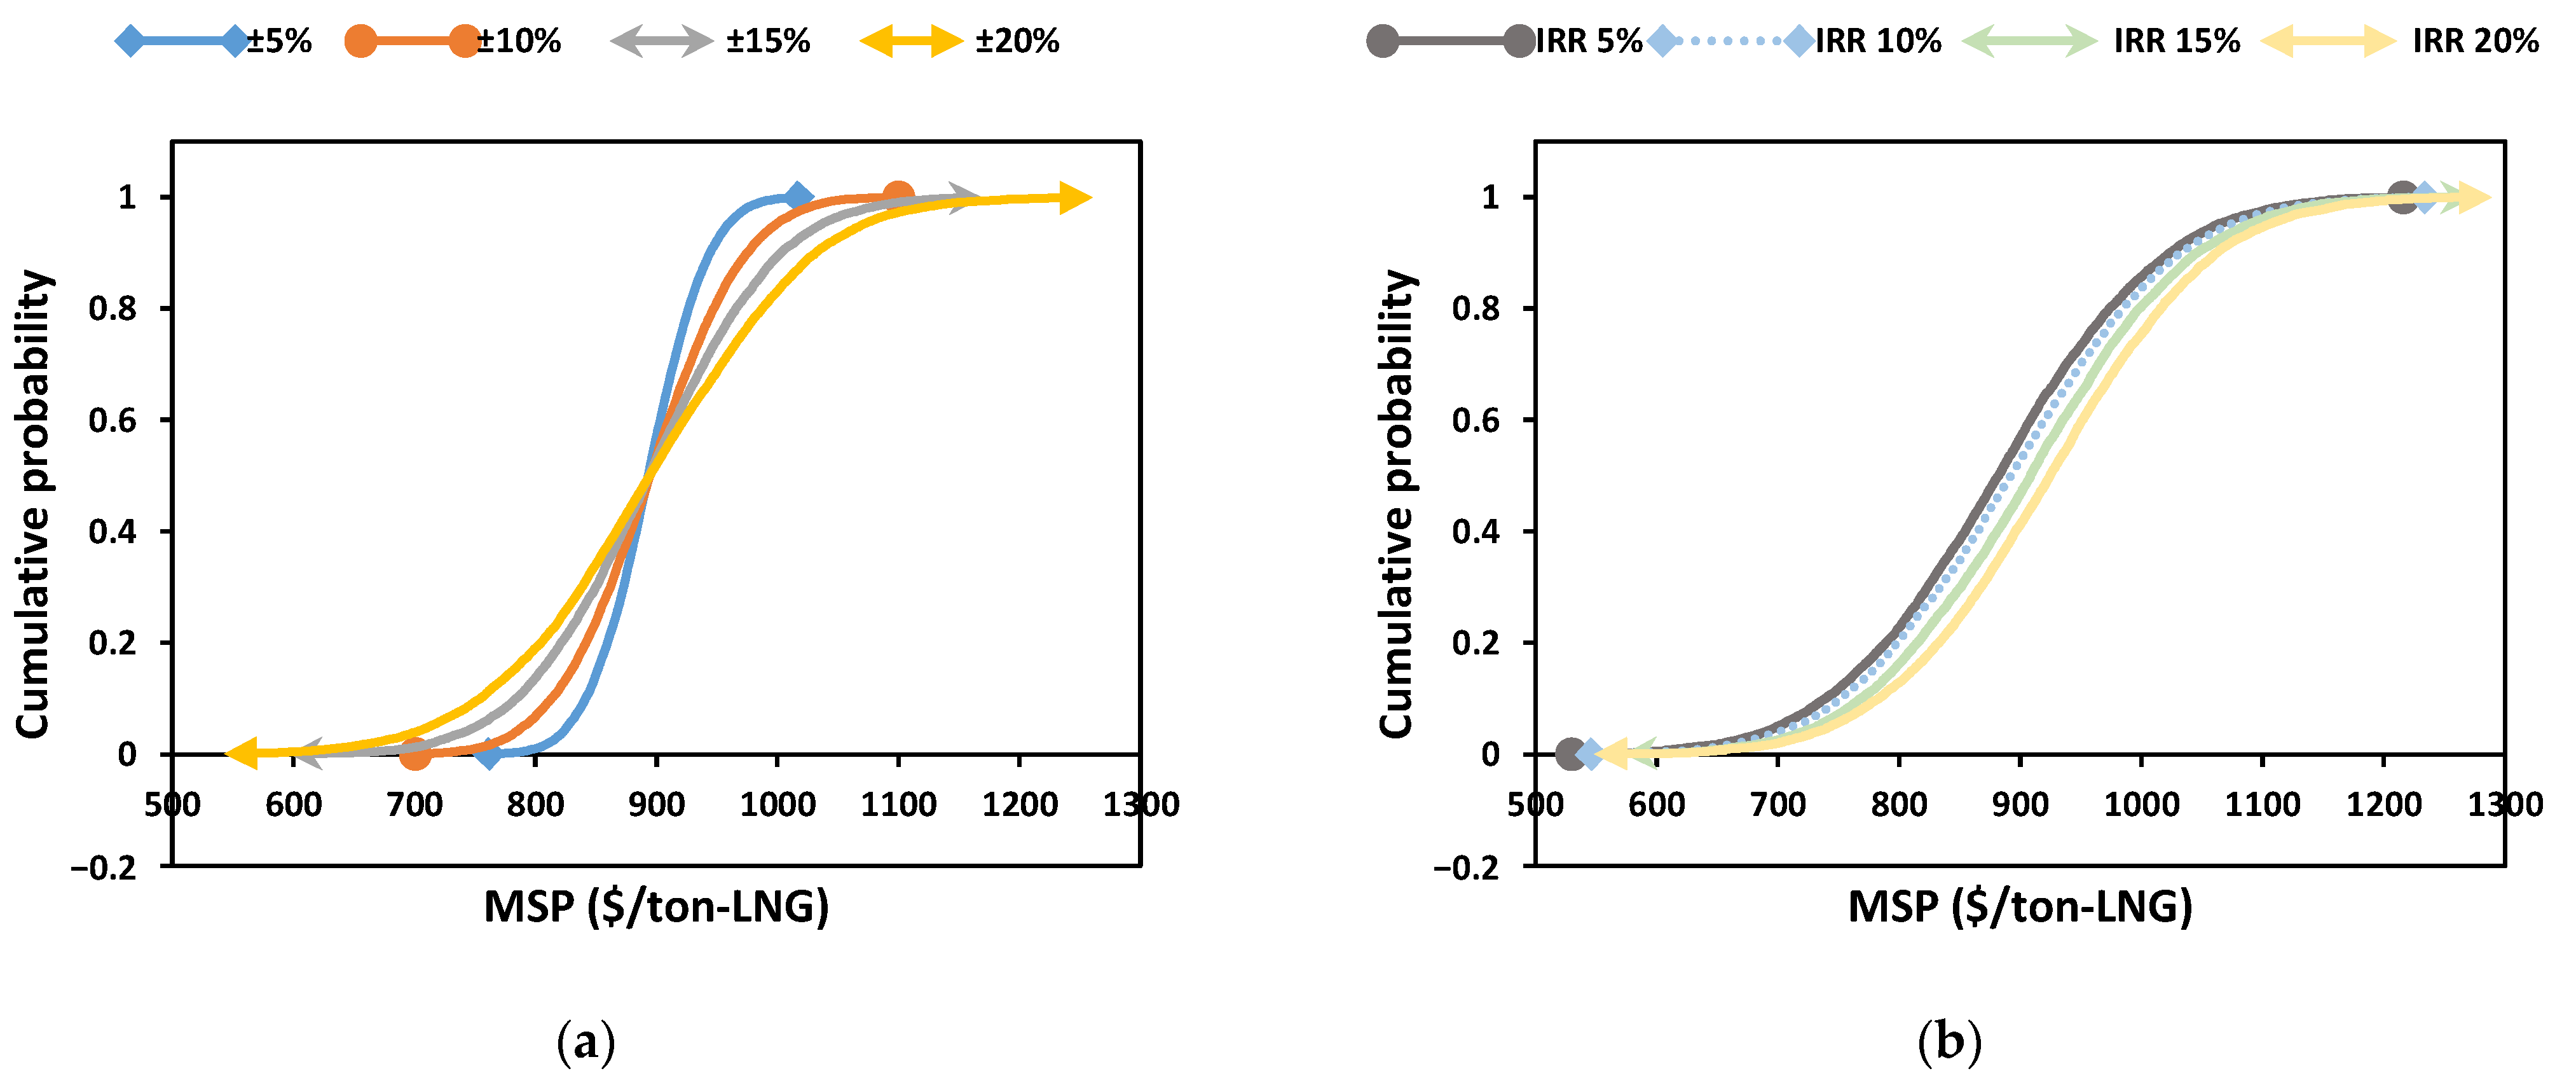
The LNG purchase price, capital investment, and IRR were identified as key parameters from the SA analysis. In addition, Monte Carlo simulations (10,000 trials) were performed to quantify the uncertainty of MPS by random sampling within the standard deviation of the three parameters. Figure 7a shows the MSP range when two key economic parameters, LNG purchase price and capital investment, were changed by ±5%, ±10%, ±15%, and ±20% for a fixed IRR of 10%. When the parameters changed by ±5%, an increase in MSP from USD 761.6/ton-LNG to USD 1017.1/ton-LNG was observed, whereas a range of ±20% resulted in a larger change in the MSP from USD 542.9/ton-LNG to USD 1260.5/ton-LNG. This implies that the fluctuations in the MSP increased as the uncertainty in the costs of the two key parameters increased. In addition, Figure 7b shows the different IRRs ranges (5%, 10%, 15%, and 20%) with changes of ±20% in the two key economic parameters, LNG purchase price and capital investment. As the IRR increased from 5% to 20%, the variability of the MSP was estimated to be 56.9%, 55.7%, 55.0%, and 54.4%. This implies that the cumulative probability curves tend to converge when the IRR decreases and the MSP variability increases, and the IRR had little impact on the MSP.

3.5. Profitability Analysis (PA)

To analyze profitability, the cost of goods sold was assumed to be 93% [49]. Figure 8 shows the cumulative cash flow diagram for a 15-year period, including a construction period of 1 y and variations of discount rates from 5% to 15% for Sc4. The discounted cash flow patterns vary depending on the discount rates. From the analysis, the highest NPV of USD 404,658 was obtained with a discount rate of 5%, and an NPV of USD−55,058 with a discount rate of 15%. In addition, the maximum discount rate to ensure at least zero NPV at the end of the project period, termed as the discounted cash flow rate of return (DCFROR), was found to be 13.22% in this project. It usually affects DCFROR depending on investment risk and industries. Commonly, DCFROR has a accepted a value of at least 15% when the investment risk is low, but more is expected when it is a new technology with a high risk. Therefore, this means that the LNG refueling business is a business of low-risk investment. The NPV, discount return period (DPBP), and present value ratio (PVR) are defined as cash flow ratios. Table 5 presents the results for different discount rates based on PA [50]. This analysis shows that if the discount rate is lower, NPV and PVR are low, but DPBP tends to be high, which confirms the effect of the discount rate on PA.
The proposed BOG management system can mitigate the economic loss of refueling stations in the field such as China and other countries which uses LNG widely. The broader implication, it can help realize NET zero by reducing GHG.
In this study, we focused on the assumptions present in the design of the study, potential sources of subjectivity and bias, and future studies that are needed to further generalize the results. In addition, future research is necessary to study how much environmental improvement can be made through life cycle assessment (LCA).

4. Conclusions

Economic analyses were conducted to compare four scenarios of an LNG refueling station with a BOG management system: Sc1, not including the BOG management system; Sc2, using liquid nitrogen; Sc3, using microliquefaction; and Sc4, using compressed natural gas. The results showed that the economically optimal scenario was Sc4, where the LNG refueling station had an MSP of USD 892/ton LNG. To evaluate the economic feasibility of Sc4, various economic analysis methods, such as sensitivity, uncertainty, and profitability analyses, were performed. The effect of key parameters on the MSP was investigated through sensitivity and uncertainty analyses, and LNG purchase price, capital investment, etc. were identified as key parameters for determining the MSP. Finally, PA of Sc4 for a 15-year period was combined with cash flow diagrams for variations in discount rates from 5% to 15%. The analysis was conducted for the NPV, DPBP, and PVR at each discount rate. The DCFROR was found to be 13.22%. The BOG management system was shown to improve economic feasibility. In particular, Sc4 was the most economical among all scenarios. The result of this study will provide an economical guide for countries that much demand for LNG in the transport sector.

Supplementary Materials

The following supporting information can be downloaded at: https://www.mdpi.com/article/10.3390/en15228526/s1. Discounted cash flow for scenario 1, Table S1; Discounted cash flow for scenario 2, Table S2; Discounted cash flow for scenario 3, Table S3; Discounted cash flow for scenario 4, Table S4.

Author Contributions

Conceptualization, C.-H.C.; methodology and validation, C.-H.C. and H.-S.K.; resources and writing—original draft preparation, H.-S.K.—review and editing, C.-H.C.; visualization, H.-S.K.; supervision, C.-H.C.; funding acquisition, C.-H.C. All authors have read and agreed to the published version of the manuscript.

Funding

This work was supported by the research fund of Chungnam National University (Development of nitrogen-selective highflux membrane for natural gas purification, 2019).

Data Availability Statement

Not applicable.

Conflicts of Interest

The authors declare no conflict of interest.

References

  1. Richter, B. Beyond Smoke and Mirrors: Climate Change and Energy in the 21st Century; Cambridge University Press: Cambridge, UK, 2014. [Google Scholar]
  2. Kim, M.; Won, W.; Kim, J. Integration of carbon capture and sequestration and renewable resource technologies for sustainable energy supply in the transportation sector. Energy Convers. Manag. 2017, 143, 227–240. [Google Scholar] [CrossRef]
  3. Liimatainen, H.; Kallionpää, E.; Pöllänen, M.; Stenholm, P.; Tapio, P.; McKinnon, A. Decarbonizing road freight in the future—Detailed scenarios of the carbon emissions of Finnish road freight transport in 2030 using a Delphi method approach. Technol. Forecast. Soc. Change 2014, 81, 177–191. [Google Scholar] [CrossRef]
  4. EPA 430-R-21-005; Inventory of U.S. Greenhouse Gas Emissions and Sinks: 1990–2019. EPA: Washington, DC, USA, 2021.
  5. Bouckaert, S.; Pales, A.F.; McGlade, C.; Remme, U.; Wanner, B.; Varro, L.; D’Ambrosio, D.; Spencer, T. Net Zero by 2050: A Roadmap for the Global Energy Sector; International Energy Agency: Paris, France, 2021. [Google Scholar]
  6. Hoeven, M.V.D. CO2 emissions from fuel combustion IEA statistics. In International Energy Agency: Highlights; International Energy Agency: Paris, France, 2013. [Google Scholar]
  7. Li, J.; Dong, X.; Shangguan, J.; Hook, M. Forecasting the growth of China’s natural gas consumption. Energy 2011, 36, 1380–1385. [Google Scholar] [CrossRef] [Green Version]
  8. Khan, M.S.; Qyyum, M.A.; Ali, W.; Wazwaz, A.; Ansari, K.B.; Lee, M. Energy Saving through Efficient BOG Prediction and Impact of Static Boil-off-Rate in Full Containment-Type LNG Storage Tank. Energies 2020, 13, 5578. [Google Scholar] [CrossRef]
  9. Guo, Y.; Hawkes, A. The impact of demand uncertainties and China-US natural gas tariff on global gas trade. Energy 2019, 175, 205–217. [Google Scholar] [CrossRef]
  10. Alliance, C.N.G.V. Study On Natural Gas Research and Development Priority Setting For Transportation in Canada, Road Map, 1; Canadian Natural Fas Vechicle Alliance: Ottawa, ON, Canada, 2015. [Google Scholar]
  11. International Gas Union. LNG as Fuel. In Proceedings of the 26th World Gas Conference, Paris, France, 1–5 June 2015; pp. 1–120. [Google Scholar]
  12. Bassi, A. Liquefied Natural Gas (LNG) as fuel For Road Heavy Duty Vehicles Technologies and Standardization (No. 2011-24-0122), SAE Technical Paper; SAE: Warrendale, PA, USA, 2011. [Google Scholar]
  13. Dunn, M.E.; LeBlanc, V.N. Two Engine System with a Gaseous Fuel Stored in Liquefied Form. U.S. Patent No. 8,763,565 B2, 1 July 2014. [Google Scholar]
  14. Seo, S.; Han, S.; Lee, S.; Chang, D. A pump-free boosting system and its application to liquefied natural gas supply for large ships. Energy 2016, 105, 70–79. [Google Scholar] [CrossRef]
  15. Bouabidi, Z.; Almomani, F.; Al-Musleh, E.; Katebah, M.; Hussein, M.; Shazed, A.; Karimi, I.; Alfadala, H. Study on Boil-off Gas (BOG) Minimization and Recovery Strategies from Actual Baseload LNG Export Terminal: Towards Sustainable LNG Chains. Energies 2021, 14, 3478. [Google Scholar] [CrossRef]
  16. China’s Gas-Fueled Vehicle Population Rose to the World Top. 2016. Available online: http://www.ngvexpo.com/msg.php?Id=1631 (accessed on 25 November 2016).
  17. Sharafian, A.; Talebian, H.; Blomerus, P.; Herrera, O.; Mérida, W. A review of liquefied natural gas refueling station designs. Renew. Sustain. Energy Rev. 2017, 69, 503–513. [Google Scholar] [CrossRef]
  18. KANGV (Korea Asscoiation for Natural Gas & Fuel Cell Electric Vehicles). 2021. Available online: http://www.kangv.org/ (accessed on 11 February 2022).
  19. AFDC (Alternative Fuels Data Center). 2020. Available online: https://afdc.energy.gov/fuels/natural_gas_stations.html (accessed on 14 February 2022).
  20. Hydrogen Refueling Station Network Growing Worldwide: 142 New Stations Opened in 2021. Available online: http://sustainable-bus.com (accessed on 3 February 2022).
  21. Burnham, A.; Han, J.; Elgowainy, A.; Wang, M. Updated Fugitive Greenhouse Gas Emissions for Natural Gas Pathways in the GREET1_2015 Model; Argonne National Laboratory: Lemont, IL, USA, 2015. [Google Scholar]
  22. Powars, C.A. Best Practices to Avoid LNG Fueling Station Venting Losses; Brookhaven National Laboratory: San Jose, CA, USA, 2010. [Google Scholar]
  23. LNG Boil off Gas (BOG) Emissions Cannot Be Ignored. 2015. Available online: http://paper.people.com.cn/zgnyb/html/2015-12/21/content_1642385.htm (accessed on 6 May 2016).
  24. Hailer, J.T. LNG Station Analysis for the Prediction of Pressure Rise and Vented Emissions. West Virginia University. 2015. Available online: http://ezproxy.library.ubc.ca/loginurl=http://search.proquest.com/docview/1752230020?accountid=14656 (accessed on 21 February 2022).
  25. Carboni, M.; Pio, G.; Mocellin, P.; Vianello, C.; Maschio, G.; Salzano, E. On the flash fire of stratified cloud of liquefied natural gas. J. Loss Prev. Process Ind. 2022, 75, 104680. [Google Scholar] [CrossRef]
  26. Ma, G.; Huang, Y. Safety assessment of explosions during gas stations refilling process. J. Loss Prev. Process Ind. 2019, 60, 133–144. [Google Scholar] [CrossRef]
  27. Peng, Y.; Zhao, X.; Zuo, T.; Wang, W.; Song, X. A systematic literature review on port LNG bunkering station. Transp. Res. Part D Transp. Environ. 2021, 91, 102704. [Google Scholar] [CrossRef]
  28. Liu, S.; Li, X.; Huo, Y.; Li, H. An analysis of the primary energy consumed by the re-liquefaction of boil-off gas of LNG storage tank. Energy Procedia 2015, 75, 3315–3321. [Google Scholar] [CrossRef] [Green Version]
  29. Jiqiang, J.; Bin, P.; Chunyan, Z. Study and economic analysis on BOG re-liquefaction process at LNG filling station. Chem. Eng. Oil Gas 2017, 46, 45–50. [Google Scholar]
  30. Chart Industries LNG Storage Vessels. 2016. Available online: http://files.chartindustries.com/20810915_VerticalStorage.pdf (accessed on 10 March 2022).
  31. Sharafian, A.; Herrera, O.E.; Mérida, W. Performance analysis of liquefied natural gas storage tanks in refueling stations. J. Nat. Gas Sci. Eng. 2016, 36, 496–509. [Google Scholar] [CrossRef]
  32. NamKoong, K.-W.; Chu, S.-J. Prediction of Thermal Behavior of Automotive LNG Fuel Tank. Trans. Korean Soc. Mech. Eng. B 2010, 34, 875–883. [Google Scholar] [CrossRef]
  33. Wiens, J.; Powars, C.; Pope, G. LNG vehicle fuel pressure strategy alternatives. SAE Trans. 2001, 110, 1098–1112. [Google Scholar]
  34. Linde’s LNG Fueling Solutions: Now Available for Fleets. 2014. Available online: http://lindelng.com/pdf/Linde_LNG_Fueling_Solutions-forFleets.pdf (accessed on 21 March 2022).
  35. Liqal Home Page. 2022. Available online: https://www.liqal.com/index.php/en/lng-fuelling-solutions/liquefaction-lng (accessed on 4 April 2022).
  36. Chart Industires. 2016. Available online: http://www.chartindustries.com/ (accessed on 23 March 2022).
  37. Minutillo, M.; Perna, A.; Forcina, A.; Di Micco, S.; Jannelli, E. Analyzing the levelized cost of hydrogen in refueling stations with on-site hydrogen production via water electrolysis in the Italian scenario. Int. J. Hydrog. Energy 2021, 46, 13667–13677. [Google Scholar] [CrossRef]
  38. Davis, R.; Tao, L.; Scarlata, C.; Tan, E.C.D.; Ross, J.; Lukas, J.; Sexton, D. Process Design and Economics for the Conversion of Lignocellulosic Biomass to Hydrocarbons: Dilute-Acid and Enzymatic Deconstruction of Biomass to Sugars and Catalytic Conversion of Sugars to Hydrocarbons; National Renewable Energy Laboratory: Golden, CO, USA, 2015. [Google Scholar]
  39. KOGAS. 2022. Available online: https://www.kogas.or.kr (accessed on 28 February 2022).
  40. KEPCO. 2022. Available online: https://www.home.kepco.co.kr (accessed on 28 February 2022).
  41. Davis, R.E.; Grundl, N.J.; Tao, L.; Biddy, M.J.; Tan, E.C.D.; Beckham, G.T.; Humbird, D.; Thompson, D.N.; Roni, M.S. Process Design and Economics for the Conversion of Lignocellulosic Biomass to Hydrocarbon Fuels and Coproducts: 2018 Biochemical Design Case Update; National Renewable Energy Laboratory: Golden, CO, USA, 2018. [Google Scholar]
  42. Mariani, F. Cost Analysis of LNG Refueling Stations. 2016. Available online: https://lngbc.eu/downloads (accessed on 28 October 2016).
  43. Mac Dowell, N.; Fennell, P.S.; Shah, N.; Maitland, G.C. The role of CO2 capture and utilization in mitigating climate change. Nat. Clim. Chang. 2017, 7, 243–249. [Google Scholar] [CrossRef] [Green Version]
  44. Lee, B.; Chae, H.; Choi, N.H.; Moon, C.; Moon, S.; Lim, H. Economic evaluation with sensitivity and profitability analysis for hydrogen production from water electrolysis in Korea. Int. J. Hydrogen Energy 2017, 42, 6462–6471. [Google Scholar] [CrossRef]
  45. Lee, S.; Kim, H.S.; Park, J.; Kang, B.M.; Cho, C.H.; Lim, H.; Won, W. Scenario-Based Techno-Economic Analysis of Steam Methane Reforming Process for Hydrogen Production. Appl. Sci. 2021, 11, 6021. [Google Scholar] [CrossRef]
  46. Liang, F.; Lindberg, P.; Lindblad, P. Engineering photoautotrophic carbon fixation for enhanced growth and productivity. Sustain. Energy Fuels 2018, 2, 2583–2600. [Google Scholar] [CrossRef]
  47. The Chemical Engineering Plant Cost Index. 2021. Available online: https://www.chemengonline.com/pci-home (accessed on 3 May 2021).
  48. Paul, F.; Neil, B.; Phillip, P.; Reibstein, D. Marketing Metrics: The Definitive Guide to Measuring Marketing Performance; Wharton School Publishing: Upper Saddle River, NJ, USA, 2010. [Google Scholar]
  49. KPMG. Diagnosis of Gas Station Management Status and How to Strengthen Competitiveness. 2015. Available online: https://scienceon.kisti.re.kr/srch/selectPORSrchReport.do?cn=TRKO201700005198 (accessed on 19 January 2015).
  50. Turton, R.; Bailie, R.C.; Whiting, W.B.; Shaeiwitz, J.A. Analysis, Synthesis, and Design of Chemical Processes, 4th ed.; Pearson: Upper Saddle River, NJ, USA, 2013. [Google Scholar]
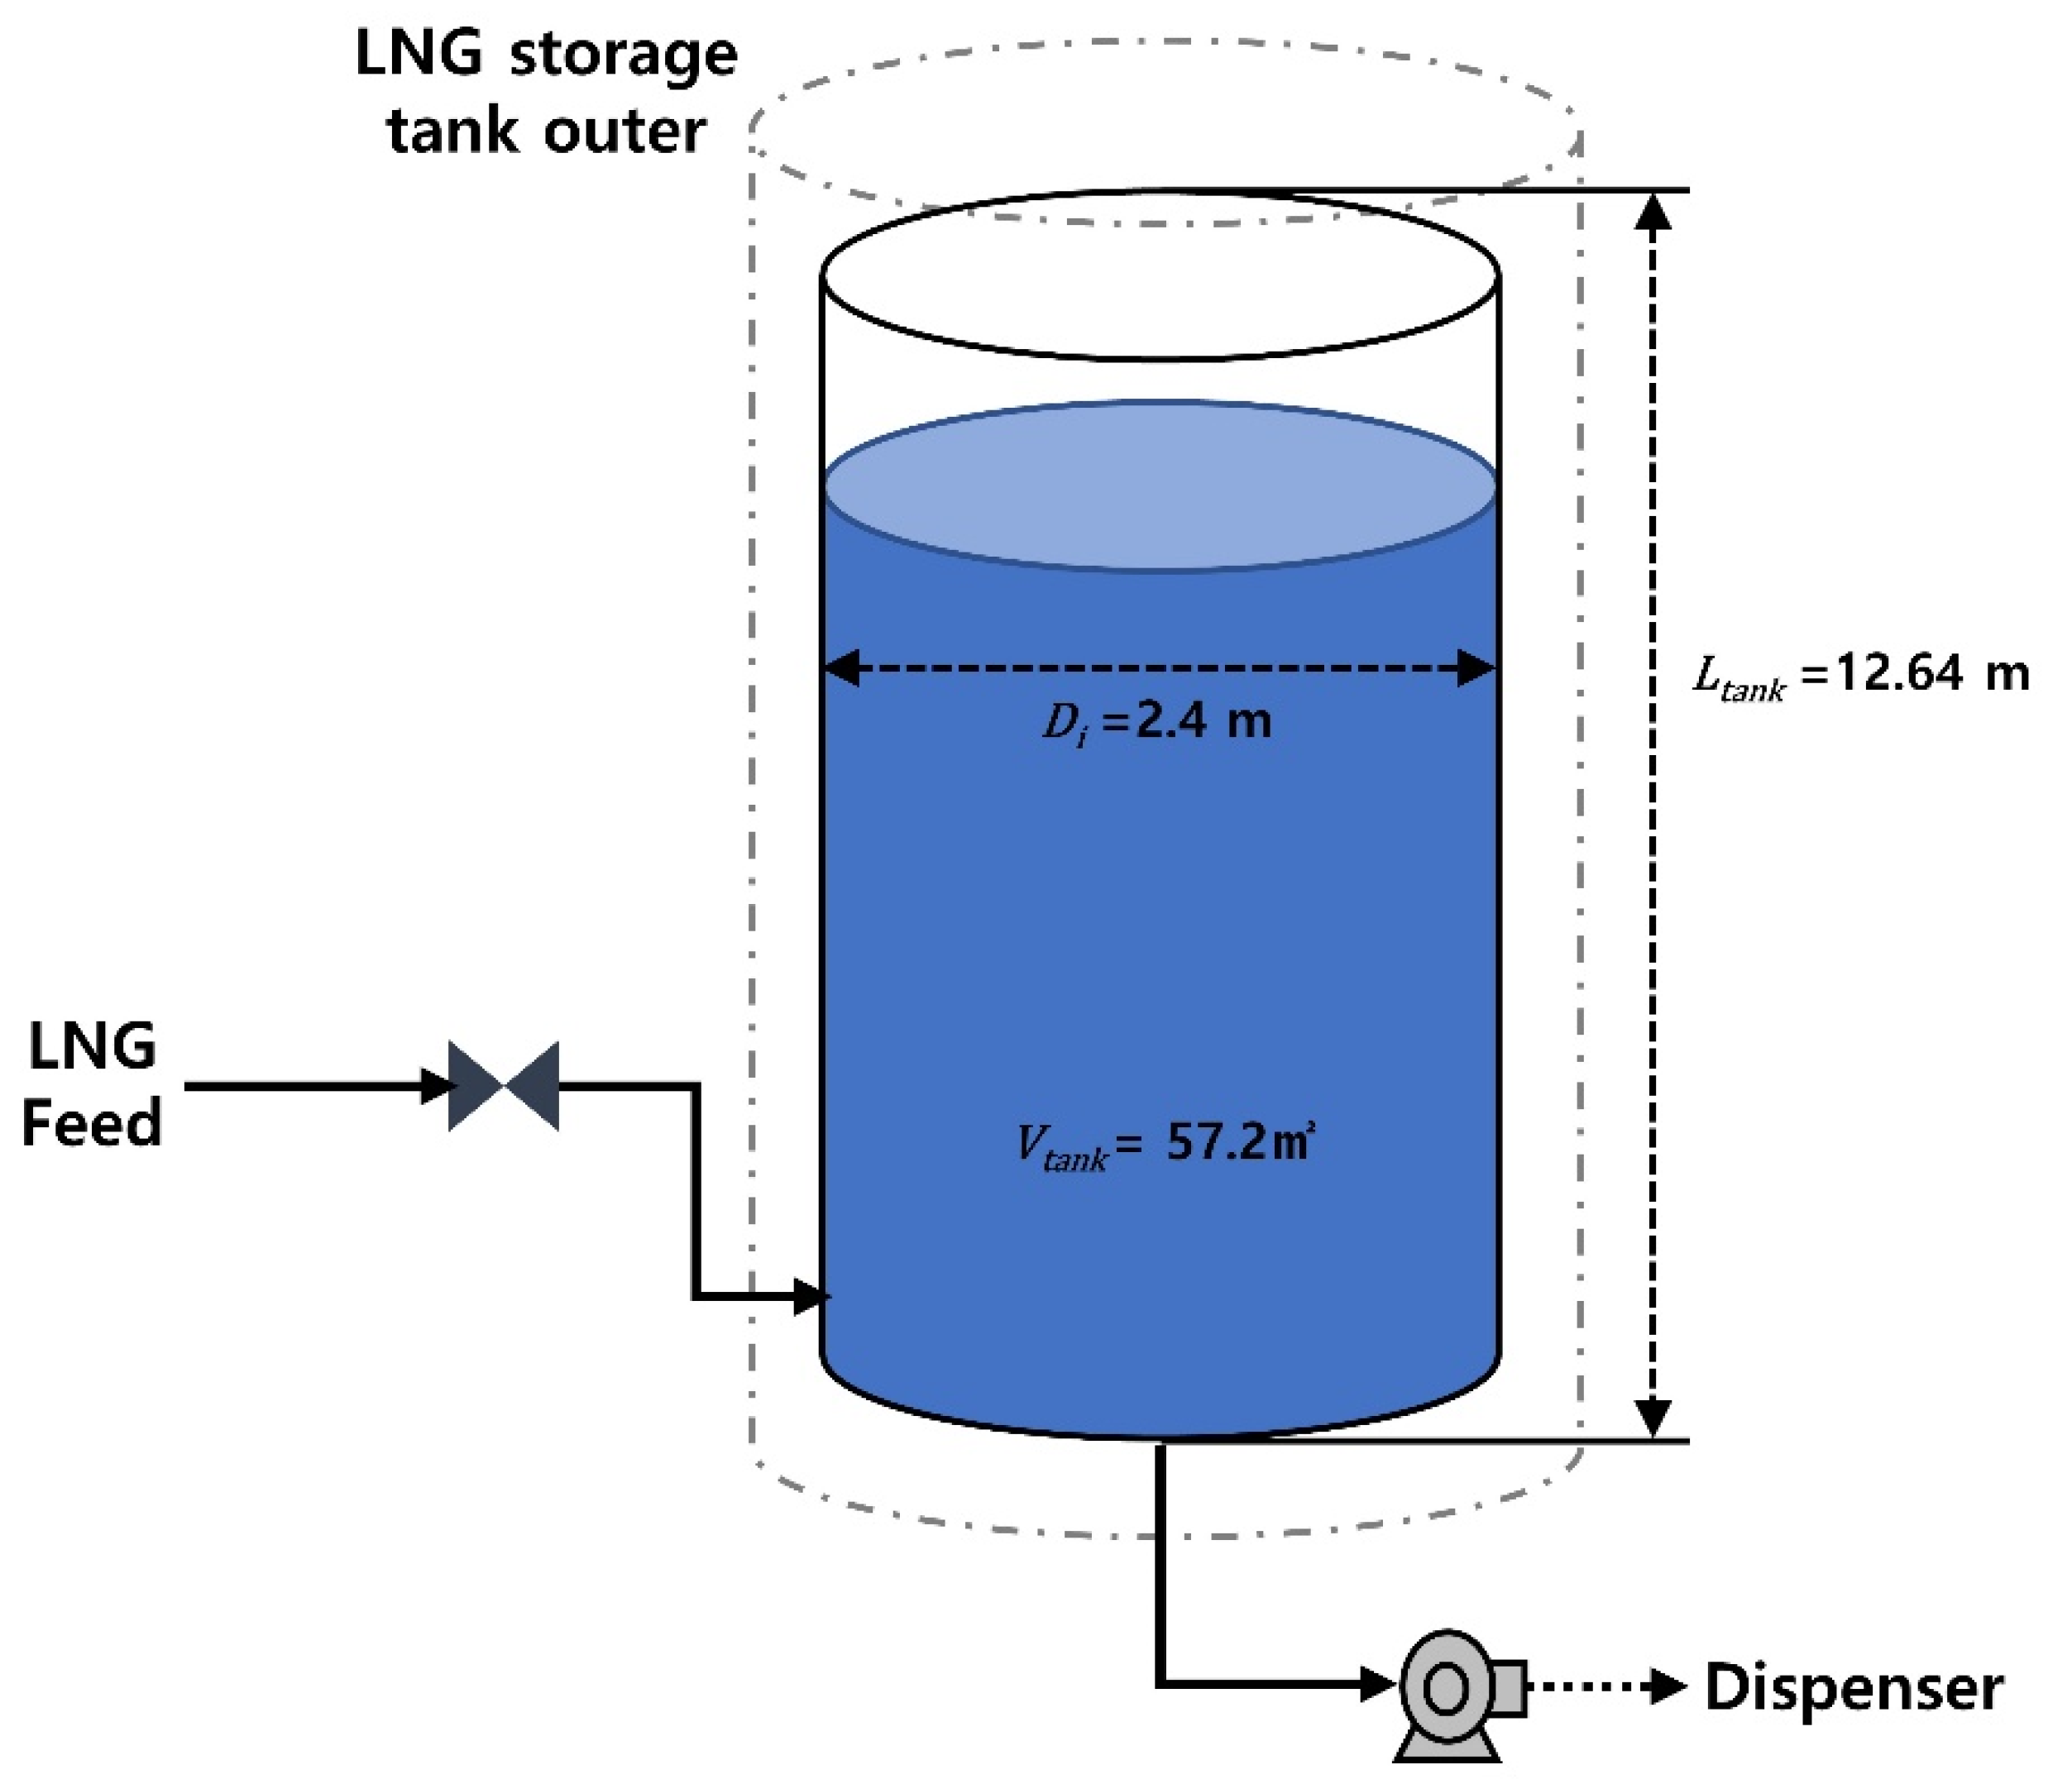
Figure 1. Schematic of a double-wall LNG storage tank with a net capacity of 57.2 m3.
Energies 15 08526 g001
Figure 2. Amount of boil-off gas (BOG) released during the day at an operating refueling station.
Energies 15 08526 g002
Figure 3. Schematic of the four different LNG refueling station scenarios: (a) Sc1: Basic LNG refueling station; (b) Sc2: LNG refueling station with LN2 condenser; (c) Sc3: LNG refueling station with microreliquefaction system, and; (d) LNG and CNG refueling station.
Energies 15 08526 g003
Figure 4. (a) Minimum selling price (MSP) and costs of four scenarios and (b) MSP of LNG station according to a ±50% change in the refueling vehicle.
Energies 15 08526 g004
Figure 5. Sensitivity analysis for MSP with changes of ±20% to the major parameters.
Energies 15 08526 g005
Figure 6. Viability envelope curves for sales strategy according to: (a) total capital investment (TCI) and (b) internal rate of return (IRR) in Sc4.
Energies 15 08526 g006
Figure 7. Uncertainty analysis in terms of cumulative probability for variations in the MSP with: (a) key economic parameters ranging from ±5% to ±20% (fixed IRR of 10%) and (b) different IRRs from 5% to 20% and two influential economic parameters (LNG purchase price and capital investment) of ±20%.
Energies 15 08526 g007
Figure 8. Profitability analysis results showing the different discount rates for cumulative cash flow in Sc4.
Energies 15 08526 g008
Table 1. Data of the liquefied natural gas (LNG) storage tank.
ParametersValuesReferences
Tank net capacity, Vtank57.2 m3[30]
Length of inner tank, Ltank12.64 m[31]
Inner diameter, Di2.4 m[31]
Surface area of inner tank, Atank104.35 m2[31]
Heat transfer rate to tank, Qtank430 W[31]
Ambient temperature, Tambient25 °C[31]
LNG temperature, TLNG−162 °C[22]
Table 2. Design-specific components and characteristics of the four scenarios considered in the study.
CategoryComponentsCharacteristics
Scenario 1 (Sc1)Storage tank, cryogenic pump, vaporizer (heater), vacuum pipe dispenser, controller, and valveThis unit releases BOG directly into the atmosphere. The initial investment is lower than that of other scenarios, the required land is small, and equipment composition is quite simple. However, BOG management is difficult.
Scenario 2 (Sc2)LNG refueling station (Sc1) + liquefied nitrogen (LN2) tank, LN2 pump,
LN2 vaporizer heat exchanger, and BOG capture tank
This unit re-liquefies BOG using the low liquefaction point (−192 °C) of LN2 and sends it to the storage tank with low pressure. Separate investment has to be made because a cryogenic pump, heat exchangers, and an LN2 storage tank for reliquefaction are required in addition to the refueling station of Sc1. Moreover, the operating cost increases because LN2 is used to re-liquefy BOG.
Scenario 3 (Sc3)LNG refueling station (Sc1) + microreliquefaction systemThis unit consists of a compressor, a heat exchanger, and a refrigerant circulator. It uses electric power to liquefy BOG into LNG and return it to the storage tank. The gas composition does not change but the unit consumes some power. The unit is standalone, easy to install and remove, and can be operated without a refueling station.
Scenario 4 (Sc4)LNG refueling station (Sc1) + compressed natural gas (CNG) tank, CNG pump, dispenserThis is a complex refueling station that combines LNG and CNG. The unit stores BOG compressed with high pressure in a storage tank, and supplies it to CNG vehicles. It is most suitable for BOG management, but the operating cost increases because investment in initial facilities and installation area increase and additional operating personnel are required.
Table 3. Economic parameters and initial cost assumptions.
ParametersValuesReferences
LNG purchase price ($/t)799.24[40]
Electricity price ($/kWh)0.09[41]
Carbon tax ($/t)29.00[43]
Financing equity ratio (%)40[39]
Term for debt financing (y)10[39]
Interest rate for debt financing (%)8[39]
Income tax (%)35[39]
Plant depreciation (y)7[39]
Land (% of fixed capital investment)2[39]
Working capital (% of fixed capital investment)5[39]
Labor cost (full time, $/y)34,167[44]
Labor cost (part time, $/y)16,667[44]
Project period (y)15
Construction period (y)1
Table 4. Capital and operation costs.
Capital Cost ($)
Sc1Sc2Sc3Sc4
Storage tank156,600175,227156,600182,932
Compressor and pump73,66087,98973,660284,142
Dispenser56,42656,42656,42688,906
Vaporizer and other equipment53,65076,577357,92253,650
Total installed equipment cost340,336396,219644,608609,630
Total direct costs408,403475,463754,191743,748
Total indirect costs240,617280,127475,076418,816
Fixed capital investment649,021755,5891,229,2671,162,564
Total capital investment694,452808,4811,315,3161,243,944
Operating Cost ($/y)
Sc1Sc2Sc3Sc4
LNG purchase2,836,9432,836,9432,836,9432,836,943
Electricity7500750025,21923,421
LN2-328,572--
Carbon tax168,835---
BOG loss221,576---
Fixed operating costs64,72384,504111,307109,880
Total operating costs3,299,5763,257,5182,973,4692,970,244
Table 5. Analysis of net present value (NPV), discount return period (DPBP), and present value ratio (PVR) for different discount rates from the cumulative cash flow diagram for Sc4.
Discount Rate (%)
58101215
NPV (USD 1000)404,658220,194123,46842,753−55,058
DPBP (year)9.8712.0113.0214.61-
PVR1.03411.03371.03351.03331.0330
Publisher’s Note: MDPI stays neutral with regard to jurisdictional claims in published maps and institutional affiliations.