Article

On the Factors of Impact Pressure in Supercritical CO2 Phase-Transition Blasting—A Numerical Study

1
A Key Lab Low-Grade Energy Utilization Technol & Syst, Chongqing University, Ministry of Education, Chongqing 400030, China
2
College of Civil Engineering, Yancheng Institute of Technology, Yancheng 221051, China
*
Author to whom correspondence should be addressed.
Energies 2022, 15(22), 8599; https://doi.org/10.3390/en15228599
Submission received: 8 July 2022 / Revised: 10 November 2022 / Accepted: 14 November 2022 / Published: 17 November 2022

Abstract

:
Carbon dioxide phase transition blasting (CO2-PB) technology is an effective and economical technology used for breaking rocks. The use of CO2-PB can significantly reduce the vibration damage to surrounding rocks. There is little research on the shockwave generated by the CO2-PB, and simulation can better show the flow field characteristics. In order to clarify the mechanism of its blasting load process, a theoretical analysis and a numerical model were developed to study the flow-field characteristics and the impact pressure of CO2-PB. Our results show that the CO2 absorbs heat from the surrounding environment, producing a significant low-temperature area. The overpressure is significantly lower than the driving gas pressure to the ambient pressure, limiting the maximum over-pressure that can be obtained. When the pressure in CO2-PB reaches 100 MPa, the shockwave is about 4.25 MPa. As the distance increases, the peak value of the shockwave decays rapidly. As the dimensionless distance increases from 1 to 5, the dimensionless overpressure decreases from 1 to 0.23. Under the same blasting pressure, increasing the filling pressure and increasing the filling volume slightly reduce the initial pressure of the shockwave. In the shock stage, strong compression is formed on the surface of the shockwave, resulting in a higher peak pressure value. Meanwhile, the stable pressure is influenced by the target distance, blasting pressure, and CO2-PB length.

1. Introduction

Safely and efficiently breaking rock is significant for tunnel excavation, road construction, and mining. Explosive blasting has been widely used for rock breaking, due to its low cost and high efficiency. However, explosive blasting-induced ground vibration, flames, and toxic gases have become severe issues in engineering, which may lead to air pollution and damage to the surrounding rocks [1]. Therefore, the application of explosive blasting has been restricted to mining and subway construction [2]. Carbon dioxide phase transition blasting (CO2-PB) technology comprises a nonexplosive rock-breaking technique. It was first designed in the 1940s and has recently been widely used in projects sensitive to vibration, such as subway and nuclear power plant construction [3,4,5]. CO2-PB is characterized by low vibration levels and the release of no toxic gases, which can reduce damage to the surrounding rocks [6,7,8,9]. In this respect, CO2-PB can be considered superior to explosive blasting techniques. Although CO2-PB has been widely used, the mechanism of CO2 phase transition is still unclear.
As shown in Figure 1, a CO2-PB system is composed of an air compressor, a buffer tank, a heating tube, a storage tube, and a control system. First, CO2 is transferred from the gas phase to a high-pressure liquid by the air compressor. Then, it is injected into the storage tube through the buffer tank. By starting the detonator, special chemicals in the heating tube begin to react, and a lot of heat is released instantly to heat the liquid carbon dioxide in the liquid storage tube. Under the effect of the heating element, the CO2 is transformed to a high-pressure supercritical state quickly. The blasting device is broken when the pressure reaches the threshold pressure. The high-pressure CO2 is suddenly injected into a lower-pressure gas through an orifice, leading to the highly unsteady under-expanded jet. During the instantaneous process of the under-expanded CO2 jet, high-energy gas and a shockwave are generated to impact the rock. Considering the under-expanded jet from the high-pressure vessel, the first significant load on the wall would be induced by the blasting shockwave [10]. Jaimes et al. experimentally determined that a transient pressure pulse, similar to the typical explosive shockwave, was formed in the process of CO2 blasting [11]. This shockwave produces a strong instantaneous force when initially contacting a rock surface. The high-energy CO2 in the vessel produces a continuous jet that carries high kinetic energy, thus forming a constant impact on the blast-hole [12,13]. Under such high blasting power, the rock mass is damaged and numerous crack networks are generated [3].
The blasting efficiency of CO2-PB is closely related to the impact of the dynamic loading on the rock. A number of researchers have reported the loading characteristics of CO2-PB through theoretical derivation and experimental tests. Based on the mechanism of phase transition kinetics, Ke et al. calculated the jet velocity and pressure [14]. Zhang et al. calculated the initial pressure of the CO2-PB shockwave and the crushing range of cracks through the use of spherical shockwave models. They developed a blasting experiment under free-field conditions, and their results showed that the failure modes of the specimens are mainly due to the stress wave and gas wedge effect [11]. Wang et al. theoretically studied the fracturing process of CO2-PB. They established a mathematical model for the fracturing pressure of a coal seam and calculated the fracturing influence range [15]. Shang et al. found that the most extensive shock crushing range appeared for the combination of blasting parameters having the highest blasting pressure, medium filling level, and the largest release orifice [3]. Zhou et al. established a small-scale experimental system, revealing the phase state influence on the initiation of CO2-PB. The 8 mm and 15 mm orifice sizes were two critical parameters under different burst pressures [16]. Lei et al. reported that the peak pressure decreases exponentially with increasing distance from the orifice [17]. Recent evidence has suggested that the blasting pressure, the diameter of the orifice, and the filling volume substantially affect the CO2 impact pressure. The shock over-pressure increases with the increase in blasting pressure. The distance of the shockwave decreased with an increase in filling pressure [18,19]. However, previous studies have mainly focused on the propagation of rock cracks and the maximum peak pressure of CO2-PB. The generation of shockwaves under different initial parameters remains unclear.
Due to the high pressure and temperature levels, developing direct experimental approaches for observing the pressure and flow field is challenging. Computational fluid dynamics (CFD) simulation has become a valuable method to study the flow field of the under-expanded CO2 jet. For instance, Zhang et al. [20] established a numerical model to investigate the dynamic oscillation characteristics of SC-CO2. Zhou et al. [21] developed a numerical model to study the flow field characteristics of an SC-CO2 impacting jet at the well bottom. Their results showed that the model could accurately predict the temperature and pressure fields of SC-CO2 impacting the jet. Wang et al. [21] studied the near-field structure and flow characteristics of the high-pressure CO2 released from the pipeline, where the P-R equation of state (EOS) and the shear stress transport k–ω model were applied to simulate the physical parameters of the under-expanded jet. Yang [22] presented a synthetic simulation of the impact pressure of swirling-round supercritical CO2 jet flow. They concluded that distance is essential to obtain the perfect impact pressure. However, the studies mentioned above applied static flow fields for the CO2; therefore, dynamic simulation of the jet impacting is still needed, in order to reveal the rock-blasting mechanism.
The choice of EOS is crucial at high pressure for numerical simulation, due to the thermodynamic properties of CO2 being likely to change significantly as the temperature and pressure change slightly [23,24,25]. Raman et al. analyzed the influence of EOS selection on S-CO2 modeling, using six different EOS candidates. Their results showed that the shockwave forms are susceptible to the different EOSs. Wareing et al. found that the real gas EOS was considerably superior to the ideal gas EOS in predicting the near-field temperatures of CO2 jets. Span and Wagner [26] proposed an EOS for CO2 based on the Helmholtz free energy, by reviewing the empirical formula obtained from data of previous research on CO2, especially for values near the critical point, which were shown to have high accuracy. The fluid density and thermal conductivity error could be controlled within 0.05% and 1.50%, respectively, which are widely used in the calculation process for gas–liquid CO2 and SC-CO2.
For this study, we aim to analyze the theoretical pressure in CO2-PB and establish a dynamic numerical model for the whole process. The results of the simulation under different initial CO2-PB parameters are detailed, and the effect factors are analyzed. The calculation analysis simulation uses the real gas model based on the S-W EOS. Our results provide a reference for understanding the mechanism of CO2-PB blasting, guiding its application in the field.

2. Methods and Models

2.1. Computational Simulation Domain and Boundary Conditions

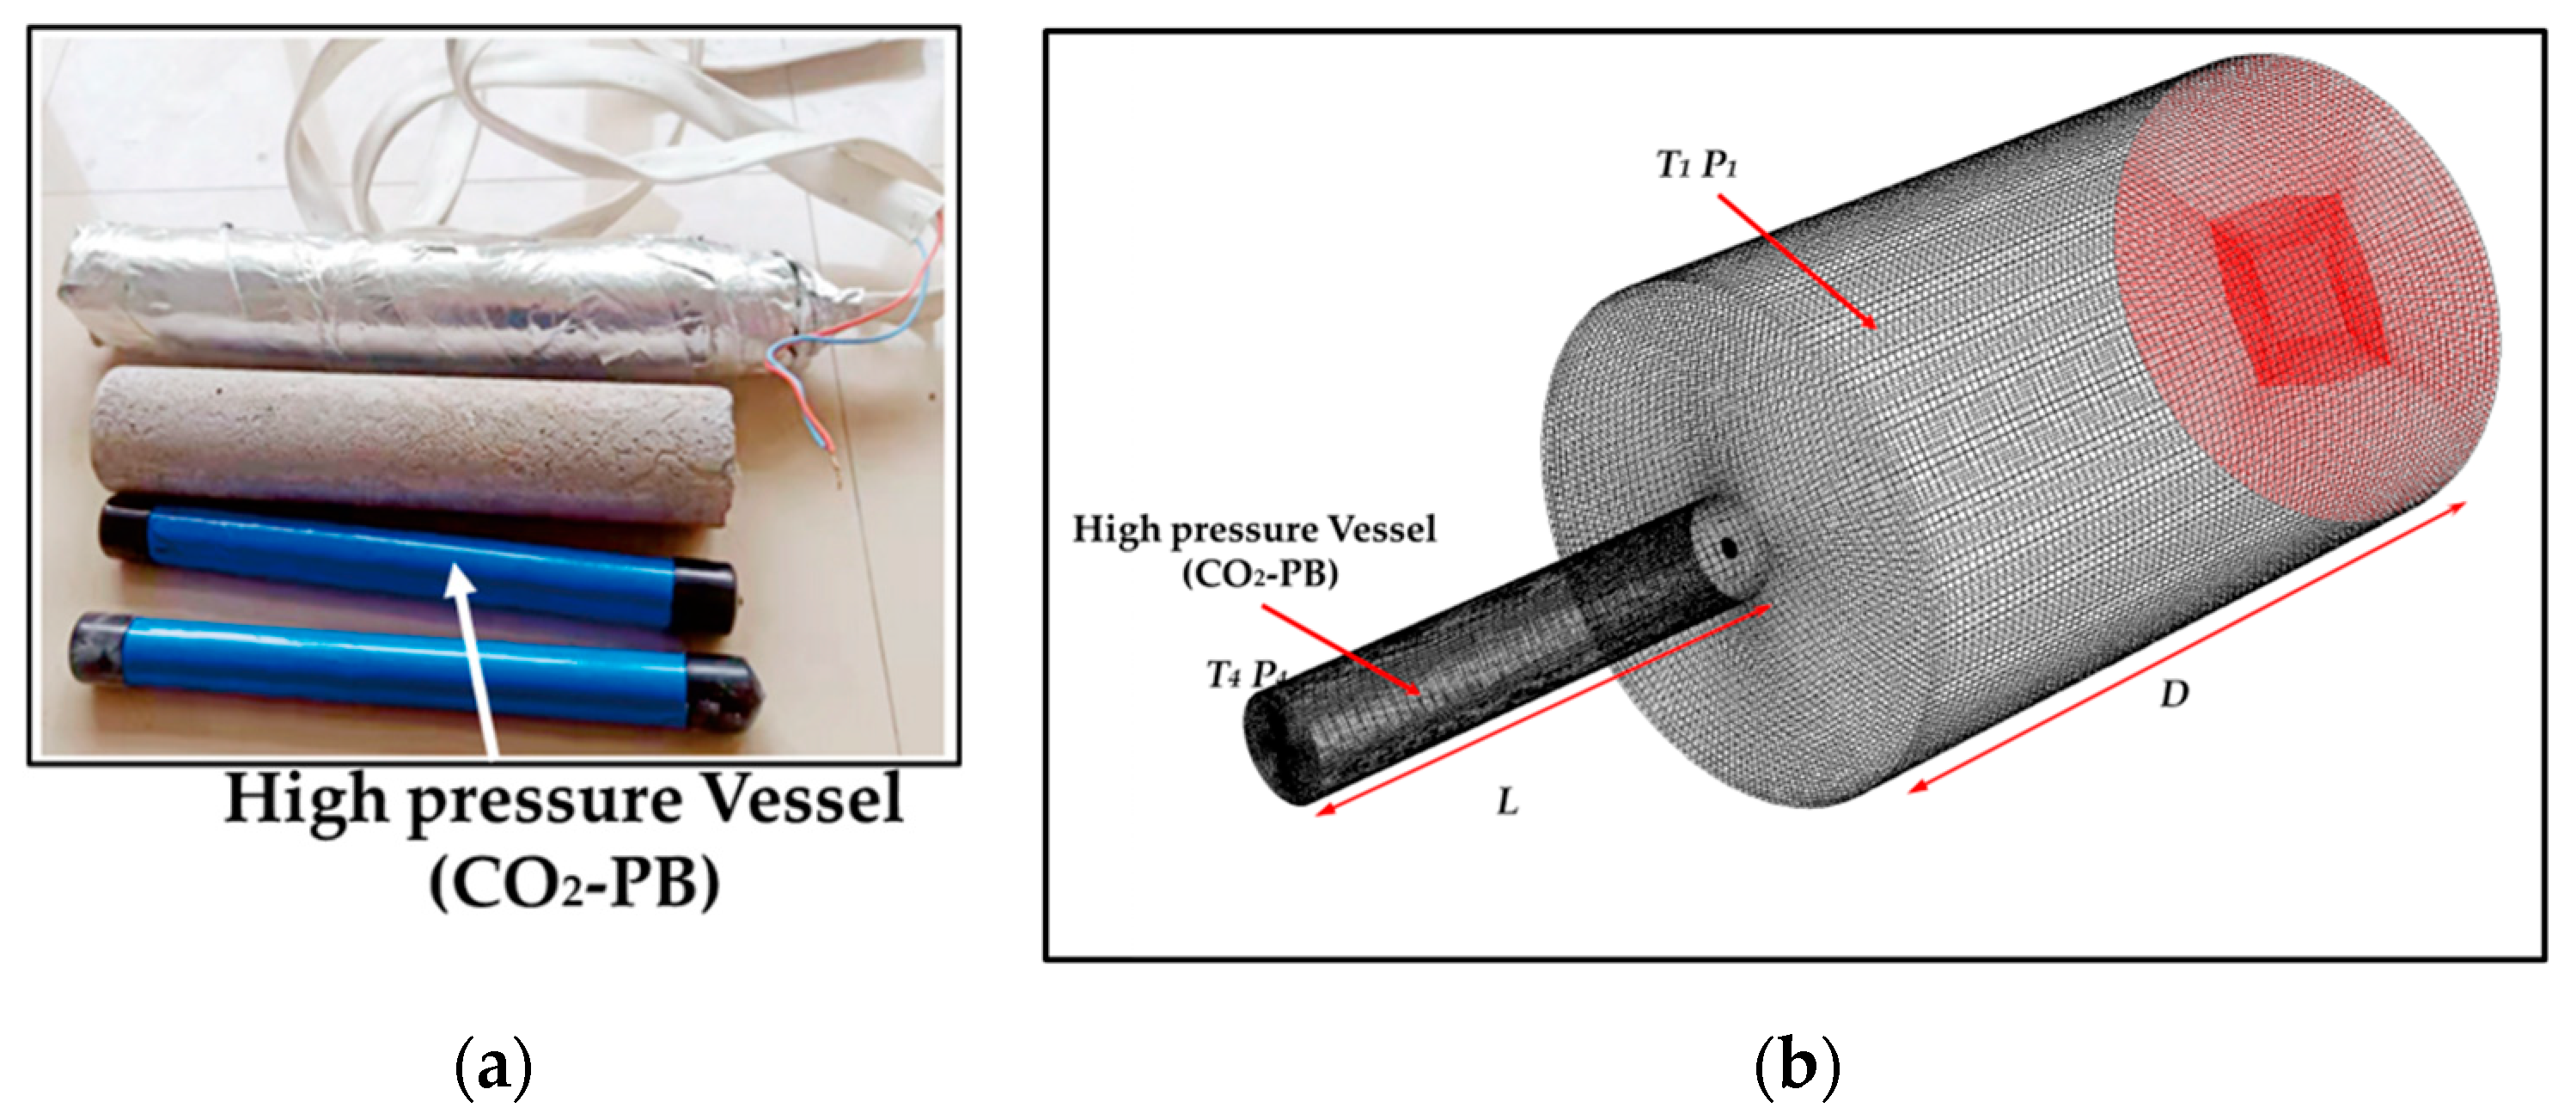
Figure 2 demonstrates the three-dimensional geometric model for the CO2-PB simulation. Based on the process features of CO2-PB, a geometric model was established, using simplified conditions for the flow field. The radius of CO2-PB was set as 50 mm, and the length L was 50–200 mm. The length of free space D was 300 mm. In the supersonic flow field, the complex wave mechanism causes a large span of different spatial and temporal scales, requiring high grid refinement. Due to the flow properties of CO2, different mesh densities were set for the various regions. The local grid area was refined with a large pressure gradient in the calculation.
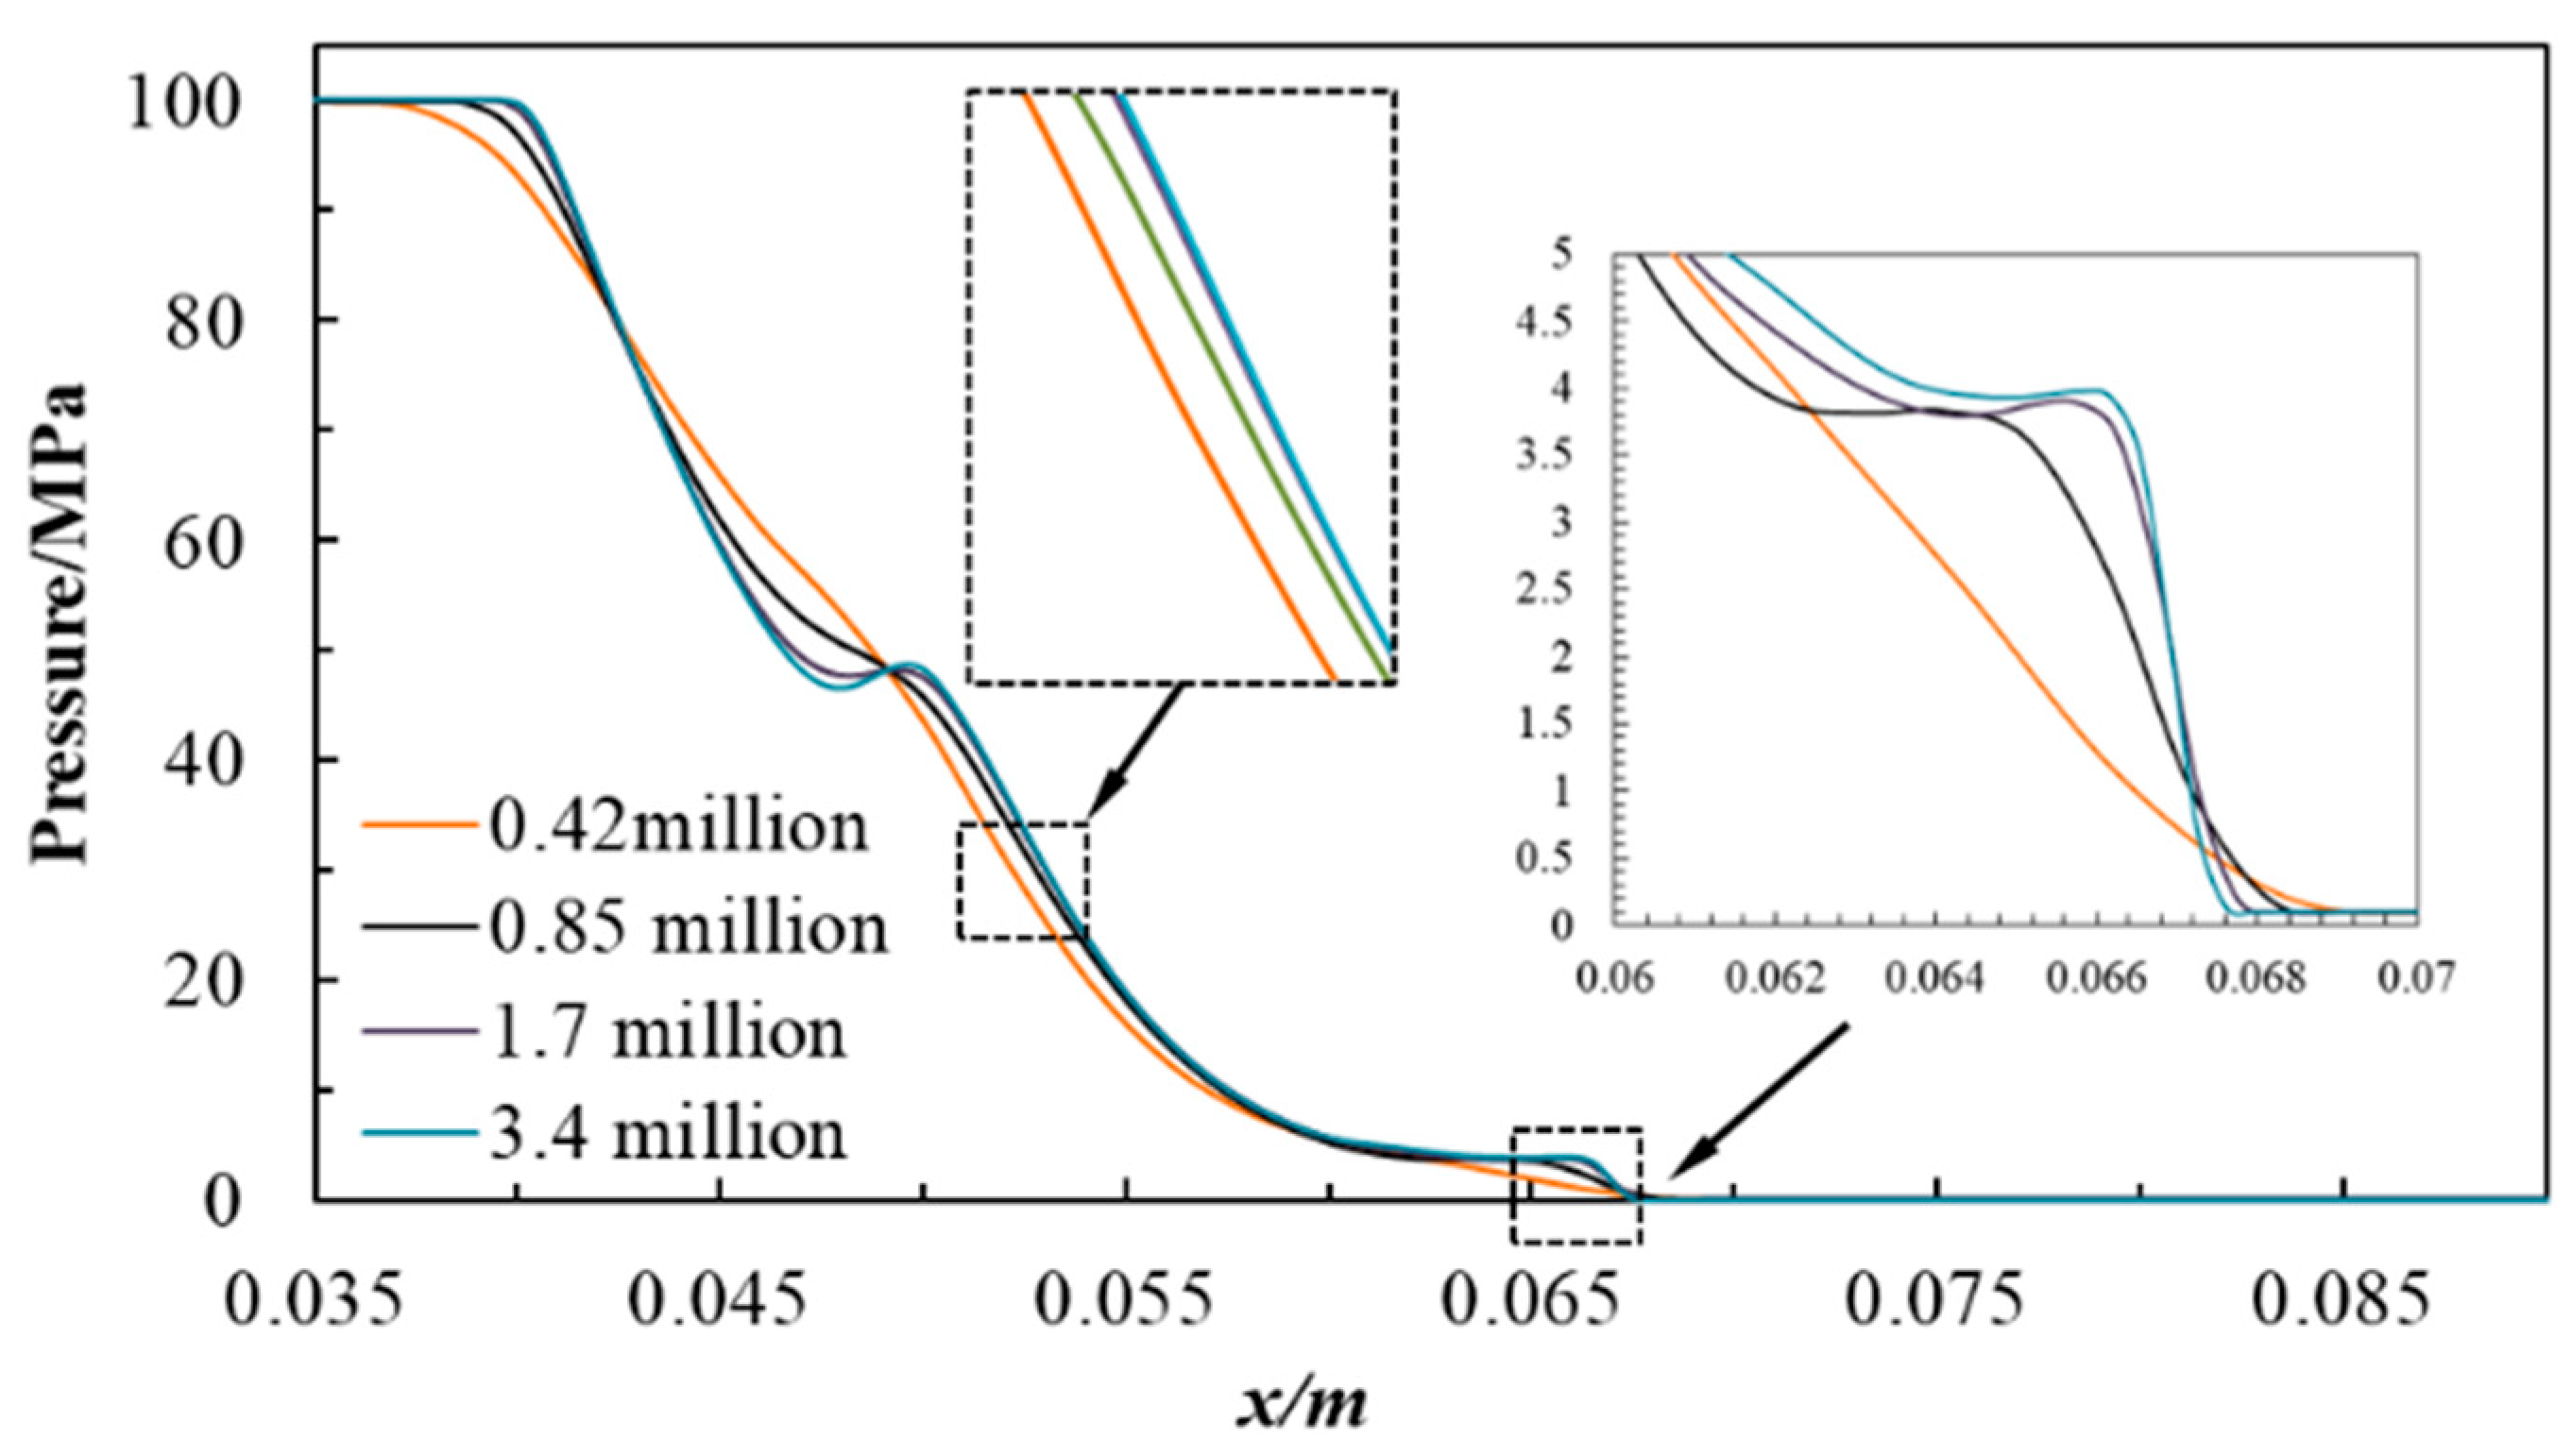
In addition, grid independence was utilized, in order to ensure the accuracy of the numerical method. As shown in Figure 3, when the grid size increased from 1.7 million to 3.4 million cells, the pressure along the axis profile showed only a tiny deviation, and the shockwave front was captured accurately. Therefore, a grid size of 1.7 million was considered sufficient for our purposes.

2.2. Governing Equations of the Simulation

As a compressible fluid, developing a supercritical CO2 fluid involves heat transfer. Therefore, the continuity, momentum, and energy equations must be solved. In addition, this study assumes that the influence of gravity can be ignored. Thus, the conservation equations for mass, momentum, and energy are given by:
ρ t + ρ u i x j = 0 ,
ρ u i t + ρ u i u j x j = P x i + τ i j x j ,
ρ h t + ρ u i u j x j = x i ( α e f f h x i ) + D p D t + τ i j u i x j ,
where t denotes time, ρ denotes density, P denotes static pressure, ui denotes the ith component of the time-averaged velocity, and xi represents the ith co-ordinate (i = 1, 2, 3).
For simulation of the high-speed impacting jet, the realized k–ε model is generally written as:
ρ d k d t = x i [ ( μ + μ t σ k ) k x i ] + G k + G b ρ ε Y M ,
ρ d ε d t = x i [ ( μ + μ t σ ε ) ε x i ] + ρ C 1 S ε ρ C 2 ε 2 k + v ε + C 1 ε ε k C 3 ε G b .
In this case, the model constants in the model equation are set as C1ε = 1.44, C2ε = 1.91, C3ε = 0.09, σk= 1.0, and σε = 1.3. These values have been determined from experiments for fundamental turbulent flows. They have been found to work fairly well for a wide range of flows.

2.3. Real Gas Model for CO2

The EOS for the CO2 is even more critical than the turbulence model for compressible fluids [20]. In the trans-critical state, the state parameters of CO2 vary drastically, especially in the shockwave. The required physical parameters can be accurately obtained using the S-W state equation. The standard software provides built-in EOSs, such as critic EOSs and more complex EOSs from the NIST REFPROP; however, there is a tiny area below the triple point, in some cases. The UDF (user-defined function) embeds un-defined physical property parameters, such as density and capacity, in the software. Polynomial fitting was used to calculate the thermal conductivity k, and Sutherland’s viscosity law was used to calculate the viscosity. The state equation of S-W, as can be found in the relevant literature, predicts the properties of CO2 with higher accuracy in gaseous and supercritical states. The S-W EOS is described by:
A ( ρ , T ) R T = φ ( δ , τ ) = φ 0 ( δ , τ ) + φ γ ( δ , τ ) ,
where δ = ρ/ρc and τ = Tc/T, with ρc = 467.6 kg/m3 and Tc = 304.13 K. The formulations that describe the Helmholtz energy’s ideal-gas energy are given in Equation (7), and the residual part of the Helmholtz energy is Equation (8):
ϕ 0 ( δ , τ ) = ln ( δ ) + a 1 0 + a 2 0 τ + a 3 0 ln ( τ ) + i = 4 8 a i 0 ln [ 1 exp ( τ θ i 0 ) ]
ϕ τ ( δ , τ ) = i = 1 7 n i δ d i τ d i + i = 8 34 n i δ d i τ d i e δ c i + i = 35 39 n i δ d i τ d i e a i ( δ ε i ) 2 + i = 40 42 n i Δ b i δ e c i ( δ 1 ) 2 D i ( τ 1 ) 2
In the formulation, Δ = { ( 1 τ ) + A i [ ( δ 1 ) 2 ] 1 / ( 2 β i ) } 2 + Β i [ ( δ 1 ) 2 ] a i , δ is the (dimensionless) density, and τ is the (dimensionless) temperature. The coefficients a i 0 and θ i 0 are given in Table 1.

2.4. Simulation Methodology

The CFD software FLUENT was used to simulate the CO2 jet process. After blasting, due to the decrease in pressure, SC-CO2 is transformed into gaseous CO2. During the non-expansion of CO2 released from CO2-PB, the phase transitions from liquid to supercritical and supercritical to gaseous throughout the simulation process. The entire process is considered to be continuous, regardless of the influence of phase transition enthalpy. In some cases, the local solidification phenomenon has a negligible effect on the whole, and can be ignored in the calculation. The solver used the double-precision density-based coupled solver. No-slip velocity and adiabatic boundary conditions were set at the wall boundaries.
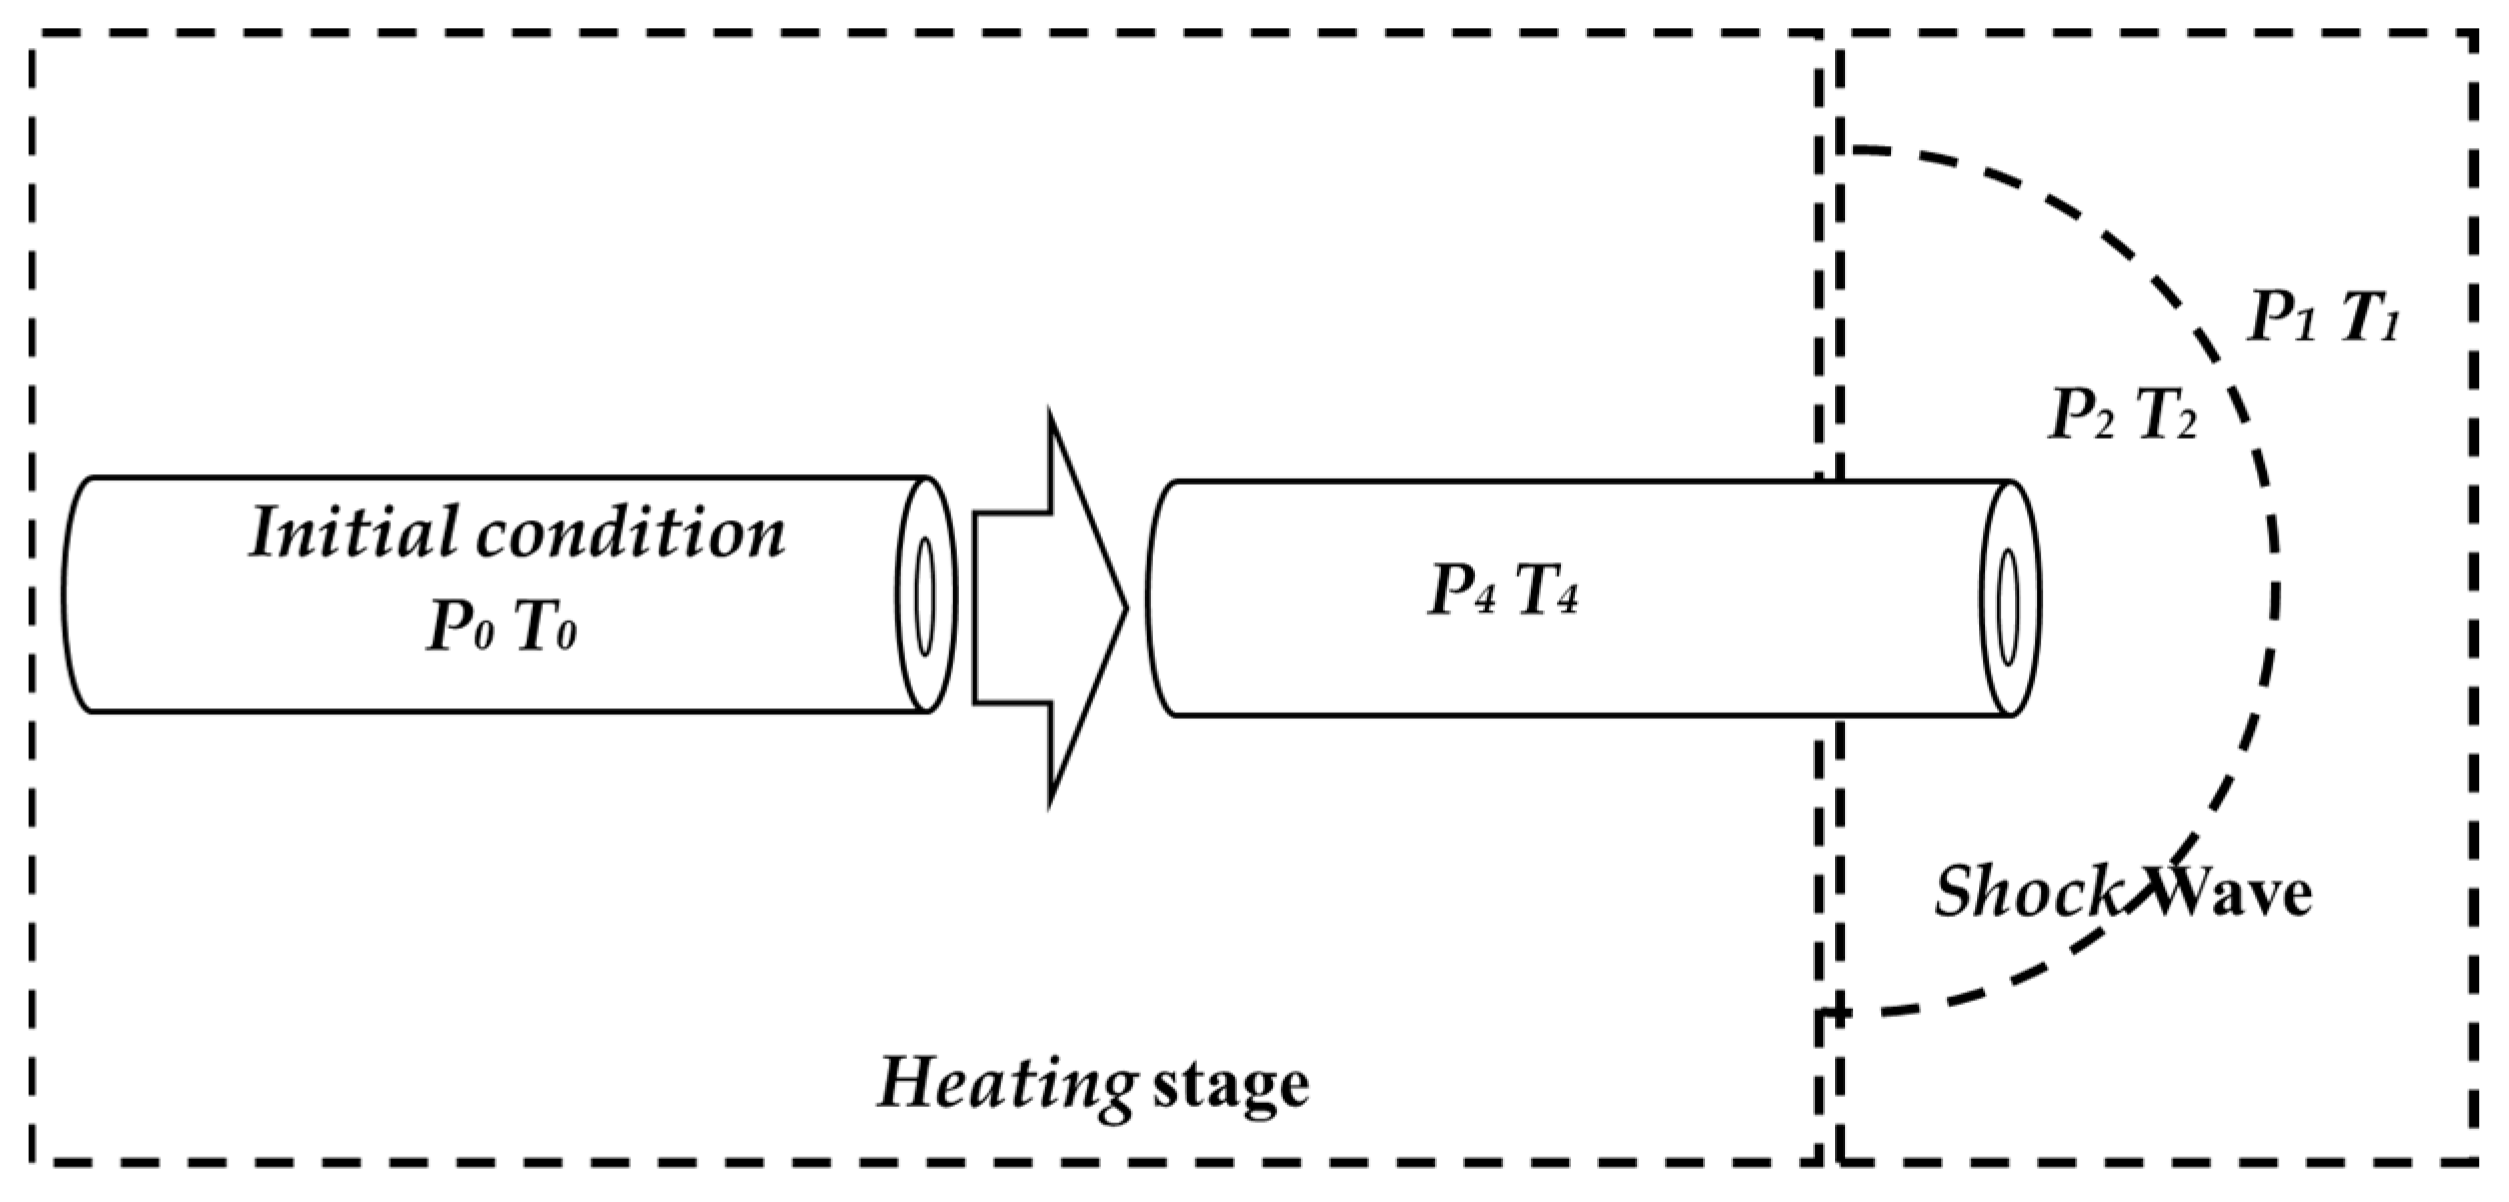
The schematic diagram of the whole CO2-PB process is shown in Figure 4. As can be seen from the figure, the whole process can be divided into heating and release stages [27]. In the heating stage, the filling pressure (P0) of CO2 in the tube was about 1–10 MPa. The initial parameters (P4 and T4) of CO2 during the phase transition blasting were obtained in the simulation process by the EOS of S-W (Equations (6)–(8)). When the filling pressure (P0) was 7 MPa and the blasting pressure (P4) was about 100 MPa, the instantaneous temperature was about 549 K. The shockwave is mainly affected by the initial state of the CO2-PB, the genomic structure, and the orifice-to-target distance. The atmospheric pressure was set to standard atmospheric pressure in the simulation.

2.5. Calculation of the Shockwave

The critical problem in CO2-PB is obtaining the relationship between the pressure and the time course. In the early stage, when the highly unsteady under-expanded jet occurs, the pressure potential energy of SC-CO2 entering the near-field is quickly transferred into other energy forms, such as kinetic energy and sound energy, due to the enormous gap between the pressure in the vessel (P4) and that in the ambient environment (P1). The one-dimensional well-known shock tube equation for an ideal gas is as follows [28]:
P 4 P 1 = [ 1 + 2 γ 1 γ 1 + 1 ( M s 2 1 ) ] [ 1 γ 4 1 γ 1 + 1 a 1 a 4 ( M s 1 M s ) ] 2 γ 4 γ 4 1 ,
P 2 P 1 = 1 + 2 γ 2 γ 2 + 1 ( M s 2 1 ) ,
where α is the speed of sound, γ is the specific heat ratio, MS is the maximum Mach number, and other primary data were calculated using the S-W EOS. Equation (9) gives the maximum MS in the flow field produced by the pressure.
After the energy-releasing sheet is destroyed, it does not immediately form a shockwave locally, but accumulates at a certain distance from the outlet. The initial distance of the shock is represented by the symbol Rso. The pressure orifice is assumed to be completely ruptured when it reaches this specification. The initial position of the shockwave in the direction of the pressure port can be calculated as follows [29]:
R S O = [ 3 L C ( 1 f ) V t u b e 4 π L 0 ] 1 / 3 ,
where Vtube is the volume of CO2-PB, LC is the diameter of the pressure relief port, L0 is the tube length, and f is the filling volume fraction of liquid carbon dioxide. When the initial shockwave is formed, it decays rapidly as time and distance increase. When the shockwave decays in a hemispherical shape in free space, according to this model, the attenuation is calculated as:
Δ P s Δ P s t = [ R R 0 ] n ,
where n is the attenuation coefficient. The one-dimensional shock tube equation can determine the over-pressure in the near-field, and the attenuation index of the shockwave intensity is determined by the spherical method. The intensity of the shockwave and its attenuation intensity with distance can be calculated through use of the methods mentioned above.

3. Result and Discussion

3.1. Development of the Free CO2 Flow

3.1.1. Starting Transient Evolution and the Shockwave

In the early stage, the first significant fluid load on the rock surface is induced by a blast shockwave within a short period [30]. According to the simulation results, the flow field structures are similar at different flow conditions. A set of working conditions were selected for analysis.
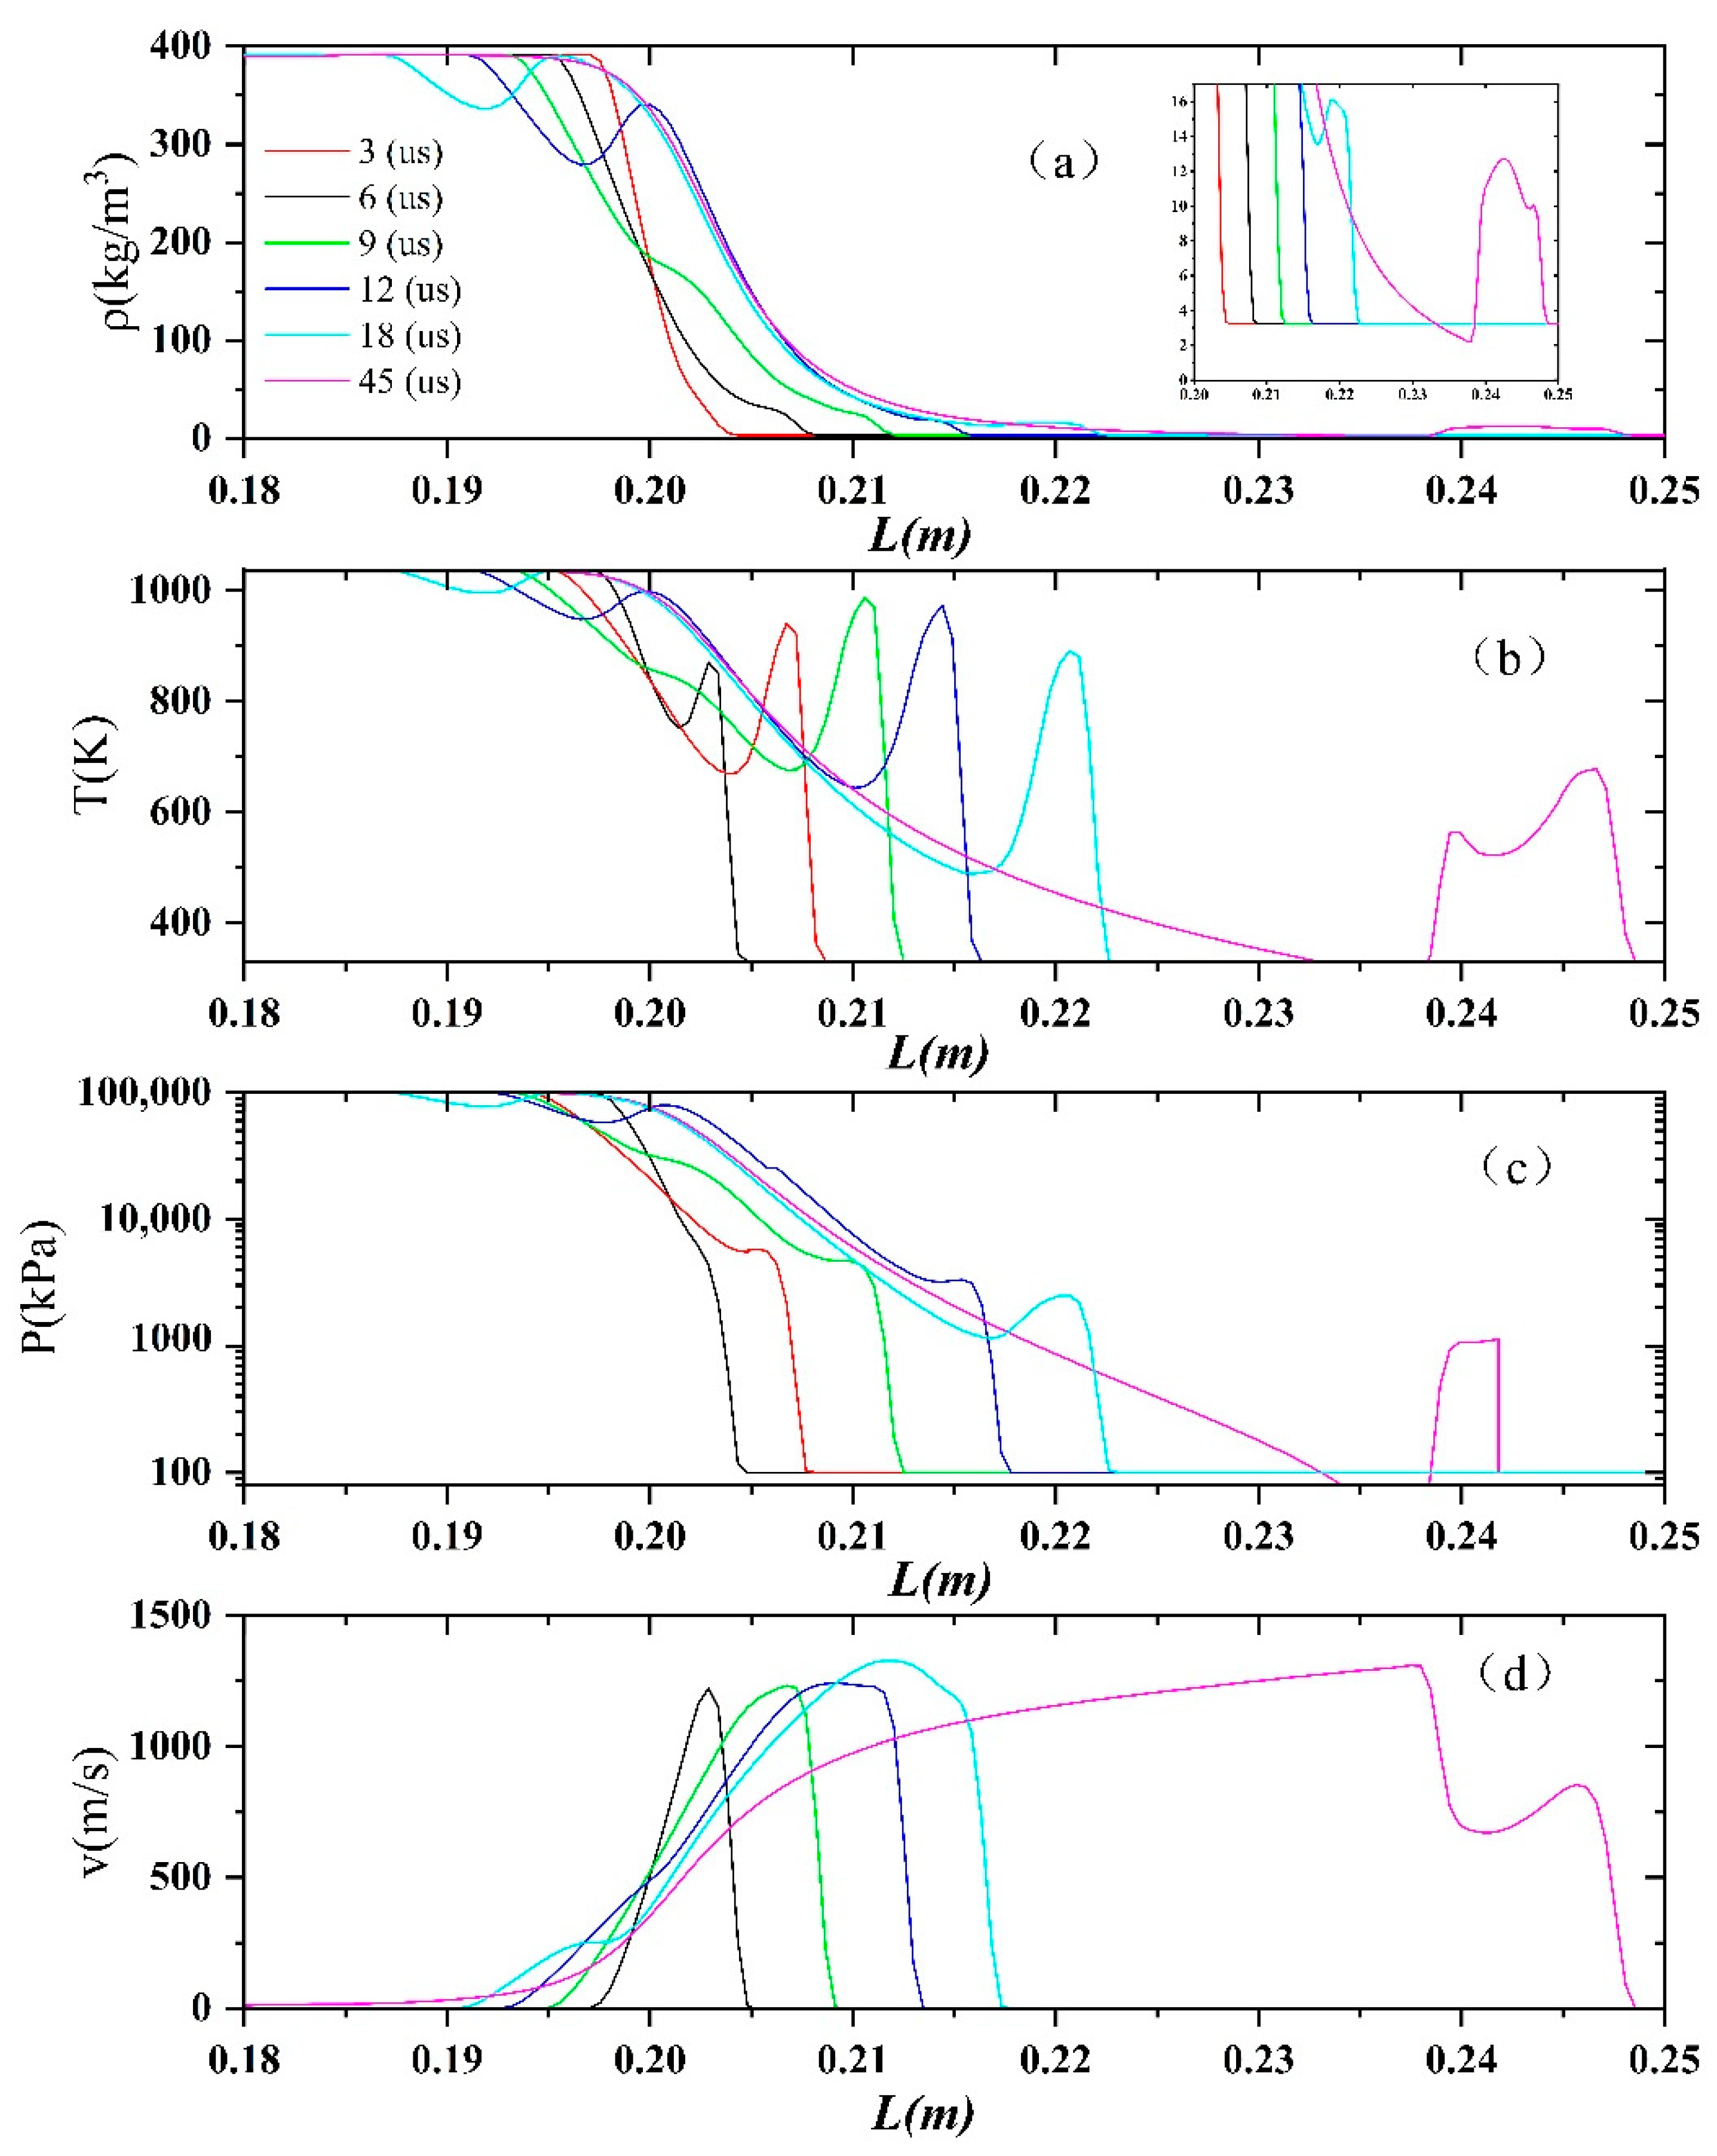
Figure 5 shows the jet density, temperature, pressure, and velocity curve, in the initial stage, along the centerline. At the transient start of the jet, due to the strong compression, the local temperature, density, and pressure increase dramatically close to the exit. When the ratio of vessel pressure to ambient pressure P4/P1 is equal to 1000, the initial shockwave and the position of the compression wave can be seen at about 6 μs, which gradually diffuses in a hemispherical shape with the advance of time. The leading shockwave is extreme at the beginning, and the initial shockwave is similar to the ideal shockwave. Previous research obtained the location and development process of shockwave through simulation and experiment. The CO2 flow out of the nozzle rapidly becomes supersonic after release. The flow becomes stronger until it reaches the Mach disk where it is changed to subsonic flow. Considering multi-dimensional expansion of the gas, the peak value of the shockwave moves and decays rapidly. It travels a distance of 4 cm in 45 μs and compresses backward at the same time. A feature of this result is that the shockwave is significantly lower than the driving gas pressure to the ambient pressure (P4/P1), limiting the maximum shockwave over-pressure that can be obtained. As shown in Figure 5b, when the pressure in CO2-PB reaches 100 MPa, the shockwave P2 is about 4.25 MPa. At the same time, the temperature can reach 950 K, as shown in Figure 5c. The temperature, density, and velocity of flow decrease with the dramatic pressure change across the shockwave.

3.1.2. Development of the Free CO2 Flow Field Structure

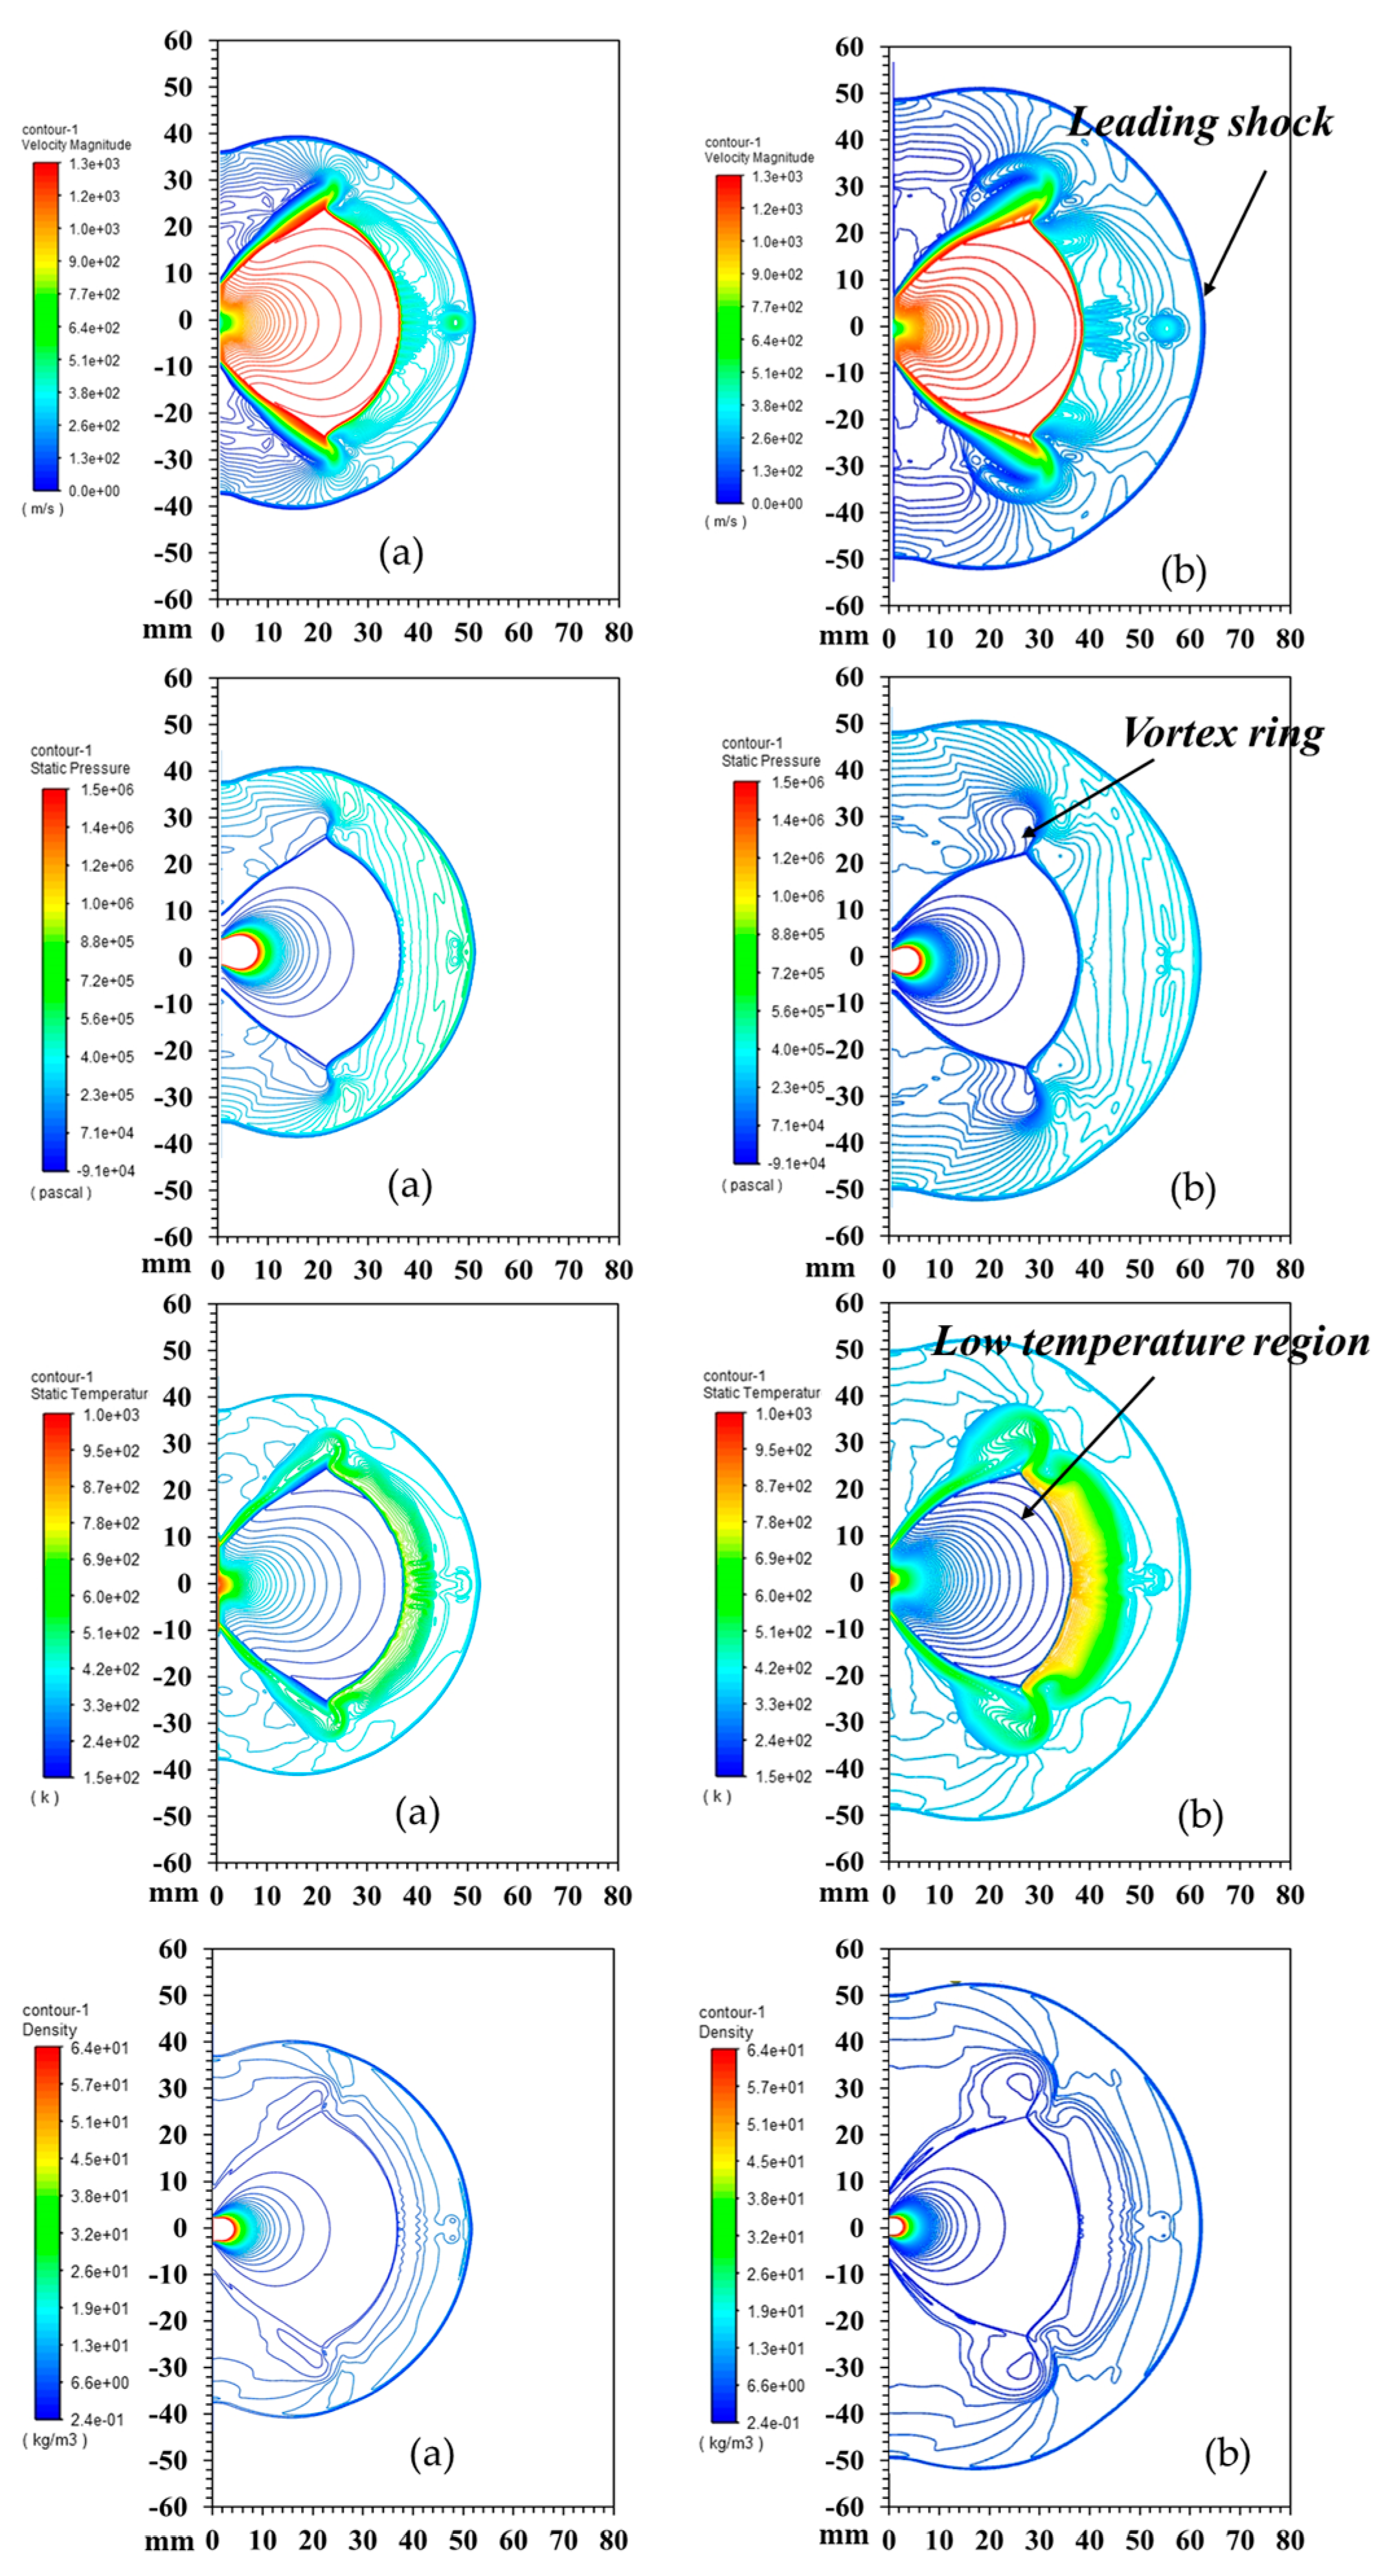
Figure 6 shows the flow field of the CO2 jet at t = 80 μs and t = 200 μs. The structures of the pressure, temperature, density, and velocity fields are similar. The shockwave spreads downstream as the divergence angle increases, and the outline is no longer streamlined. The CO2 along the jet leads to highly complex vortex rings and complex interacting shocks. Shortly after release, a Mach disk and a barrel shock appear, and the flow pattern remains the same. The Mach disk and the barrel shock exist similarly.
When t = 200 μs, the structure of the entire flow field can be divided into several apparent regions. The area behind the leading shockwave is the mixing zone of the expansion products. The gas near the shockwave is compressed to generate aerodynamic heat, and the temperature and pressure increase significantly. With gradual diffusion, the increase in volume reinforces the shockwave intensity, while the temperature is rapidly weakened. As shown in Figure 5c and Figure 6, the temperature reaches a peak at about 9 μs, then begins to decline rapidly. Therefore, the temperature at the front is not very high after a few microseconds. Behind the mixed area, a large Mach number is formed, due to the high-speed expansion of the gas, reaching a maximum value at the front of the outer ring. The conversion of supercritical CO2 into gaseous carbon dioxide and its expansion process mainly occurs in this area, while its temperature, density, and pressure gradually decrease. The excessive expansion in this area leads to the absorption of a lot of heat from the surrounding environment, thus producing a significantly low-temperature area [23]. With a low initial temperature, dry ice may even be lower than the triple point, and a negative pressure area may be generated at low pressure. Under the considered working conditions, it can be seen that the low-temperature area gradually expands, with about 290 K after 200 μs appearing in the outer marginal region. Previous experimental and simulation studies have reported similar structures at the transient start of a highly under-expanded jet [31].
Unlike the large amount of explosion heat generated by the blasting explosives, CO2-PB produces a low-temperature region in the expansion area, due to the heat absorption effect, making the entire temperature field lower, which is also one of the characteristics of physical blasting. Through experimental tests, Tian [32] also obtained an instantaneous low temperature during the blasting process.

3.1.3. Mach Disk Stabilization

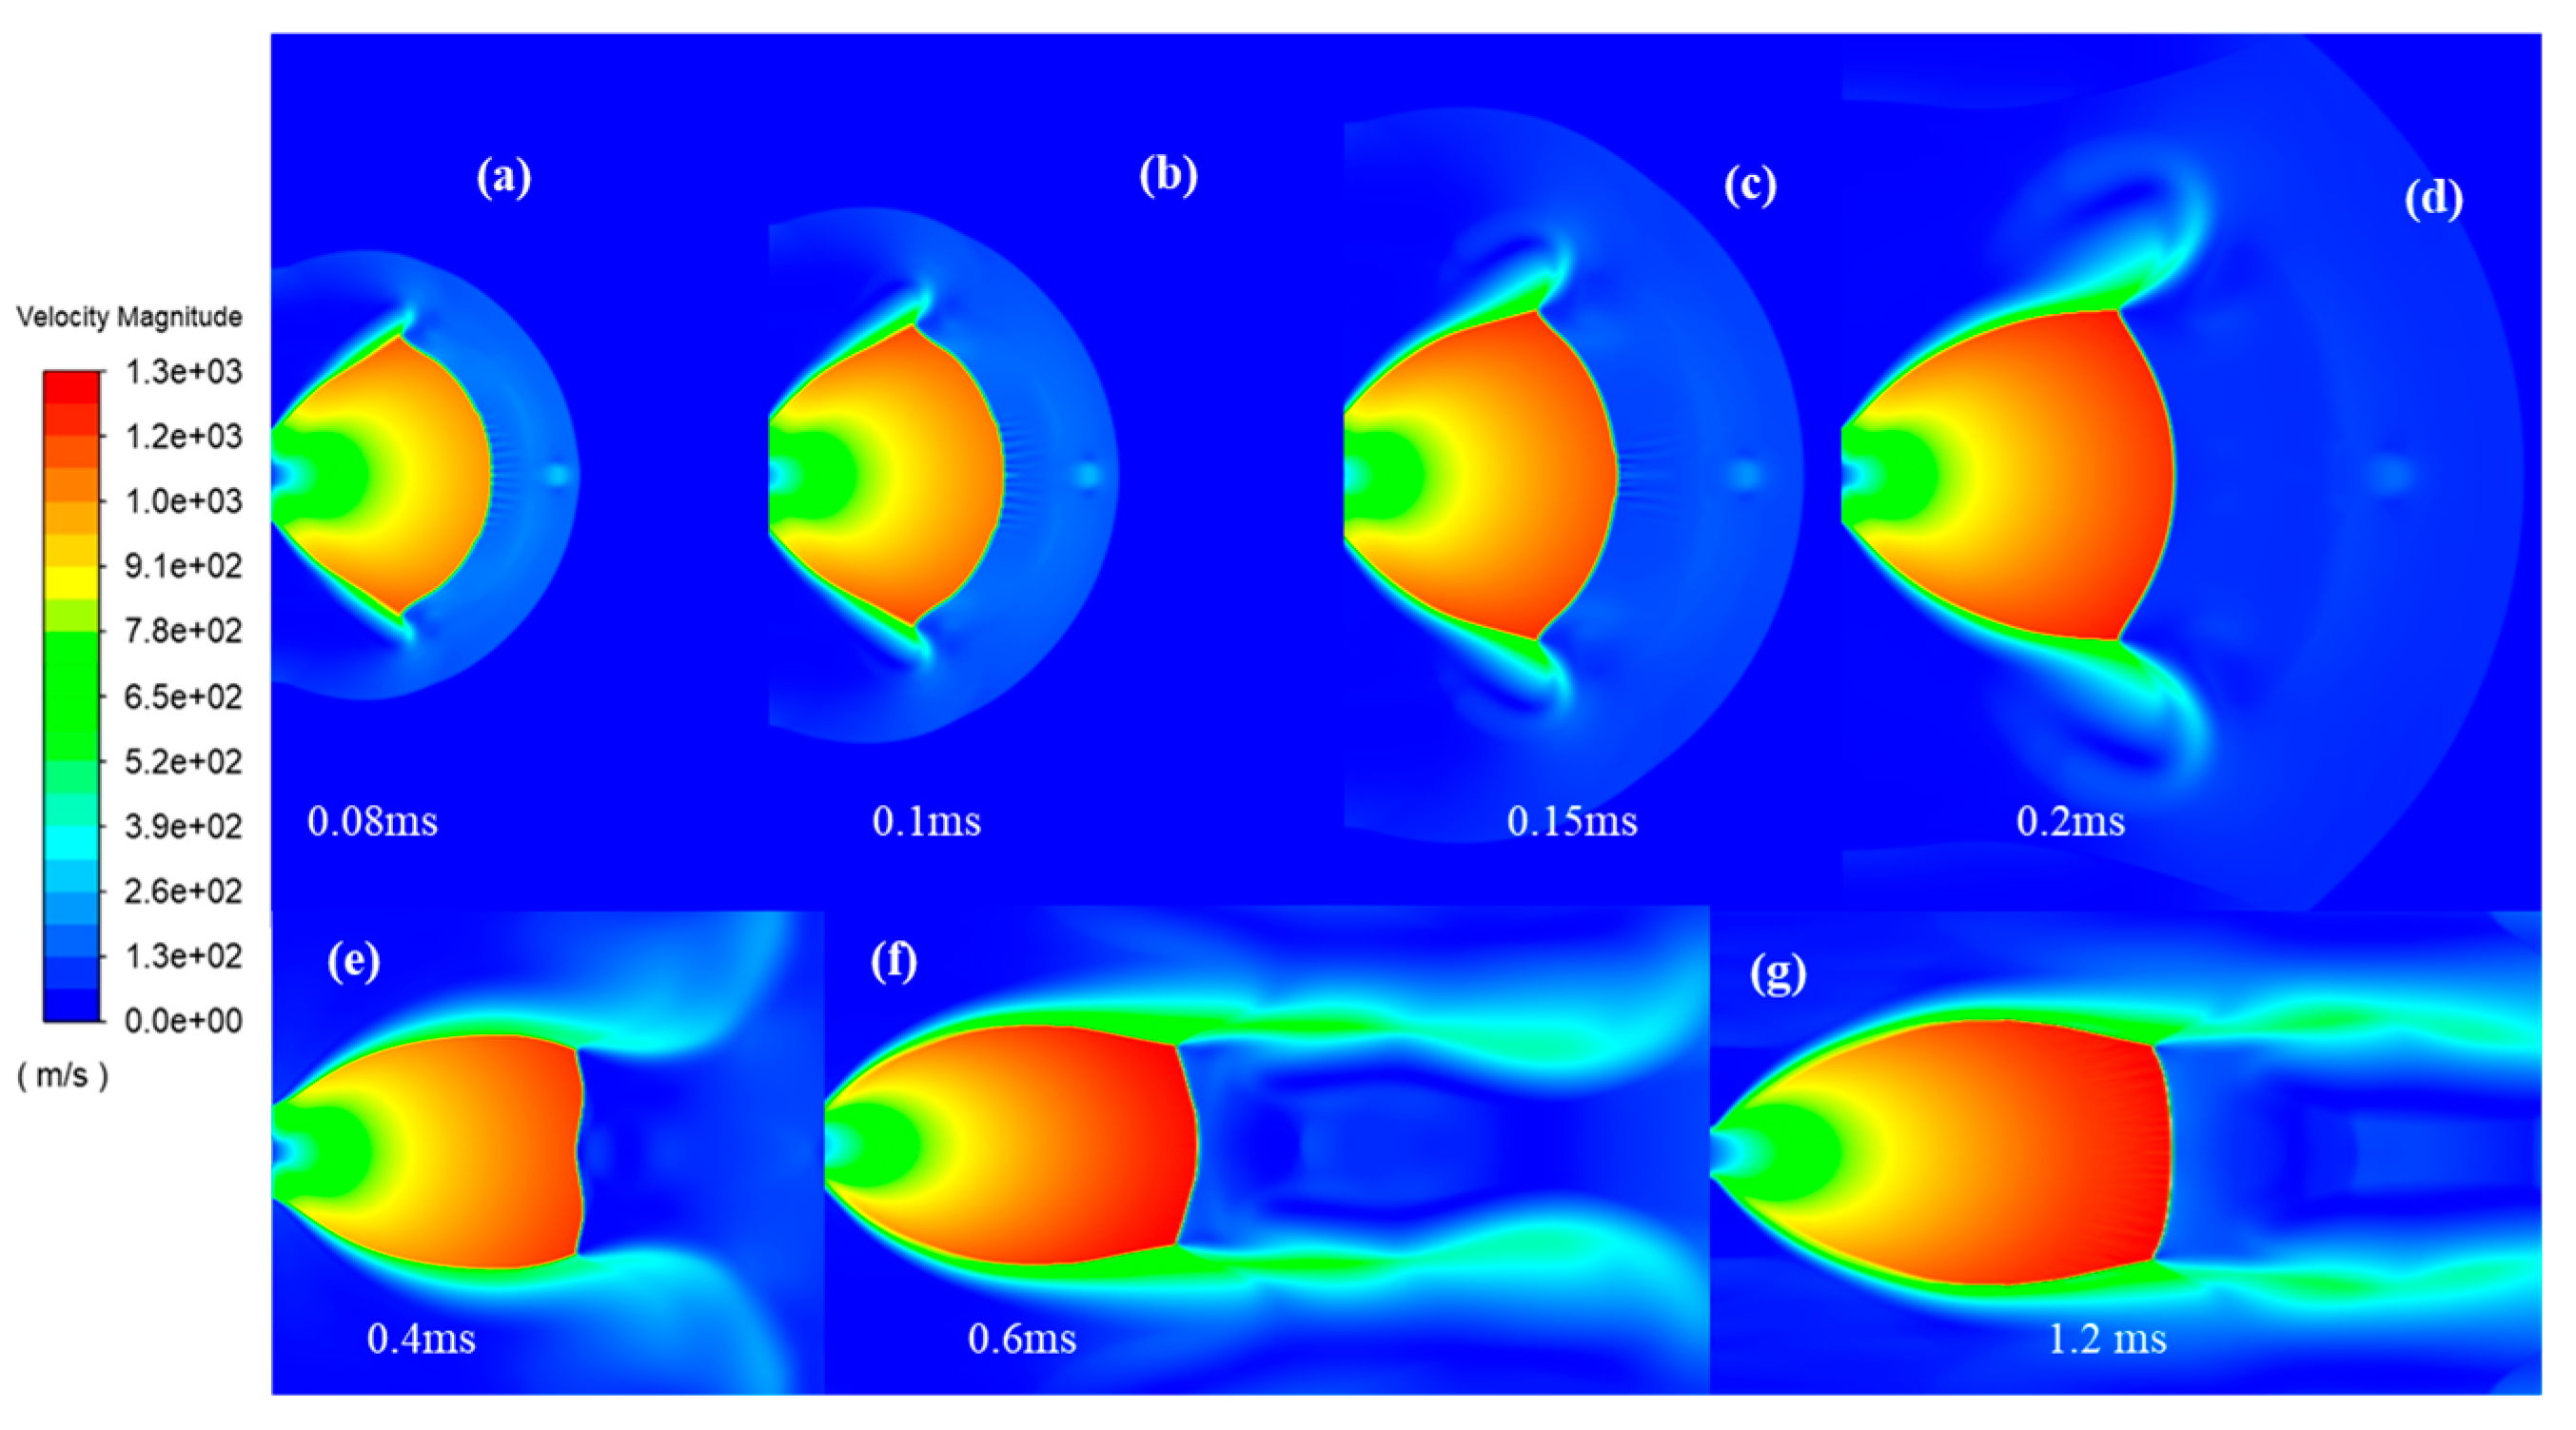
In the next stage, the flow structure consists of an initial curved shock region, where the slip line of the expanding jet flow is curved back to the axis, due to a reflected shock. The Mach disk forms at a stable location. Figure 7 shows the development of the flow field near the CO2-PB releasing sheet. As time progresses, the jet flow develops and gradually spreads downstream. The Mach disc is the symbol of the under-expanded jet. At about 600 μs, the Mach disk forms, the flow field near the energy-releasing sheet exit almost finishes, and vortices become characteristic of the flow (instead of shocks). The evolution of the jet has come to a dynamically stable state, and lasts for some time. Due to the high P4/P1 value, the Mach disk becomes convex [31]. It can be seen that the Mach disk oscillates back and forth at a stable location. The location of the Mach disk can be calculated as:
x m = 0.6455 d e P 4 P 1 ,
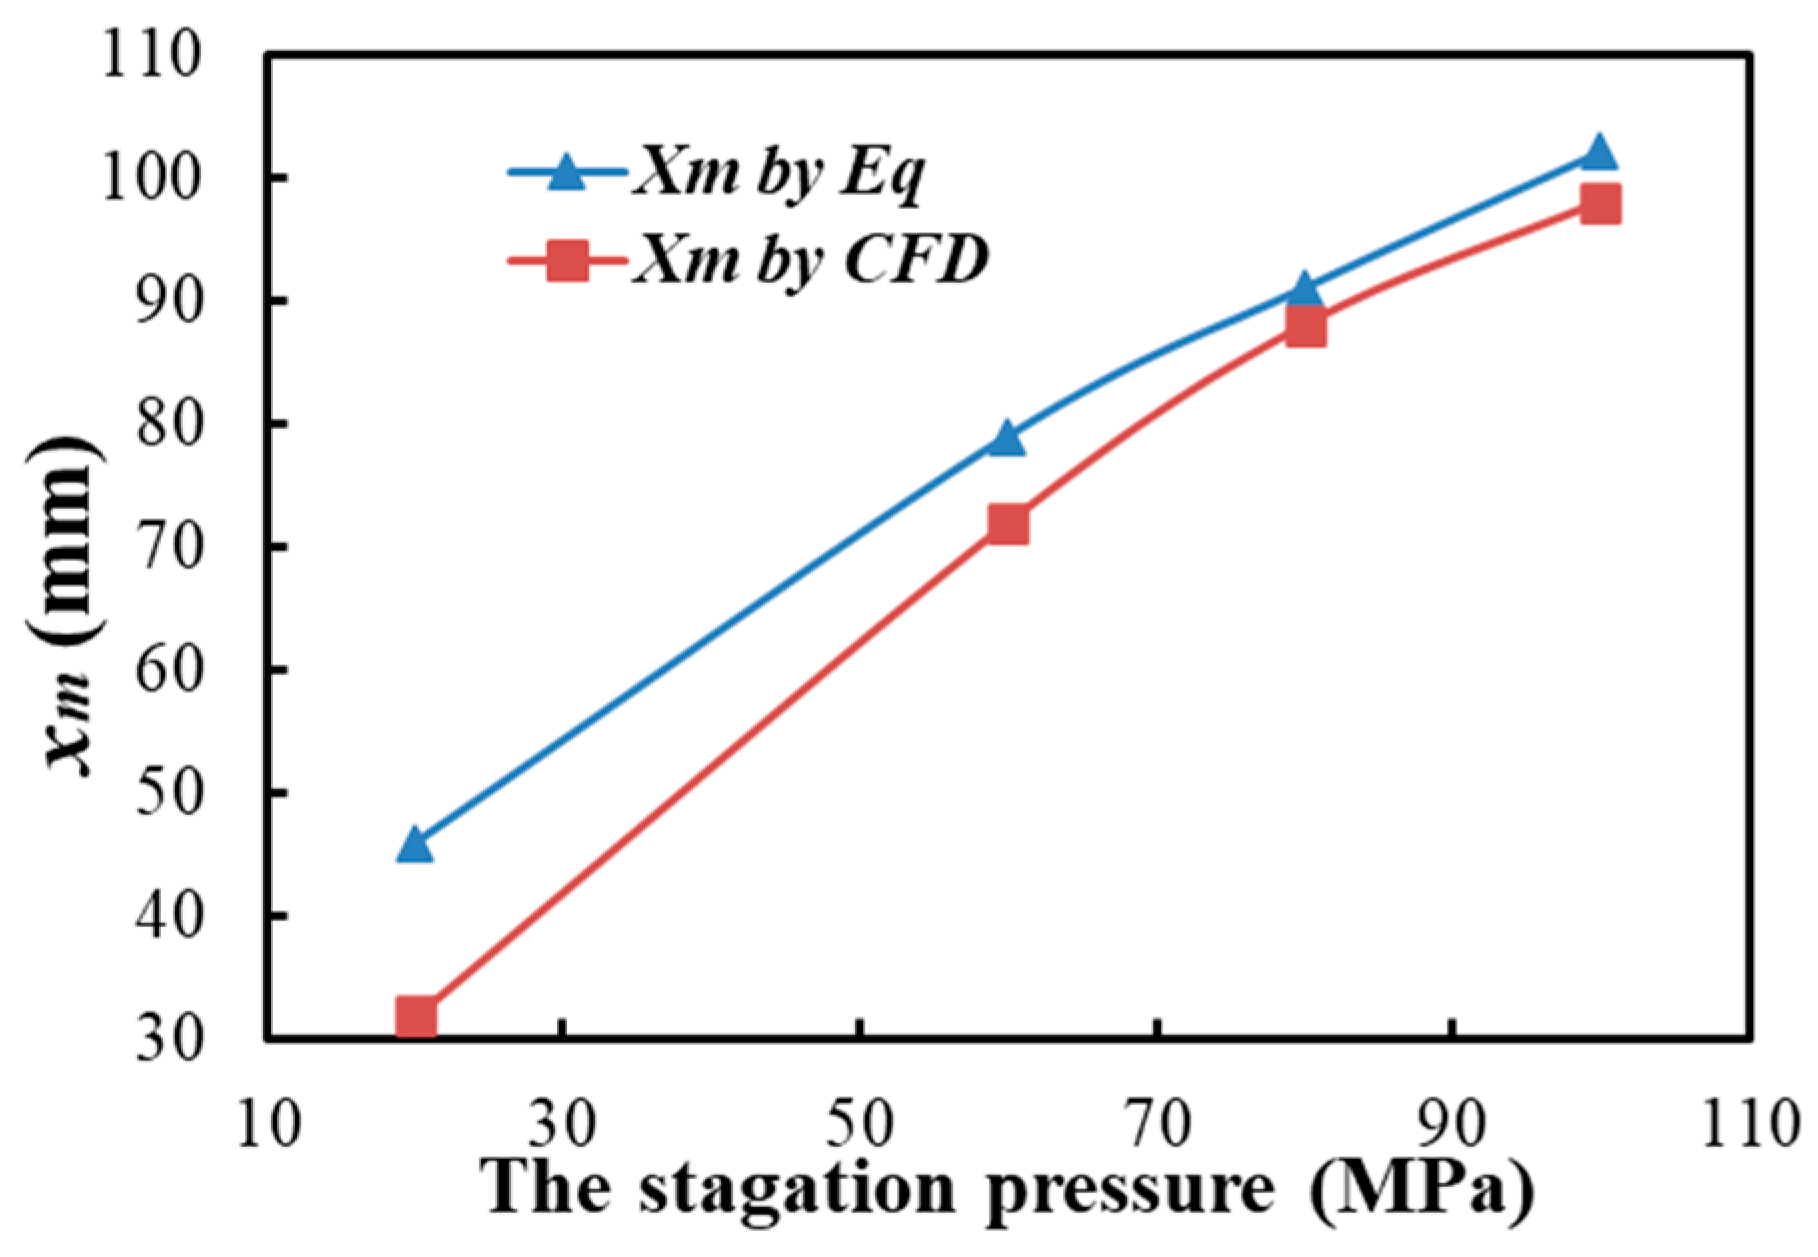
where de is the diameter of the nozzle, P4 is the stagnation pressure, and P1 is the ambient pressure. The distance xm and the diameter de increase as the stagnation pressure is raised. Figure 8 gives the location in the simulation against the result, as calculated by Equation (9).
The results show that the Mach disk increases with an increase in stagnation pressure, and that the simulation and theoretical results are in good agreement. The simulated value is slightly smaller than the calculated value, while the difference in xm decreases rapidly as the stagnation pressure increases. The simulation result is capable of representing under-expanded CO2 jets, showing a realistic flow structure. After the steady jet continues for about 0.3 ms, the Mach disk gradually becomes smaller, indicating that the pressure gradually decreases as the jet continues.

3.1.4. Factors Influencing the Pressure Characteristics

As shown in Figure 9a, the trend of the initial pressure ratio vs. the over-pressure value is close to linear. When the value of P4 increases from 20 to 150 MPa, ∆P/P1 increases from 11 to 56. The blasting pressure is critical in the process under the same initial conditions. Increasing the initial pressure value before the CO2-PB blast can significantly increase the peak value of the shockwave. Under the same initial filling conditions, the CO2-PB pressure drop plays a significant role in the kinetic energy of the jet, which directly influences the characteristics of the jet’s impact. As the ambient pressure is constant, the pressure generated by blasting is dependent on the specifications of the energy-releasing device.
Increasing the filling volume reduces the peak shock pressure, to a certain extent. A lower filling volume requires a higher temperature under the same pressure, making the initial shockwave pressure more significant. At the same time, the increase in filling pressure is negatively correlated with the increase in shockwave formation distance. When the filling volume increases from 50% to 100%, the peak fracturing is reduced by 20.2%. An increase in the filling pressure leads to a decrease in the impact distance, thus making the impact range smaller.
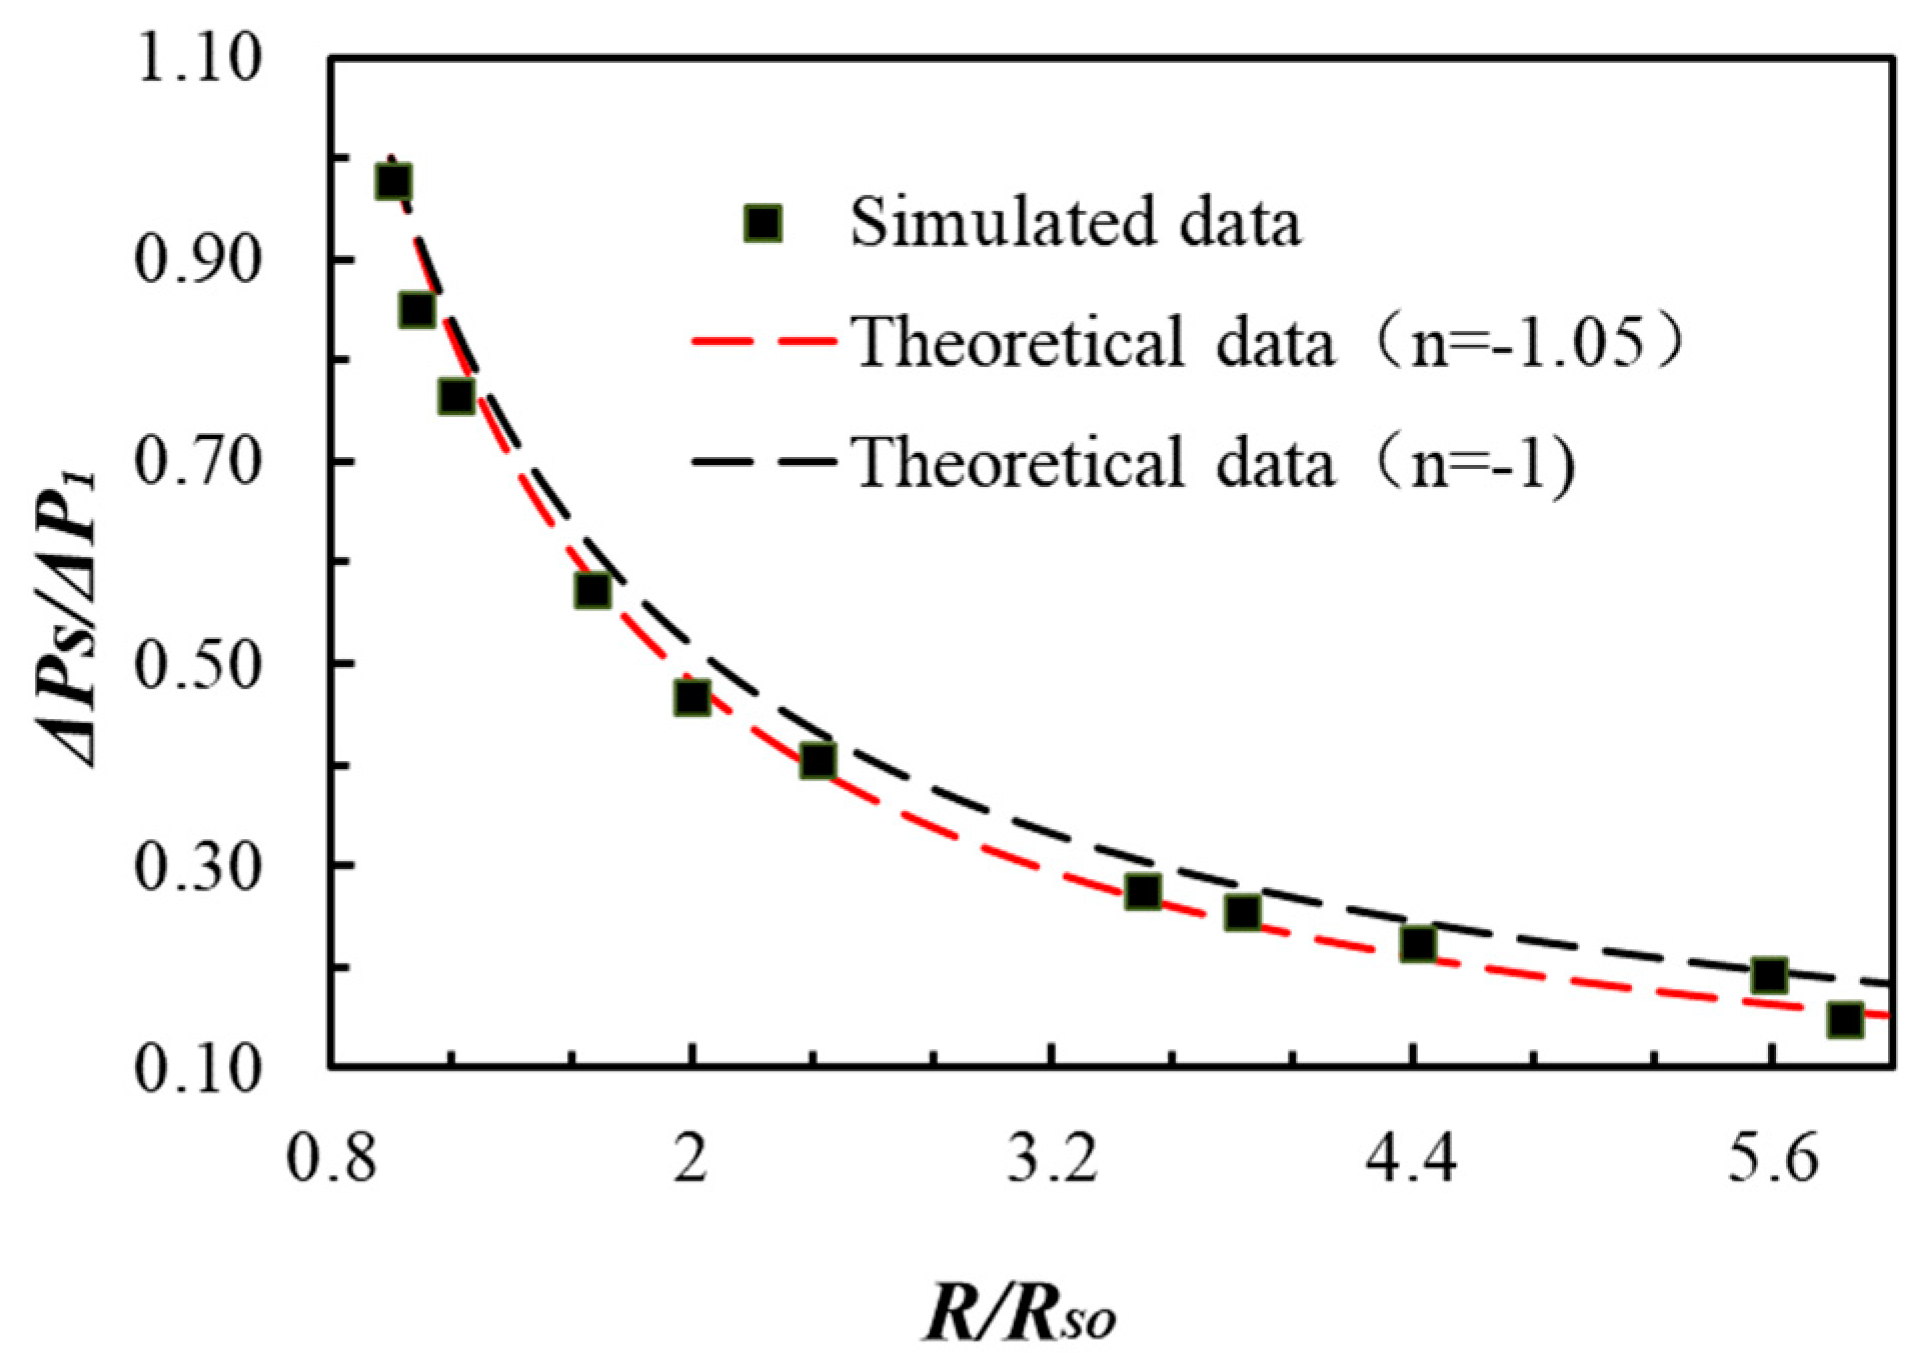
Only the distance and the peak over-pressure combination can provide a meaningful comparison and evaluation of blast shockwave hazards. A comparison between the calculation and simulation results is shown in Figure 10. The analysis is based on a physics model, not only a curve fitting. Generally, n ranges between −0.9 and −1.2. The results show that, when n is between −1.05 and −1, the theoretical value can better match the simulation results. This calculation does not require an analysis of the energy or other loss adjustment factors [25]. As the distance increases, the peak value of the shockwave decays rapidly. The data suggest that, as the distance increases from 1 to 5, the dimensionless overpressure decreases from 1 to 0.23 (i.e., by 77%). For comparison, under the condition of rupture device filling, this distance is about 5–10 cm, and the effective crushing range of reinforced concrete caused by shockwave over-pressure is in the range of about 0.1–0.2 MPa [3,33].

3.2. Stagnation Properties of CO2 Impacting Jet

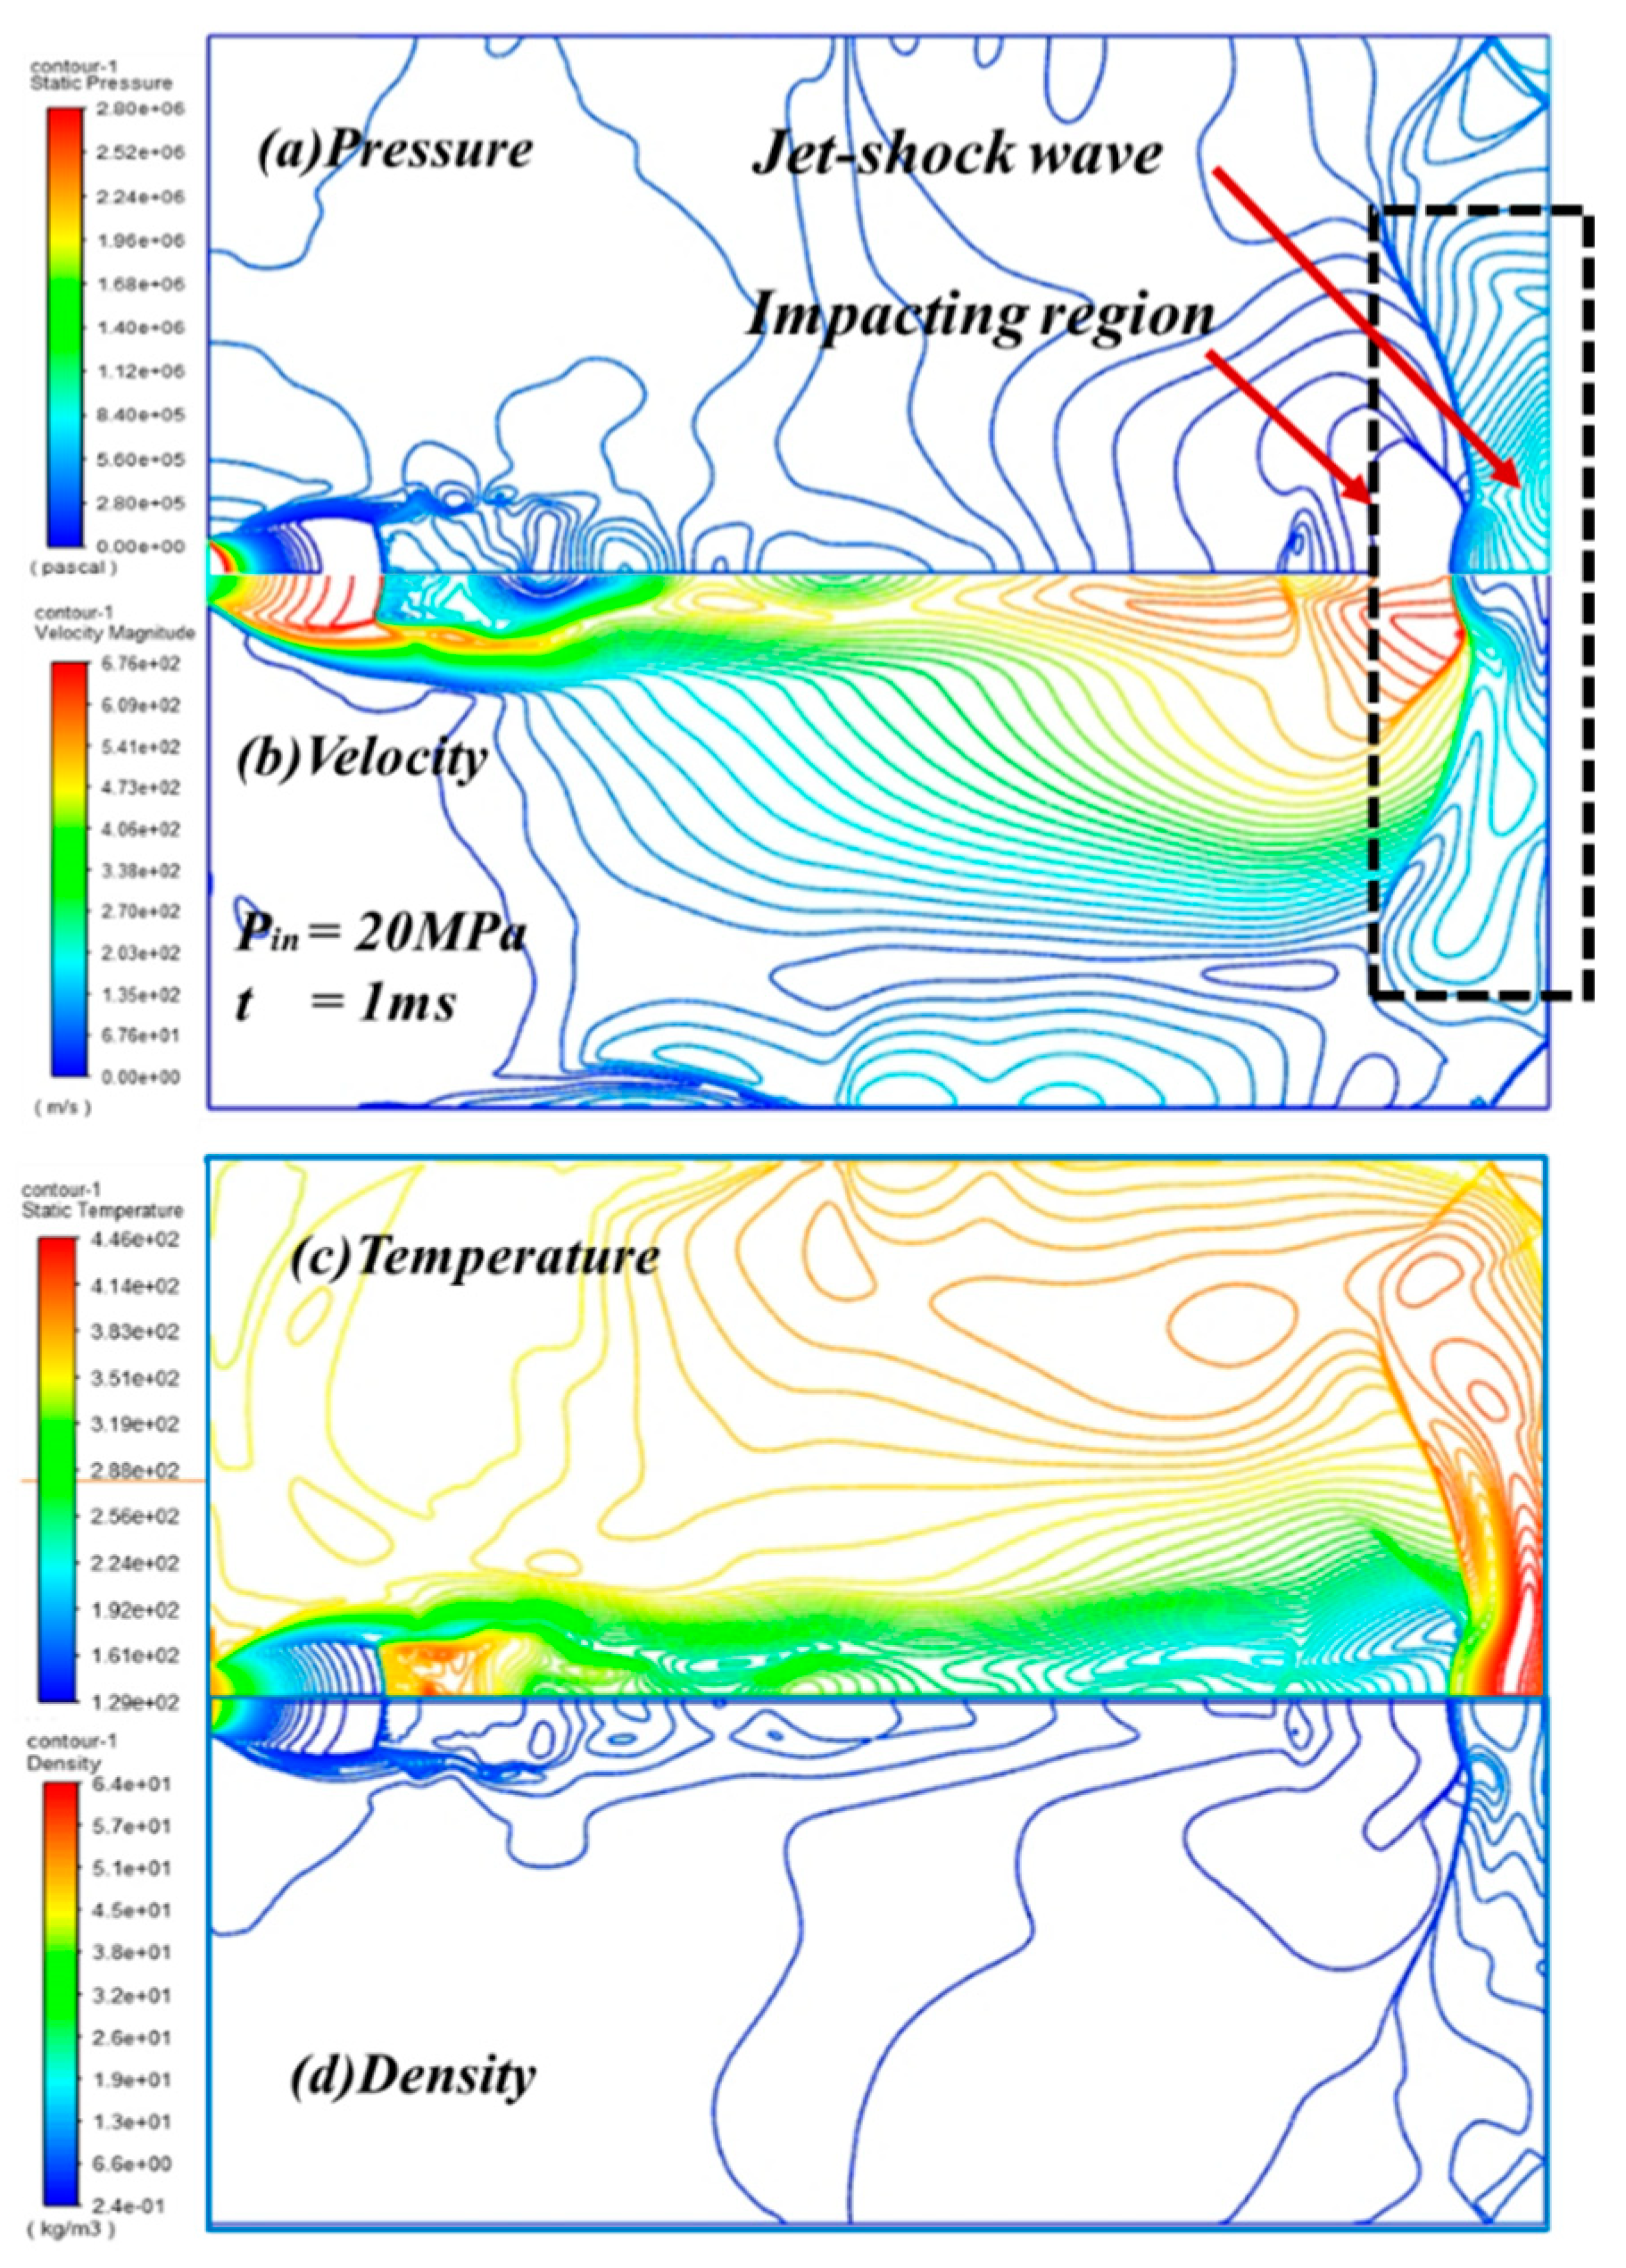
The jet fluid dynamic pressure is converted into static pressure at the impact wall. The fluid is strongly compressed near the wall. When t = 1 ms, the pressure field of CO2 jet distributions on the wall is shown in Figure 11a. The initial pressure P4 is 20 MPa. The reflected shockwave can be clearly seen. Due to the compressibility of the CO2 fluid, the wave reflected from the impact surface is superimposed. Due to the continually compressed and expanded CO2, pressure oscillations occur. The temperature of the jet on the wall is shown in Figure 11c, with the jet impacting the wall generating an obvious thermal effect. The velocity field, pressure field, temperature field, and density field are similar.
As shown in Figure 12, monitoring points on the centerline near the surface were set, in order to obtain the pressure–time curve in different cases. In the early stage, strong compression is formed at the surface of the shockwave, resulting in a high-pressure peak value (Figure 12b). When t > 0.4 ms, the jet stagnation pressure (Ps) ultimately stabilizes, at about 17 MPa. After about 0.45 ms, it gradually decreases and oscillates within a specific range. When the initial pressure (P4) is increased from 10 MPa to 20 MPa, the jet produces a higher apparent peak value near the wall, increasing from 0.68 MPa to 3.64 MPa. This is due to the generated shockwave being repeatedly reflected and superimposed on the near-wall surface, resulting in a higher shock pressure peak. In the stable stage, the stagnation pressure in the center remains at a certain level for some time, with an average value of 8.37–17.25 MPa. Increasing the pressure produces a higher impact peak value and a higher pressure value throughout the stage, significantly improving the blasting efficiency. Increasing the filling volume can allow the pressure on the wall to last for a longer time at a higher stagnation pressure, significantly increasing the rock-blasting efficiency of the jet. When the CO2-PB length (L) increases from 5 to 10 cm, the time of the stable jet increases from 0.45 to 1.05 ms. The CO2 filling volume is a critical factor in ensuring a longer duration of cracking.
The orifice-to-target distance is also an essential factor affecting the pressure on the wall. Figure 12c shows the pressure curve when Djet = 2. Due to the effect of the shockwave, a peak (in terms of pressure value and speed) is generated at the front, especially when the distance is relatively close. The shockwaves cause an intense fluid peak pressure at the surface of the blasting hole, reaching 27 MPa with an initial pressure of 20 MPa.
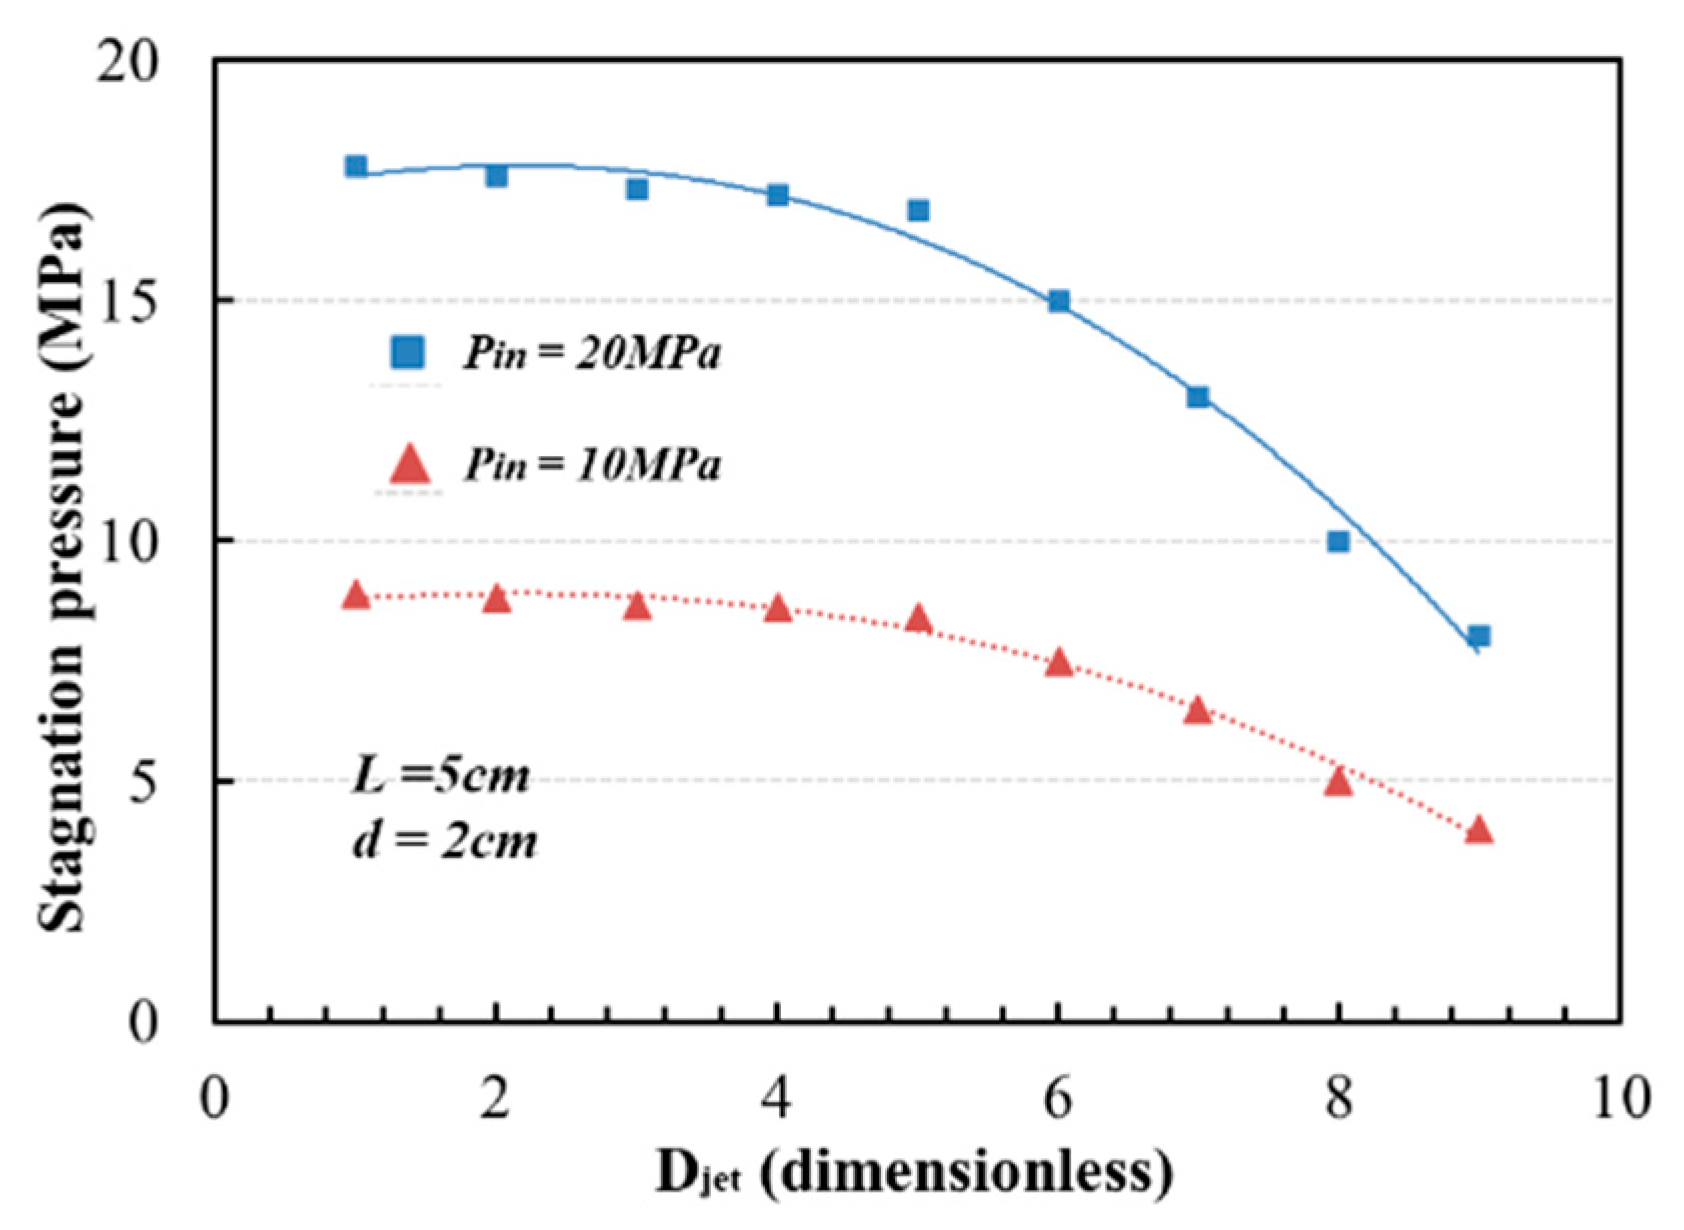
The stagnation pressure at the center of the wall is obtained under different initial conditions. Figure 13 uses the dimensionless Djet (ratio of the distance to the orifice diameter) as the abscissa. When the dimensionless distance Djet increases from 1 to 9, the results show that the jet impacting pressure decreases from 17.9 MPa to 8.01 MPa at the blasting pressure of 20 MPa, and decreases from 8.2 MPa to 2.42 MPa at the blasting pressure of 10 MPa.

4. Conclusions

In this paper, simulation and theoretical analysis were conducted to study the initial pressure load and the evolution of CO2-PB. The blasting over-pressure and stagnation pressure under the effects of different parameters were calculated. Our main conclusions are as follows:
  • During blasting, the CO2 absorbs heat from the surrounding environment and produces a significant low-temperature area. The pressure due to the shockwave is significantly lower than the driving gas pressure to the ambient pressure, limiting the maximum shockwave over-pressure that can be obtained.
  • The blasting pressure is the critical parameter of the shockwave. When the value of P4 increases from 50 to 150 MPa, the ∆P/P1 value increases from 17 to 56. Furthermore, when the filling volume increases from 50% to 100%, the peak fracturing is reduced by 20.2%. The one-dimensional shock tube hypothesis can be used, which can better predict the peak value and attenuation of shockwave over-pressure in the near-field.
  • The impact process can be divided into three stages, considering the dynamic pressure curves for the centerline of the jet: A shock stage, a stable stage, and an attenuation stage. In the shock stage, strong compression is formed on the surface of the shockwave, resulting in a higher peak pressure value. Meanwhile, the stable pressure is influenced by the target distance, blasting pressure, and the CO2-PB length.

Author Contributions

Conceptualization, C.P. and Z.L.; methodology, C.P.; software, C.P.; validation, C.P. and Z.L.; formal analysis, C.P.; investigation, C.P. and G.P.; resources, C.P.; data curation, C.P. and Z.L.; writing—original draft preparation, C.P.; writing—review and editing, C.P.; visualization, C.P. and G.P.; supervision, Z.L. and G.P.; project administration, Z.L.; funding acquisition, C.P., Z.L. and G.P. All authors have read and agreed to the published version of the manuscript.

Funding

This research was funded by Funding for school-level research projects of Yancheng Institute of Technology (Grant No. xjr2020036).

Data Availability Statement

The data applied to support the results in this study are available from the corresponding author upon request.

Conflicts of Interest

The authors declare no conflict of interest.

References

  1. Kumar, S.; Mishra, A.K. Reduction of blast-induced ground vibration and utilization of explosive energy using low-density explosives for environmentally sensitive areas. Arab. J. Geosci. 2020, 13, 1–10. [Google Scholar] [CrossRef]
  2. Li, Q.-Y.; Chen, G.; Luo, D.-Y.; Ma, H.-P.; Liu, Y. An experimental study of a novel liquid carbon dioxide rock-breaking technology. Int. J. Rock Mech. Min. Sci. 2020, 128, 104244. [Google Scholar] [CrossRef]
  3. Shang, Z.; Wang, H.; Li, B.; Hao, C.; Wang, Z.; Zhang, X.; Zhao, F.; Zhang, X. Experimental investigation of BLEVE in liquid CO2 phase-transition blasting for enhanced coalbed methane recovery. Fuel 2021, 292, 120283. [Google Scholar] [CrossRef]
  4. Pan, H.; Li, J.; Zhang, T.; Li, S.; Zhang, L. Study on crack propagation of the CO2presplitting blasting empty hole effect in coal seam. Energy Sci. Eng. 2020, 8, 3898–3908. [Google Scholar] [CrossRef]
  5. Zhou, S.; Jiang, N.; He, X.; Luo, X. Rock Breaking and Dynamic Response Characteristics of Carbon Dioxide Phase Transition Fracturing Considering the Gathering Energy Effect. Energies 2020, 13, 1336. [Google Scholar] [CrossRef] [Green Version]
  6. Liu, X.; Wang, Z.; Song, D.; He, X.; Yang, T. Variations in surface fractal characteristics of coal subjected to liquidCO2phase change fracturing. Int. J. Energy Res. 2020, 44, 8740–8753. [Google Scholar] [CrossRef]
  7. Xia, X.; Li, H.; Wang, X.; Zhou, Q.; Yu, C. Comparison analysis of the ground vibrations induced by CO2 gas fracturing and explosive blasting. Chin. J. Rock Mech. Eng. 2021, 40, 1350–1356. [Google Scholar] [CrossRef]
  8. Wang, B.; Qiu, W.; Liu, S.; Sun, H.; Ding, X.; Jin, B.; Zhang, Z. Supercritical CO2 source for underground seismic exploration. J. King Saud Univ.-Sci. 2020, 32, 1731–1737. [Google Scholar] [CrossRef]
  9. Zhou, S.; Luo, X.; Jiang, N.; Zhang, S.; Lei, Y. Ground vibration characteristics of carbon dioxide phase transition fracturing: An in situ test. Bull. Eng. Geol. Environ. 2021, 80, 9029–9047. [Google Scholar] [CrossRef]
  10. Kong, R.; Kim, S.; Ishii, M. Review of jet impingement in high-energy piping systems. Nucl. Eng. Des. 2020, 357, 110411. [Google Scholar] [CrossRef]
  11. Jaimes, M.G.; Castillo, R.D.; Mendoza, S.A. High Energy Gas Fracturing: A Technique of Hydraulic Prefracturing to Reduce the Pressure Losses by Friction in the Near Wellbore-a Colombian Field Application. SPE 2012, 1, 152886. [Google Scholar] [CrossRef]
  12. Zhang, Y.; Deng, J.; Ke, B.; Deng, H.; Li, J. Experimental Study on Explosion Pressure and Rock Breaking Characteristics under Liquid Carbon Dioxide Blasting. Adv. Civ. Eng. 2018, 2018, 7840125. [Google Scholar] [CrossRef]
  13. Bai, X.; Zhang, D.; Zeng, S.; Zhang, S.; Wang, D.; Wang, F. An enhanced coalbed methane recovery technique based on CO2 phase transition jet coal-breaking behavior. Fuel 2020, 265, 116912. [Google Scholar] [CrossRef]
  14. Ke, B.; Zhou, K.; Ren, G.; Shi, J.; Zhang, Y. Positive Phase Pressure Function and Pressure Attenuation Characteristic of a Liquid Carbon Dioxide Blasting System. Energies 2019, 12, 4134. [Google Scholar] [CrossRef] [Green Version]
  15. Wang, H.; Cheng, Z.; Zou, Q.; Li, Z.; Sun, F.; Yang, H.; Lei, Y. Elimination of coal and gas outburst risk of an outburst-prone coal seam using controllable liquid CO2 phase transition fracturing. Fuel 2021, 284, 119091. [Google Scholar] [CrossRef]
  16. Zhou, Y.; Liu, Z.; Li, M.; Zheng, D.; Jiang, M.; Shang, C.; Zhao, Y.; Ji, X. Experimental study of the influence of burst parameters on the initiation of CO2 BLEVE. Int. J. Greenh. Gas Control 2019, 91, 102817. [Google Scholar] [CrossRef]
  17. Lei, Y.; Li, C.; Zhang, K. Study on evolution mechanism of unsteady transient pressure drop caused by gas phase cracking. Saf. Coal Mines 2021, 52, 25–30. [Google Scholar] [CrossRef]
  18. Xia, J.; Dou, B.; Tian, H.; Zheng, J.; Cui, G.; Kashif, M. Research on Initiation of Carbon Dioxide Fracturing Pipe Using the Liquid Carbon Dioxide Phase-Transition Blasting Technology. Energies 2021, 14, 521. [Google Scholar] [CrossRef]
  19. Chen, Y.; Zhang, H.; Zhu, Z.; Ren, T.; Cao, C.; Zhu, F.; Li, Y. A new shock-wave test apparatus for liquid CO2 blasting and measurement analysis. Meas. Control 2019, 52, 399–408. [Google Scholar] [CrossRef] [Green Version]
  20. Zhang, X.; Lu, Y.; Tang, J.; Zhou, Z.; Li, Q. Dynamic simulation of the oscillation characteristics of supercritical carbon dioxide impacting jets. J. Vib. Control 2018, 25, 61–71. [Google Scholar] [CrossRef]
  21. Wang, X.; Song, Z.; Pan, X.; Zhang, L.; Zhu, X.; Mei, Y.; Jiang, J. Simulation study on near-field structure and flow characteristics of high-pressure CO2 released from the pipeline. J. Loss Prev. Process Ind. 2021, 71, 104481. [Google Scholar] [CrossRef]
  22. Yang, Y.; Liu, H.; Mao, W.; Song, Z.; Wang, H. Study on the Impact Pressure of Swirling-Round Supercritical CO2 Jet Flow and Its Influencing Factors. Energies 2020, 14, 106. [Google Scholar] [CrossRef]
  23. Liu, X.; Godbole, A.; Lu, C.; Michal, G.; Venton, P. Source strength and dispersion of CO2 releases from high-pressure pipelines: CFD model using real gas equation of state. Appl. Energy 2014, 126, 56–68. [Google Scholar] [CrossRef] [Green Version]
  24. Zhou, Z.; Lu, Y.; Tang, J.; Zhang, X.; Li, Q. Numerical simulation of supercritical carbon dioxide jet at well bottom. Appl. Therm. Eng. 2017, 121, 210–217. [Google Scholar] [CrossRef]
  25. Flechas, T.; Laboureur, D.M.; Glover, C.J. A 2-D CFD model for the decompression of carbon dioxide pipelines using the Peng-Robinson and the Span-Wagner equation of state. Process Saf. Environ. Prot. 2020, 140, 299–313. [Google Scholar] [CrossRef]
  26. Span, R.; Wagner, W. A New Equation Of State for Carbon Dioxide Covering the Fluid Region from the Triple-Point Temperature to 1100 K At Pressures up to 800 MPa. J. Phys. Chem. Ref. Data 1996, 25, 1509–1596. [Google Scholar] [CrossRef] [Green Version]
  27. Kang, J.; Zhou, F.; Qiang, Z.; Zhu, S. Evaluation of gas drainage and coal permeability improvement with liquid CO2 gasification blasting. Adv. Mech. Eng. 2018, 10, 687814018768578. [Google Scholar] [CrossRef] [Green Version]
  28. Yakush, S.E. Model for blast waves of Boiling Liquid Expanding Vapor Explosions. Int. J. Heat Mass Transf. 2016, 103, 173–185. [Google Scholar] [CrossRef]
  29. Birk, A.M.; Eyssette, R.; Heymes, F. Analysis of BLEVE overpressure using spherical shock theory. Process Saf. Environ. Prot. 2020, 134, 108–120. [Google Scholar] [CrossRef]
  30. Li, M.; Ni, H.; Cao, Y.; Zhao, B.; Lei, P.; Shi, X.; Du, Y. Flow energy transformation and dissipation mechanisms of carbon dioxide, nitrogen, and water jets. J. Nat. Gas Sci. Eng. 2020, 84, 103650. [Google Scholar] [CrossRef]
  31. Tang, X.; Asahara, M.; Hayashi, A.K.; Tsuboi, N. Numerical investigation of a high pressure hydrogen jet of 82 MPa with adaptive mesh refinement: The starting transient evolution and Mach disk stabilization. Int. J. Hydrogen Energy 2017, 42, 7120–7134. [Google Scholar] [CrossRef]
  32. Tian, Z.-C. Crack from the Influencing Factors of Liquid Carbon Dioxide Phase Transient Fracturing. Master’s Thesis, China University of Mining and Technology, Jiangsu, China, 2018. [Google Scholar]
  33. State Administration of Work Safety. Safety Evaluation; China Coal Industry Publishing Home: Beijing, China, 2005. [Google Scholar]
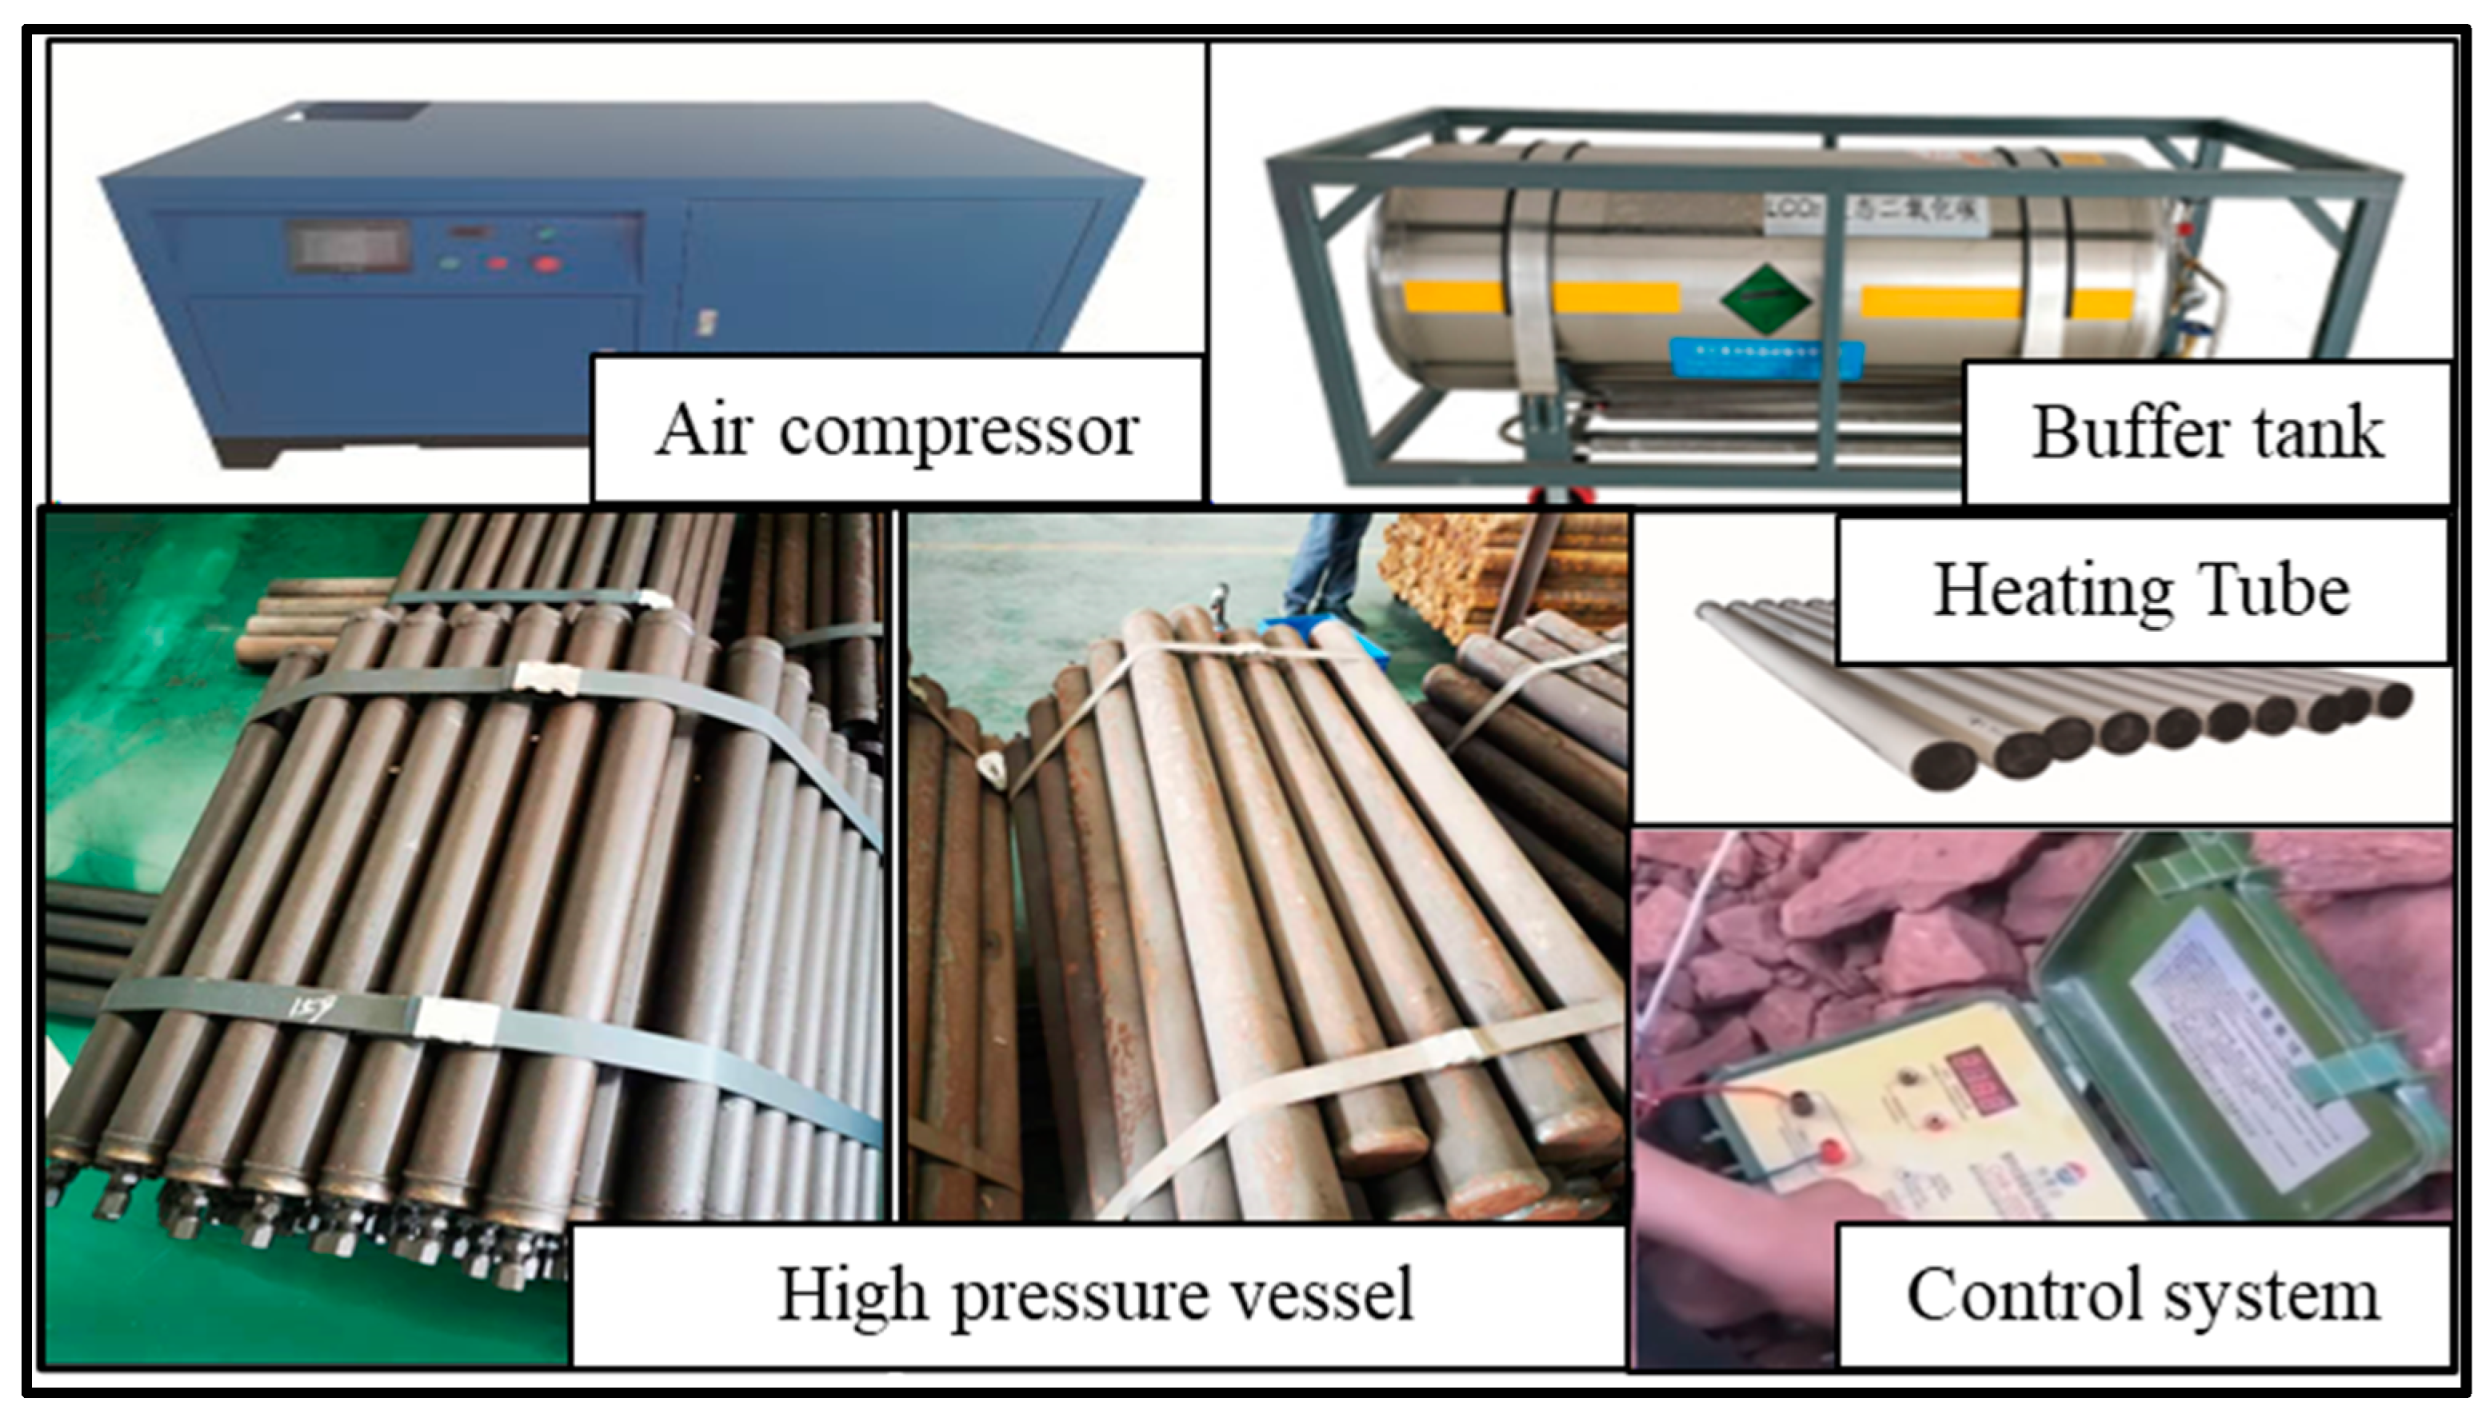
Figure 1. Schematic diagram of a CO2-PB system.
Energies 15 08599 g001
Figure 2. (a) The physical picture of the CO2-PB; (b) three-dimensional simulation model for CO2-PB.
Energies 15 08599 g002
Figure 3. Pressure, along with the axis profile, as a function of the number of grid cells.
Energies 15 08599 g003
Figure 4. Schematic diagram of the whole CO2-PB process.
Energies 15 08599 g004
Figure 5. Density (a), pressure (b), temperature (c), and axial velocity (d) profiles along the axis y = 0.
Energies 15 08599 g005
Figure 6. Simulation results of the free jet at: (a) t = 80 μs and (b) t = 200 μs.
Energies 15 08599 g006
Figure 7. The evolution of the jet.
Energies 15 08599 g007
Figure 8. The location of the Mach disk.
Energies 15 08599 g008
Figure 9. Over-pressure of CO2-PB with respect to: (a) P4/P1 and (b) filling volume.
Energies 15 08599 g009
Figure 10. Over-pressure of CO2-PB at different distances.
Energies 15 08599 g010
Figure 11. Simulation result of the jet: pressure (a), velocity (b), temperature (c), and density (d).
Energies 15 08599 g011
Figure 12. Fluid pressure versus time during the simulation at different conditions.
Energies 15 08599 g012
Figure 13. The stagnation pressure at different Djet.
Energies 15 08599 g013
Table 1. Coefficients of the correlation equations in Equation (7).
i a i 0 θ i 0 i a i 0 θ i 0
18.37304456 50.621052486.11190
2−3.70454304 60.411952936.77708
32.50000000 71.0402892211.32384
41.994270423.1516380.0832767827.08792
Publisher’s Note: MDPI stays neutral with regard to jurisdictional claims in published maps and institutional affiliations.