Article

Basics of Control of the Bow Shock Wave, Drag and Lift Forces, and Stability in a Steady Supersonic Flow Past an AD Body Using Permanently Operating Thermally Stratified Energy Deposition

Federal Research Center “Computer Science and Control” of the Russian Academy of Sciences, Vavilova Str. 44, Moscow 119333, Russia
Energies 2022, 15(22), 8627; https://doi.org/10.3390/en15228627
Submission received: 13 October 2022 / Revised: 10 November 2022 / Accepted: 14 November 2022 / Published: 17 November 2022
(This article belongs to the Special Issue Energy Deposition for Aerospace Applications)

Abstract

:
A new method of high-speed flow control using permanently operating thermally stratified energy deposition is presented. The paper focuses on the analysis of the dependence of the characteristics of a steady supersonic flow and an aerodynamic (AD) body on the temperature values in the layers of a stratified source and the possibility of making the transition from one steady flow mode to another by changing the temperature in the layers. A detailed visualization of the dynamics of the fields of density, pressure, temperature, and local Mach number is presented during the controlled establishment of steady flow modes. Multiple generation of the Richtmyer–Meshkov instability is shown. The sharp peaks accompanying the development of the Richtmyer–Meshkov instabilities were obtained, which remain in the steady flow mode established under the action of a stratified energy source. Basic approaches for controlling the bow shock wave, drag and lift (pitch) forces (at zero angle of attack), and the stability in a steady supersonic flow past an AD body using permanently operating thermally stratified energy source were developed. The possibility of initiating and damping self-sustained flow pulsations as well as the formation of a steady flow with oppositely directed constantly acting lift forces due to temperature changes in the layers of a thermally stratified energy source is shown.

Graphical Abstract

1. Introduction

The problem of controlling a supersonic/hypersonic flow past an aerodynamic (AD) body due to energy supply at various points of the flow and the body surface has been studied since the second half of the last century and is now a well-developed area of aerospace engineering [1,2]. This is evidenced by numerous reviews devoted to various aspects of this topic [2,3,4,5,6,7,8,9]. In [2], a selected survey of aerodynamic drag reduction at high speeds is presented. The historical review on the idea of flow control by energy deposition to the supersonic flow past AD body, which appeared decades ago, is presented in [3]. The review of research on the direction of energy deposition for active and passive flow/flight control is presented in [4]. The studies on bow shock wave control and practical implementation of various devices for flow control are considered in [5] along with the physics-based mechanisms of their action.
A review of approaches to the organization of energy deposition in plasma aerodynamic applications is presented in [6] from the point of view of the physical mechanisms of interaction of various types of discharges with gas flows. Numerous examples of the use of discharge plasma to control high-speed flows are given. In a review [7], the author observes the experiments of the successful application of discharge-generated plasma for precise control of the structure and parameters of a supersonic air flow. The main attention is paid to the analysis of the specific properties of electric discharges. In [8], the results on the organization of the structure of plasma filaments using a powerful discharge are presented. A review of methods of flow control, including surface plasma actuators, laser energy deposition, and the impact of plasma generated by microwave impulses, is presented in [9]. In a review [10], the physical foundations of visualization of high-speed processes in gases as well as the basics of modern technologies for digital processing of flow images are considered.
An efficiency of energy deposition in the form of longitudinal filaments (“hot spikes”) for reducing the aerodynamic drag was established in numerous studies [11,12,13]. In the experiments, the energy deposition to the supersonic flow was provided by MW impulse [14], laser [15,16,17], electrical discharge [18,19], MHD influence [20,21], etc. It was shown that the injection of the energy of microwave discharge to the supersonic flow past a blunt cylinder decreases the stagnation pressure and provides significant (up to 80%) decrease in a drag force. A vortex mechanism of these phenomena was established in the accompanied calculations [14]. In [18], the authors obtained the curvature of the shock wave under the action of a plasma zone formed by longitudinal pulsed discharge. Thermal fluctuations driven by a burst plasma discharge are experimentally investigated using a frequency analysis based on the Schlieren images in [19].
Theoretically, the possibility of obtaining self-sustained flow pulsations under the action of a homogeneous longitudinal energy source located symmetrically with respect to the streamlined body was demonstrated in [22,23,24]. The mechanisms of these phenomena are associated with the transfer of masses of a gas inside the shock layer and are different from the study carried out in present work considering the asymmetric location of the energy source relatively an AD body. The mechanism for the appearance of pulsations due to the asymmetric location of the energy source relative to the streamlined body was obtained in [25] and is associated with the dynamics of the generated asymmetric triple-shock configurations. Features of a supersonic flow containing an asymmetrically located extended homogeneous energy source were studied experimentally in [26] and theoretically in [27,28], where the possibility of producing a lift (pitch) force acting on an AD body at a zero angle of attack was shown.
Recently, much attention has been paid to experimental studies of a stratified plasma medium and the effect of such a medium on a shock wave. This interaction is distinguished by specific properties; in particular, blurring, distortion, or even complete disappearance of fragments of the shock wave front inside such a striped plasma region were obtained [29,30,31,32,33]. It has also been shown that the resulting plasma structures can enhance the mixing of gas mixtures [8]. The problem of the shock wave positioning control was considered in [30], where with the use of Mie scattering, the three-dimensional shape of the shock wave structure was obtained before and after electrical discharge organization, which gives possibilities for establishing plasma-based triggering mechanisms. In [33], ionization strata were obtained in the plasma zone created by a glow gas discharge, and the impact of the striation zone on a preliminary plane shock wave was investigated. In the experiments, the curvature, and in some cases, complete disappearance of the shock wave front was registered. In the accompanied numerical simulation, the multiple manifestation of the Richtmyer–Meshkov instability was shown, which destroyed the wave front due to the formation of many sharp peaks at the wave front, causing its practical disappearance in the density field.
The shock wave boundary layer interaction controlled by surface arc plasma actuators was studied [34,35]. In [34], an array of 16 surface arc plasma actuators was employed to control the interaction of the shock wave with the boundary layer in a flow with a Mach number of 2. In [35], the streamwise pulsed arc discharge array was used for the impact on the supersonic flow, in which five actuators were connected in a series with adjustable frequency. As the result of both the experiments, the disappearance of a fragment of the separation shock wave was established. In [36], localized arc filament plasma actuators and nanosecond dielectric-barrier discharge plasma actuators were discussed from the point of view of initiation of the Kelvin–Helmholtz instability. In [37,38], a manifestation of the Richtmyer–Meshkov instability as well as vortex lines generated by the Kelvin–Helmholtz instability were experimentally recorded during the interaction of a blast wave with an area of density and temperature inhomogeneities.
Theoretically, it was shown that the interaction of a shock wave with a temperature-stratified plasma medium leads to multiple manifestations of the Richtmyer–Meshkov instability, which causes sharp peaks in the region of the shock wave front. In this case, the wave front is distorted up to complete disappearance in the density field [33,39,40,41,42]. It was shown that under the action of a stratified energy source, the redistribution of energy behind the shock wave front occurs in such a way that the vortex structures obtained behind the wave are characterized by sharp fluctuations of the energy parameters, the amplitude of which is up several times greater than the value for the homogeneous energy source with the same total energy [40,41,42].
In our recent works [43,44,45], the effect of stratified plasma regions on the bow shock wave and characteristics of an AD body was investigated. In [43], the impact of a combined energy source consisting of two thermal layers on the supersonic layer produced by an AD body was studied. A double-vortex mechanism of action on the body was obtained, which makes it possible to control the stagnation parameters and drag forces by changing the temperature in the layers of the combined source. In [44,45], the effect of a time-limited stratified impulse on the supersonic flow past a pointed body and the multi-vortex mechanism of action on the AD body were studied. The possibility of producing short-term lift (pitch) forces at zero angle of attack was shown.
The present paper studies the impact of a permanently operating a thermally stratified energy source on a steady supersonic flow past a pointed body. The study is based on the system of Navier–Stokes equations for a viscous heat-conducting gas (air); the freestream Mach number is 2. The paper focuses on the analysis of the dependence of the characteristics of a steady supersonic flow and an AD body on the temperature values in the layers of a stratified source and the possibility of making the transition from one steady flow mode to another by changing the values of temperature in the layers. The research is carried out on controlling the shape and position of the bow shock wave as well as the dynamics of the characteristics of an AD body, the parameters, and stability of a steady supersonic flow past the body. In addition, the possibility of the initiation and suppression of self-sustained flow pulsations and the formation of a steady flow with oppositely directed constantly acting lift (pitch) force at zero angle of attack by changing temperature in the layers of a thermally stratified energy source was established.

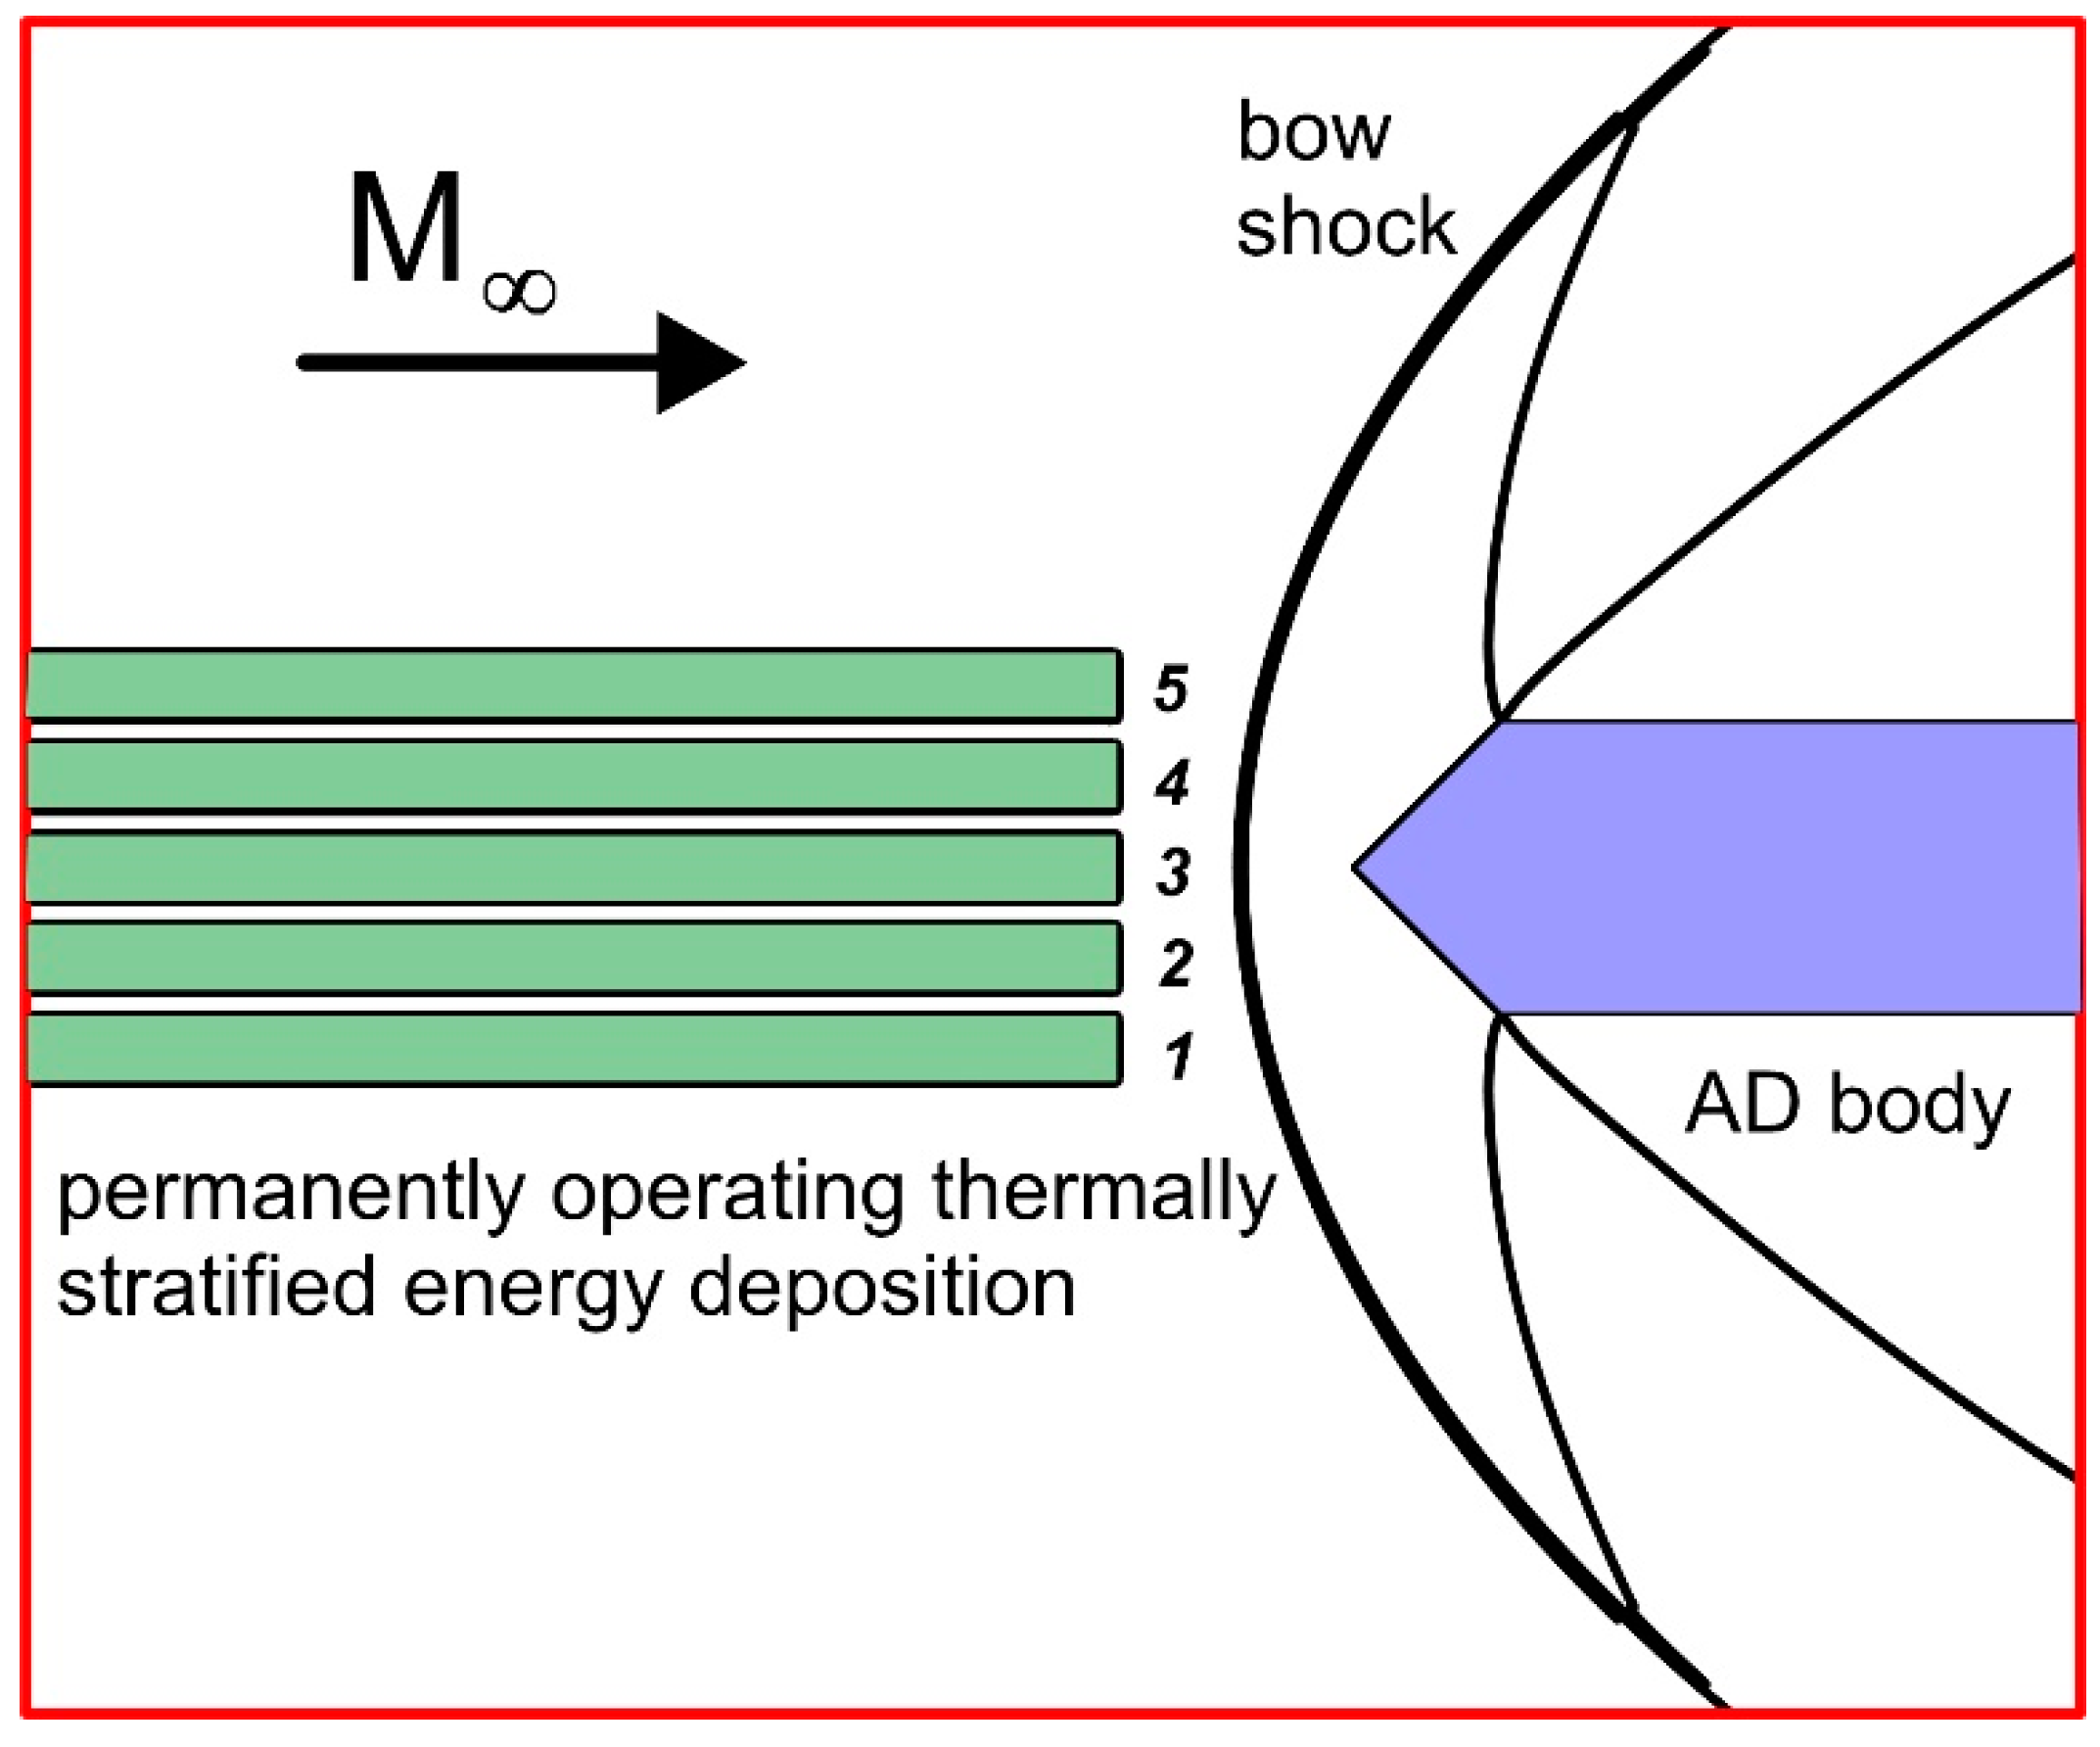
2. Statement of the Problem and Methodology

The impact of a permanently acting, thermally stratified energy source on a supersonic flow past a sharpened plate is considered. The angle at the top of the pointed part of the body is 90° (Figure 1).
The numerical simulations are based on the Navier–Stokes equations for viscous heat conductive gas (air); the gas is supposed to be perfect with the ratio of specific heats γ = 1.4. The divergent form of the full Navier–Stokes system of equations for the dimensionless variables [46] is solved numerically:
U t + ( F + V ) x + ( G + W ) y = 0
U = ( ρ , ρ u , ρ v , E ) T , F = ( ρ u , p + ρ u 2 , ρ u v , u ( E + p ) ) T , G = ( ρ v , ρ u v , p + ρ v 2 , v ( E + p ) ) T V = ( 0 , μ / Re ( 4 / 3 u x 2 / 3 v y ) , μ / Re ( v x + u y ) , μ π 1 / Re + ( 1 / N ) k T x ) T W = ( 0 , μ / Re ( v x + u y ) , μ / Re ( 4 / 3 v y 2 / 3 u x ) , μ π 2 / Re + ( 1 / N ) k T y ) T π 1 = u ( 4 / 3 u x 2 / 3 v y ) + v ( v x + u y ) , π 2 = v ( 4 / 3 v y 2 / 3 u x ) + u ( v x + u y ) E = ρ ( ε + 0.5 ( u 2 + v 2 ) ) , N = RePr ( γ 1 ) / γ , ε = p / ( ρ ( γ 1 ) )
For the dependence of dynamic viscosity on temperature, the Sutherland’s law in nondimensional form is used:
μ = T 1.5 ( 1 + s 1 ) / ( T + s 1 )
s1 = 0.4096 (120 K). The coefficient of heat conductivity k is supposed to depend on temperature in nondimensional form as k = T0.5.
Here, when passing from dimensional to dimensionless parameters, the following scaling variables were used:
ρ n = ρ , p n = p , l n = k l 1 D , T n = T , u n = ( p / ρ ) 0.5 , t n = l n / u n
where k l is the dimensionless value of D.
The fields of gas parameters in a steady supersonic flow past the body at t = 0.6 were set as the initial conditions for studying the process of the interaction of the shock layer and the stratified energy source. At this time, the pressure and density at the top of the body differ from their theoretical values evaluated from the Bernoulli’s relation by 1.81% and 1.75%, accordingly (relative to the theoretical values). The parameters of the gas on the wall are taken as the wall parameters. Boundary conditions on the body’s boundaries mean the absence of according normal flows on the boundaries and the absence of the reflection in the directions normal to the exit boundaries of the computation domain.
The constantly acting, thermally stratified energy deposition is modelled by a set of rarefied gas layers of the same width, located in front of the bow shock wave (see Figure 1). The gaps between the layers were set equal to half the layer width. Inside the layers (indicated by the index j), gas density is specified to be reduced, ρj = αjρ, αj < 1, j = 1 ÷ Nes; Nes is a number of layers in the energy source (in these calculations, Nes = 5). Pressure and velocity in the layers are set equal to their freestream values: pj = p, uj = u, vj = 0. Therefore, temperature inside the layers is increased compared to its freestream value, Tj = αj−1T. Thus, a thermally stratified energy source is determined by a set of the parameters of the gas rarefaction {αj} = (α1, α2, αNes) in its layers. In the calculations, such an energy source is obtained via the boundary condition at the entrance boundary, at x = 0, where the parameters of the heated layers are set along with the parameters of the oncoming flow.
The energy source is supposed to be fixed rigidly relative to the streamlined body, and its axis of symmetry coincides with the axis of symmetry of the body. It is assumed that the energy source arises in the steady flow at time ti, moves along with the oncoming flow towards the bow shock wave, interacts with it, and then acts continuously throughout the entire interaction process. The defining characteristics of the flow, AD body, and stratified energy source used in the simulations are presented in Table 1.
A numerical code based on the complex conservative difference schemes [47] was used in the simulations. When constructing the schemes, the systems of differential consequences for the spatial derivatives of system (1) were used, which provides these schemes with a second order of approximation in space and time. In the vicinity of the boundaries of the body, the schemes were constructed taking into account the location of the boundary inside the computational grid, which ensures the calculations to be conservative near the boundaries. The five-point stencil of the Lax’s scheme was applied for the scheme construction, so in the calculations, the structural staggered orthogonal grids were used. The distance between the stencil nodes on the lower time layer is assumed to be 2hx, 2hy, where hx, hy are the spatial steps in the x- and y-directions.

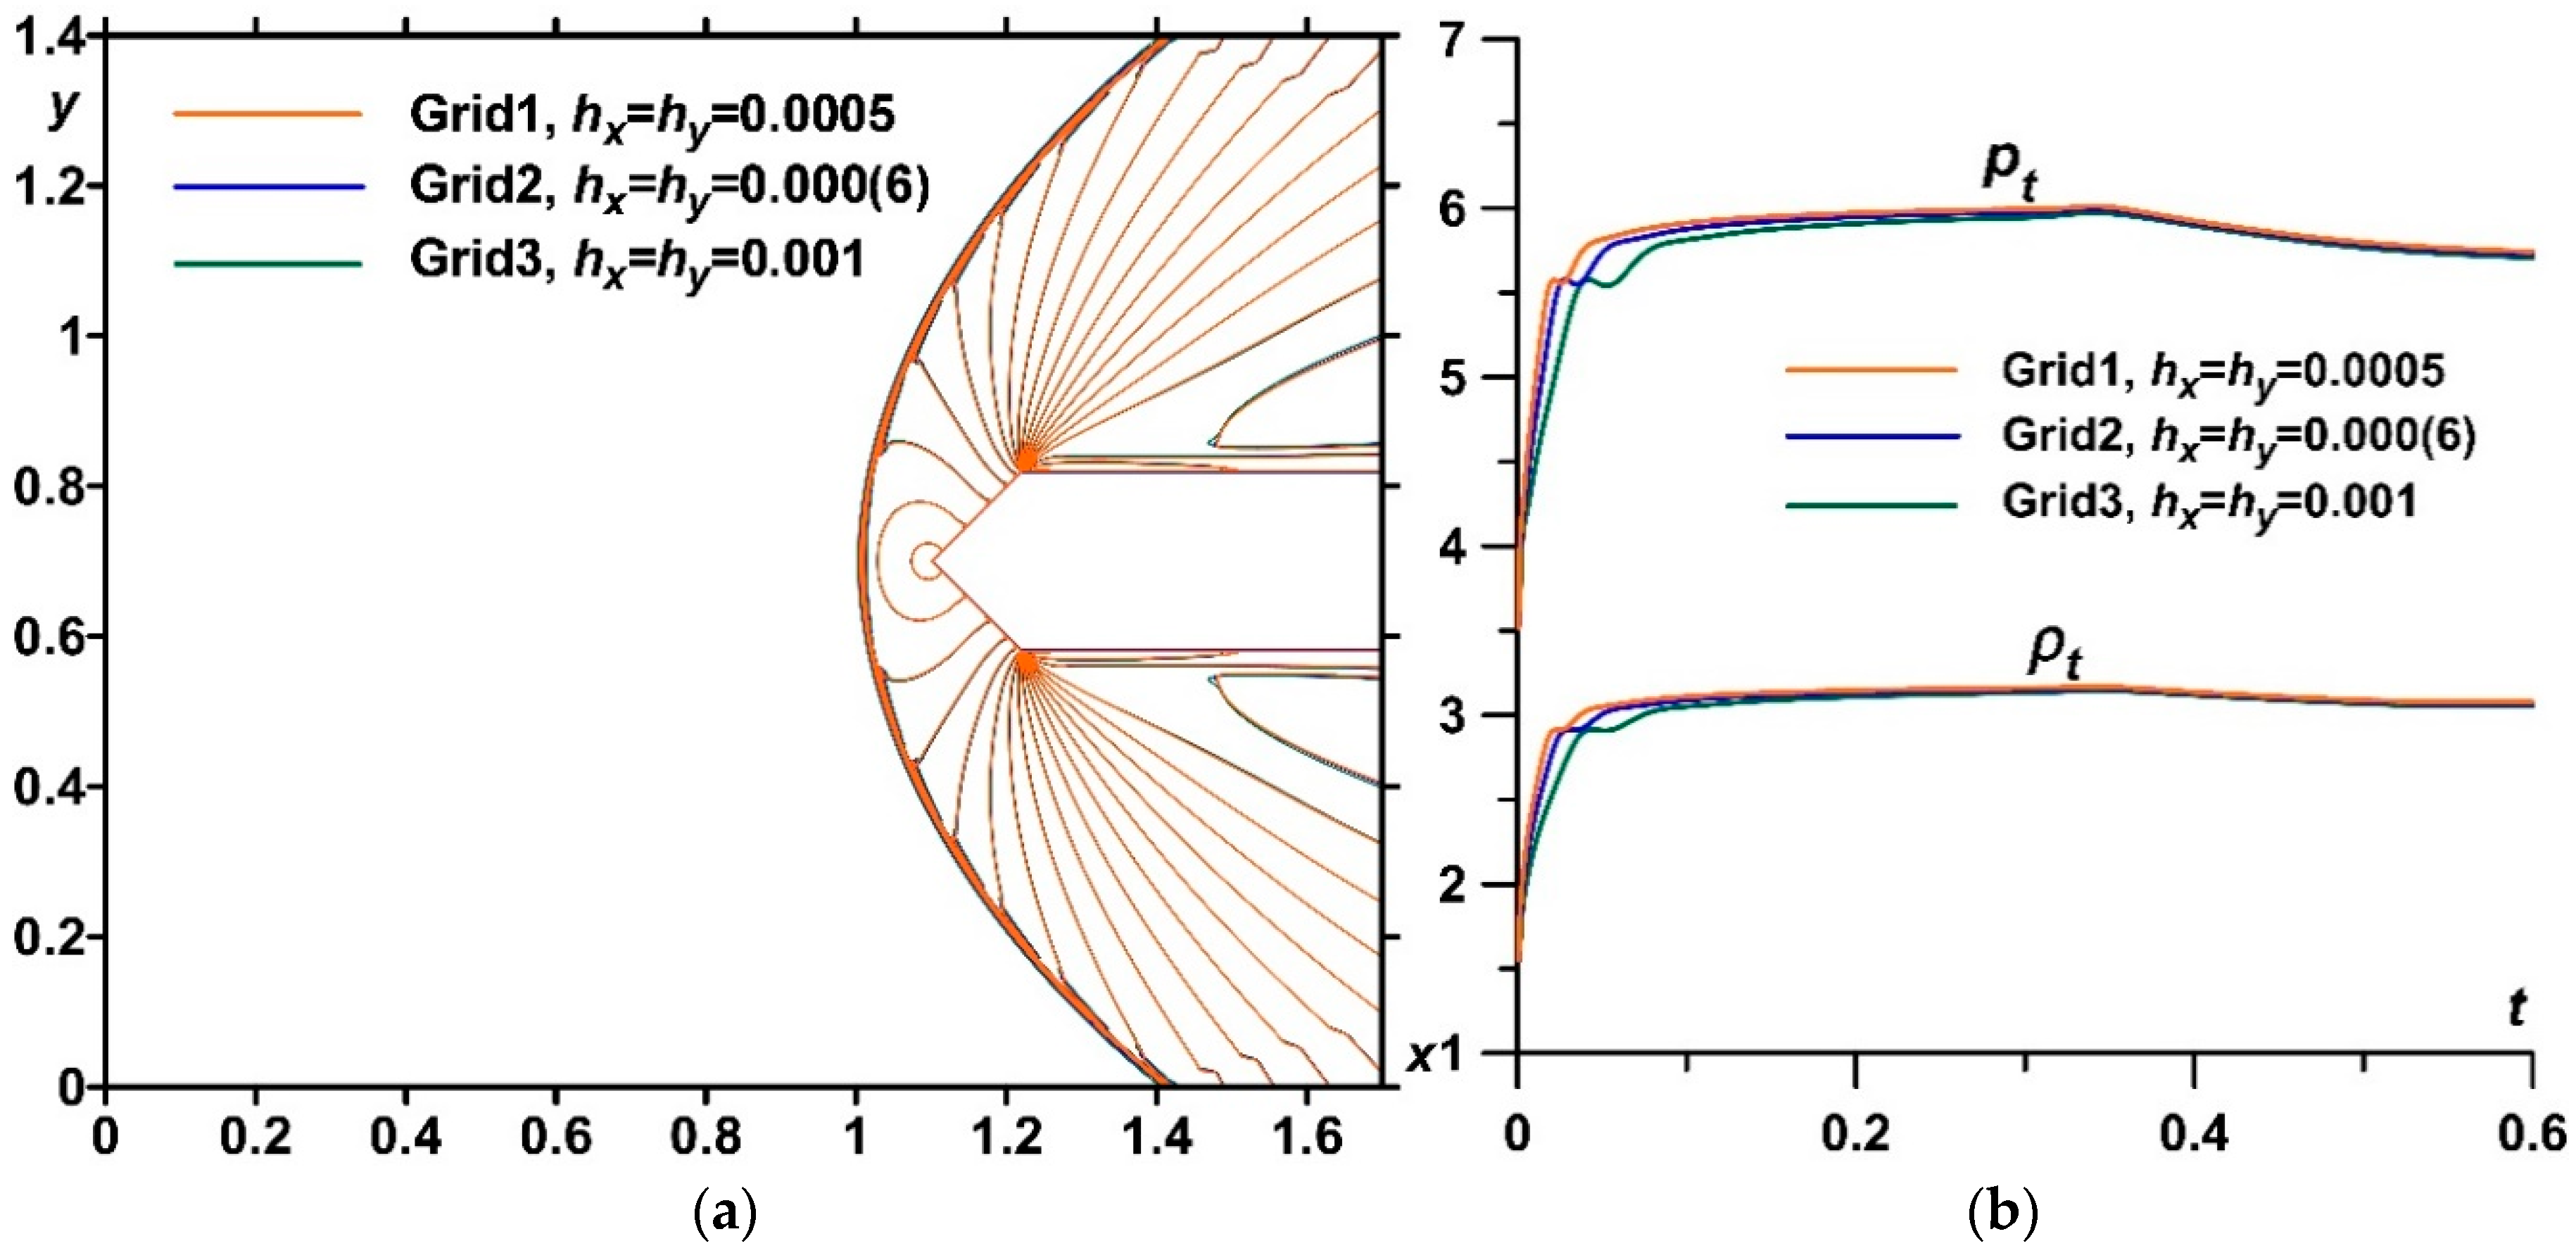
3. Analysis of the Grid Convergence

The grid convergence analysis was conducted using three difference grids (Table 2). The flow dynamics during the steady-state establishing was studied (Figure 2). In Figure 2a, the density fields in isochores are presented, which were calculated using these three difference grids. One can see that the shapes and the positions of the bow shock waves almost coincide. The dynamics of the parameters at the top of the body obtained using these three difference grids is shown in Figure 2b. In Table 2, the relative errors for the parameters at the top of the body at the steady state in comparison with the theoretically ones obtained from the Bernoulli’s relation are presented. One can see that the values at the top of the body differ from their theoretical values less than by 1.9% (for Grid1). Hence, it can be stated that the grid convergence has taken place. For the calculations, Grid1 (hx = hy = 0.0005) was used for two computation domains of 9.5 × 10⁶ nodes (with the coordinate of the axis of symmetry of the body y0 = 0.7) and of 13 × 106 nodes (with y0 = 0.9), accordingly (counting the middle point of the scheme stencil).

4. Analysis of the Impact of a Thermally Stratified Energy Source on a Supersonic Flow Past an AD Body for Different Symmetrical Sets {αj}

4.1. Analysis of the Flow Dynamics during the Interaction of an Energy Source with Equally Heated Layers with a Supersonic Flow Past an AD Body

The dynamics of the density fields during the interaction of a thermally stratified energy source with a supersonic flow past a body “a plate pointed by a wedge” is presented in Figure 3 (the time instances are shown in the images). Here, {αj} = (0.3,0.3,0.3,0.3,0.3). First, the source approaches the steady bow shock wave (images for t = 0.8 and t = 1.0) and begins to interact with it. As a result of the interaction of the bow shock wave with the boundaries of thermal layers (which are contact discontinuities), the multiple Richtmyer–Meshkov instabilities develop, accompanied by the formation of vortex structures [39,44] (t = 1.2). These vortex structures determine a new multi-vortex mechanism of action on a streamlined body (t = 1.4–1.6) (see [44], where this mechanism is described for a time-limited stratified impulse).
After that, the vortex structures are carried away from the computational domain, and the layered structure of the density field of the entire flow is established up to a new steady flow mode (t = 1.8–3.6). Note that the new steady flow mode established under the action of the stratified source differs significantly from the initial unperturbed steady flow mode (image for t = 1.8 vs. image for t = 3.6).
The corresponding dynamics of the density fields in a surface view are shown in Figure 4. It can be seen that the interaction is accompanied by almost complete destruction of the front of the bow shock wave in the zone of layers of the stratified energy source. In addition, sharp peaks are visible, indicating the occurrence of Richtmyer–Meshkov instabilities.
The according dynamics of pressure, temperature fields and the fields of a local Mach number are presented in Figure 5, Figure 6 and Figure 7. A significant change in the steady flow mode is clearly seen from the images of the pressure fields shown in Figure 5. One can see that, under the action of a stratified energy source, the pressure in the shock layer, as a whole, decreases. This is accompanied by a change in the shape of the front of the bow shock wave: in the region of heated layers, the wave front becomes wavy, and at the periphery, the bending of the front of the bow shock wave changes to the opposite. Note that since, by construction, the boundaries of the source layers are contact discontinuities, the source layers are not visible on the pressure field images.
The temperature fields shown in Figure 6 are consistent with the density fields, and the resulting steady flow is characterized by a layered temperature structure. The fields of the local Mach number also become layered in the new steady flow mode (Figure 7). In this case, the shape of the subsonic region between the body and the bow shock wave changes. It can also be seen that in the new steady flow mode, the sound line emanating from the corner point of the body is wavy, reflecting the layered structure of the flow in the shock layer.
In Figure 8, the surface view of the density fields for different symmetrical sets {αj} = (0.3,0.3,0.3,0.3,0.3), {αj} = (0.4,0.4,0.4,0.4,0.4), and {αj} = (0.5,0.5,0.5,0.5,0.5) in the thermally stratified energy source in the new steady flow mode established is presented. Note that we define a steady flow mode as a flow mode where the pressure and density at the top do not change. It can be seen that the sharp peaks accompanying the development of the Richtmyer–Meshkov instabilities remain in the steady flow mode established under the action of a stratified energy source. The magnitudes of the picks are greater for smaller αj (greater temperature) in the layers of the energy source.
Figure 9 illustrates the flow analysis for different sets {αj} with equal values of αj (and values of temperature) in the source layers. In Figure 9a, the pressure fields are presented for the steady flow mode. Here, the front of the bow shock is wavy reflecting the stratification of the energy source. The bow shock wave is located more far from the body for the smaller αj (greater temperatures) in the layers (green curve), which, however, was expected. In addition, it can be seen that the more the angle of inclination of the bow shock wave changes, the smaller the values αj in the layers. The dynamics of pressure, density, and temperature at the top of the body as well as those of the average front surface temperature Ta and the drag force F during the steady flow establishing for different sets {αj} with equal values αj are presented in Figure 9b,c. Here,
T a = 1 / N 1 N T k ,   F = y 0 0.5 D y 0 + 0.5 D p k d y
where Tk and pk are the temperature and pressure values at the k-point on the front surface of the body, N is a number of grid points on the front surface, and y0 is the y-coordinate of the axis of symmetry of the body. It can be seen that in the steady flow mode, the pressure and density at the top of the body and the drag force of the front surface are lower for sets {αj} with smaller αj (green curves).
The bow shock wave is located more far from the body for the smaller αj (greater temperatures) in the layers (green curve), and accordingly, for this set, the temperature at the top and the average temperature are higher at the steady state (Figure 9b,c). Thus, by changing the temperature in the layers of the stratified energy source, it is possible to control the parameters at the top of the streamlined body in the stationary flow regime as well as the drag force of its surfaces and the surface temperature.

4.2. Analysis of the Dynamics of the Flow Field Parameters during the Interaction of an Energy Source with Different Temperatures in the Layers with a Supersonic Flow Past an AD Body

In Figure 10, the density fields for different symmetrical sets {αj} = (0.3,0.3,0.3,0.3,0.3), {αj} = (0.8,0.3,0.3,0.3,0.8), and {αj} = (0.8,0.8,0.3,0.8,0.8) in the thermally stratified energy source during the new steady flow modes established are presented in a surface view. It can be seen that the magnitude of the sharp peaks accompanying the Richtmyer–Meshkov instabilities is greater when there are several hotter layers nearby in the source. At the same time, these sharp peaks are preserved in the flow patterns, which are characterized by the establishment of steady values of the flow parameters at the top of the body (the first and second lines of the images). For one heated layer, the peaks are much smaller in magnitude since it is located close to the less-heated layers. At the same time, these peaks are smoothed out to the time the steady flow is established, and only some surface nonmonotonicities can be seen there (the third line of images).
In Figure 11, the flow analysis for these symmetrical sets in the stratified energy is illustrated. Figure 11a demonstrates the pressure fields for the steady flow mode. Here, the front of the bow shock is also wavy, reflecting the number of layers in the energy source. The front of the bow shock wave undergoes a significant modification, and the wave inclination angles also change. For one heated layer α3 in the set {αj}, the shape of the bow shock practically repeats the shape of the pointed part of the body.
The dynamics of pressure, density, and temperature at the top of the body, along with the average front surface temperature Ta and drag force F during the steady flow establishing for these different symmetrical sets {αj}, are presented in Figure 11b,c, accordingly. It can be seen that in the steady flow mode, the pressure at the top and the drag force of the front surface are practically the same for all the considered sets {αj}. Therefore, the defining role in the establishing pressure values at the top of the body and the drag force play the central values αj. Thus, in order to obtain a drop in the drag force that is the same as in a set with all equally heated layers, there is no need to heat up all the layers; it is enough to heat several central layers. This fact can contribute to an increase in the efficiency of the impact of a stratified energy source.
Steady values of density match for {αj} = (0.3,0.3,0.3,0.3,0.3) and {αj} = (0.8,0.3,0.3,0.3,0.8) (green and blue curves) as well, but for the set with one heated layer, {αj} = (0.8,0.8,0.3,0.8,0.8), the steady density value is greater; consequently, the steady temperature in the top is smaller, and the averaged surface temperature is smaller, too (orange curve). Thus, by leaving the pressure at the top and the surface drag force unchanged and changing the temperature in the layers of the stratified energy source, it is possible to control the temperature on the surface of the streamlined body.
Note that for symmetrical sets {αj} characterizing a stratified energy source, lift (pitch) forces are not initiated in contrast to energy sources with asymmetrical sets {αj}, which, as will be shown below, produce, in addition to surface drag forces, lift (pitch) forces as well (at zero angle of attack).

5. Analysis of an Impact of a Thermally Stratified Energy Source on a Supersonic Flow Past an AD Body for Different Asymmetrical Sets {αj}

5.1. Initiation and Suppression of Flow Pulsations by Changing the Temperature in the Layers of a Stratified Energy Source

The dynamics of the density fields during the interaction of a thermally stratified energy source with {αj} = (0.3,0.3,0.8,0.8,0.8) with the supersonic flow past a body are presented in Figure 12. The corresponding pressure fields are presented in Figure 13. The source is moving with the flow towards the steady bow shock wave and begins to interact with it (t = 0.8, 1.0). The vortex structure that accompanies multiple Richtmyer–Meshkov instabilities develops near the lower surface of the body (t = 1.2) and begins to affect this surface (t = 1.4). As the result of this impact, the separation bubble is originated near the lower surface, which gives the origin to the pulsation process of the whole flow (t = 1.8).
Flow pulsations are regulated by a mechanism similar to that described in [25] for one longitudinal energy source located asymmetrically towards an AD body. At the beginning of the action of the energy source, the front of the bow shock wave begins to move away from the body, and bow shock wave diffraction occurs with the formation of a triple-shock configuration (t = 1.4) Note that the front of the reflected shock wave in this triple configuration acquires a wavy shape under the action of the source stratification (t = 3.0). As the distance from the body increases, the triple point moves up (t = 1.4–2.6), and dimensions of the triple configuration increase. In this case, the zone of increased pressure behind the reflected shock wave moves up along the upper surface of the wedge, pushing the bubble boundary above the top (t = 1.8–2.6). The pressure at the top drops (t = 2.2). Then, the bow shock wave stops and starts moving towards the body. The triple point starts to move down, and the dimensions of the triple configuration decrease (t = 2.6–4.2). The high-pressure zone captures the top (t = 4.2) and pushes the boundary of the separation bubble away from the top. In this case, the bubble collapses, and the flow becomes unseparated (t = 4.2–4.8). The flow near the body returns to the previous conditions (compare t = 4.2 and t = 1.4), and the pulsations are repeated (t = 4.2–5.4 and further in time).
Dynamics of the parameters at the top of the body and average front surface temperature as well as of the drag forces and lift forces during the flow pulsations for {αj} = (0.3,0.3,0.8,0.8,0.8) are presented in Figure 14. We consider the drag force forming by the wedge part of the body Fdrag, the drag forces forming by the top and bottom surfaces of the wedge as Fdragtop and Fdragbottom, the lift (pitch) force forming by the wedge Fliftwedge, the lift force forming by the horizontal surfaces Flifthorizontal, and the total lift force of the body Flifttotal. The lift force is calculated as the difference of forces acting on the surfaces of the body (the value of the force acting on the top surface is subtracted from the value of the force acting on the bottom surface). It can be seen that pressure, density, and temperature at the top of the body (green, orange, and blue curves) (Figure 14a,b) have consistent behavior along with the average front surface temperature, drag, and lift forces (Figure 14b,c). The upper surface of the wedge and the upper horizontal surface are the least affected by the vortex structure created by the energy source; therefore, the oscillatory mode of the dynamics of parameters on these surfaces is also the least pronounced (brown curve) (Figure 14b).
Note, however, that the entire flow oscillates along with the bow shock wave. Indeed, we can see this in Figure 15, where the fields of density, pressure, temperature, and local Mach number are presented for {αj} = (0.3,0.3,0.8,0.8,0.8) for the time instant of maximum value of pressure at the top (left row of images) and for the time instant of minimum value of pressure at the top (right row of images). When the pressure at the top is maximal, the dimensions of the triple configuration are the smallest, the front of the bow shock wave is at the closest distance from the body, and the separation bubble is just emerging; separation is almost absent, and the flow near the lower boundary is weakly subsonic (left row of images). When the pressure at the top is minimal, the dimensions of the triple configuration are the largest, the standoff distance of the bow shock wave from the body is maximal, the flow is separated with the formation of the separation bubble, and the flow is strongly subsonic near the lower boundary (right row of images). Therefore, it should be underlined that the standoff distance of the bow shock wave from the body is pulsing, too.
Thus, under the action of a stratified source with asymmetrically located hotter layers, a self-sustained pulsating flow mode can be initiated. This mode is undesirable for the flight of aircraft because it can lead to a negative impact on the process of control up to loss of controllability of an AD body. Such a flow mode can be characterized as a pulsating instability of the flow.
Figure 16 shows how to suppress these flow pulsations by changing the temperature in the source layers. Here, the dynamics of pressure, density, and temperature at the top of the body are presented (Figure 16a,b) along with of the average front surface temperature, drag forces, and lift forces (Figure 16b,c). It can be seen that by successively decreasing the temperature (or increasing αj) in the more heated layers, it is possible to partially or completely suppress these oscillations and obtain a stable steady flow mode (green and brown curves). This result is in agreement with [25], where the flow pulsations for one heated layer were obtained. Additionally, we can conclude that pressure and density at the top of the body are practically determined by their values in the layers closest to the axis of symmetry of the body, while the temperatures differ: for a source with more heated layers, the steady value of temperature and average temperature are lower.
For comparison, the results are presented for {αj} = (0.4,0.3,0.8,0.8,0.8) (blue curve), which differs from the set for the green curve {αj} = (0.3,0.4,0.8,0.8,0.8) only in the position of the hotter layer. It can be seen that by bringing the hotter layer closer to the axis of symmetry of the body, the amplitude and period of pulsations can be reduced (blue curve) in comparison with the case for {αj} = (0.3,0.3,0.8,0.8,0.8) (orange curve). It is seen that the suppression of pulsations is more effective in the case designated by the green curve, {αj} = (0.3,0.4,0.8,0.8,0.8). Thus, at the same energy costs, a more effective method for damping the oscillations is when the temperature decreases (or αj increases) in the layers closer to the axis of symmetry of the body.
The corresponding pressure fields in isolines are shown in Figure 16d. In addition, the pressure fields are presented for {αj} = (0.3,0.3,0.8,0.8,0.8) for the time instant of maximum and minimum values of pressure at the top (blue and orange curves, respectively). It can be seen that the position of the bow shock wave is also determined by the temperature of the layers closest to the center: for the green and brown curves, the positions of the bow shock wave practically coincide. In this case, the front of the bow shock wave is located between the fronts for the time instants of maximum and minimum values of pressure at the top (blue and orange curves). In addition, it can be seen that in the region below the symmetry axis of the body, the bow shock wave front becomes rectilinear, and at the periphery, the wave front coincides for the green and brown curves. This means that far from the body, the determining parameters of the stratified source (which also determine the parameters of the bow shock) are the heated layers closest to the body’s symmetry axis.
Thus, it is possible to suppress pulsations by alternately setting lower temperatures in the layers of a permanently operating stratified energy source. In this case, it is also possible to control the flow parameters and the bow shock wave when a steady flow mode is established.
Another approach to suppressing pulsations (orange curves) and converting the flow regime into a stable steady mode (green curves) is demonstrated in Figure 17. Here, we present an example of switching flow modes by changing at a certain moment the parameters of a permanently operating stratified energy source.
Let the parameters of the stratified source be set as follows: {αj} = {αj}1 = (0.3,0.3,0.8,0.8,0.8) for t < 5.4 and {αj} = {αj}2 = (0.4,0.4,0.8,0.8,0.8) for t > 5.4. The dynamics of pressure, density and temperature at the top of the body is presented in Figure 17a,b, along with of the average front surface temperature, drag forces and lift forces (Figure 17b,c). It can be seen that when replacing at t = 5.4 the set of values {αj}1 in the stratified source with the set {αj}2, the flow after several oscillations comes to a steady state (green curves). In this case, in the new steady flow mode, pressure, density, and temperature at the top of the body as well as the drag force of the front surface are set at the maximum level of these parameters in the previous oscillatory mode, and the average surface temperature is set at the minimum values. At the same time, the absolute value of the total lift force decreases.
The corresponding pressure fields in isolines are shown in Figure 17d. In addition, the pressure fields are presented for {αj} = (0.3,0.3,0.8,0.8,0.8) for the time instants of maximum and minimum values of pressure at the top (blue and orange curves, respectively). It can be seen that the position of the bow shock wave is closer to the position at the moment of t corresponding to the maximum pressure at the top. At the same time, the deflection angle of the rectilinear bow shock wave at the periphery (green curve) exceeds the angles established in the oscillatory mode (orange and blue curves).
Thus, it is possible to suppress pulsations and to control the flow parameters and the bow shock wave by switching the sets {αj} in a permanently operating stratified energy source from one to another with lower temperatures in the layers.

5.2. Organization of the Opposite Effect on the Front Surfaces of the Body and the Initiation of Oppositely Directed Lift (Pitch) Forces

Consider the fields of density for {αj} = (0.3,0.3,0.8,0.8,0.8) (left row) and for according reverse sets {αj}R = (0.8,0.8,0.8,0.3,0.3) (right row) (Figure 18). It can be seen that at different times, the flow patterns are exactly opposite (compare the images in the left and right rows). This is due to the assumption that the axis of symmetry of the stratified source coincides with the axis of symmetry of an AD body; i.e., the source is rigidly fixed relative to the body.
Dynamics of flow characteristics for the reverse set {αj}R = (0.8,0.8,0.8,0.3,0.3) are presented in Figure 19. Dynamics of pressure, density, and temperature at the top of the body are presented in Figure 19a,b (green, orange and blue curves). One can see that the dynamic of these parameters is quite the same as for {αj} = (0.3,0.3,0.8,0.8,0.8) (compare with Figure 14a,b). The same can be said about the dynamics of the average temperature of the frontal surface and the drag force Fdrag (purple and green curves in Figure 19b). However, forces Fdragtop and Fdragbottom are exactly opposite in magnitude (compare Figure 19b and Figure 14b, brown and orange curves). The dynamics of lift forces for {αj}R are shown in Figure 19c. For comparison, the dashed lines show the dynamics of lift forces for {αj}. It can be seen that a stratified source with a reverse set {αj}R produces equal, in absolute value, and reversely directed lift forces acting on the body.
Thus, a stratified source with a reverse set {αj}R = (α5,α4,α3,α2,α1) produces the same drag force Fdrag and the parameters at the top as well as the average front surface temperature as in the case of {αj} = (α1,α2,α3,α4,α5) but an oppositely directed lift (pitch) force (at zero angle of attack).
A natural continuation of the analysis of flow characteristics under the influence of a stratified source with a reversible set {αj}R in its layers becomes the approach with switching the steady flow modes with obtaining oppositely directed lift (pitch) forces.
This approach is illustrated by Figure 20. First, a steady flow mode is reached for the set {αj} = (0.4,0.4,0.8,0.8,0.8), t = 5.0 (orange curves). Then, the set {αj} = (0.4,0.4,0.8,0.8,0.8) in the stratified source is replaced by the set {αj}R = (0.8,0.8,0.8,0.4,0.4) (green curves). It can be seen that after several oscillations, a new steady flow mode is established with the same flow characteristics but with an oppositely directed total lift force (Figure 20a–c). The pressure fields in the isolines are shown in Figure 20d. It can be seen that the flow patterns are exactly symmetrical, which is to be expected given that the symmetry axis of the stratified source coincides with the symmetry axis of the body.
Thus, one steady flow mode can be changed to another steady mode characterized by an oppositely directed lift (pitch) force by switching the set {αj} = (α1,α2,α3,α4,α5) in the stratified source to the reverse one {αj}R = (α5,α4,α3,α2,α1). In this case, the drag force Fdrag and the parameters at the top as well as the average front surface temperature do not change.

6. Discussion

It should be noted that in this work, symmetrical and asymmetric vortex structures (mushroom structures) initiated by the Richtmyer–Meshkov instability are not clearly visible (Figure 3, Figure 6, Figure 12, and Figure 18; t = 1.2, 1.4). This is due to the fact that since the source is set on the left boundary (x = 0) and moves towards the bow shock wave for some time, the boundaries of the initial layers have time to undergo the dissipation due to the action of physical viscosity and thermal conductivity before interaction with the bow shock (as would happen in a real situation when using such an energy source). Therefore, the boundaries of the layers (which are contact discontinuities in the inviscid approach) are somewhat smeared, which contributes to the weakening of the vortices in the vortex structures emerging as the result of the interaction of the layers with the bow shock wave.
To confirm the conclusion about the manifestation of the Richtmyer–Meshkov instability, let us demonstrate the density fields in the case that when at the initial moment, the stratified source is located in the immediate vicinity of the bow shock (Figure 21). In this case, it does not have time to be strongly affected by the dissipation (Figure 21a), and the manifestation of the Richtmyer–Meshkov instability is noticeably clearer (Figure 21b). An enlarged image of the flow density field is presented in Figure 21c and in surface view in Figure 21d. The mushroom structures accompanying the Richtmyer–Meshkov instability causing by the baroclinic effects and generation of vorticity on the boundary can be seen [39]. In addition, a multiple structure of sharp peaks is visible (Figure 21d), which is formed in the points of manifestation of the instability (red dots in Figure 21c) and directly indicates the generation of this instability.

7. Conclusions

The basic approaches for controlling the bow shock wave, drag and lift (pitch) forces, and stability in a steady supersonic flow past an AD body using permanently operating thermally stratified energy deposition were herein developed. A detailed visualization of the dynamics of the fields of density, pressure, temperature, and local Mach number is presented during the steady flow mode establishing. The axis of symmetry of the stratified source was supposed to coincide with the axis of symmetry of an AD body. It was shown that a new steady flow mode established under the action of the stratified source differs significantly from the initial unperturbed one. The new results obtained on the influence of a permanently acting stratified energy source on a steady flow past an AD body are as follows:
-
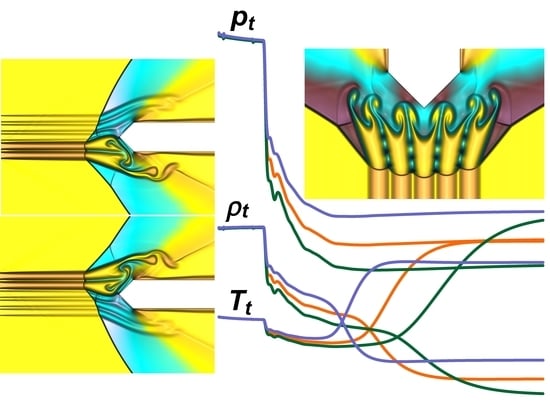
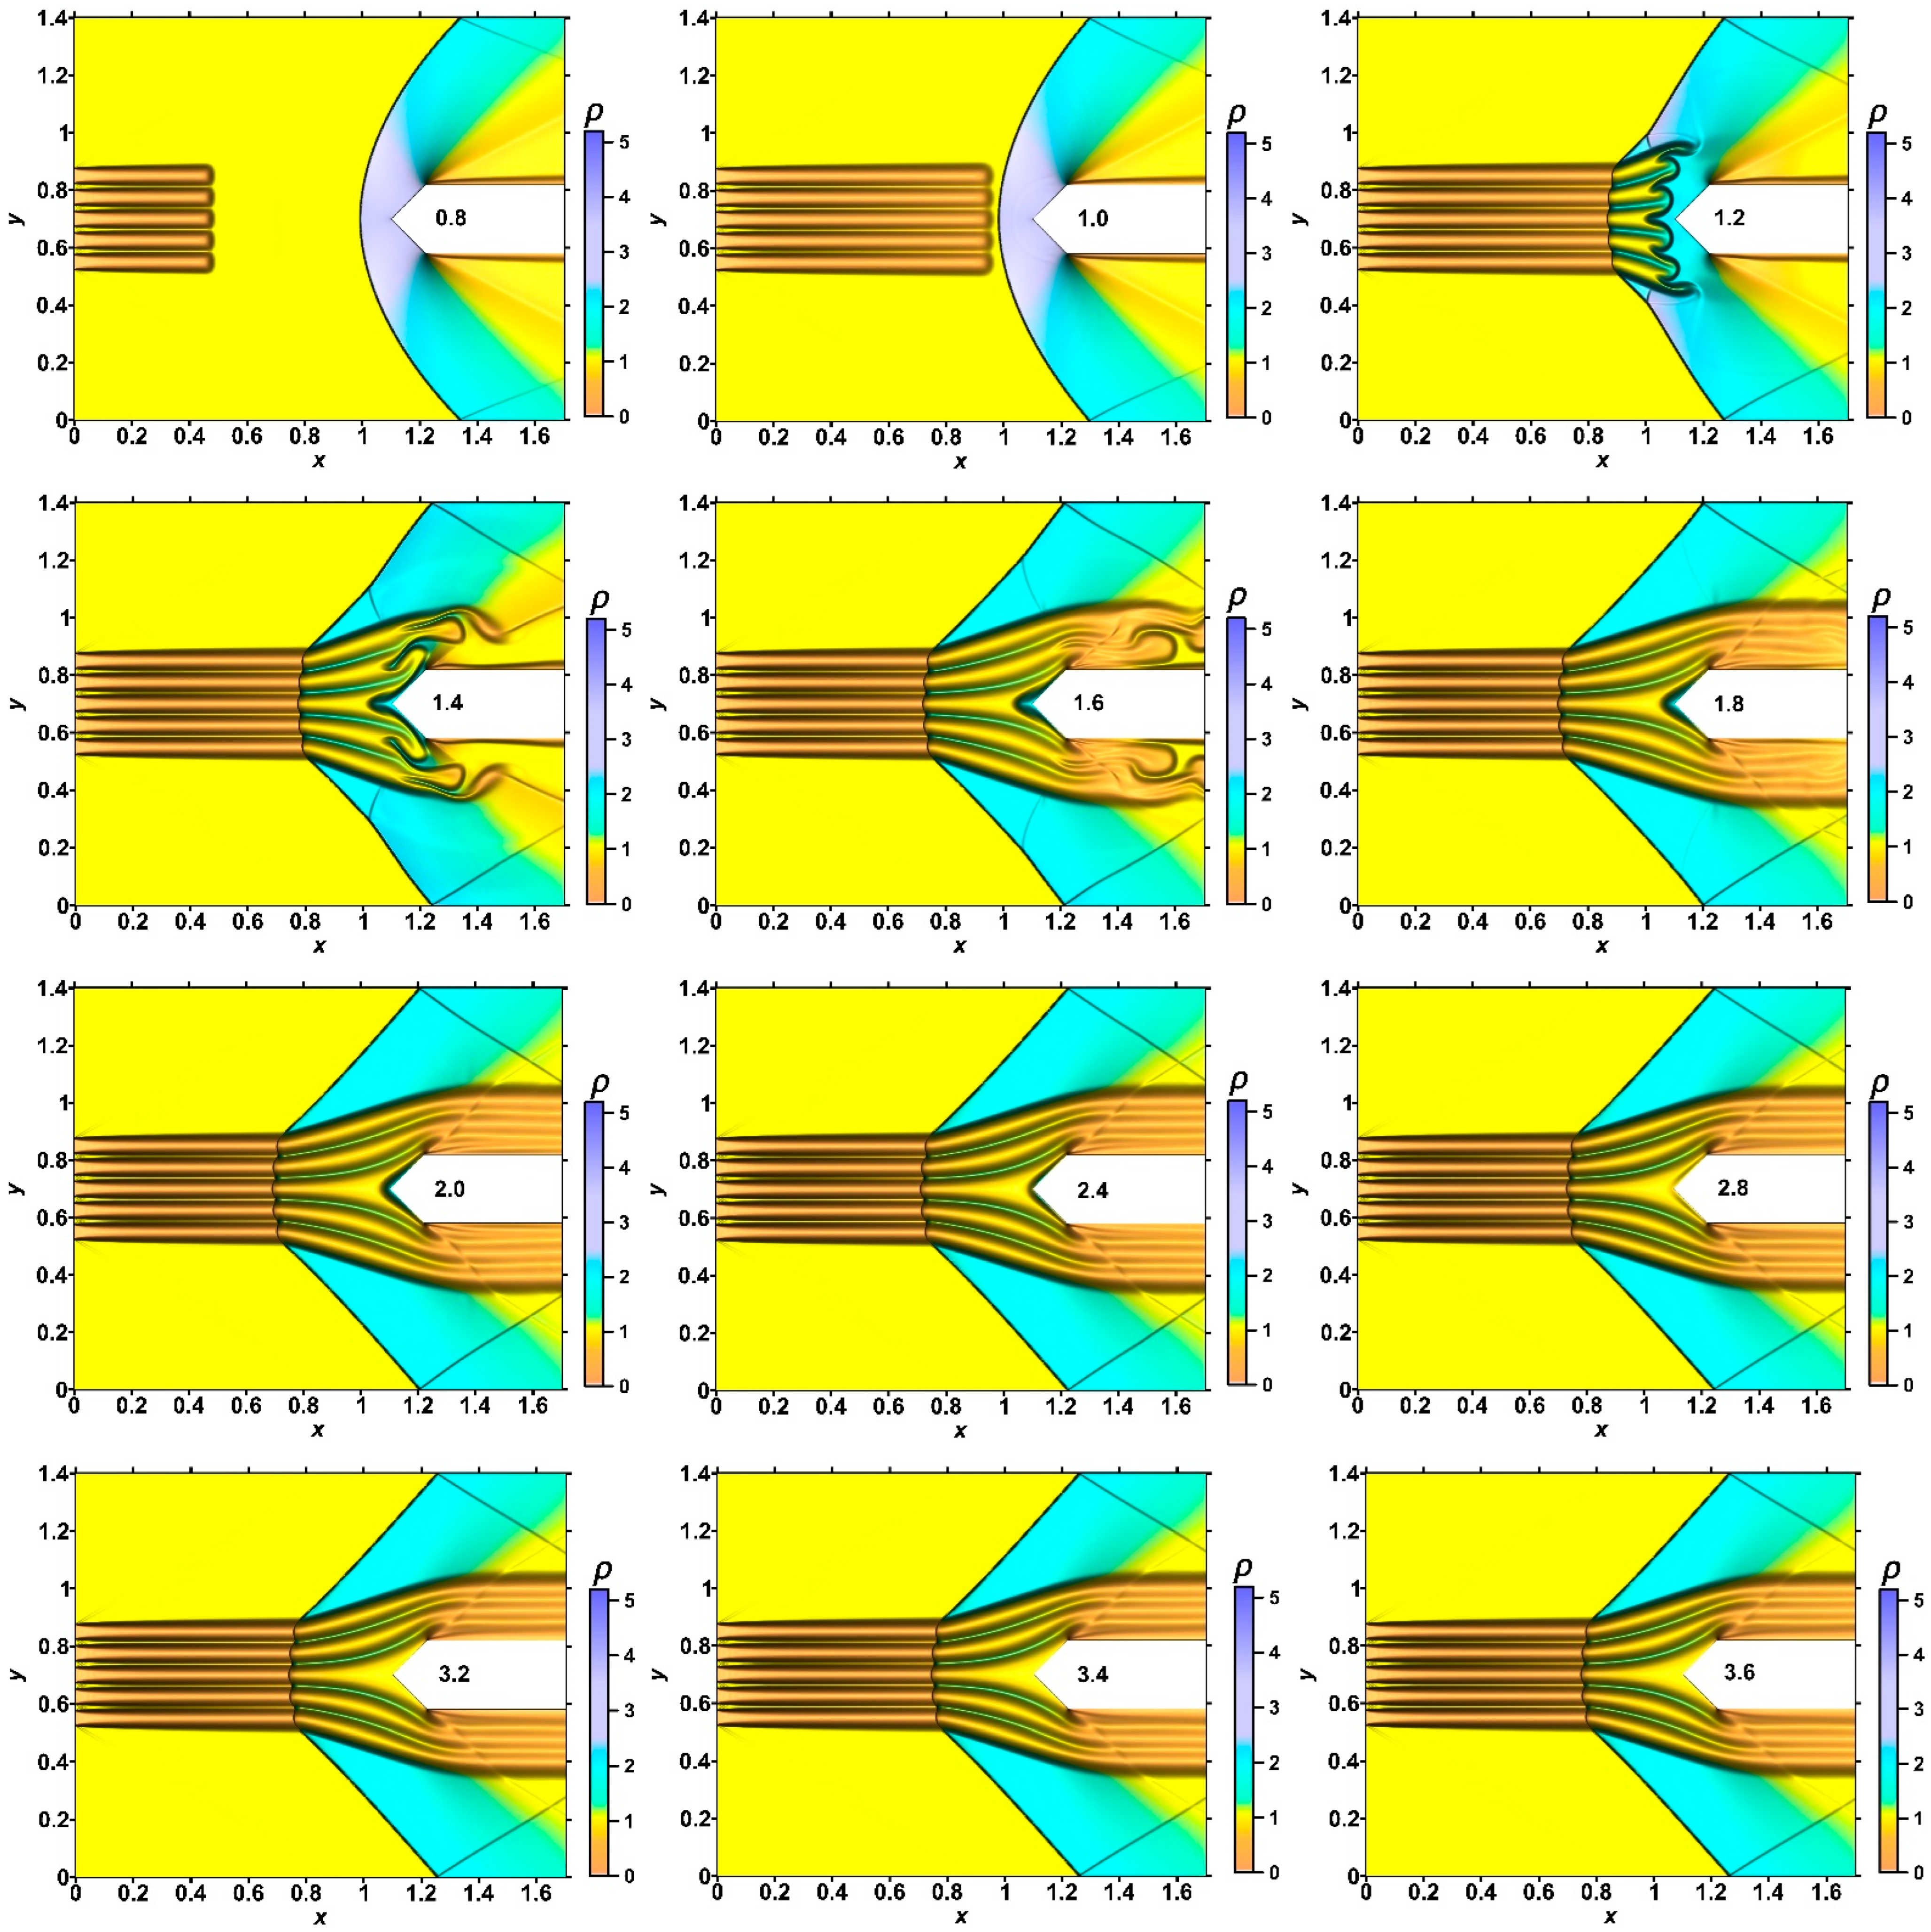
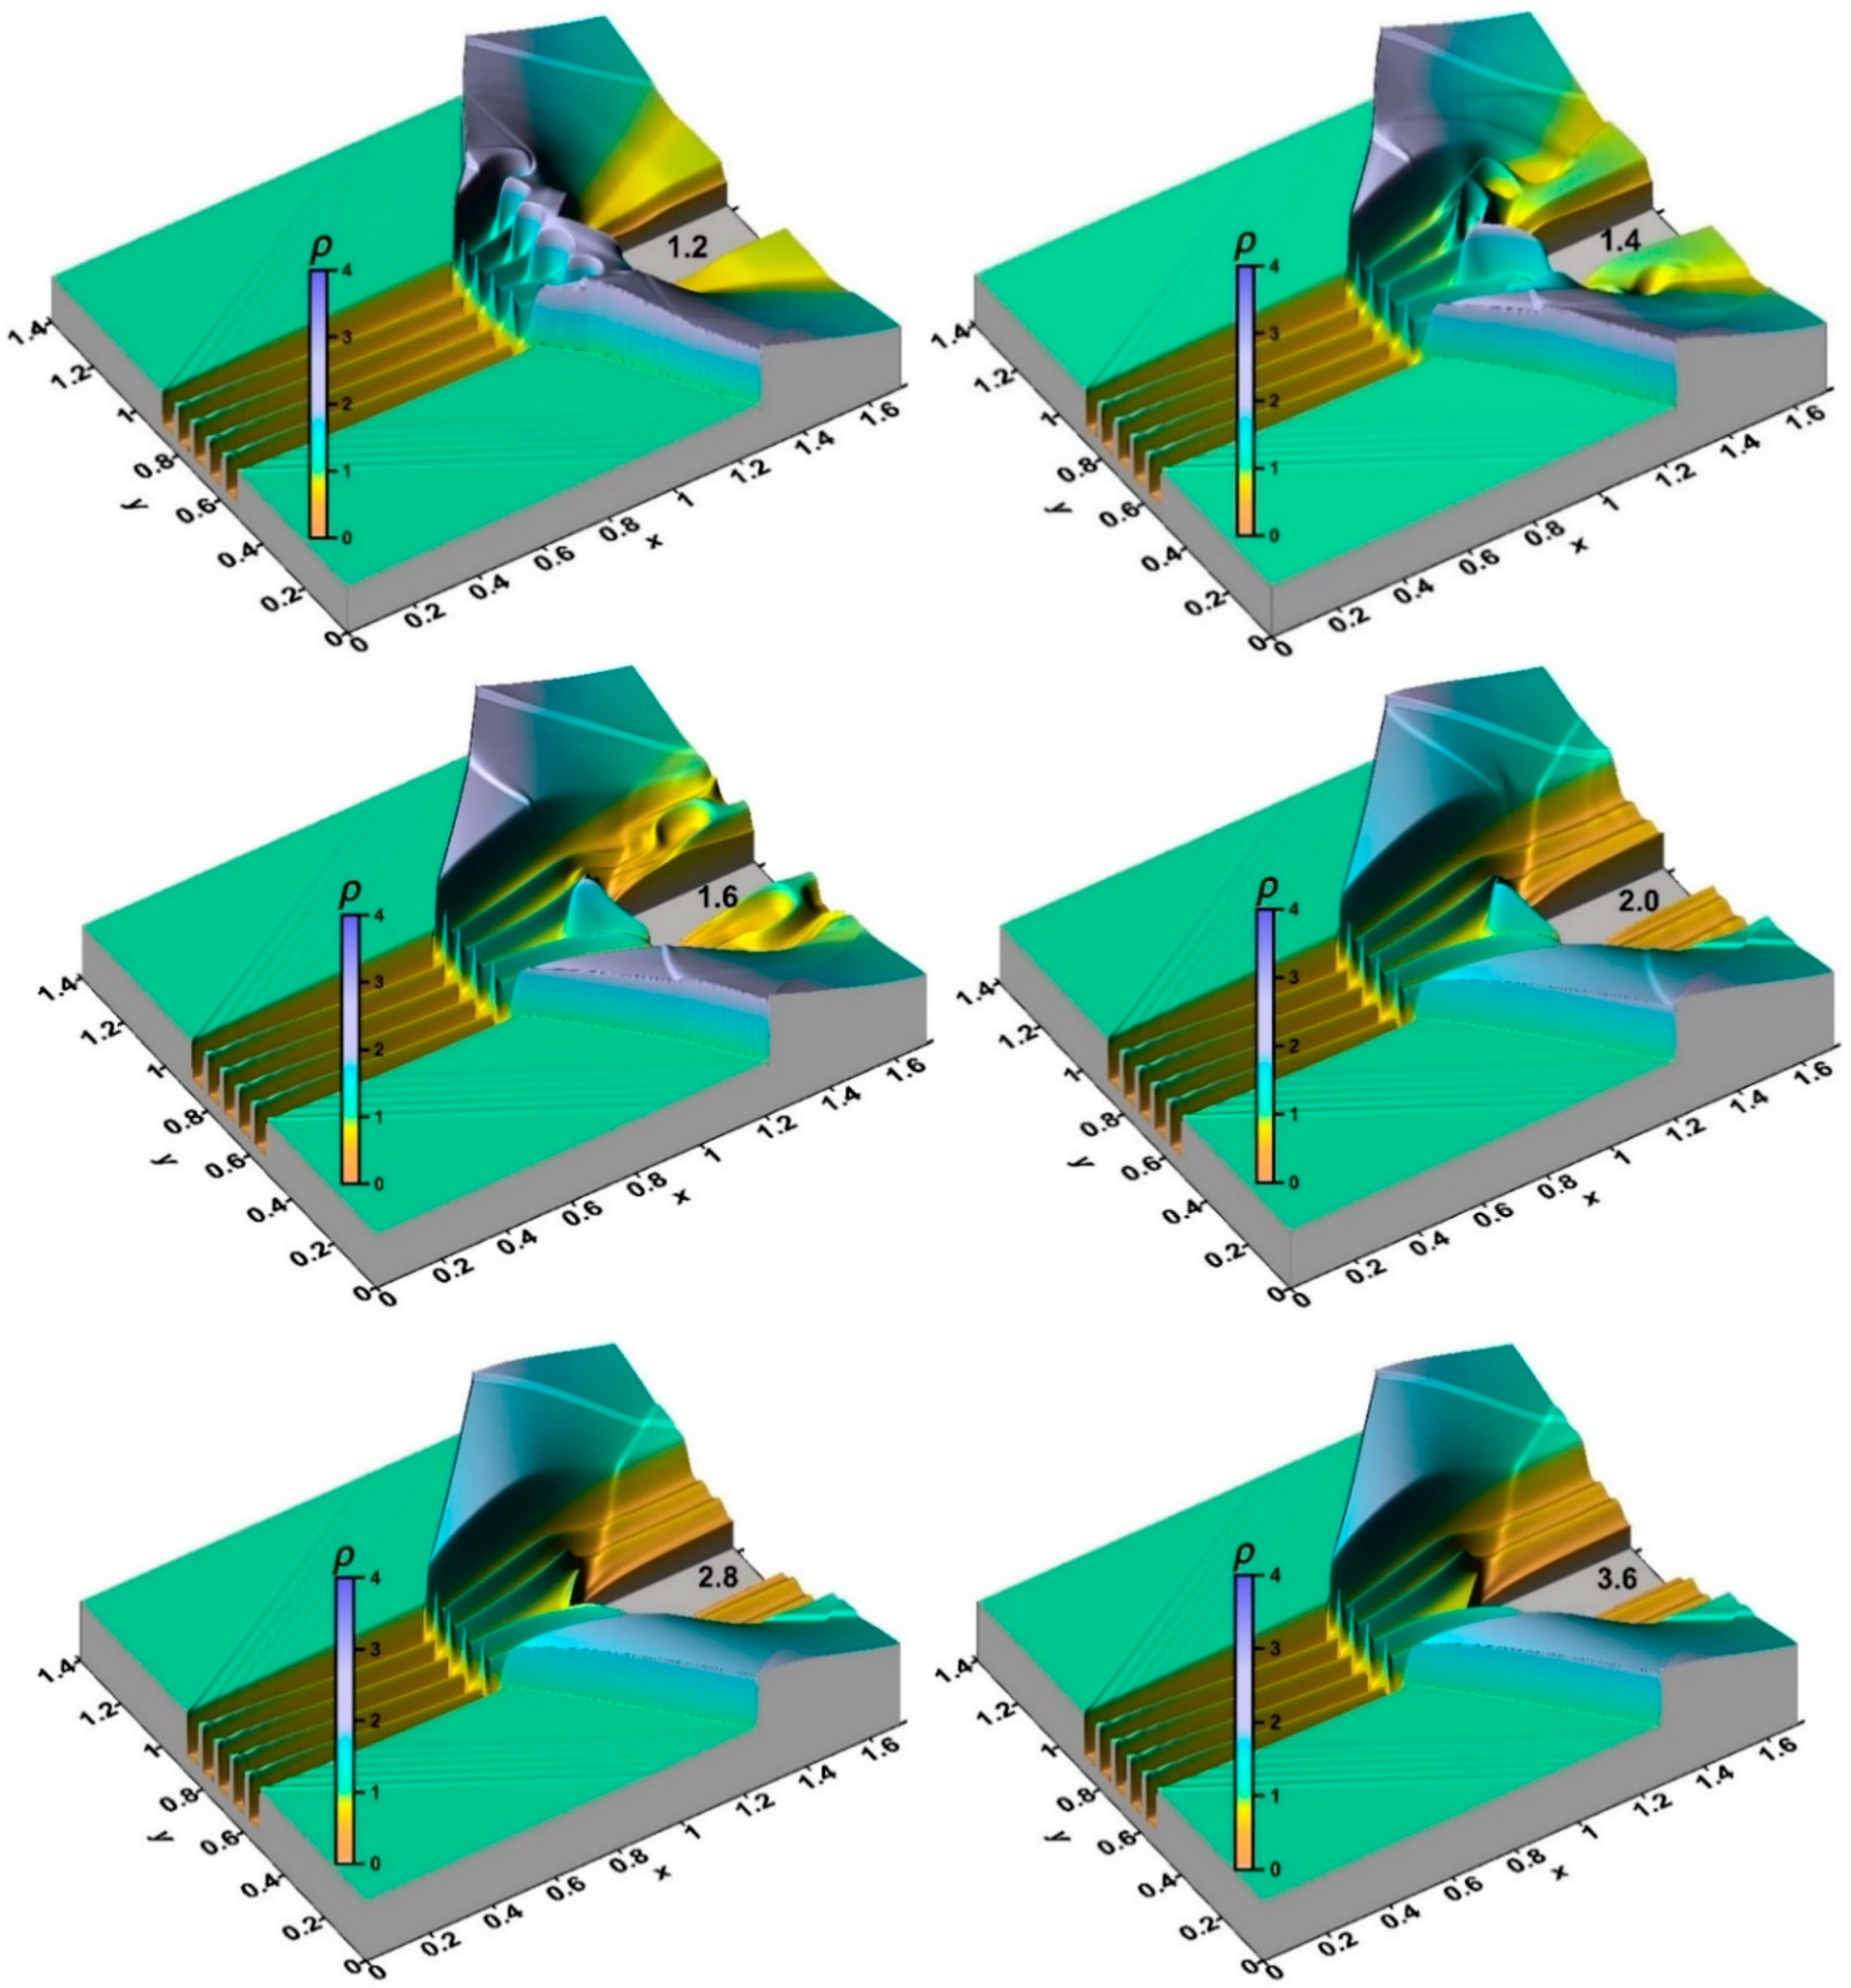
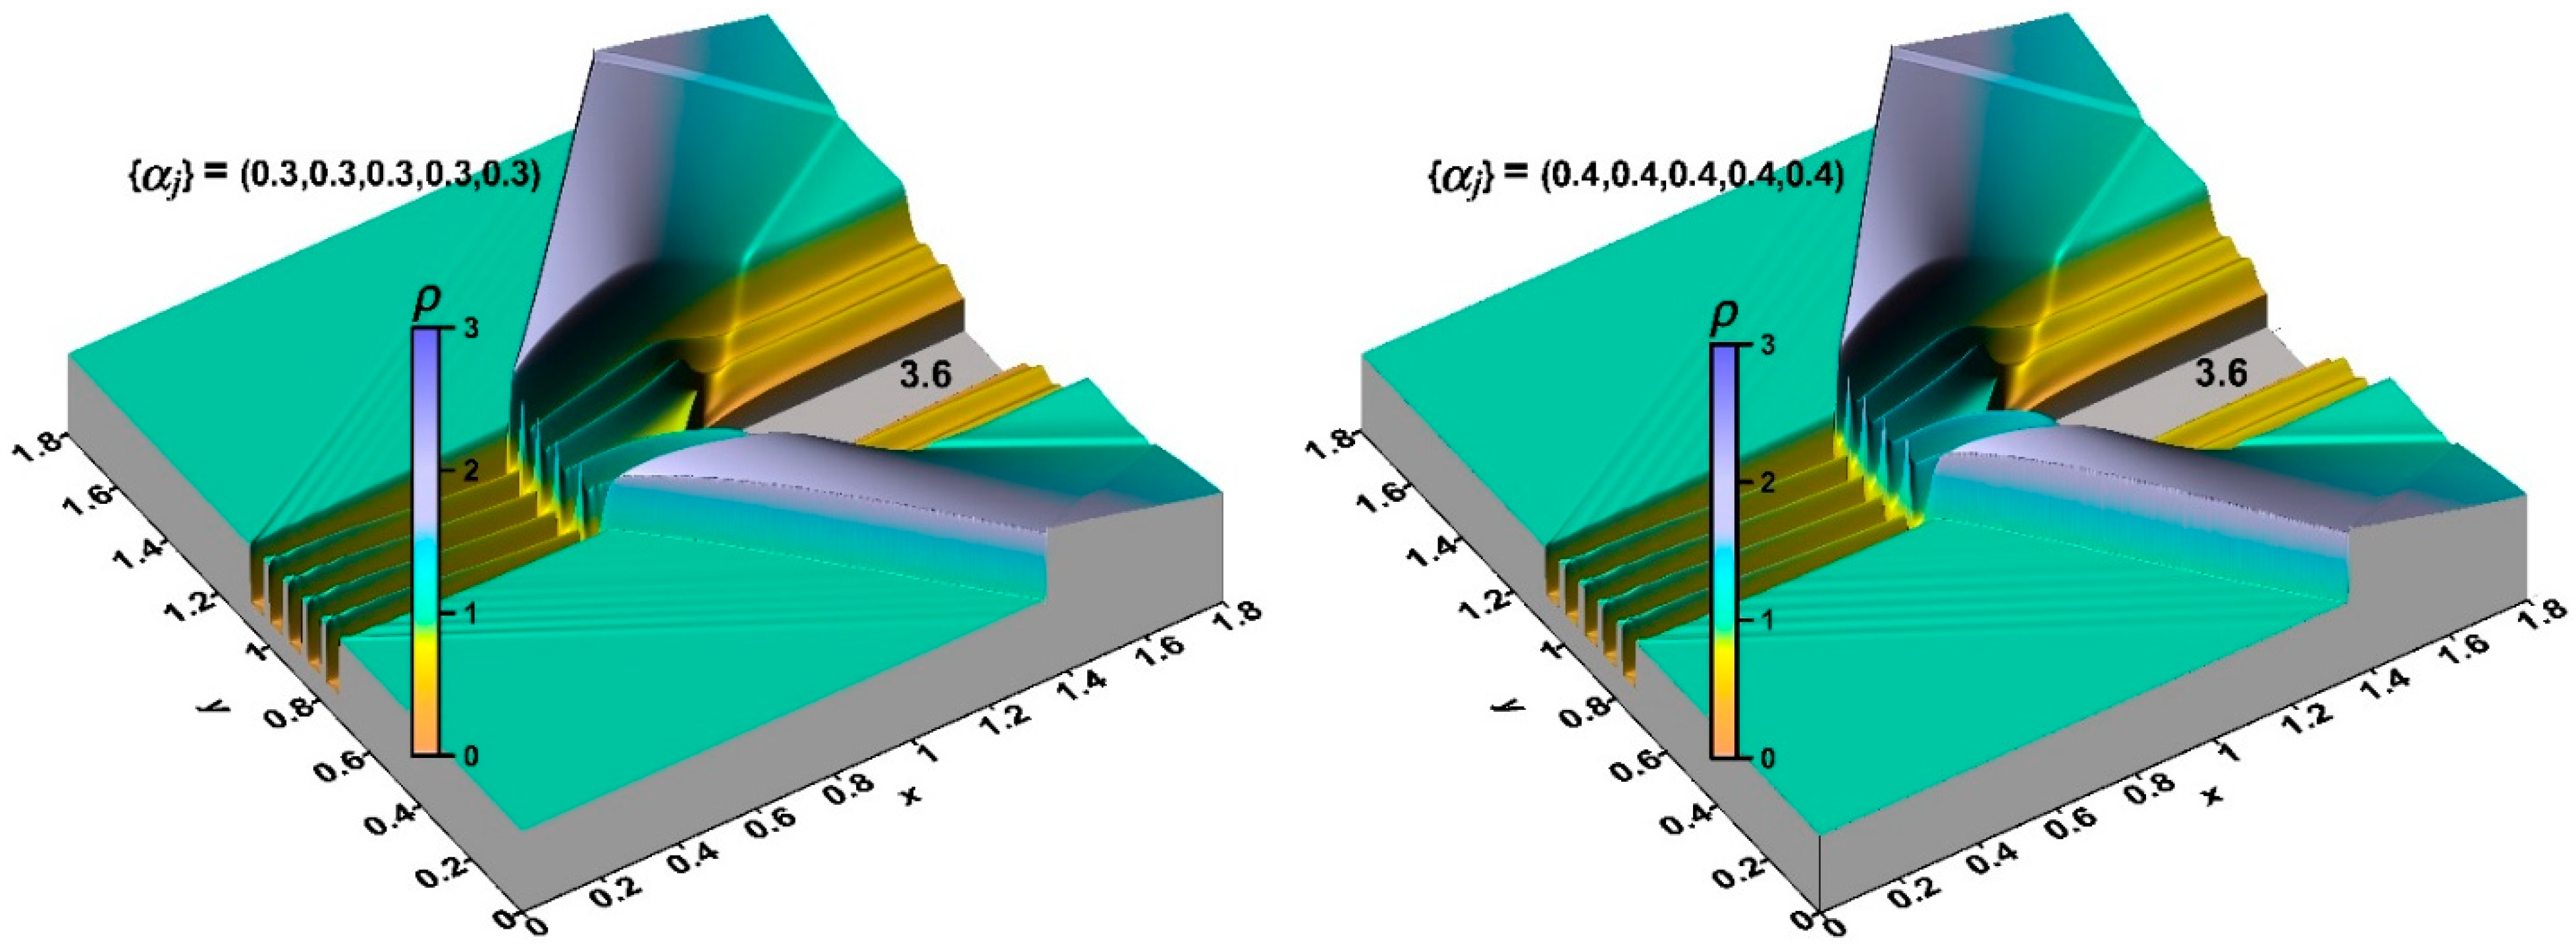
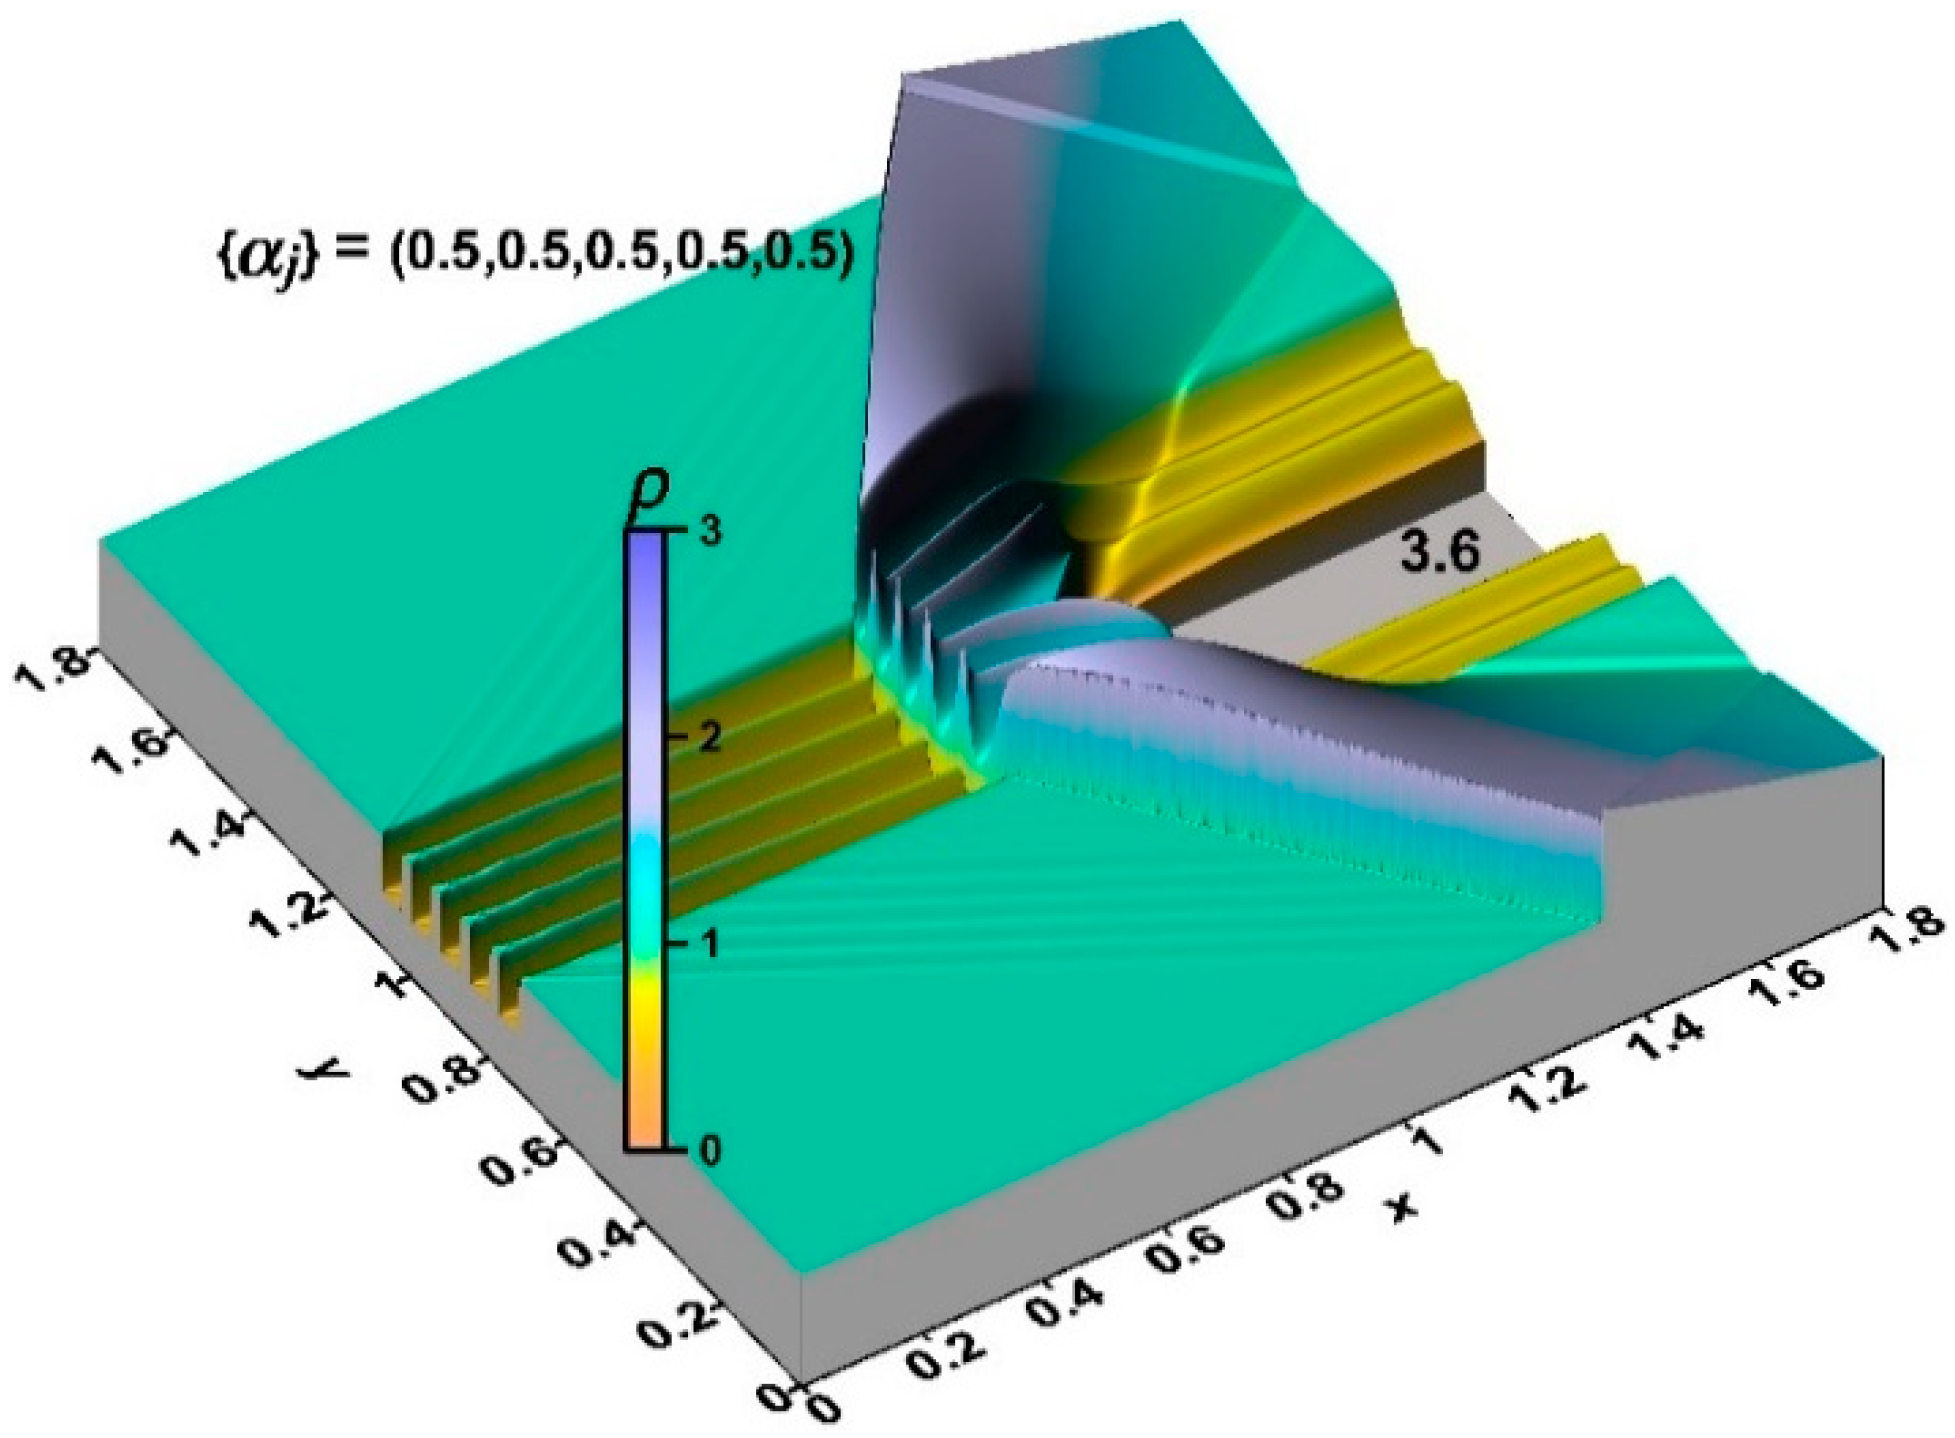
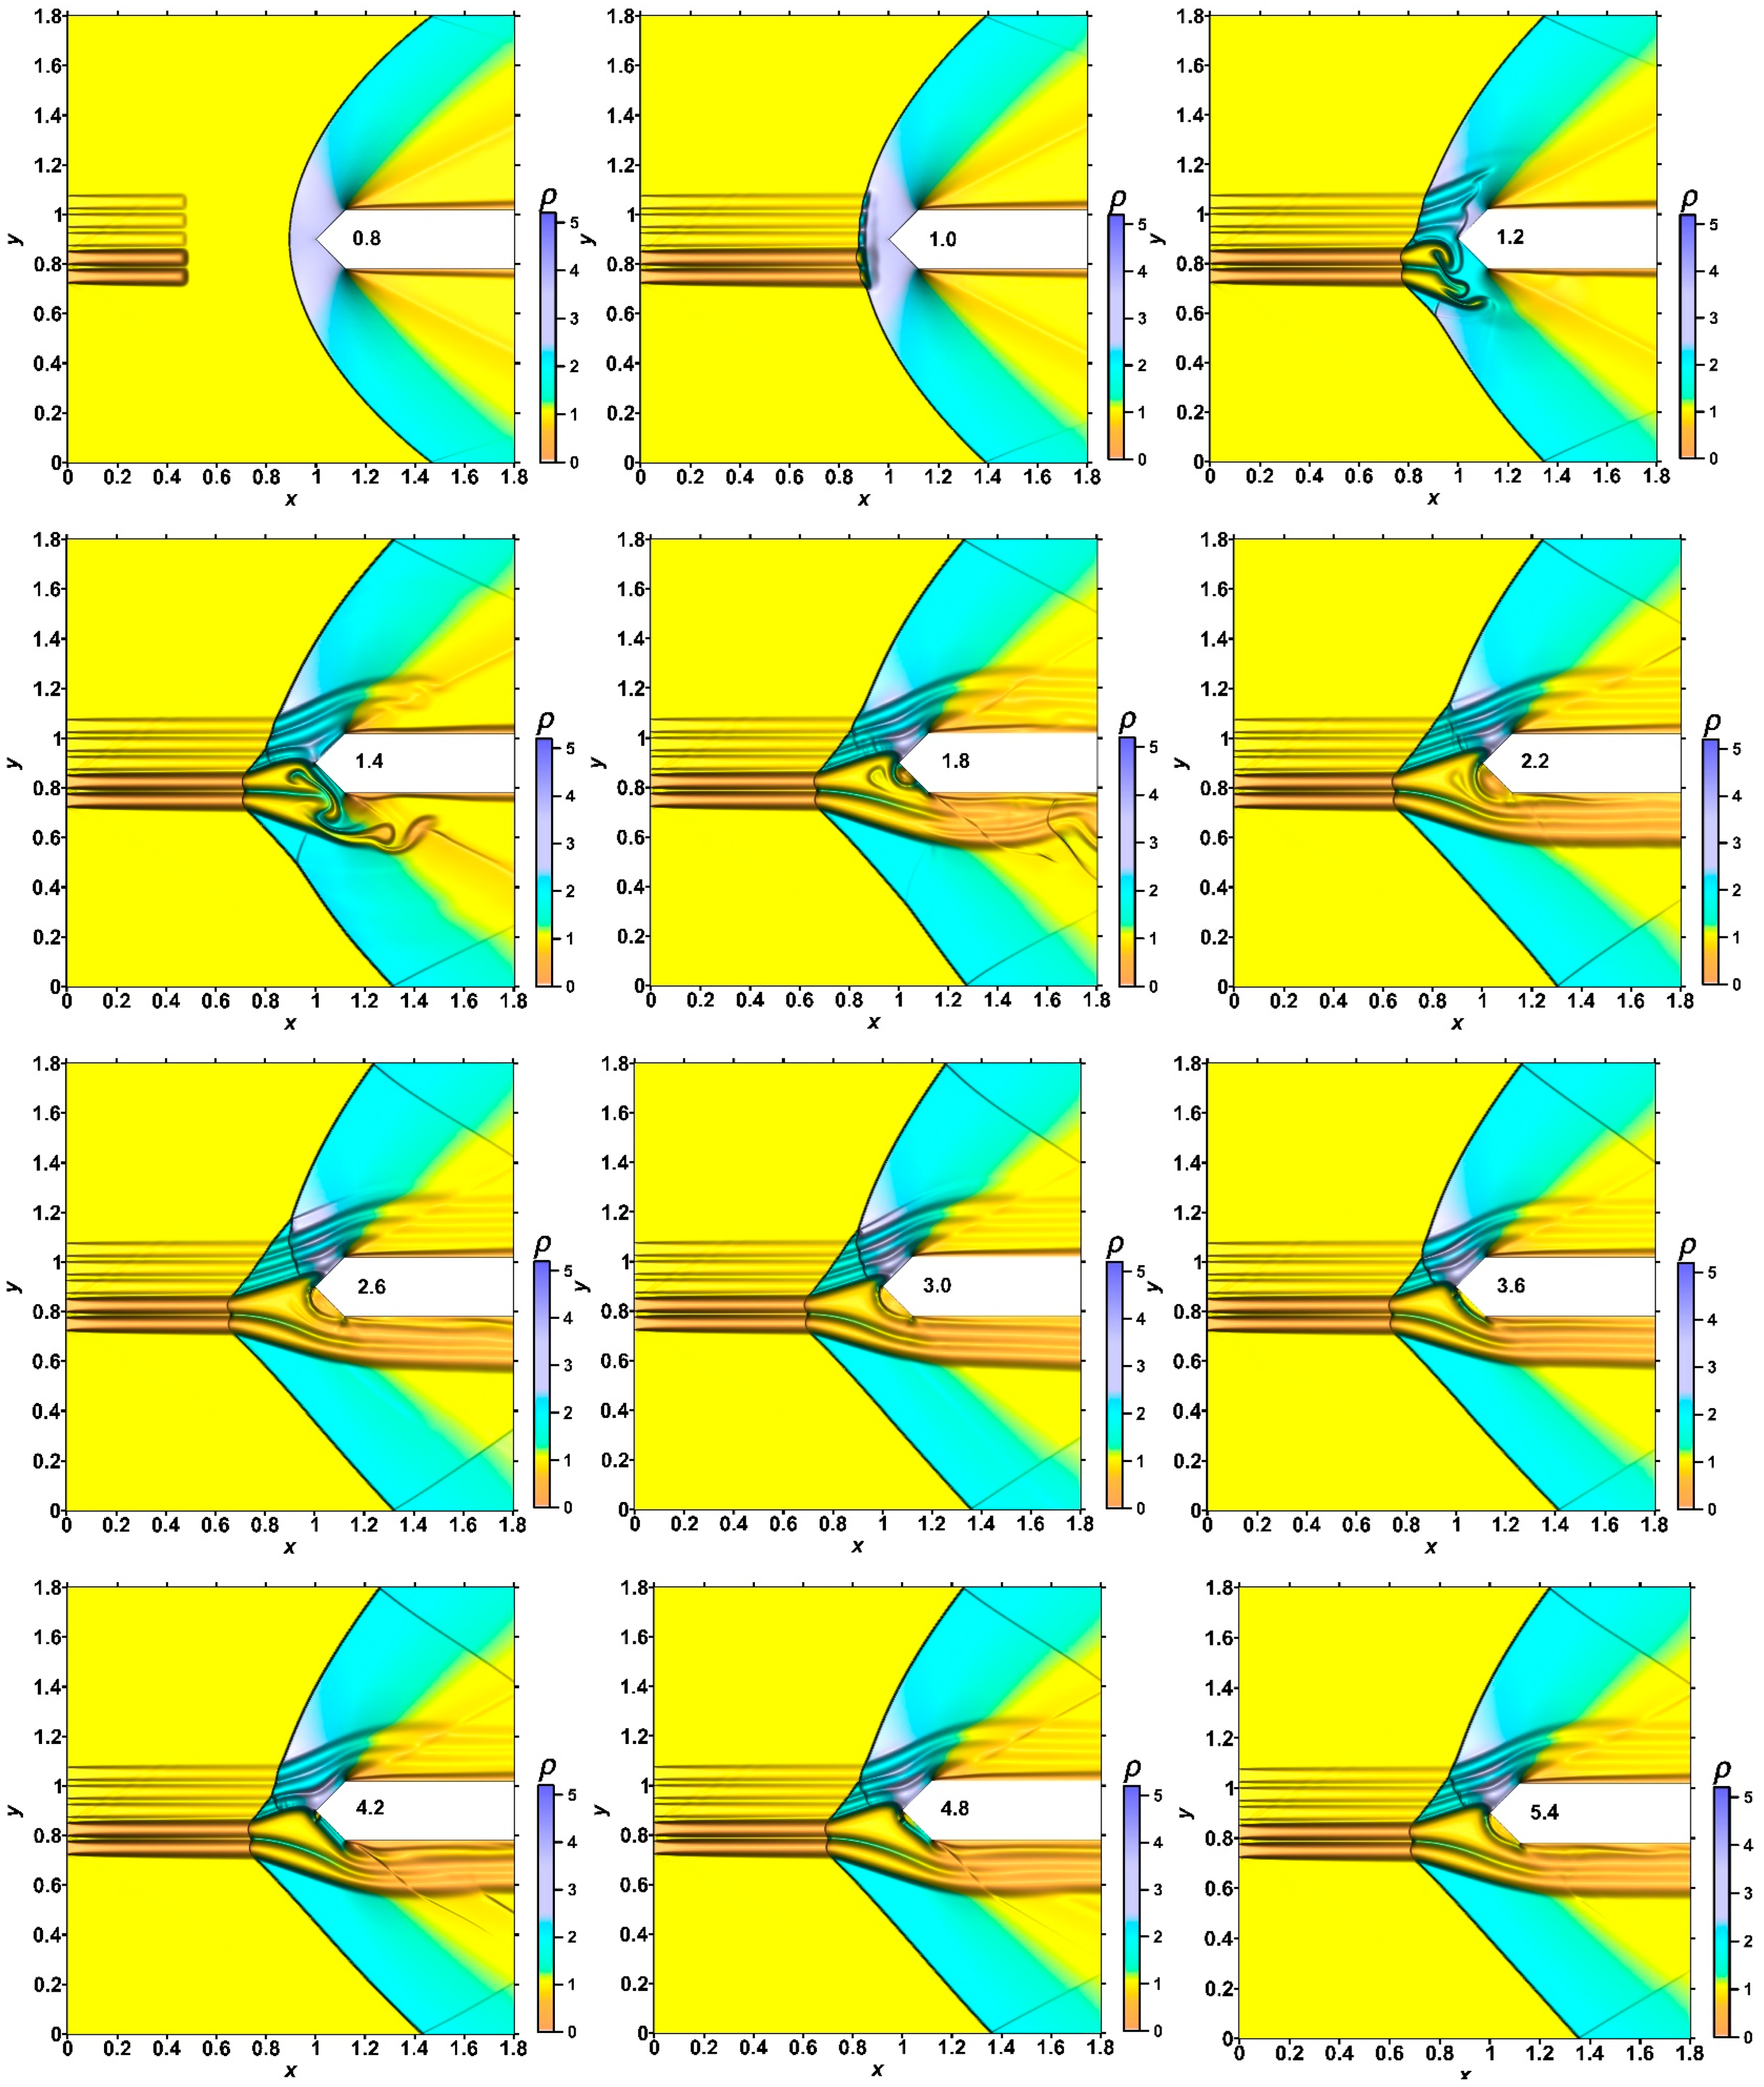
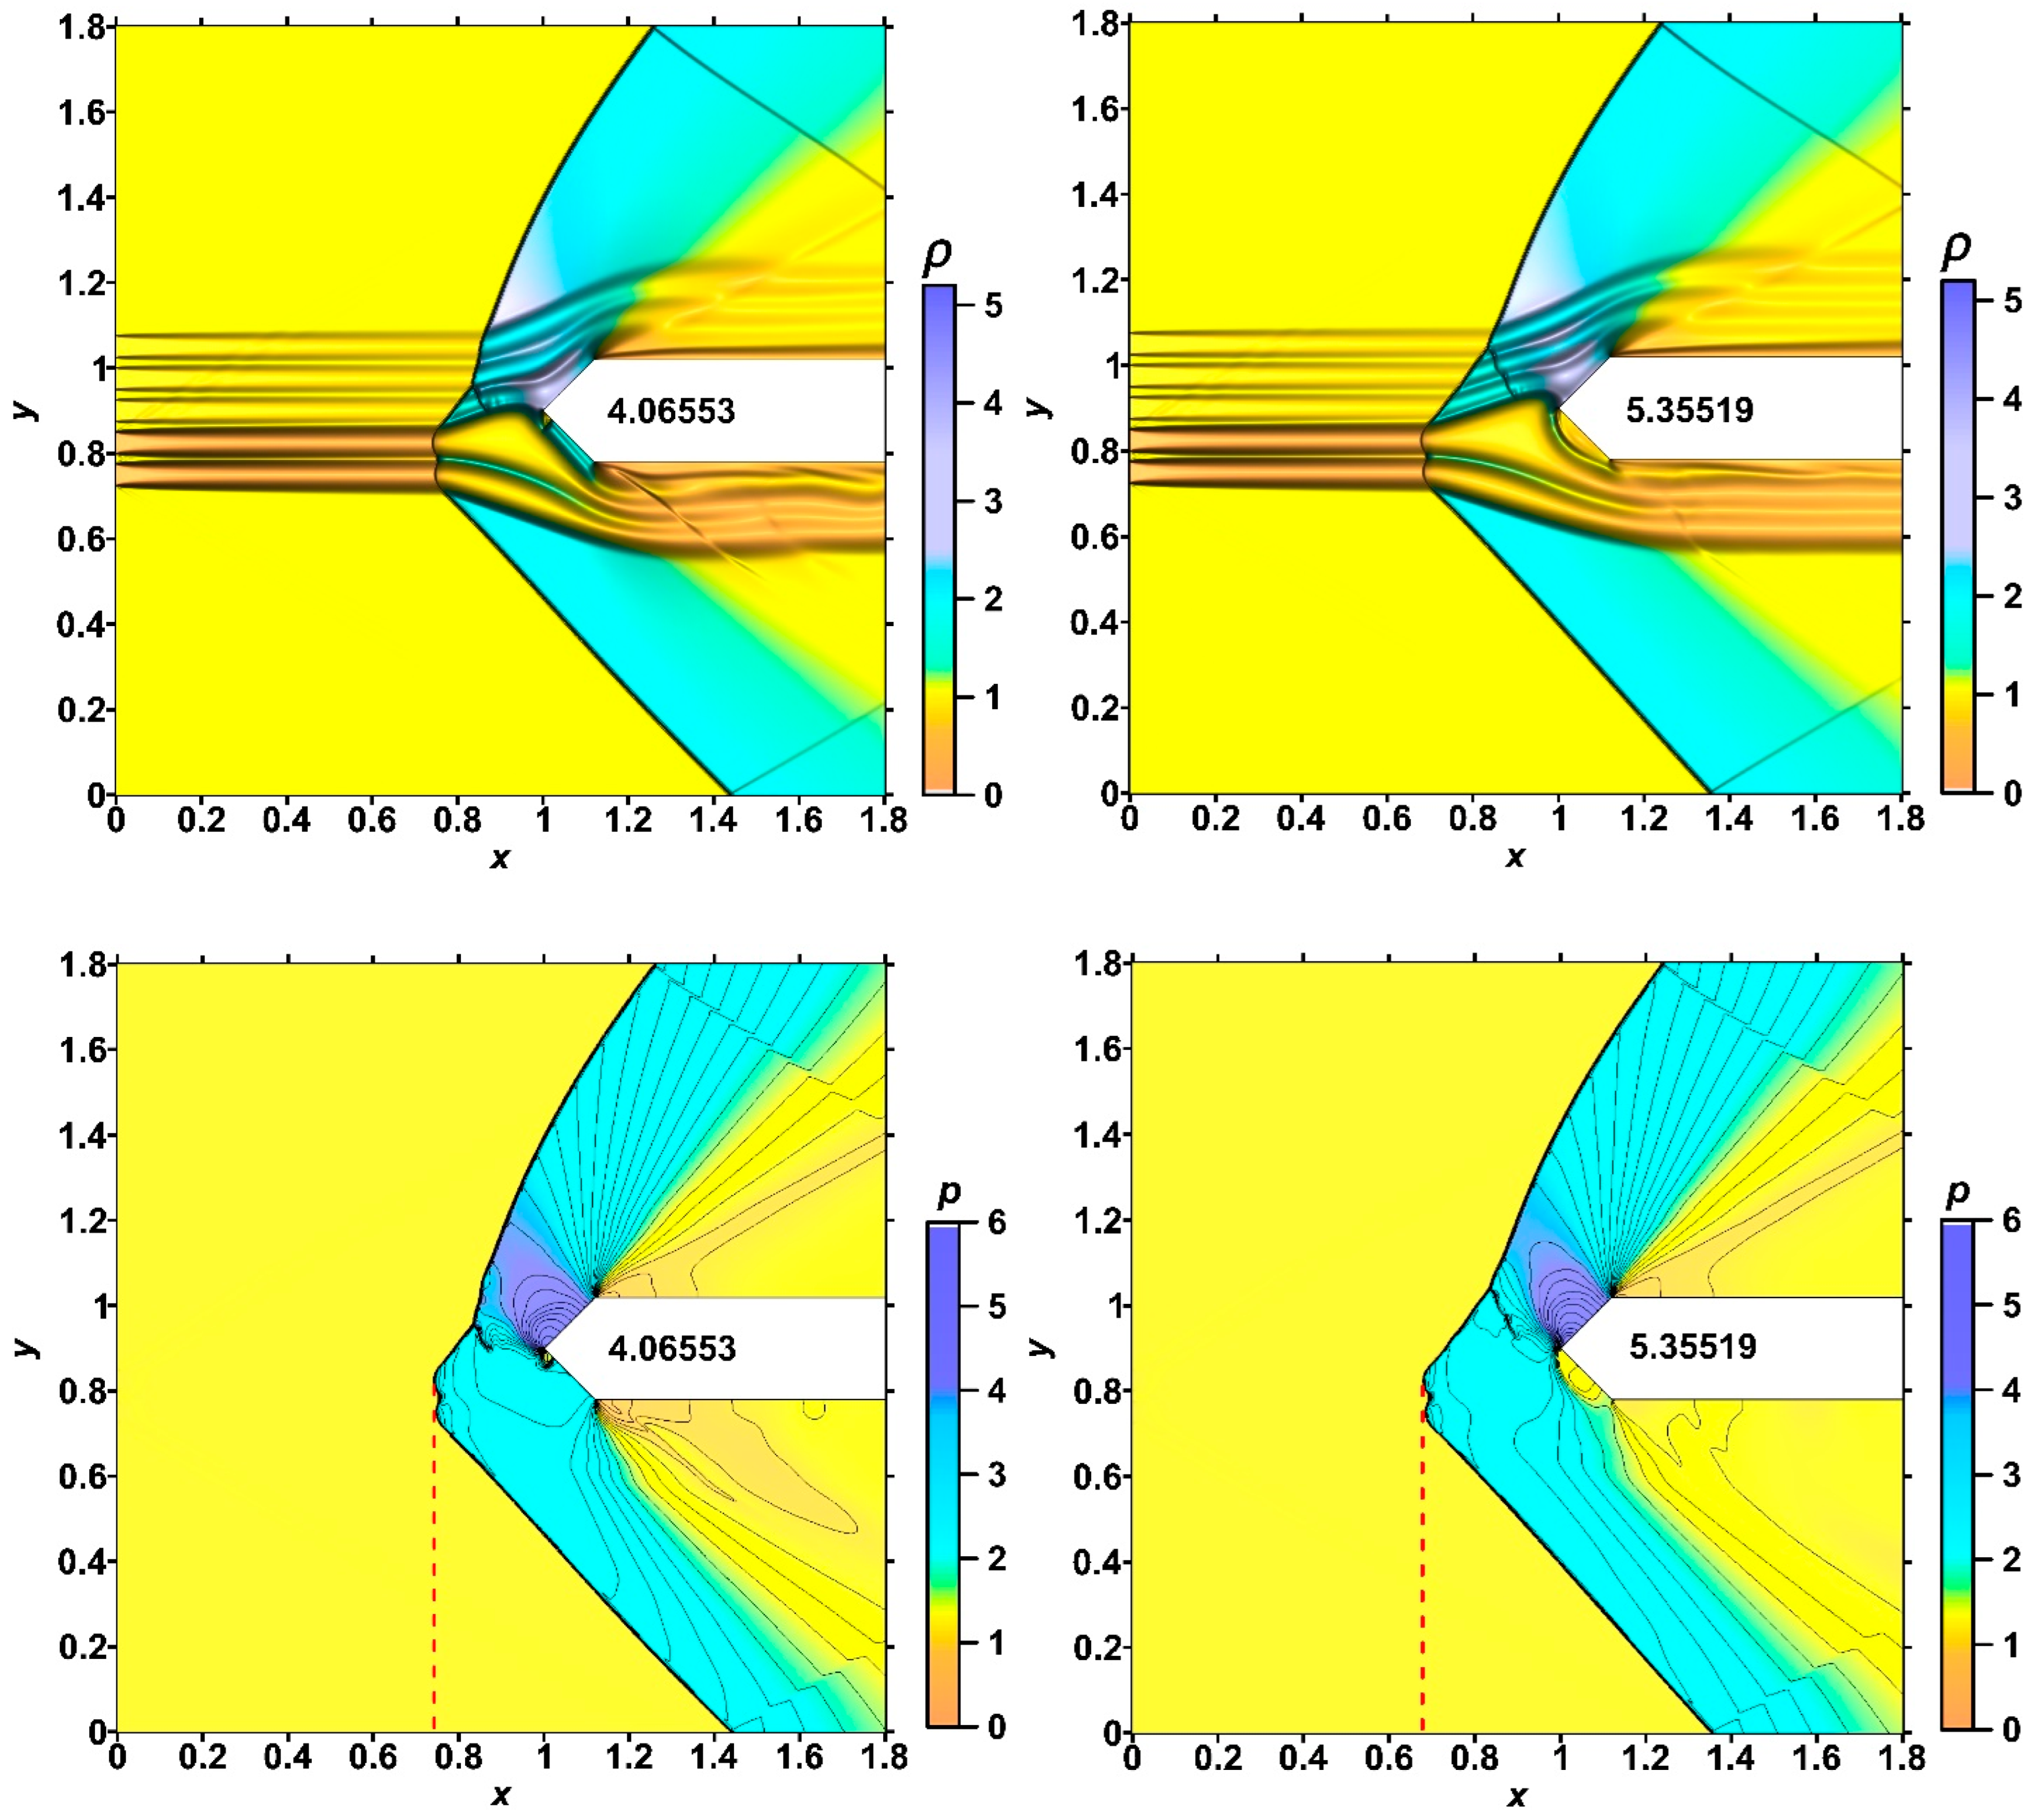
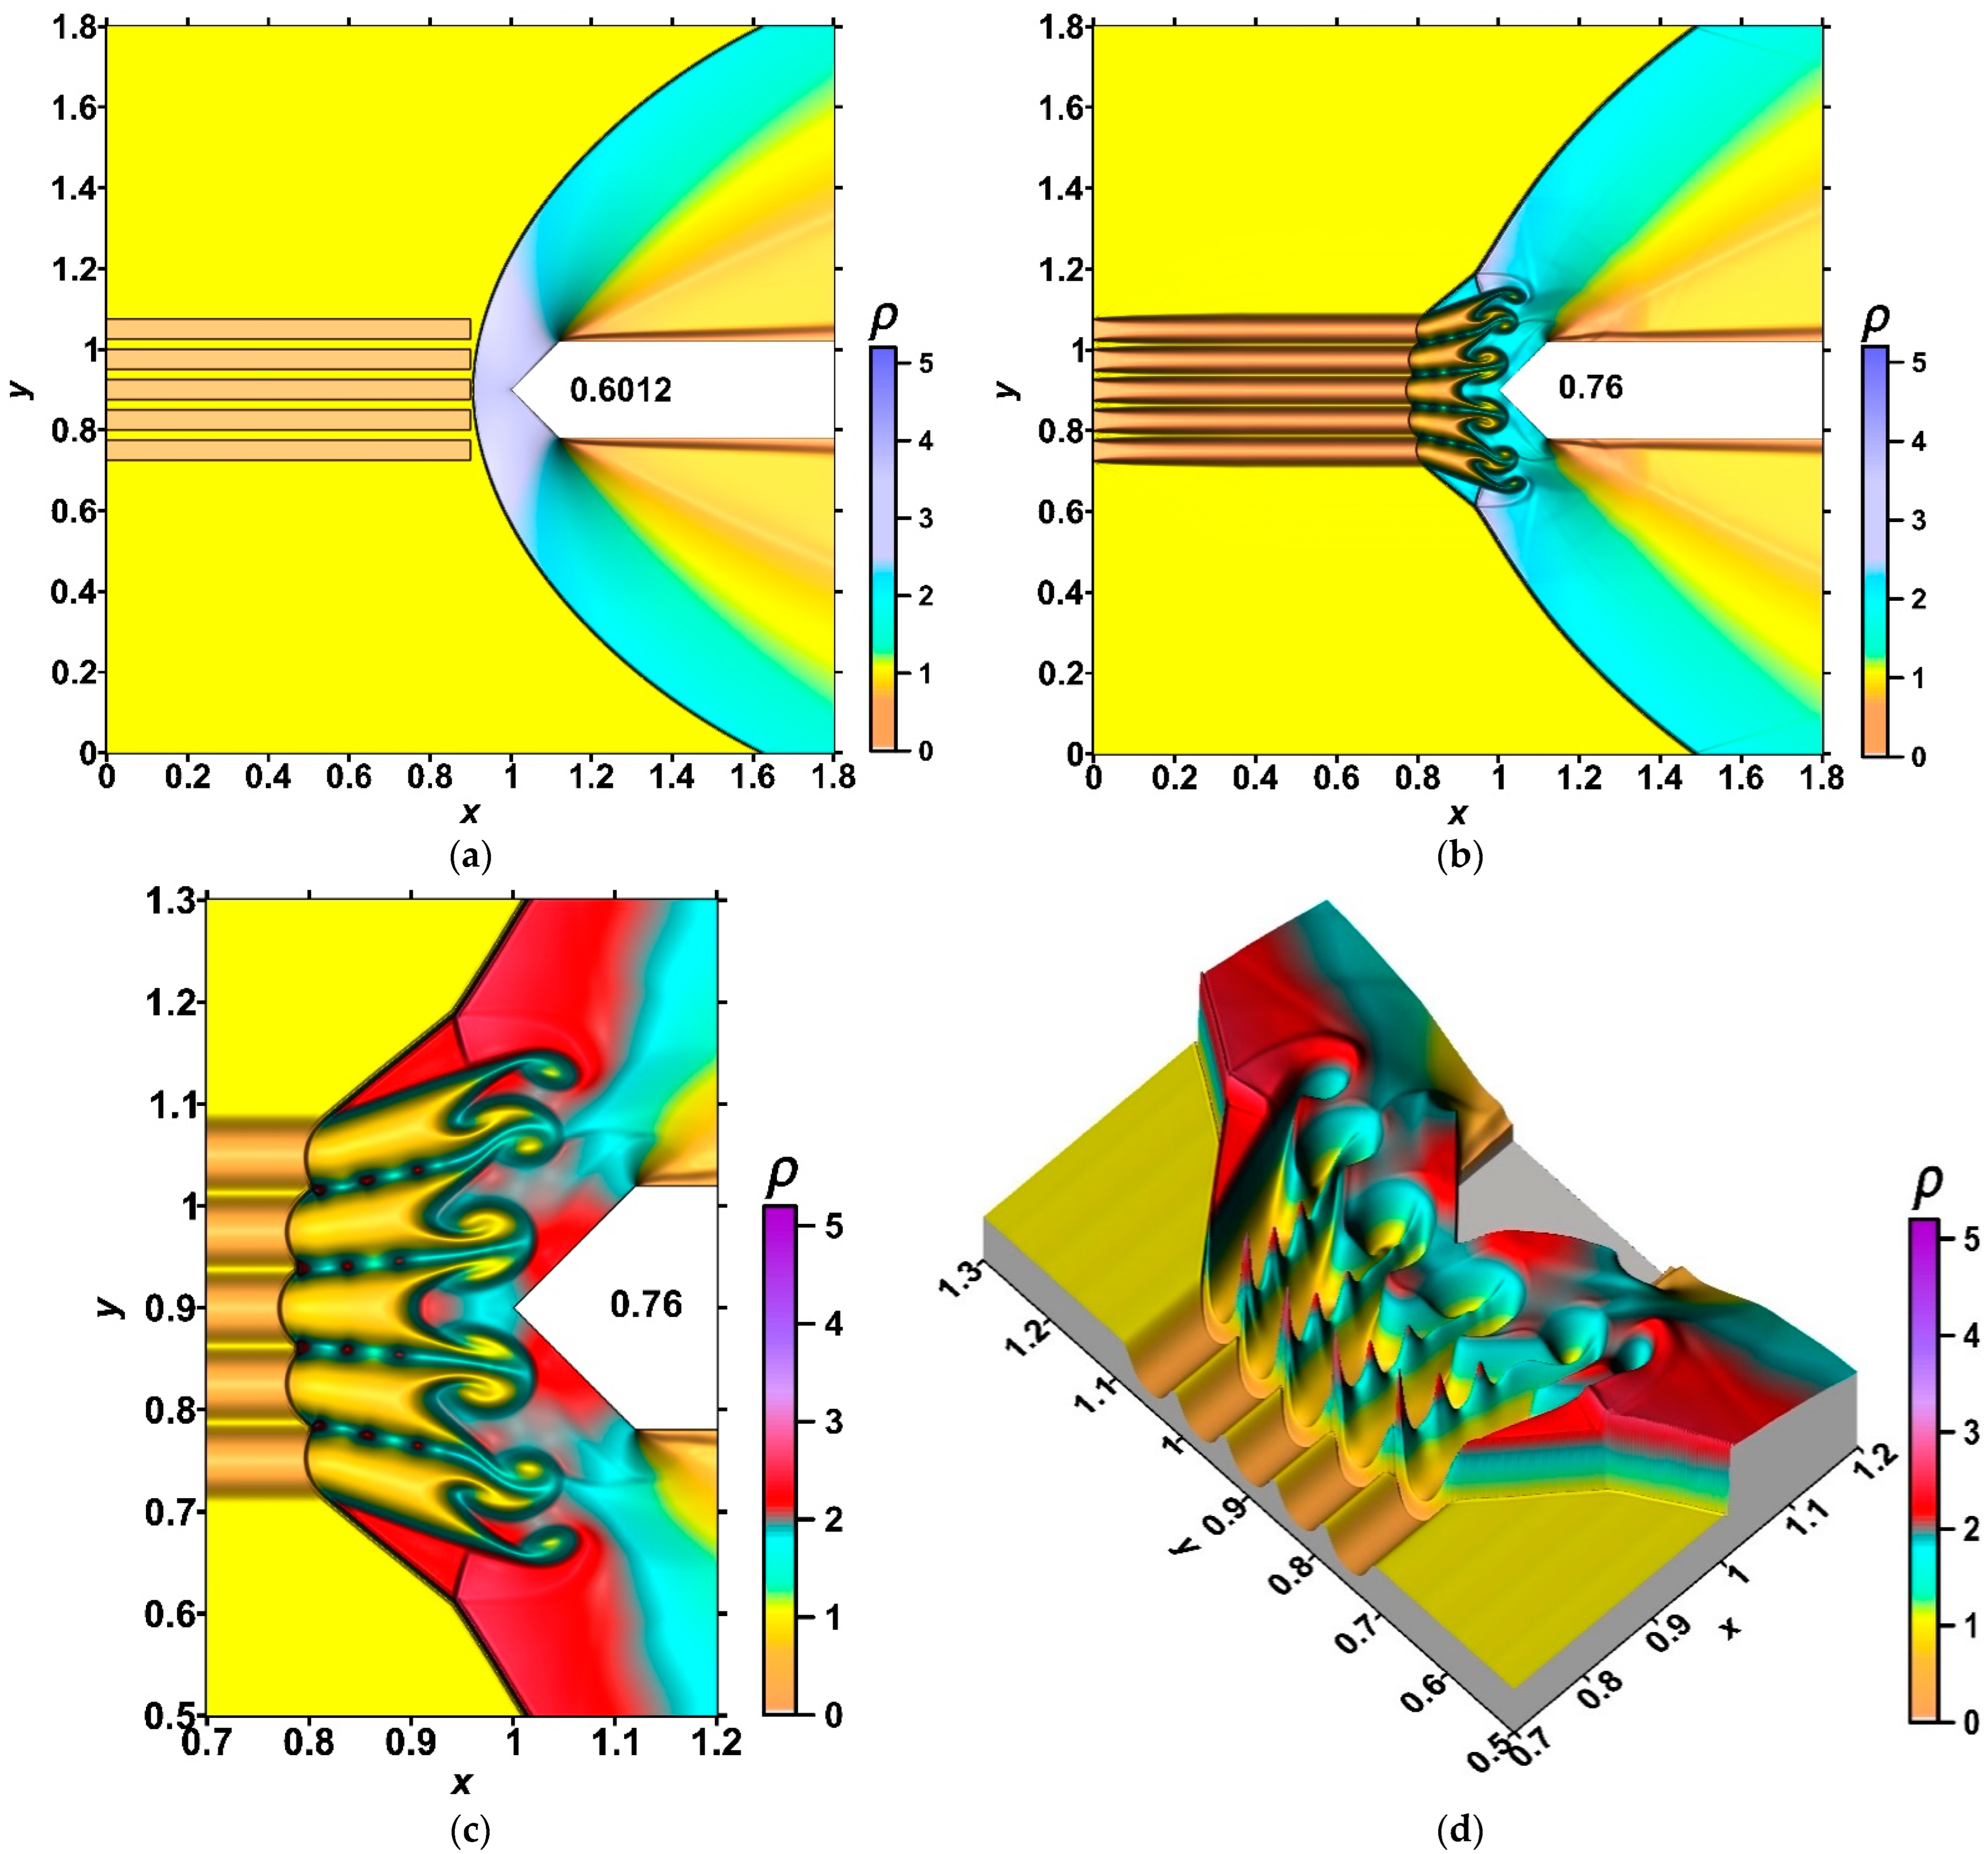
Multiple generations of the Richtmyer–Meshkov instability were shown. A new steady flow mode was established, in which the front of the bow shock wave can be completely destroyed in the zone of the source layers. The sharp peaks accompanying the development of the Richtmyer–Meshkov instabilities were obtained, which remain in the steady flow mode established under the action of a stratified energy source. The magnitudes of the picks are greater for smaller αj (greater temperatures) in the layers of the energy source.
-
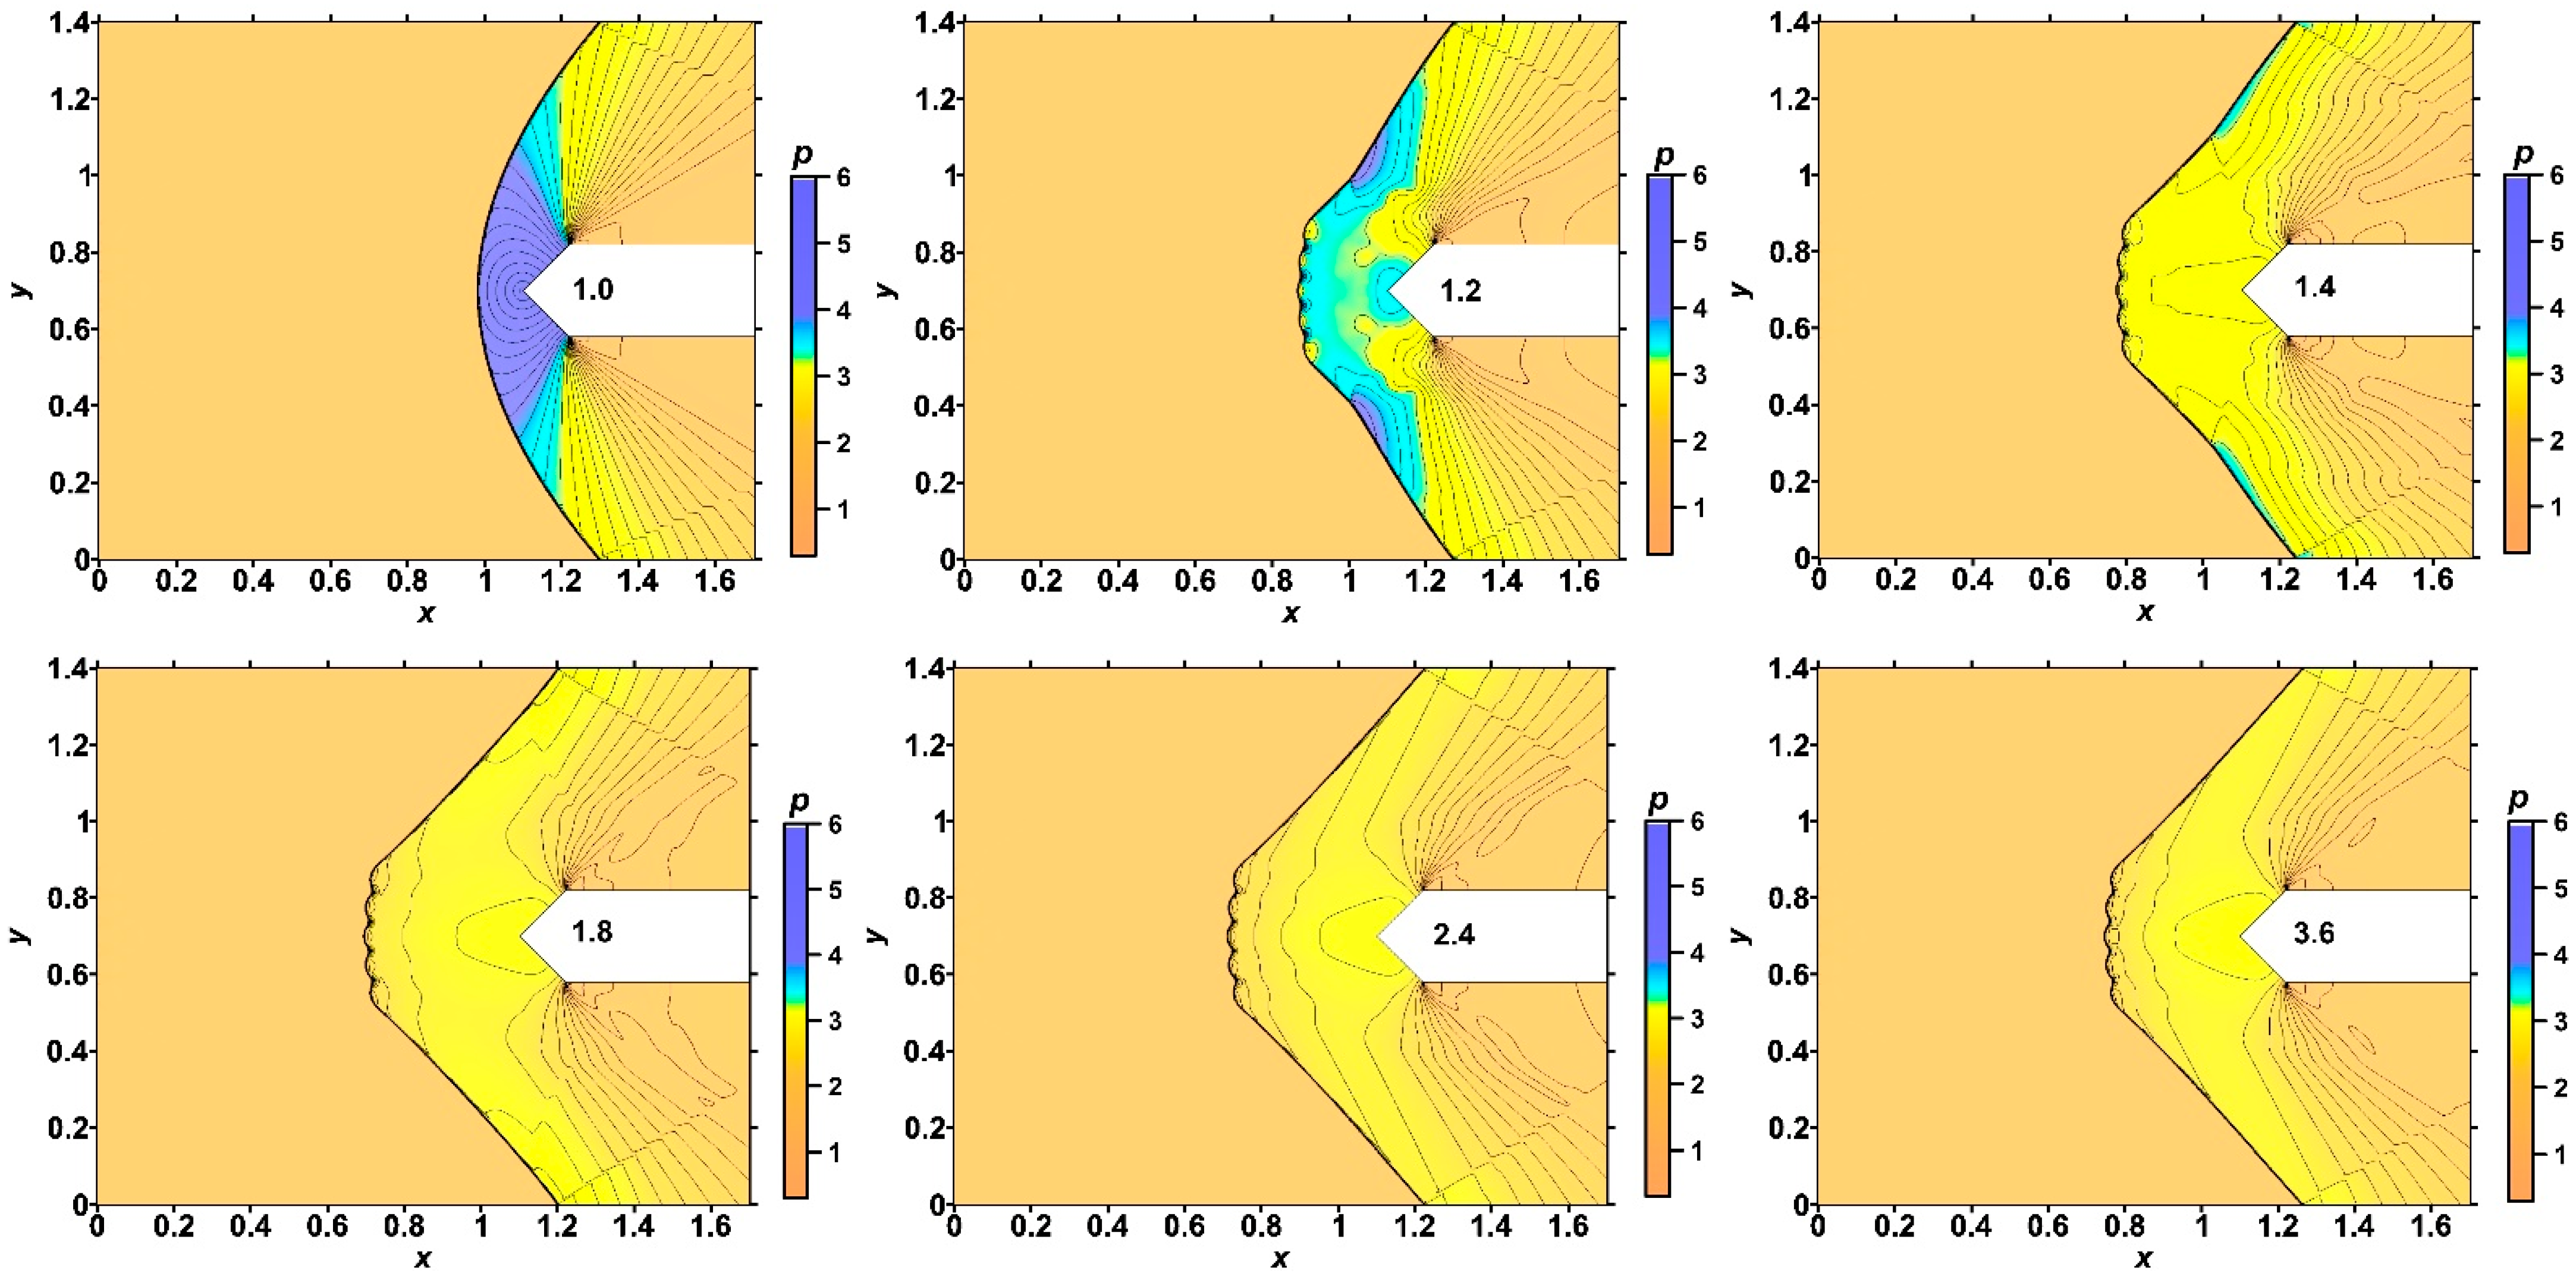
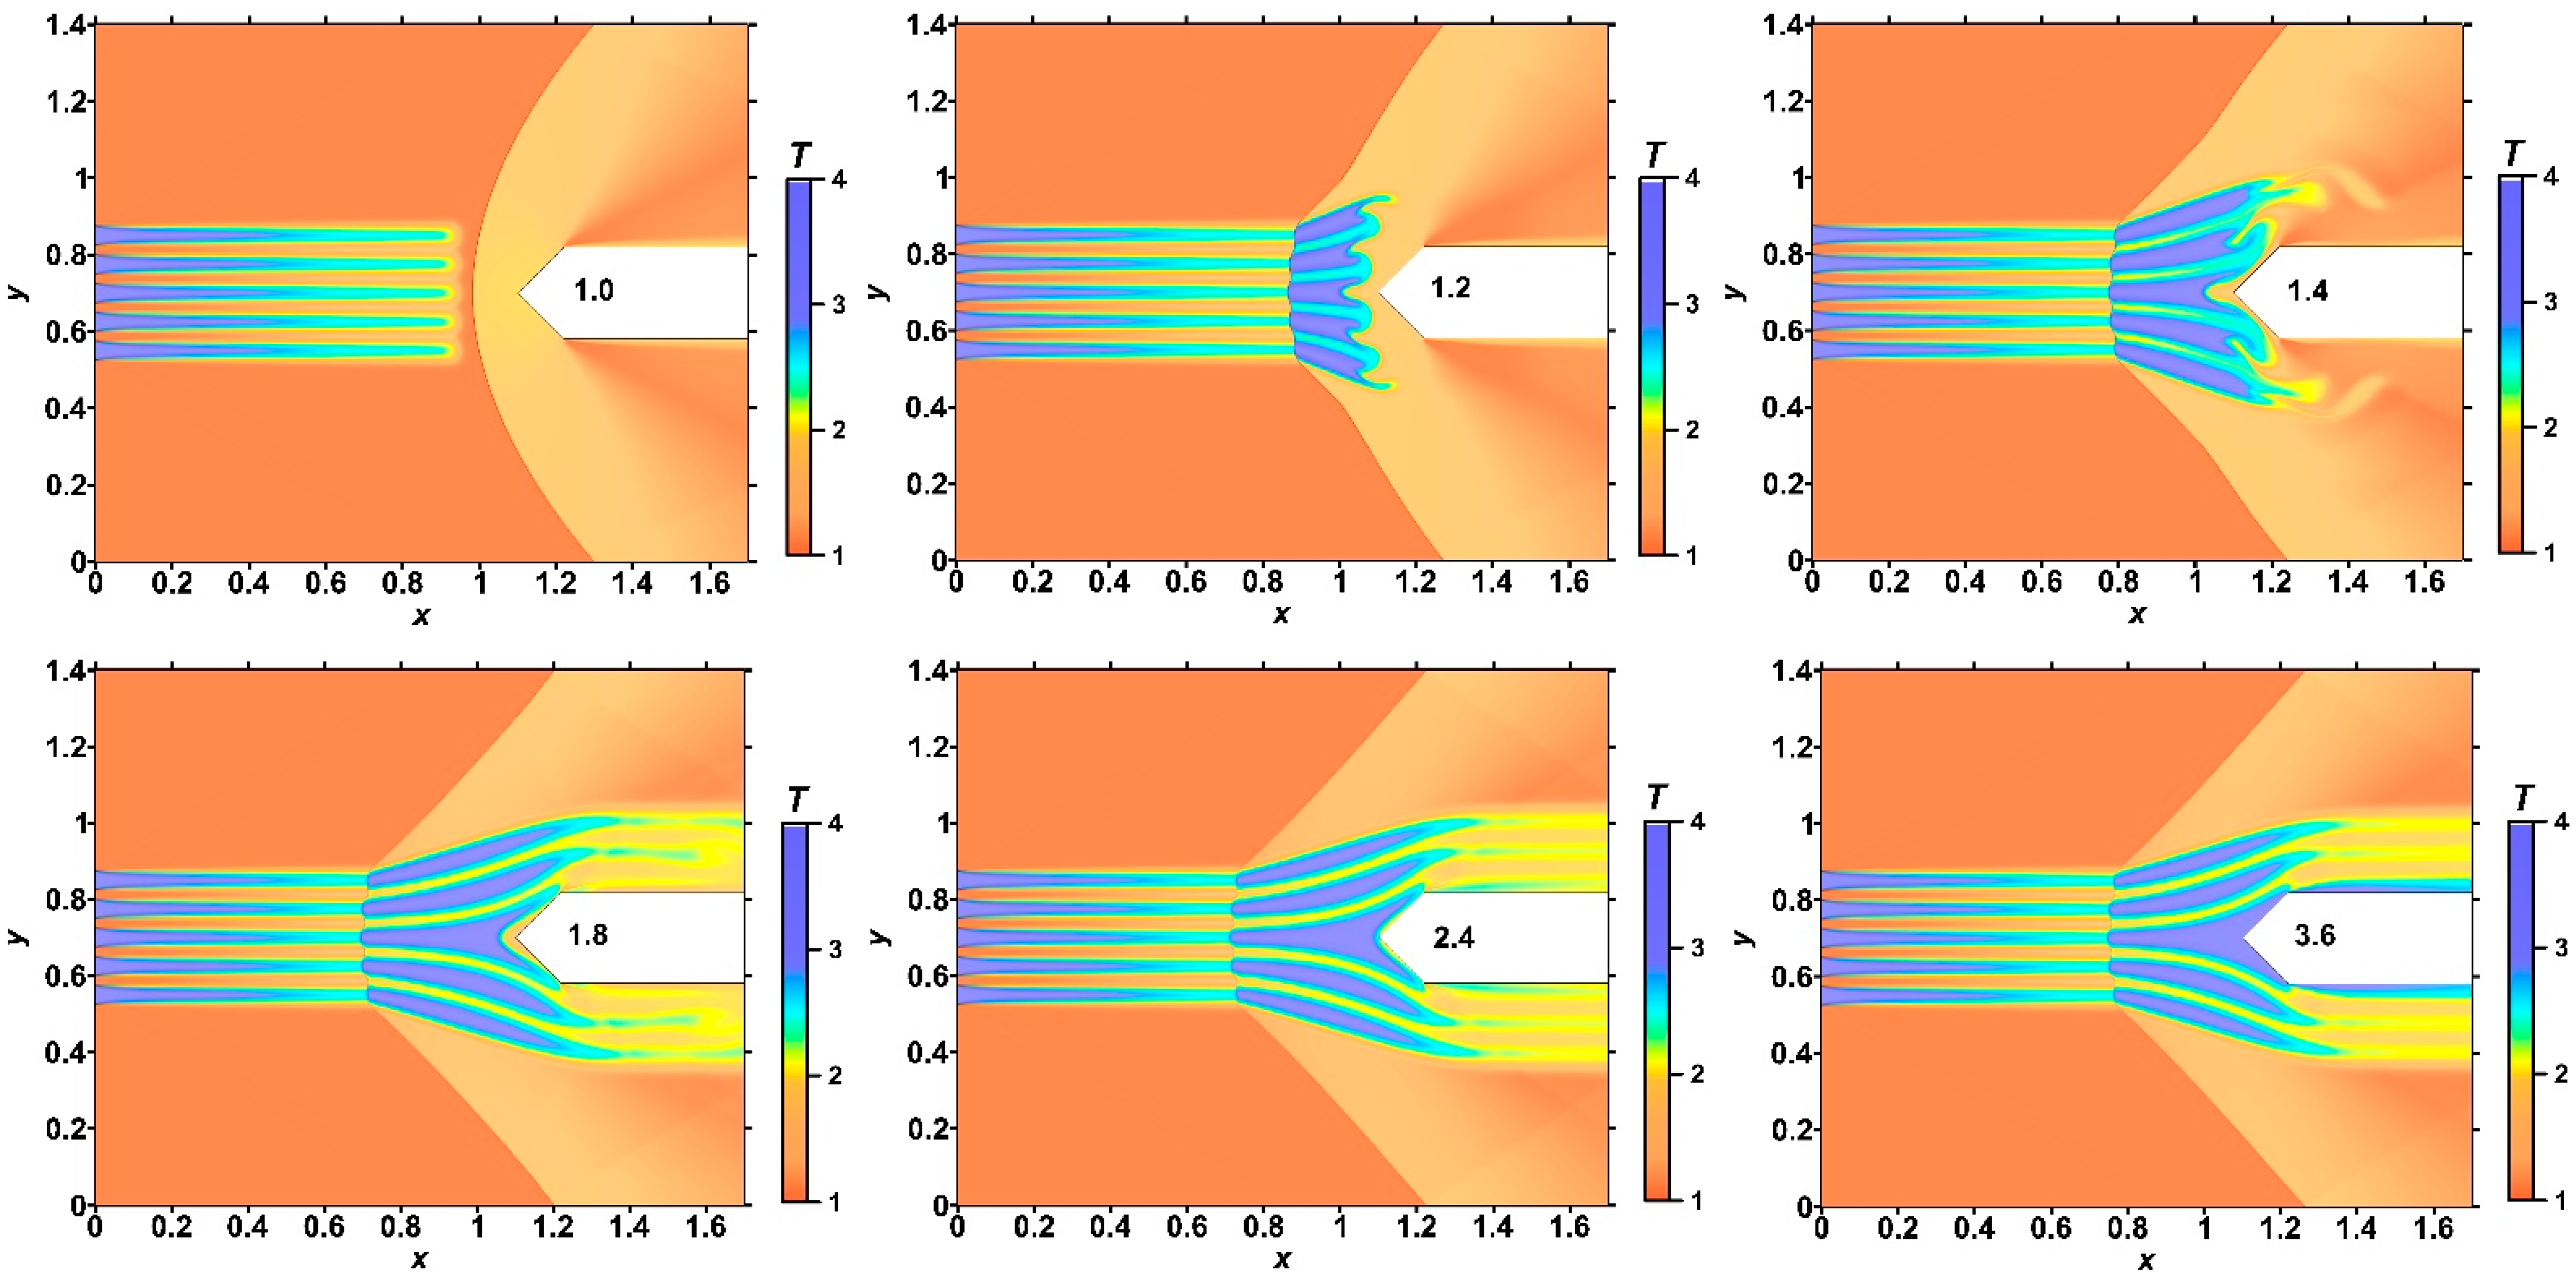
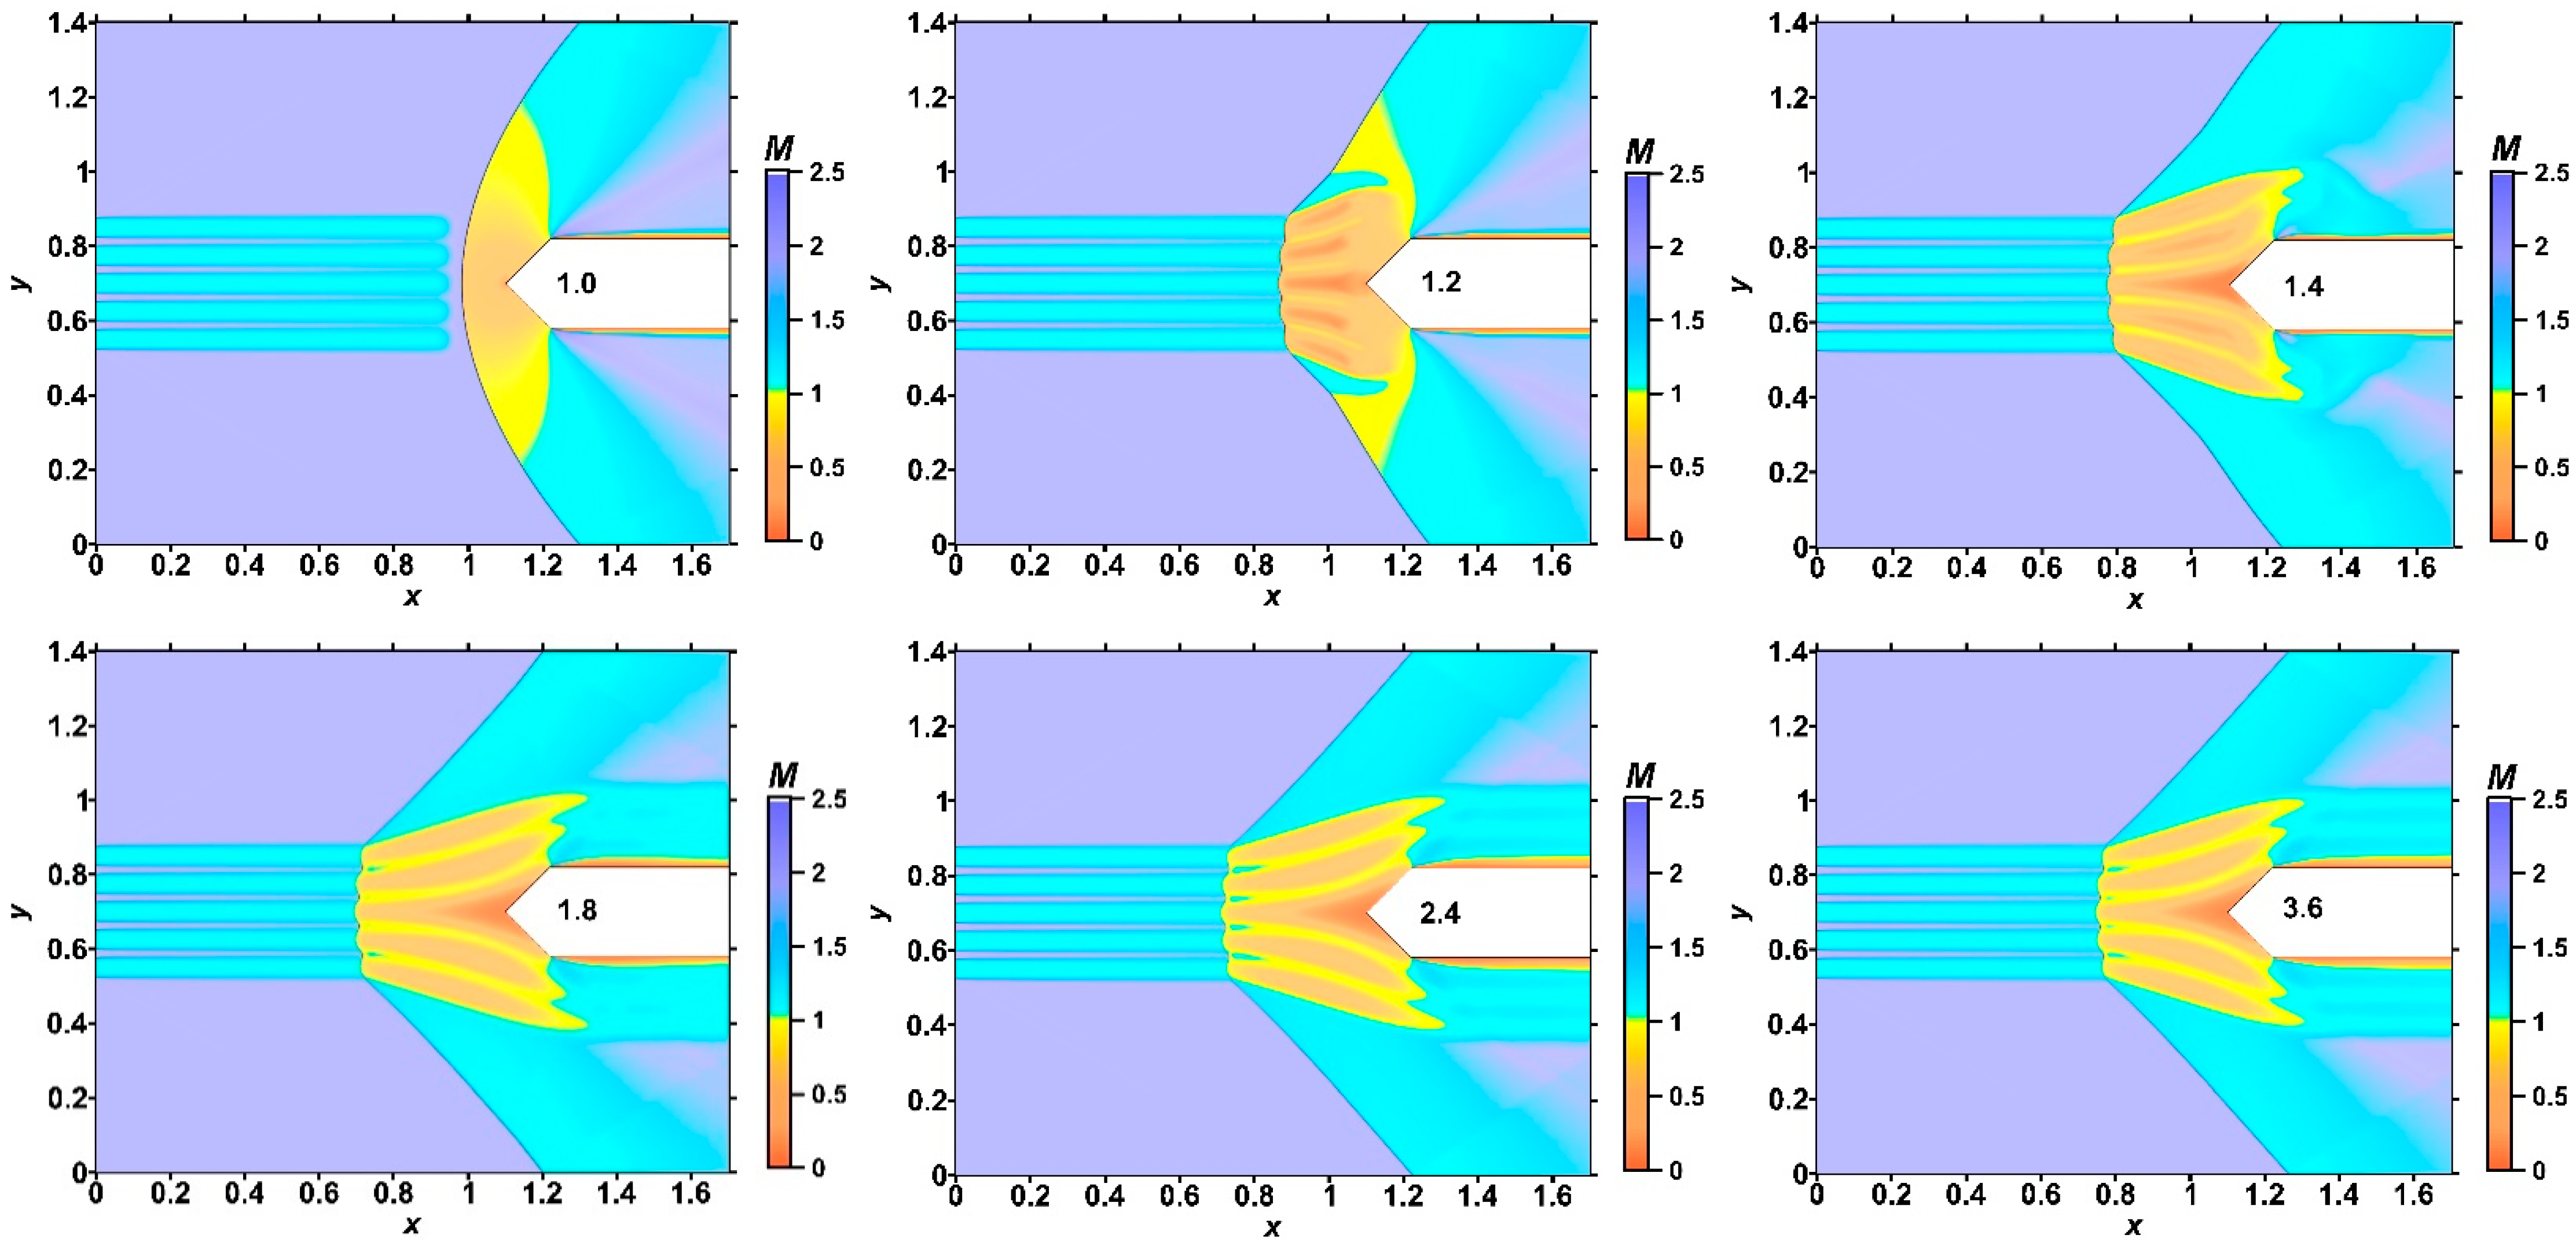
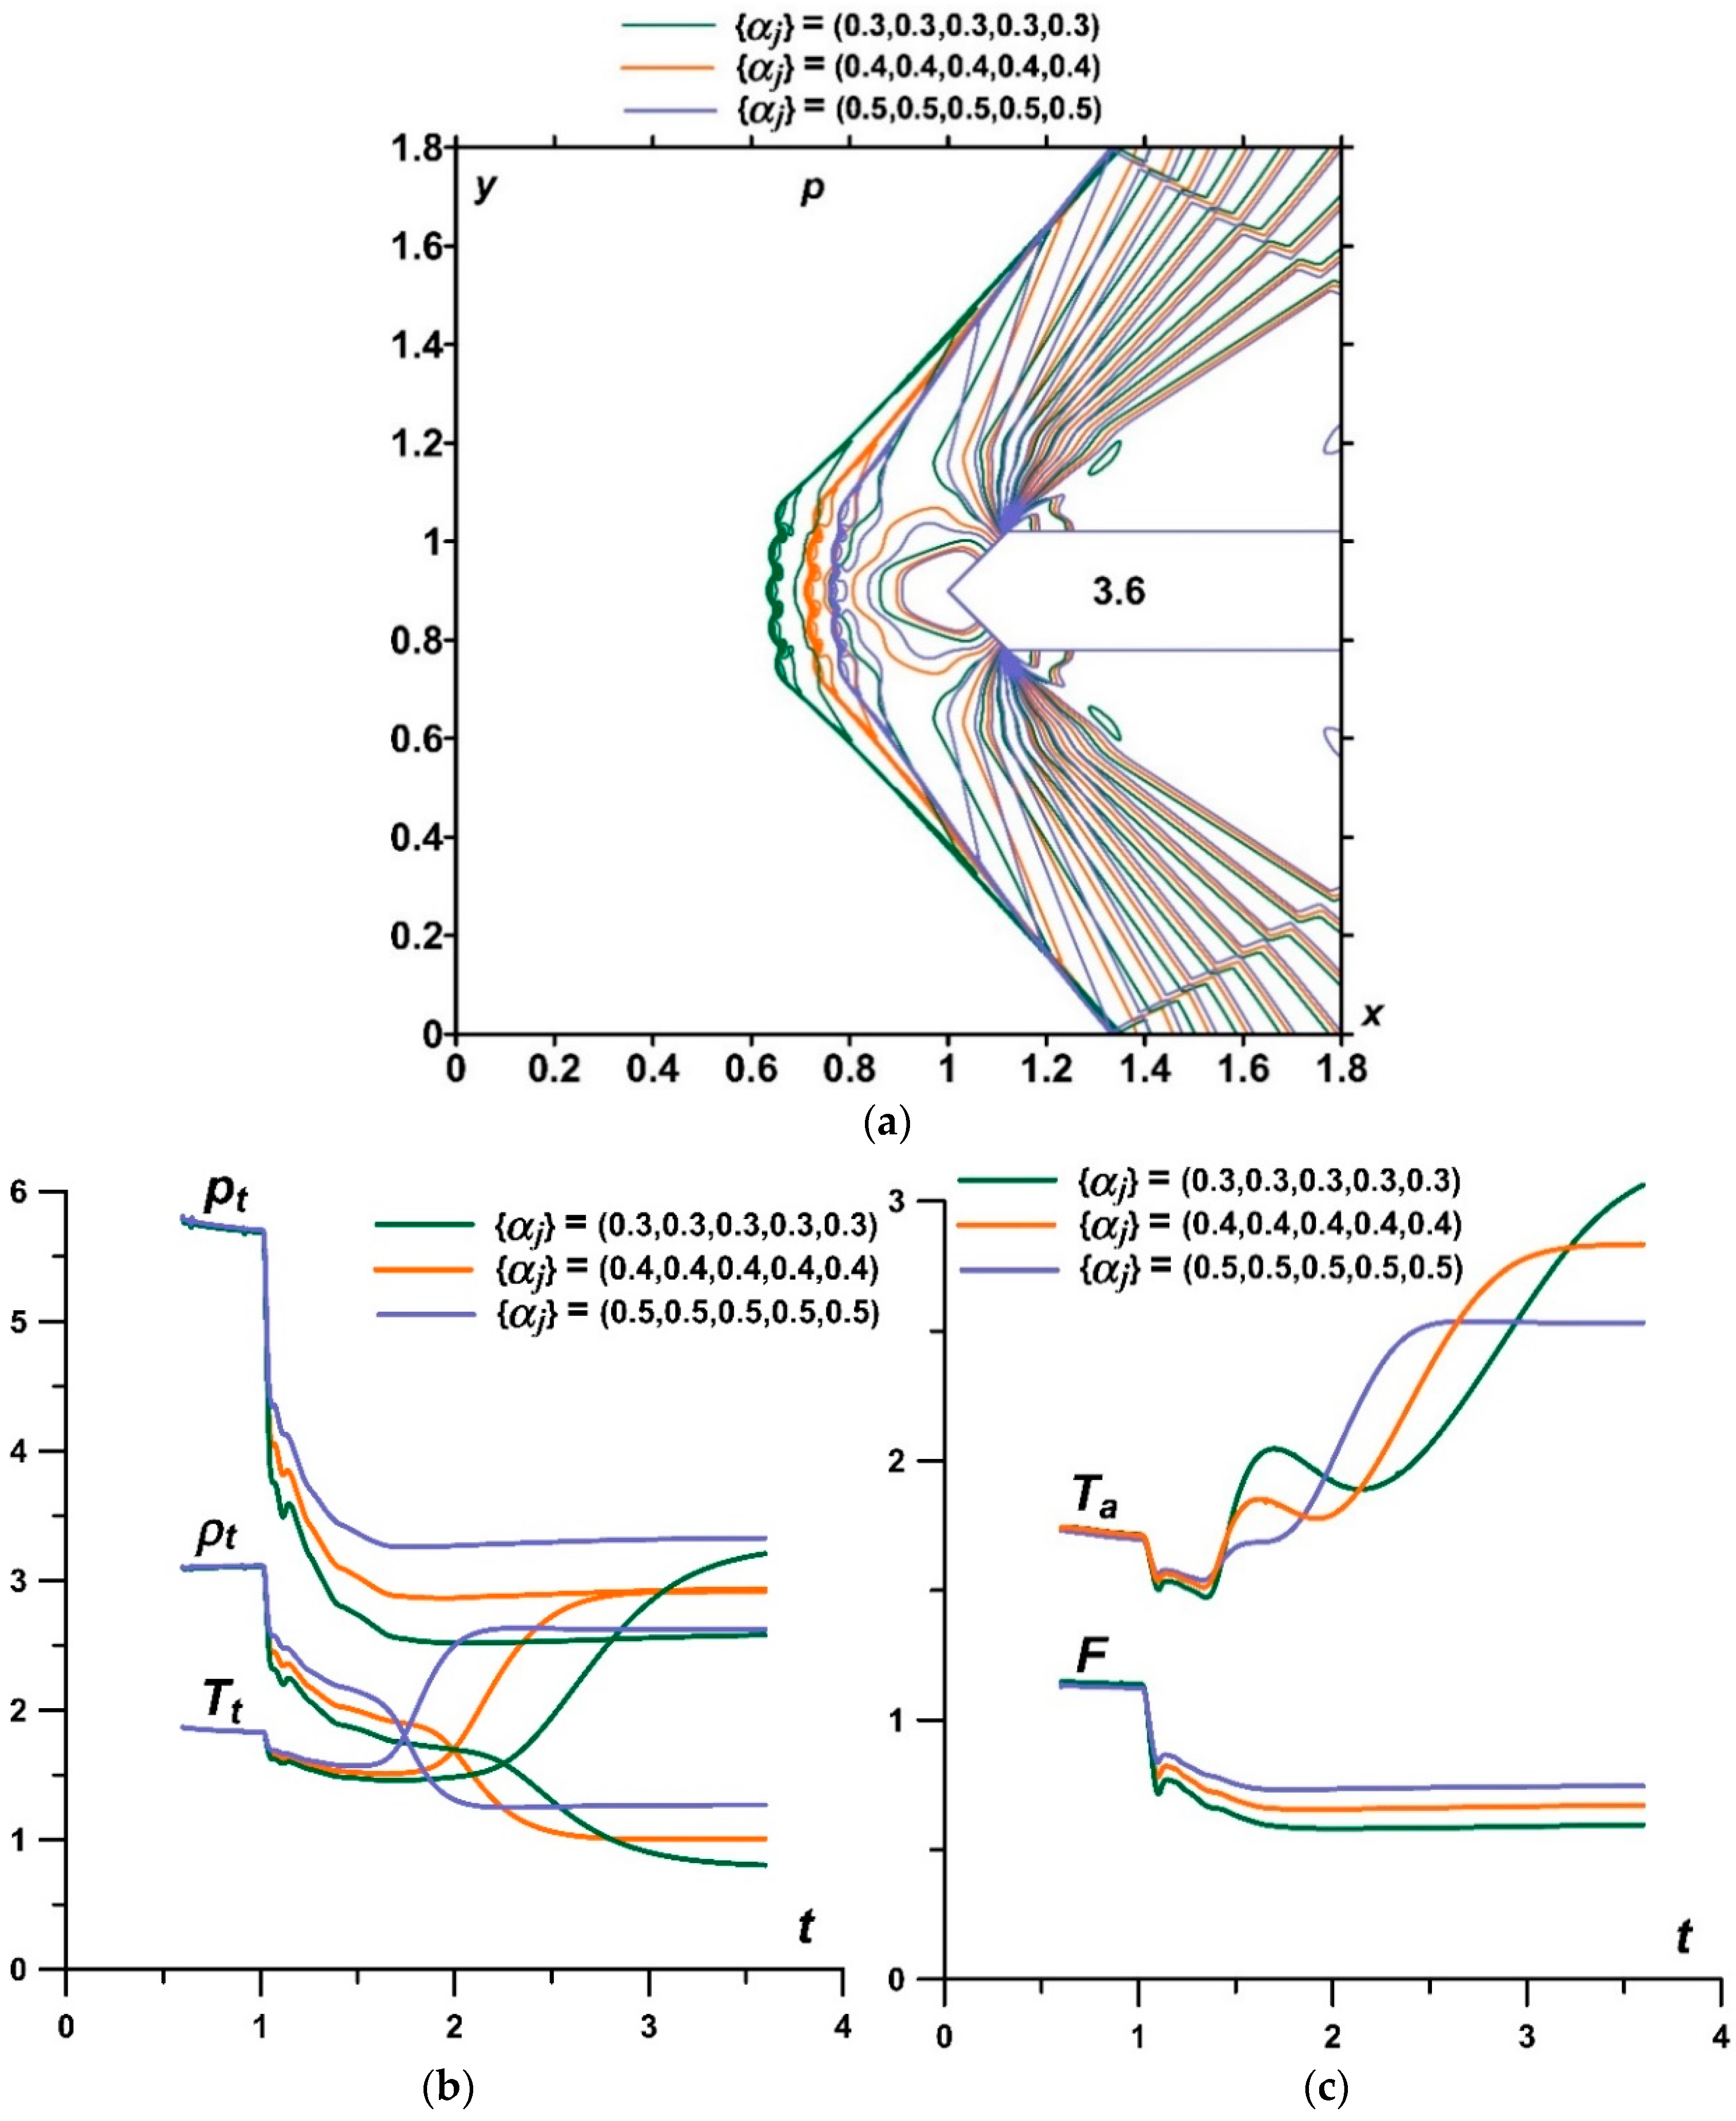
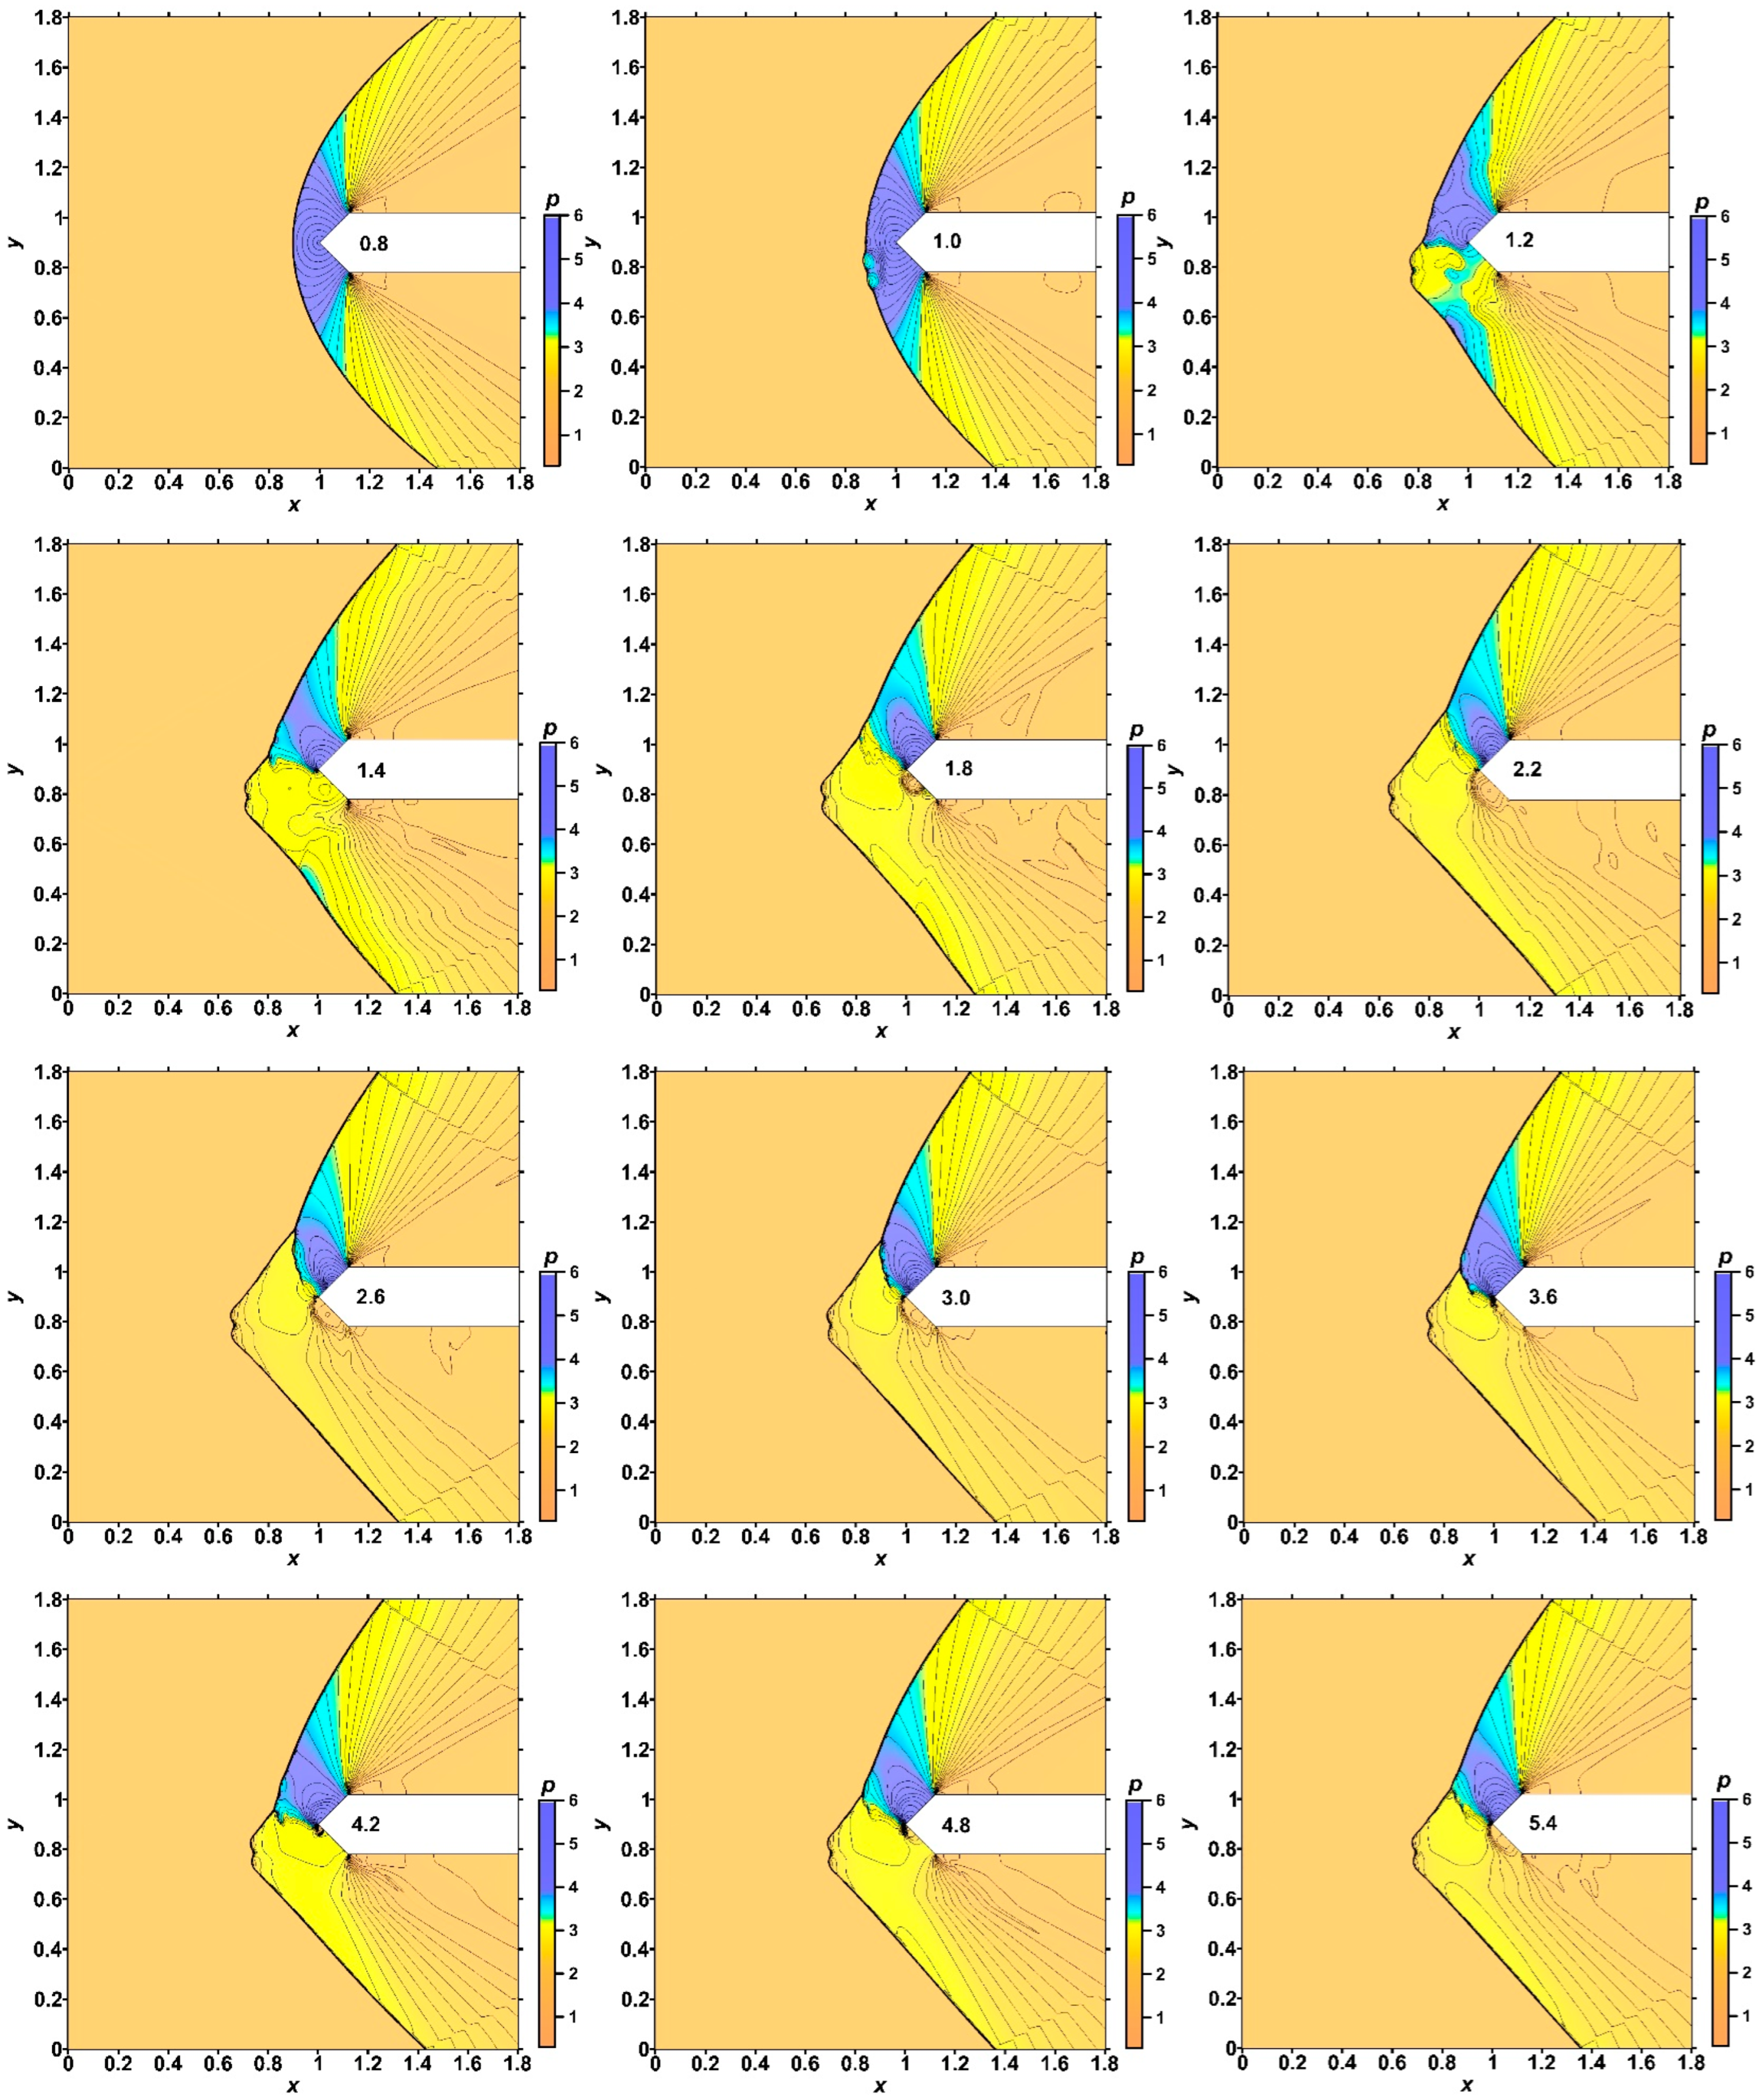
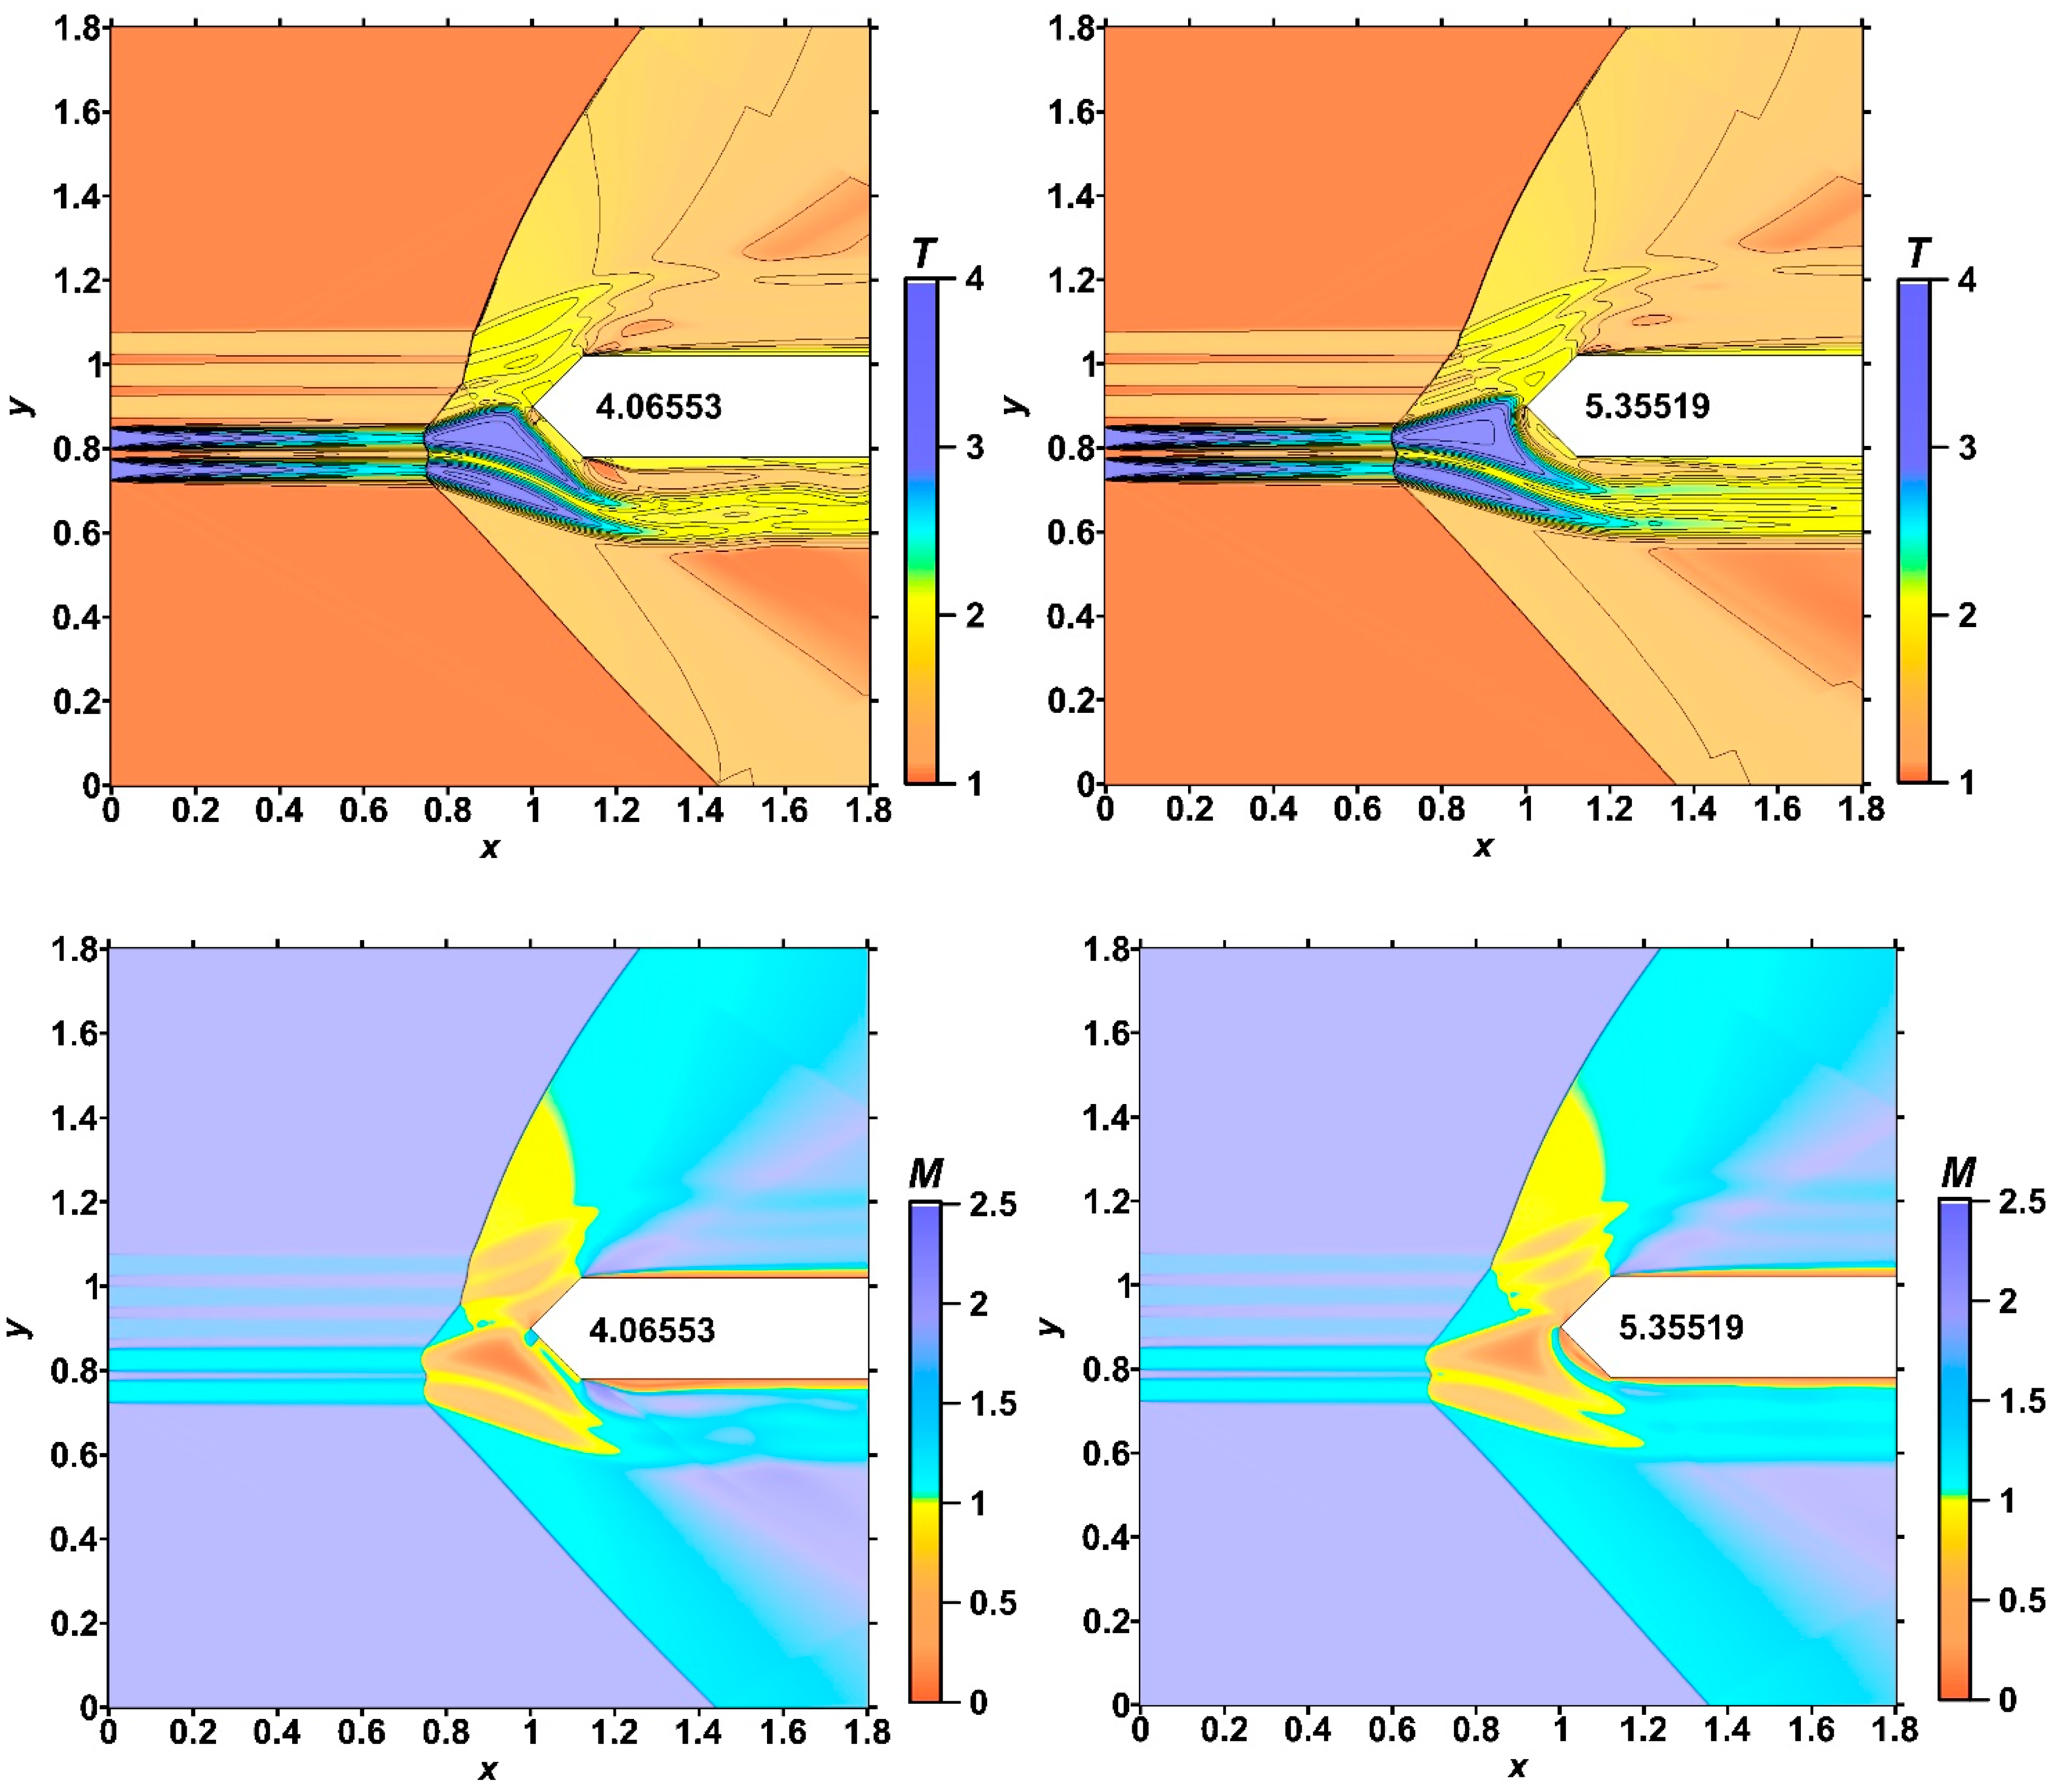
It was shown that the front of the bow shock becomes wavy, reflecting the stratification of the energy source, and the bow shock wave standoff distance is greater for the smaller αj (greater temperatures) in the layers. In addition, the more the angle of inclination of the bow shock wave changes, the smaller the values αj in the layers. The layered nature of the fields of density, temperature, and local Mach number was also shown up to the establishment of a new steady flow mode.
-
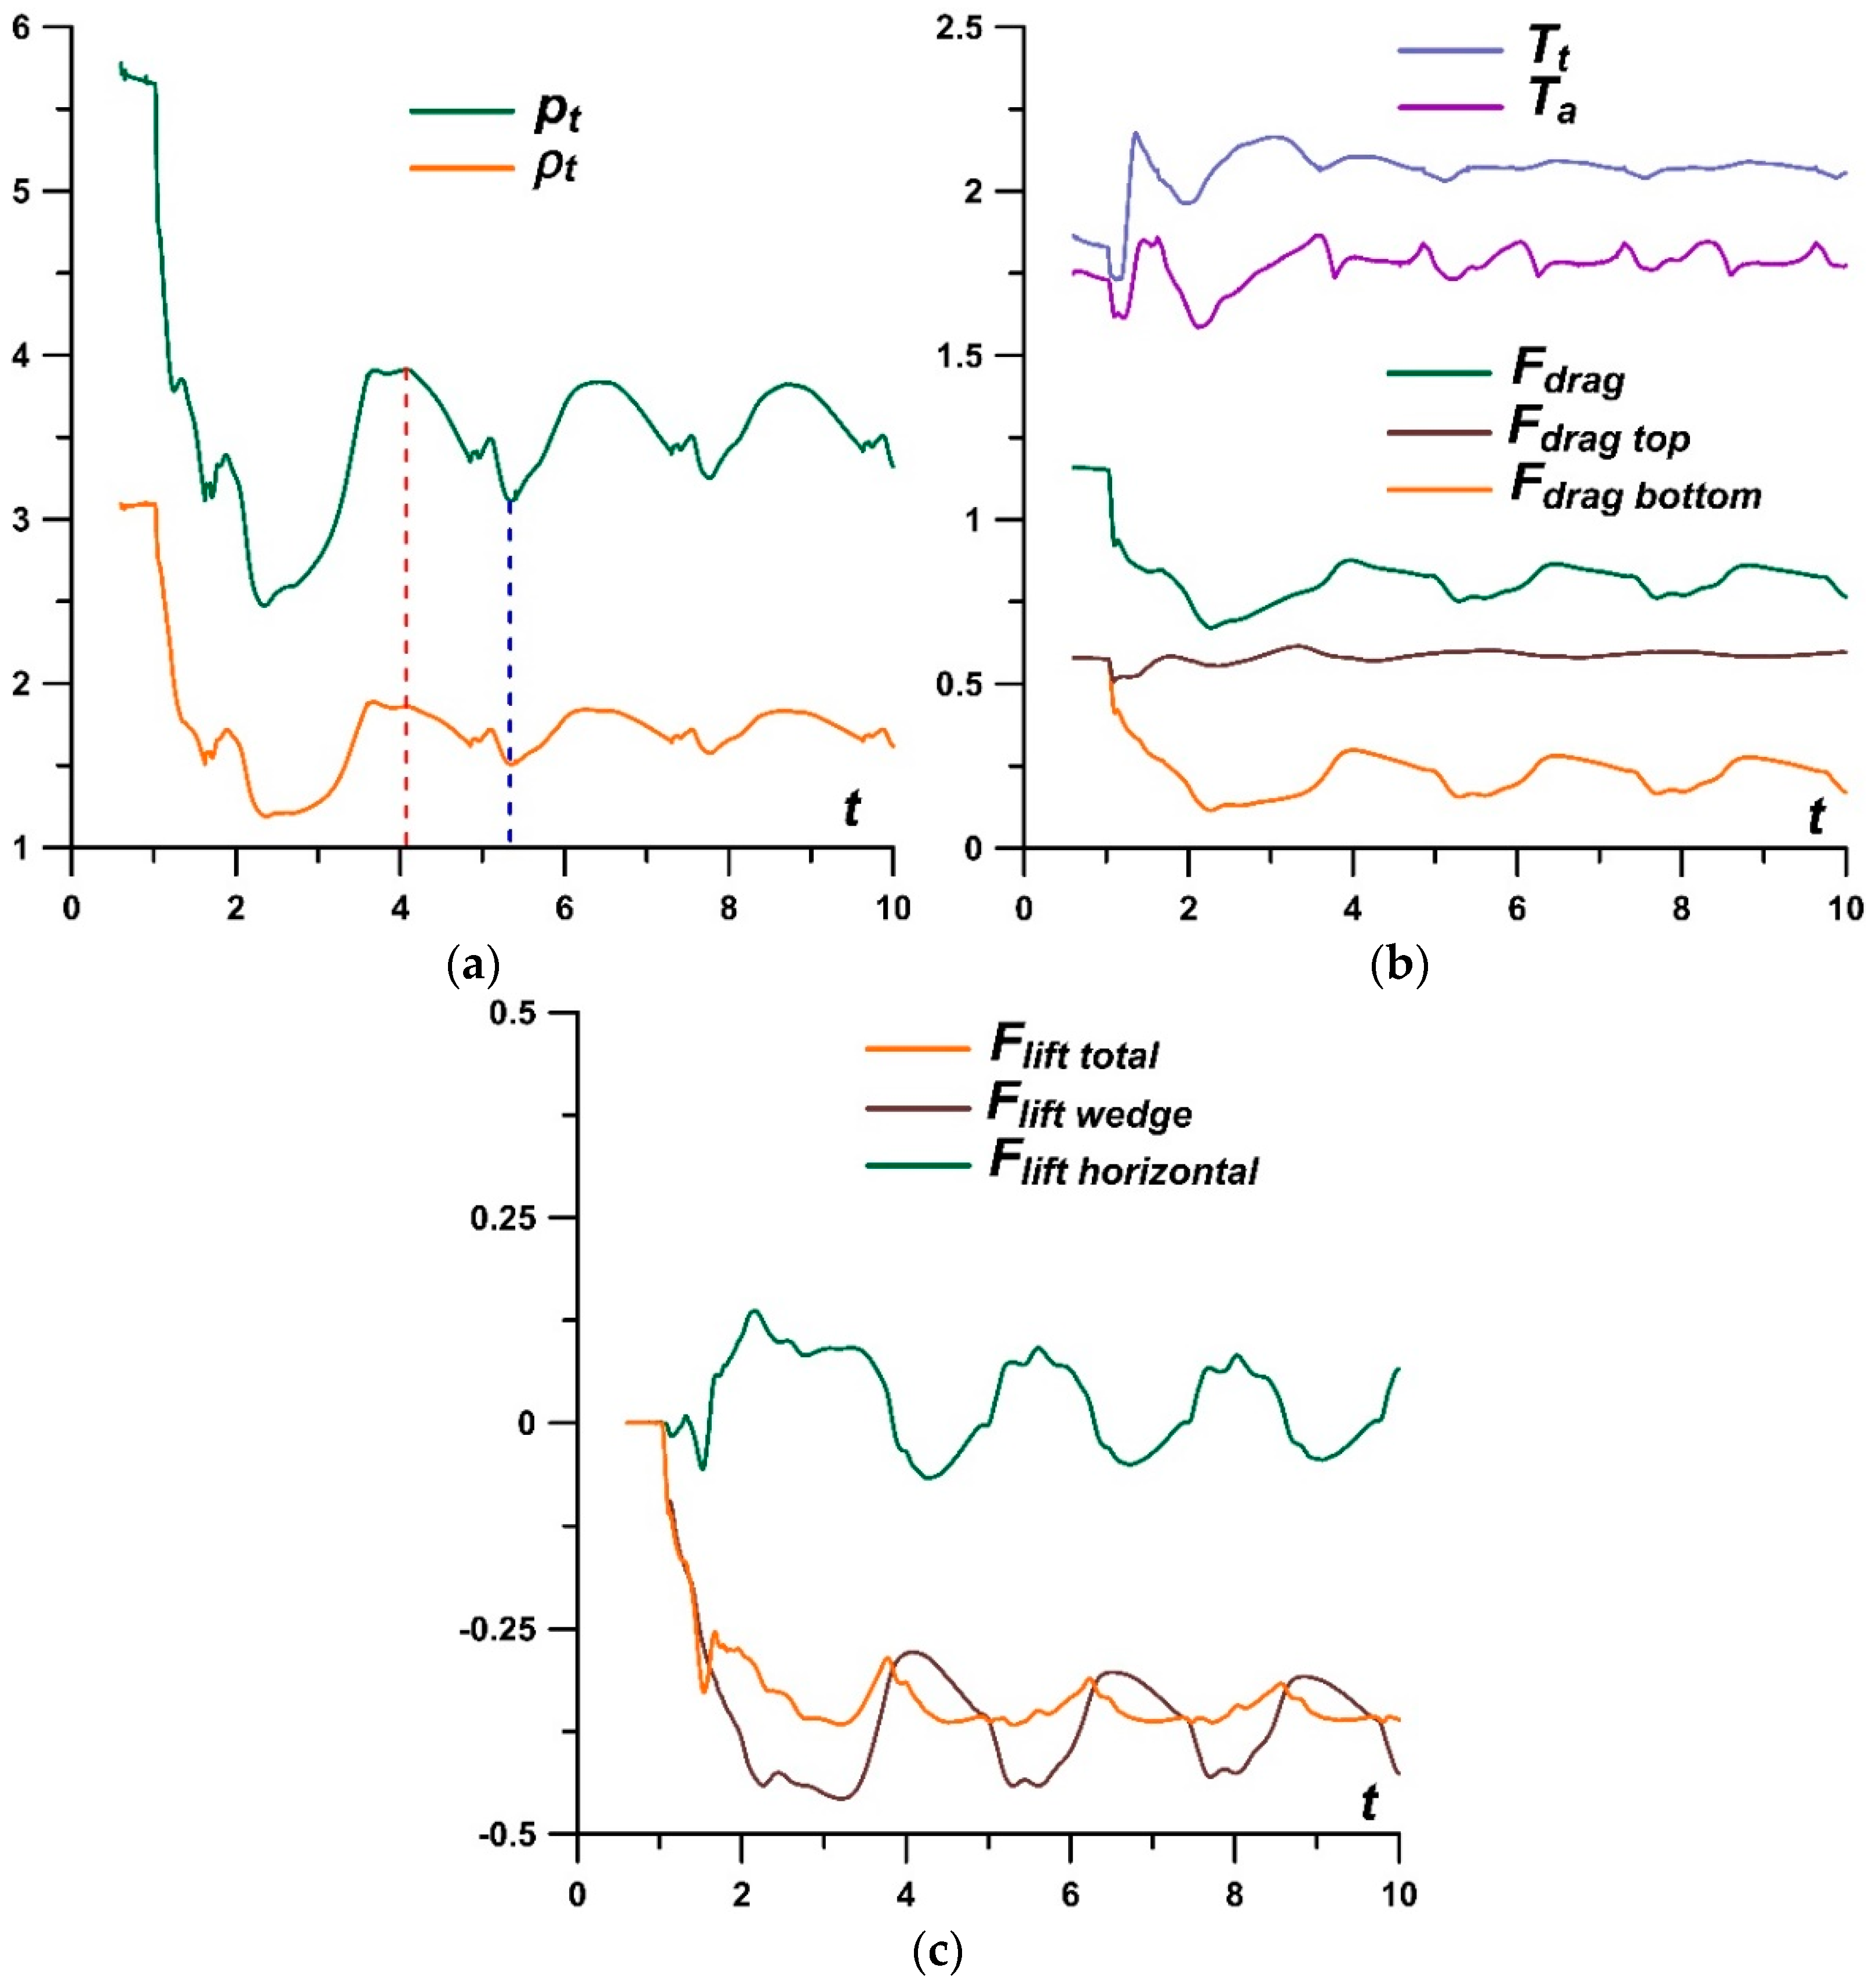
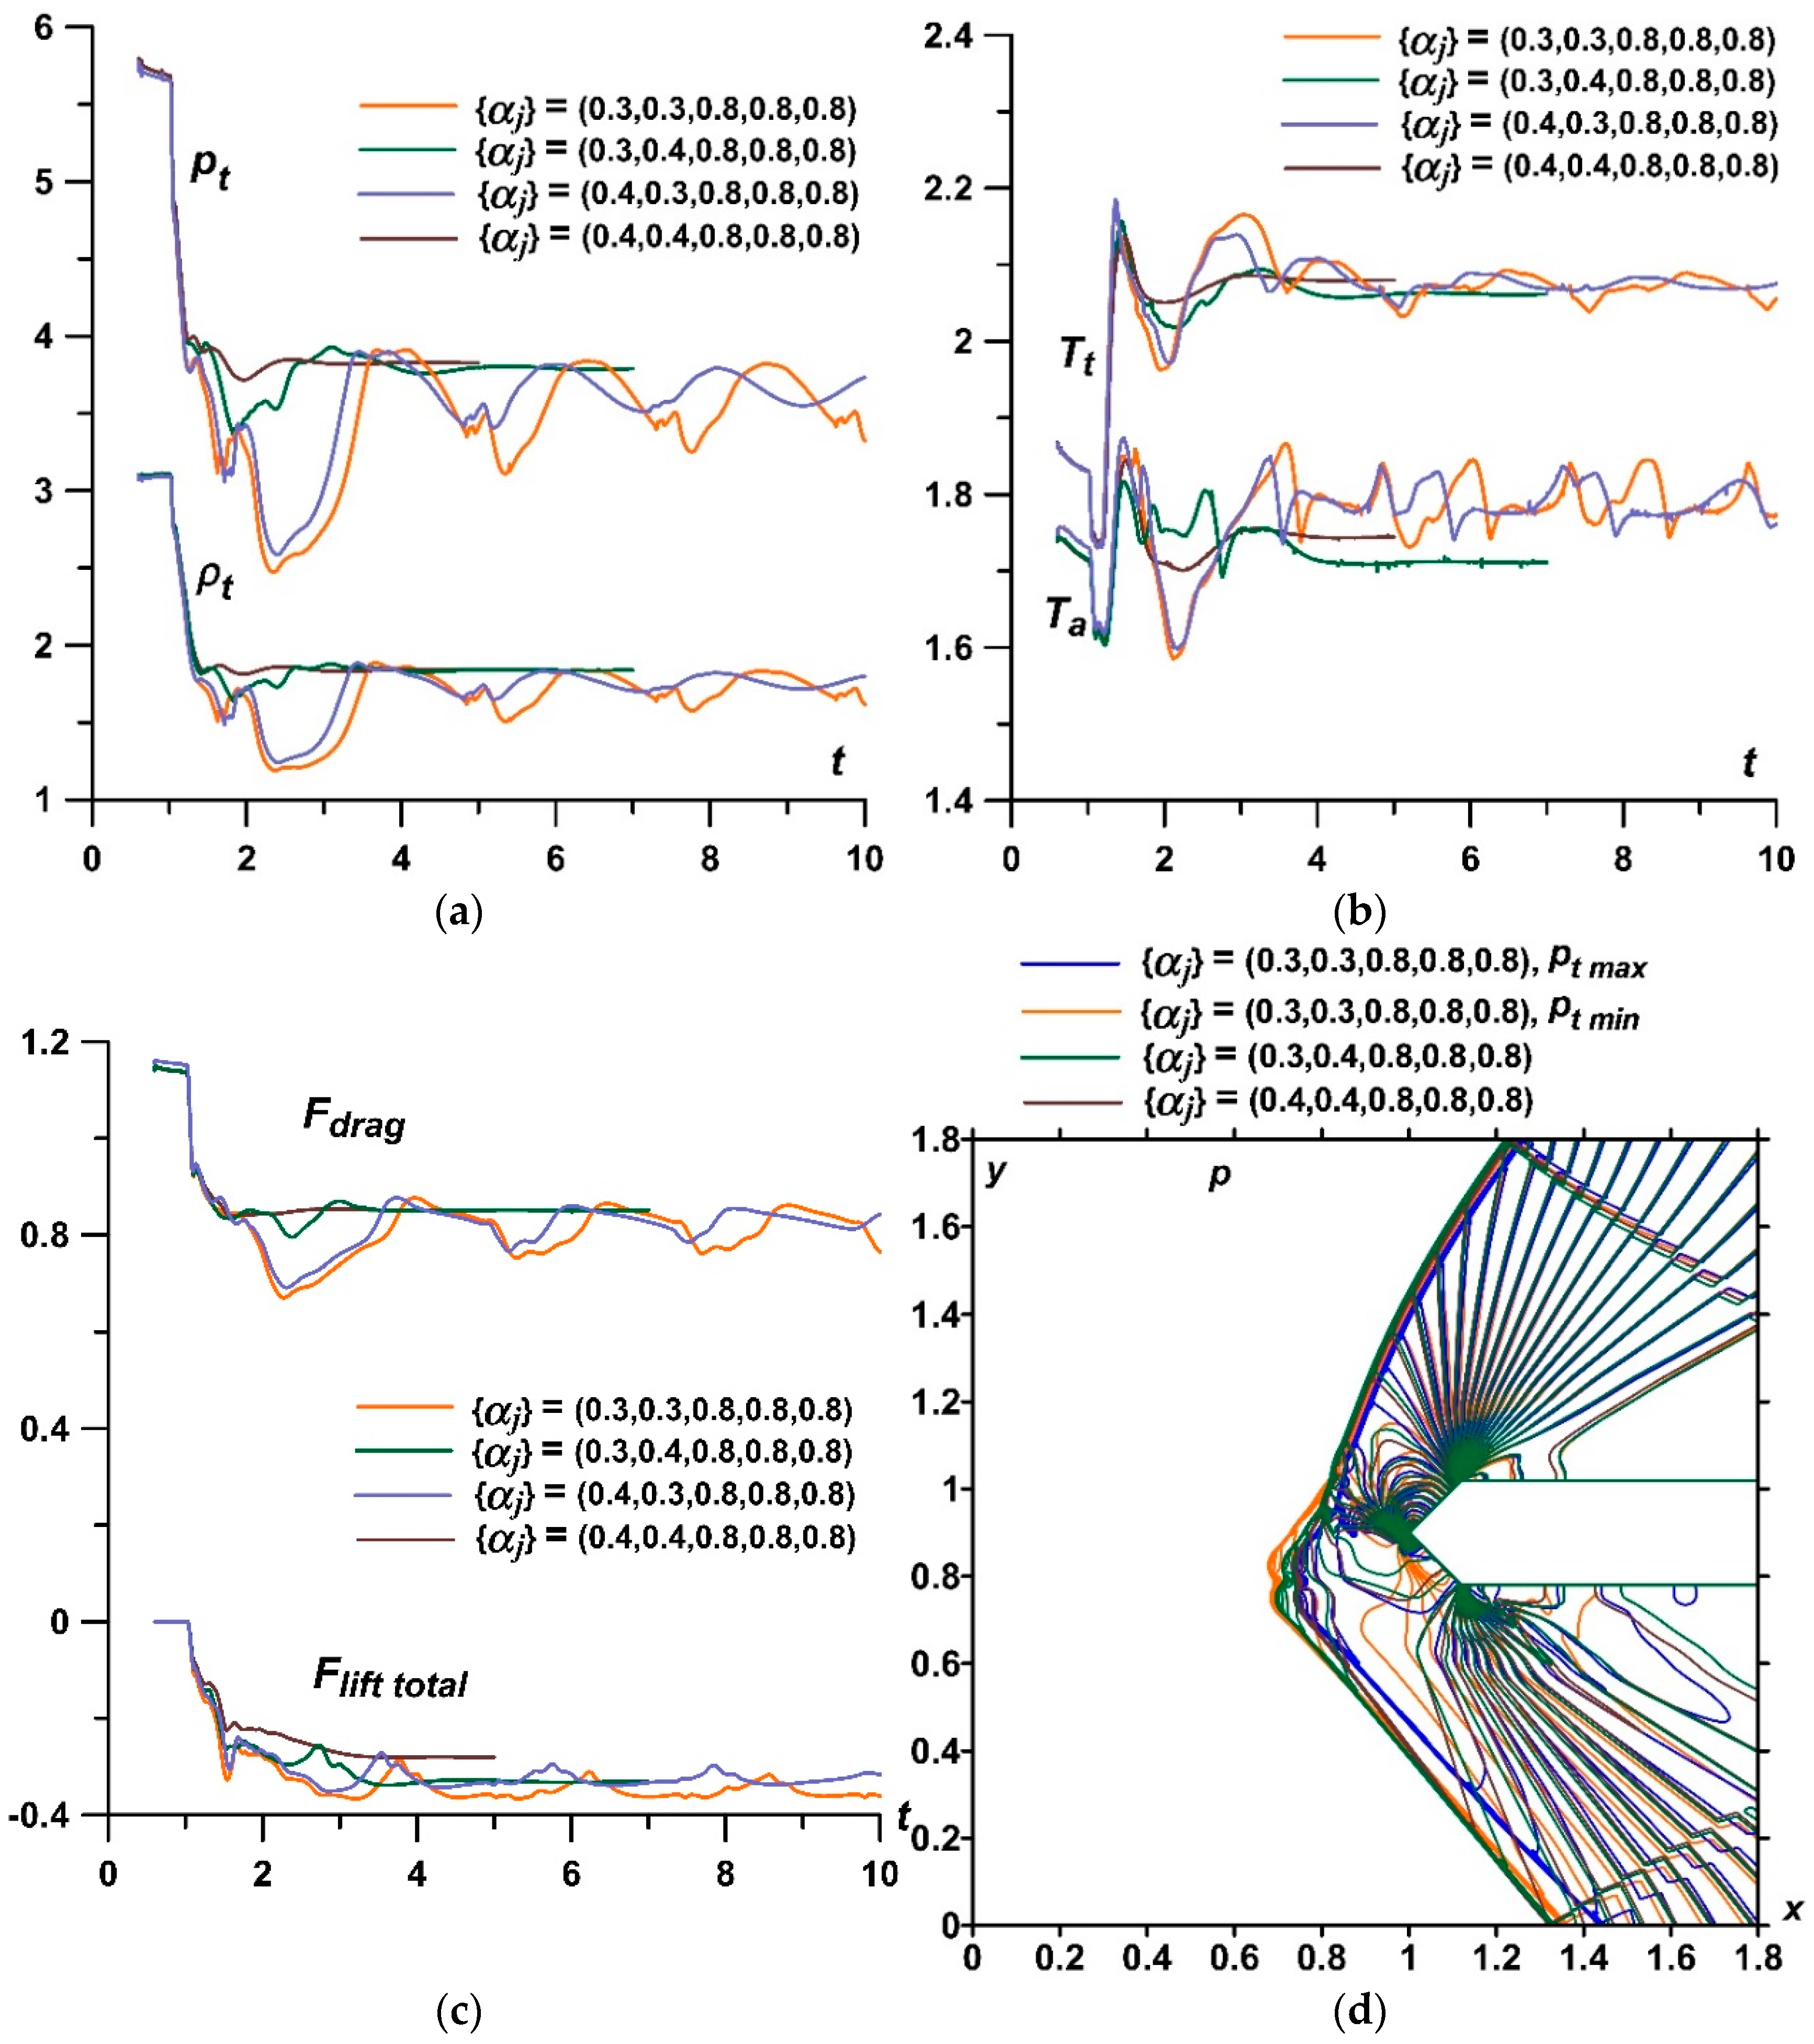
It was shown that by changing the temperature in the layers of the stratified energy sources given by symmetrical sets {αj}, it is possible to control the defining flow parameters. For a source with the same temperatures in the layers, the pressure and density at the top of the body and the drag force of the front surface are lower for sets {αj} with smaller αj (greater temperatures). The bow shock wave is located more far from the body for the smaller αj in the layers, and the temperature at the top and the average front surface temperature are higher. It was also shown that central layers of the stratified source play a decisive role in the formation of the parameters at the top and the drag forces. In this case (for the symmetrical sets {αj}), lift forces do not arise.
-
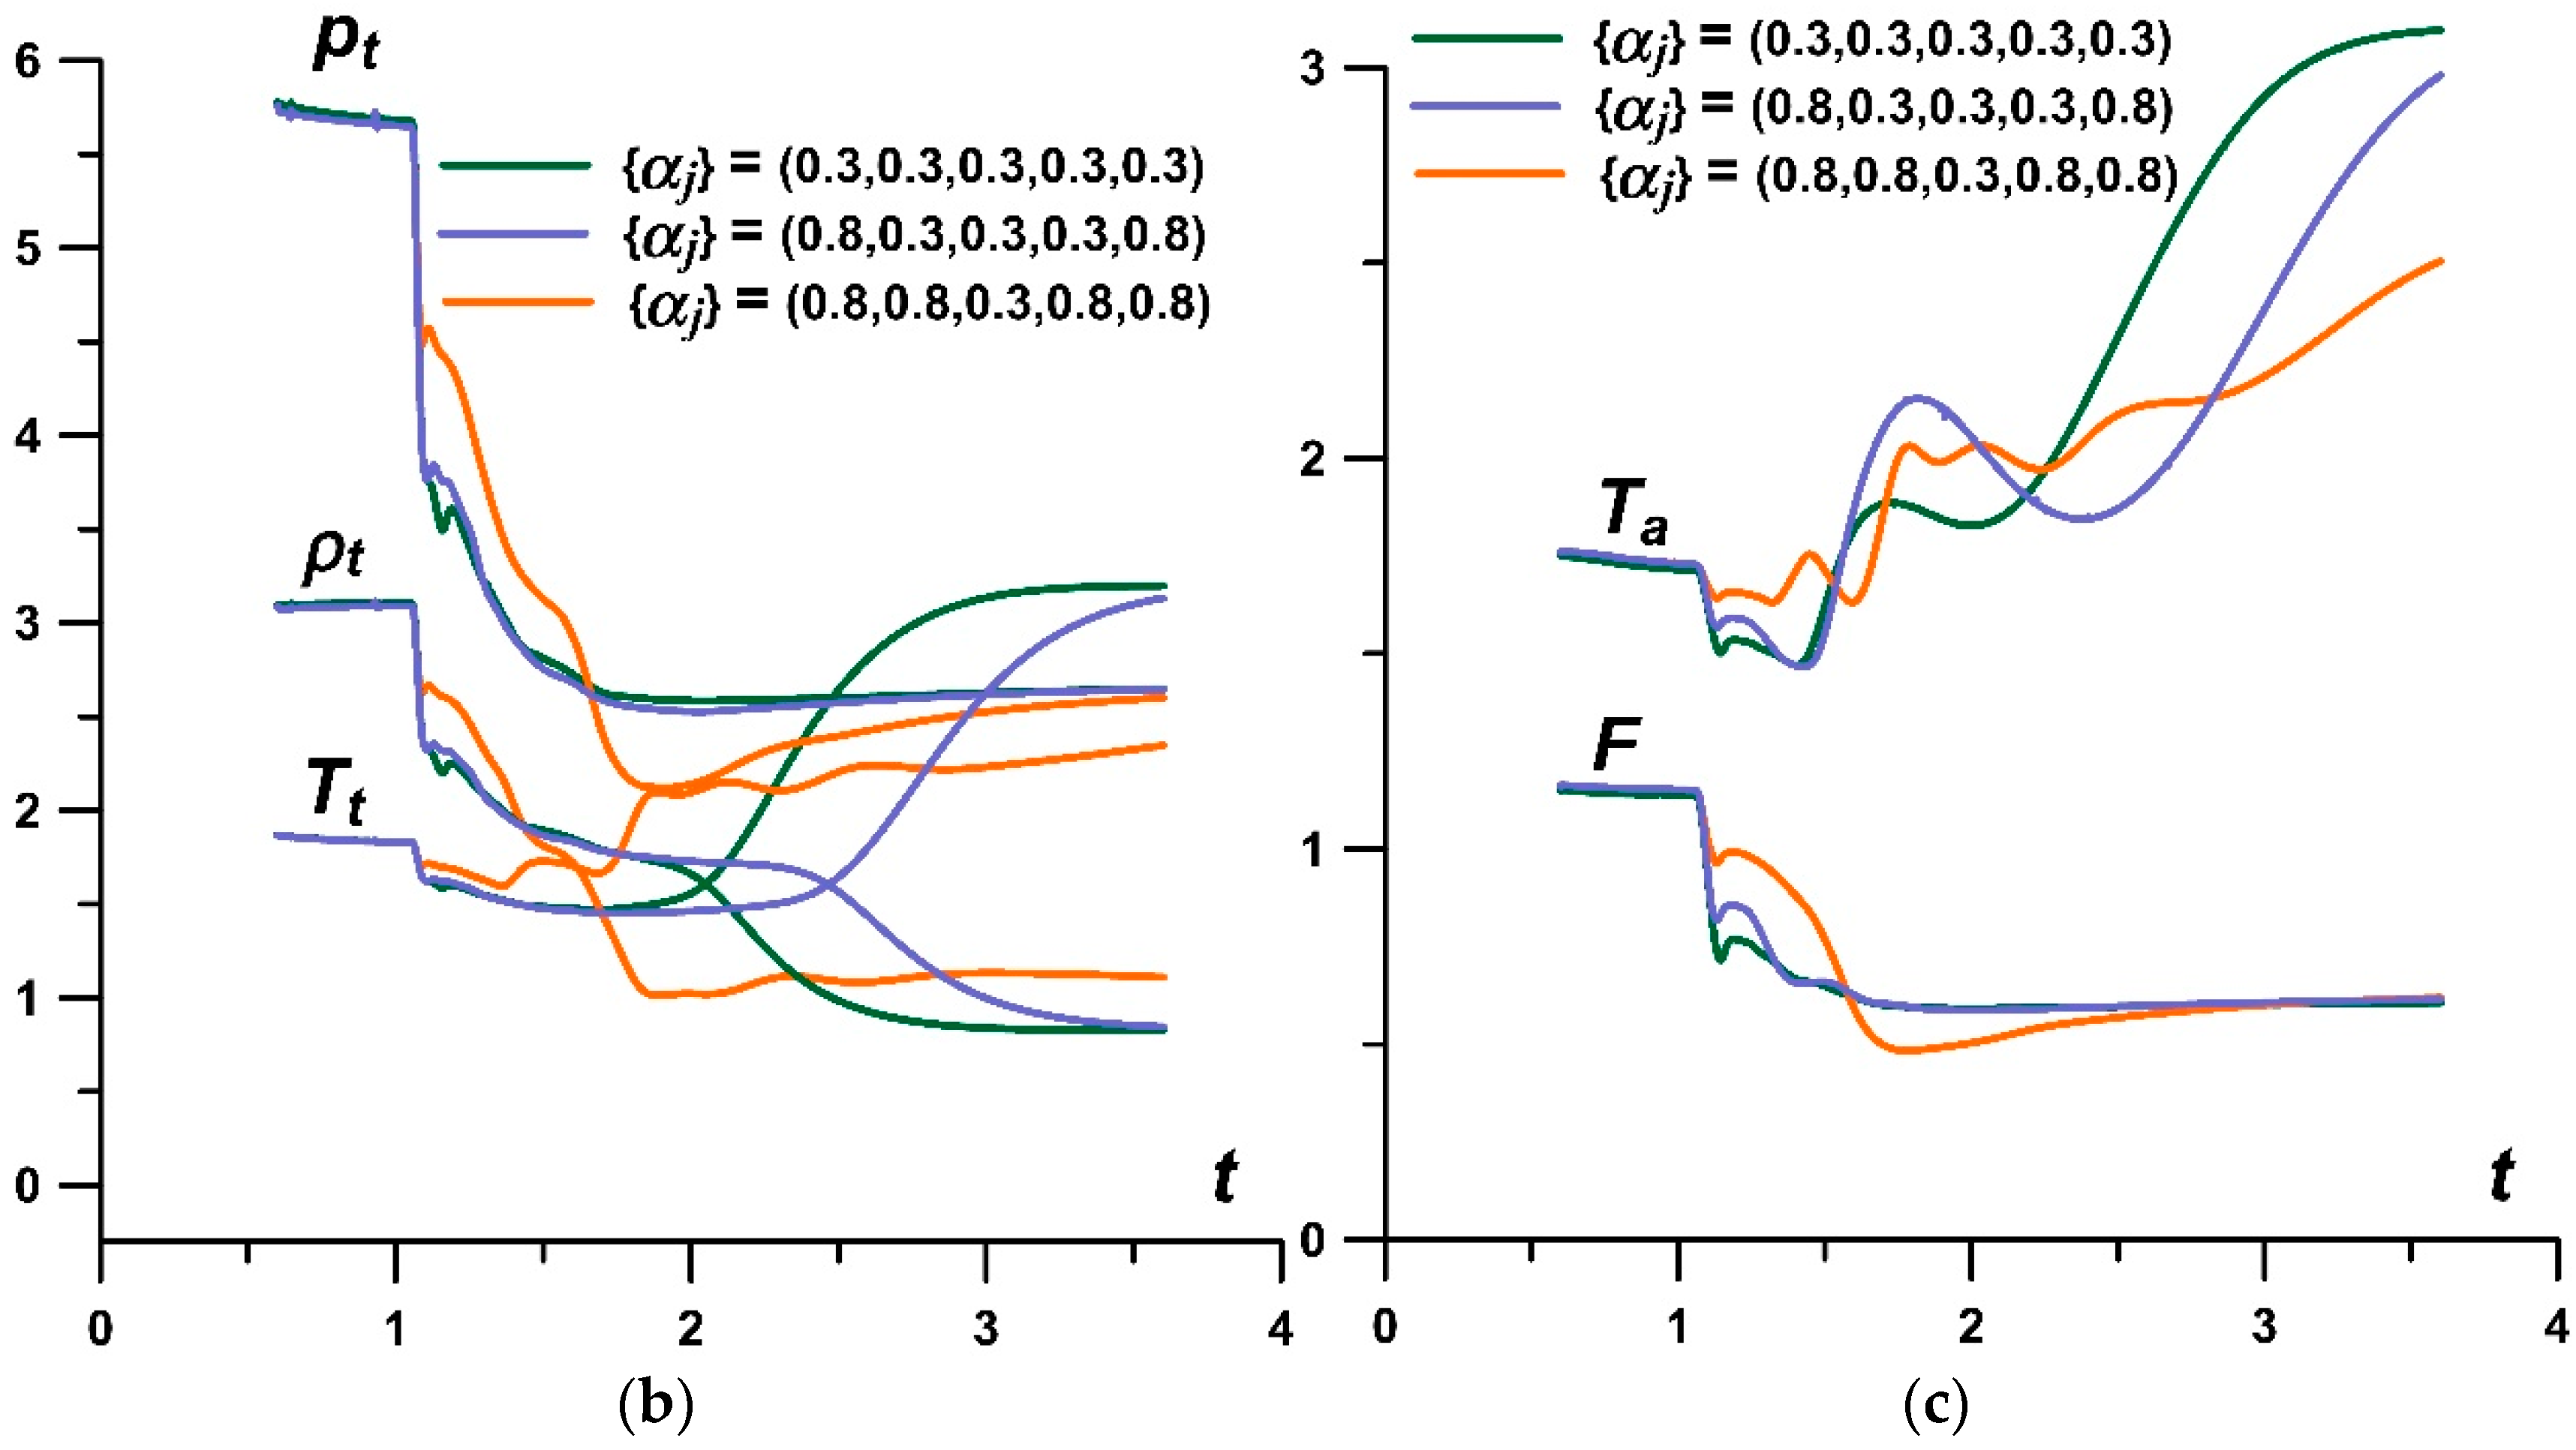
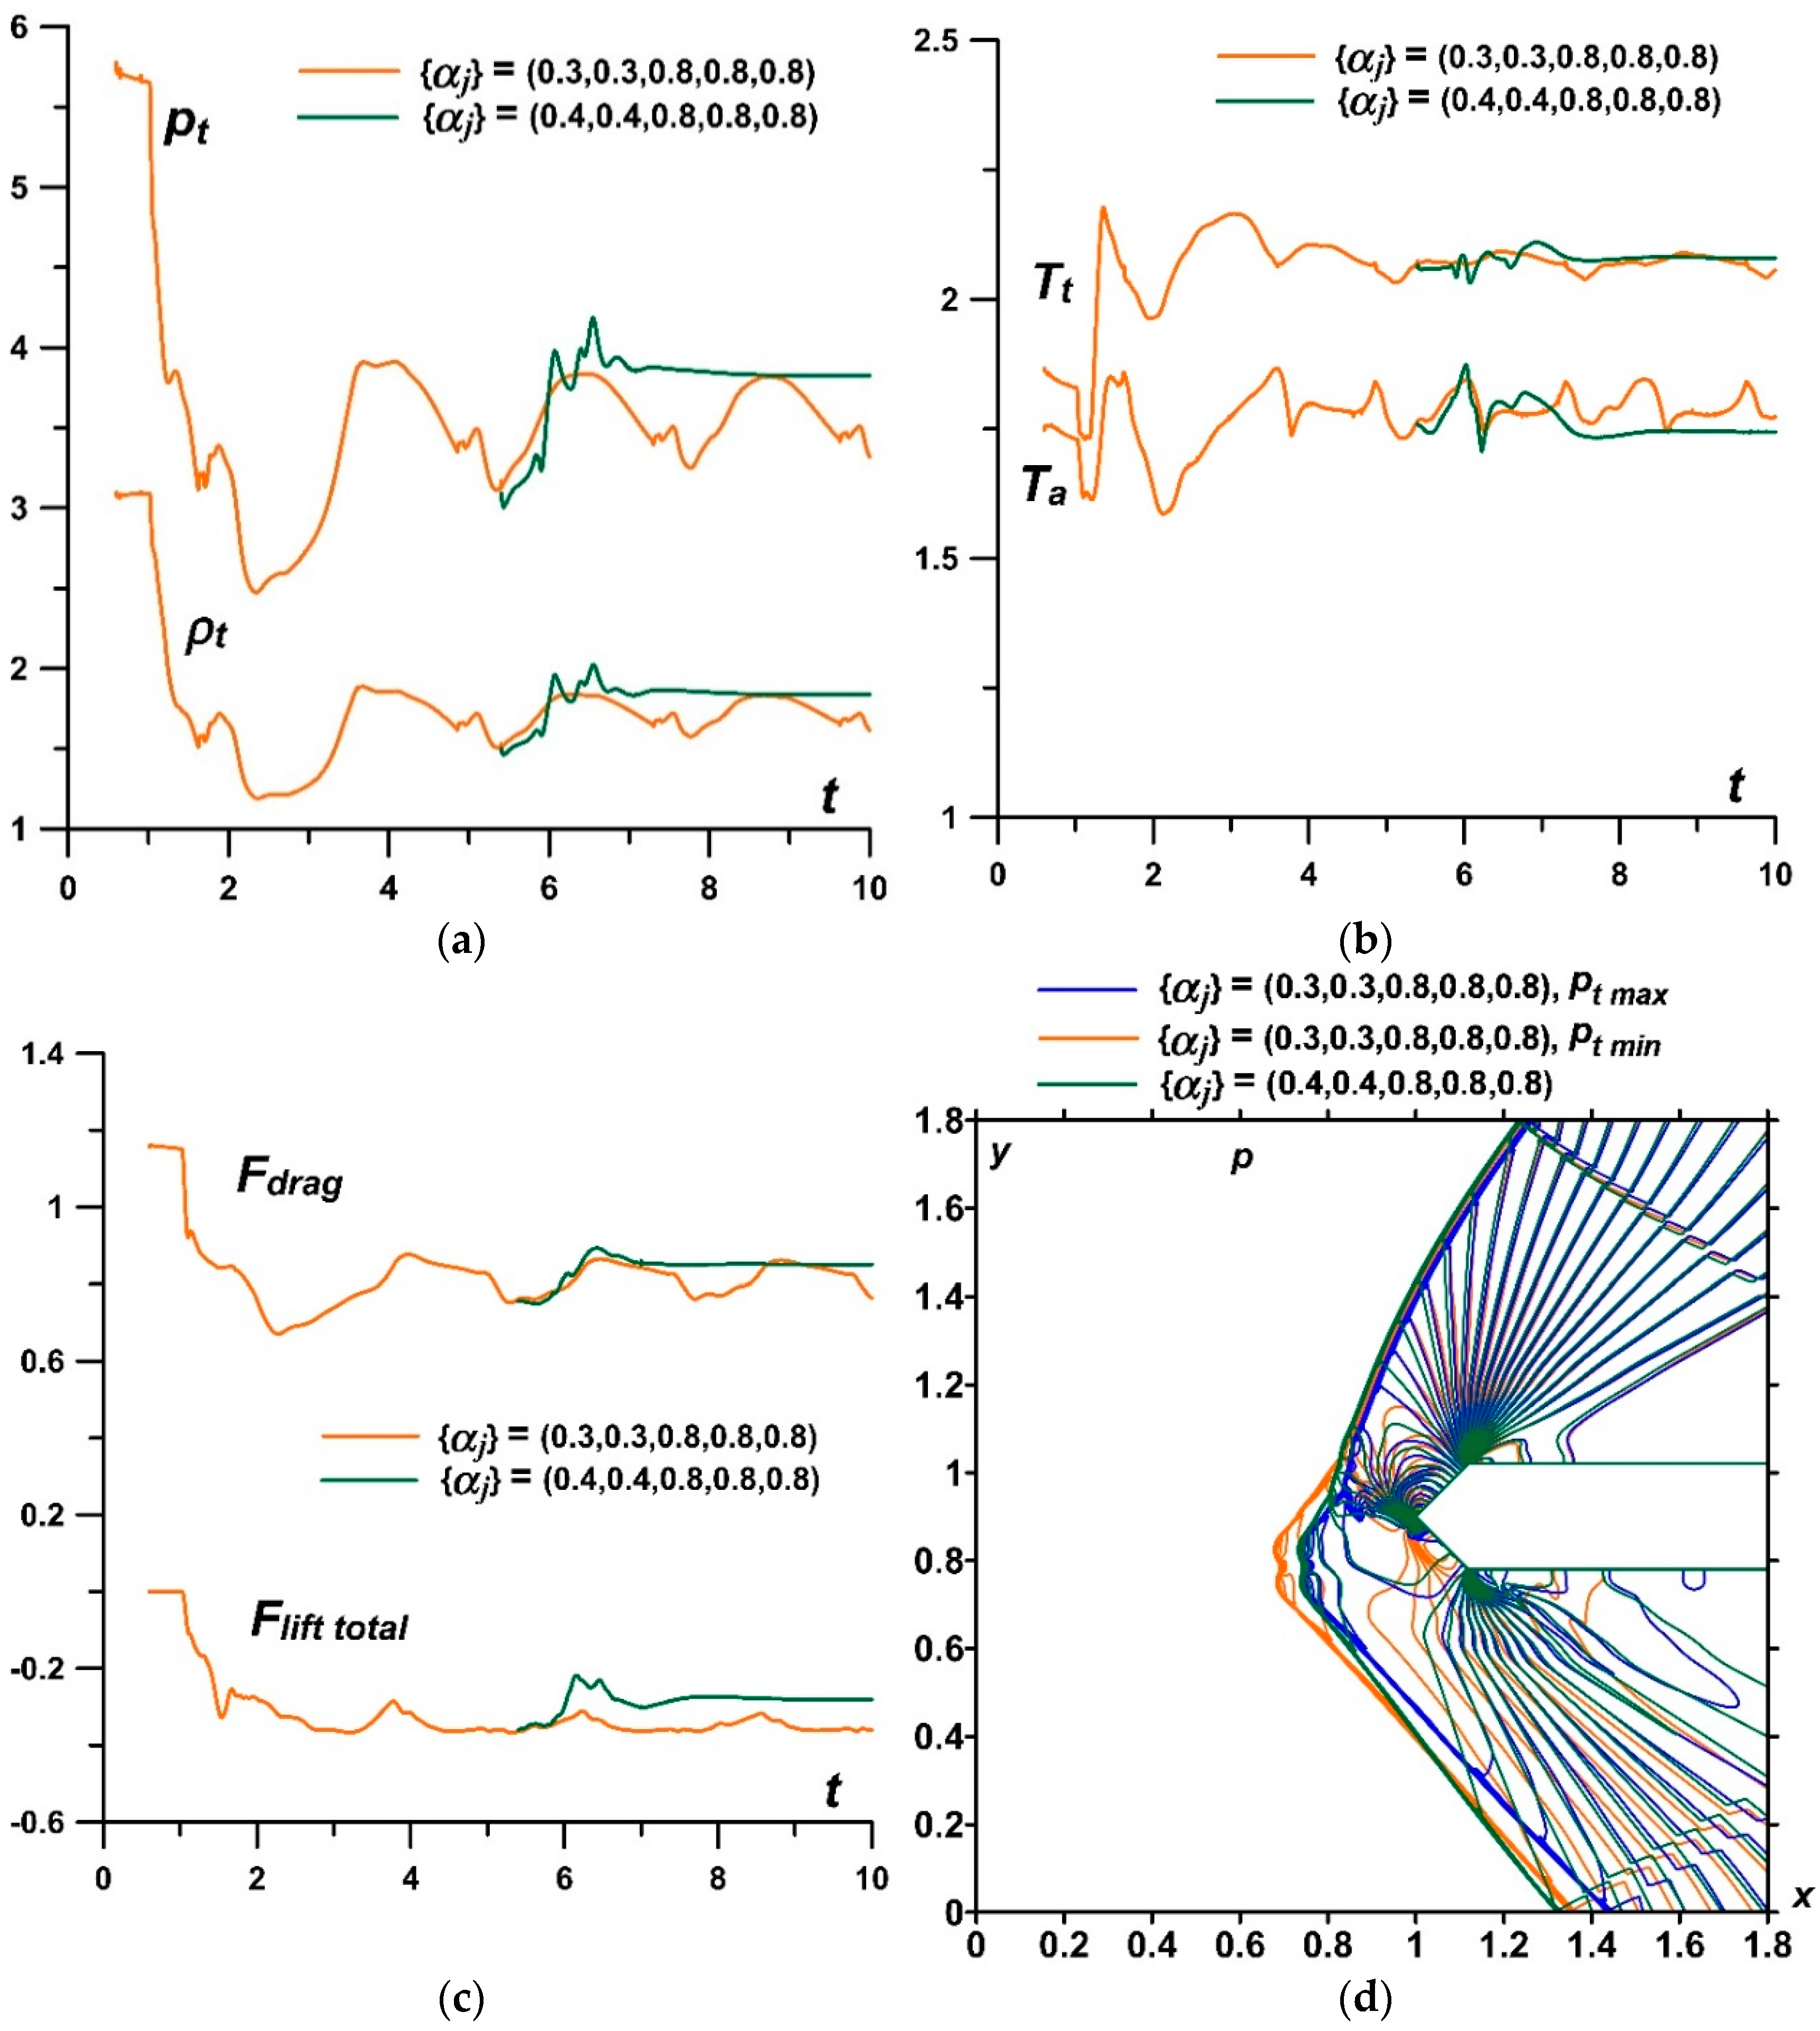
It was established that by setting asymmetric sets {αj} in a permanently operating stratified energy source, it is possible to provoke a pulsating flow mode. The mechanism of the self-sustained flow pulsations was described. The possibility to suppress the pulsations by alternately setting lower temperatures in the layers was shown. In this case, it was shown that one can control the flow parameters and the bow shock wave during the steady flow mode establishing. In addition, it is possible to suppress the pulsations and to control the flow parameters by switching at some time the set {αj} to another one with lower temperatures in the layers.
-
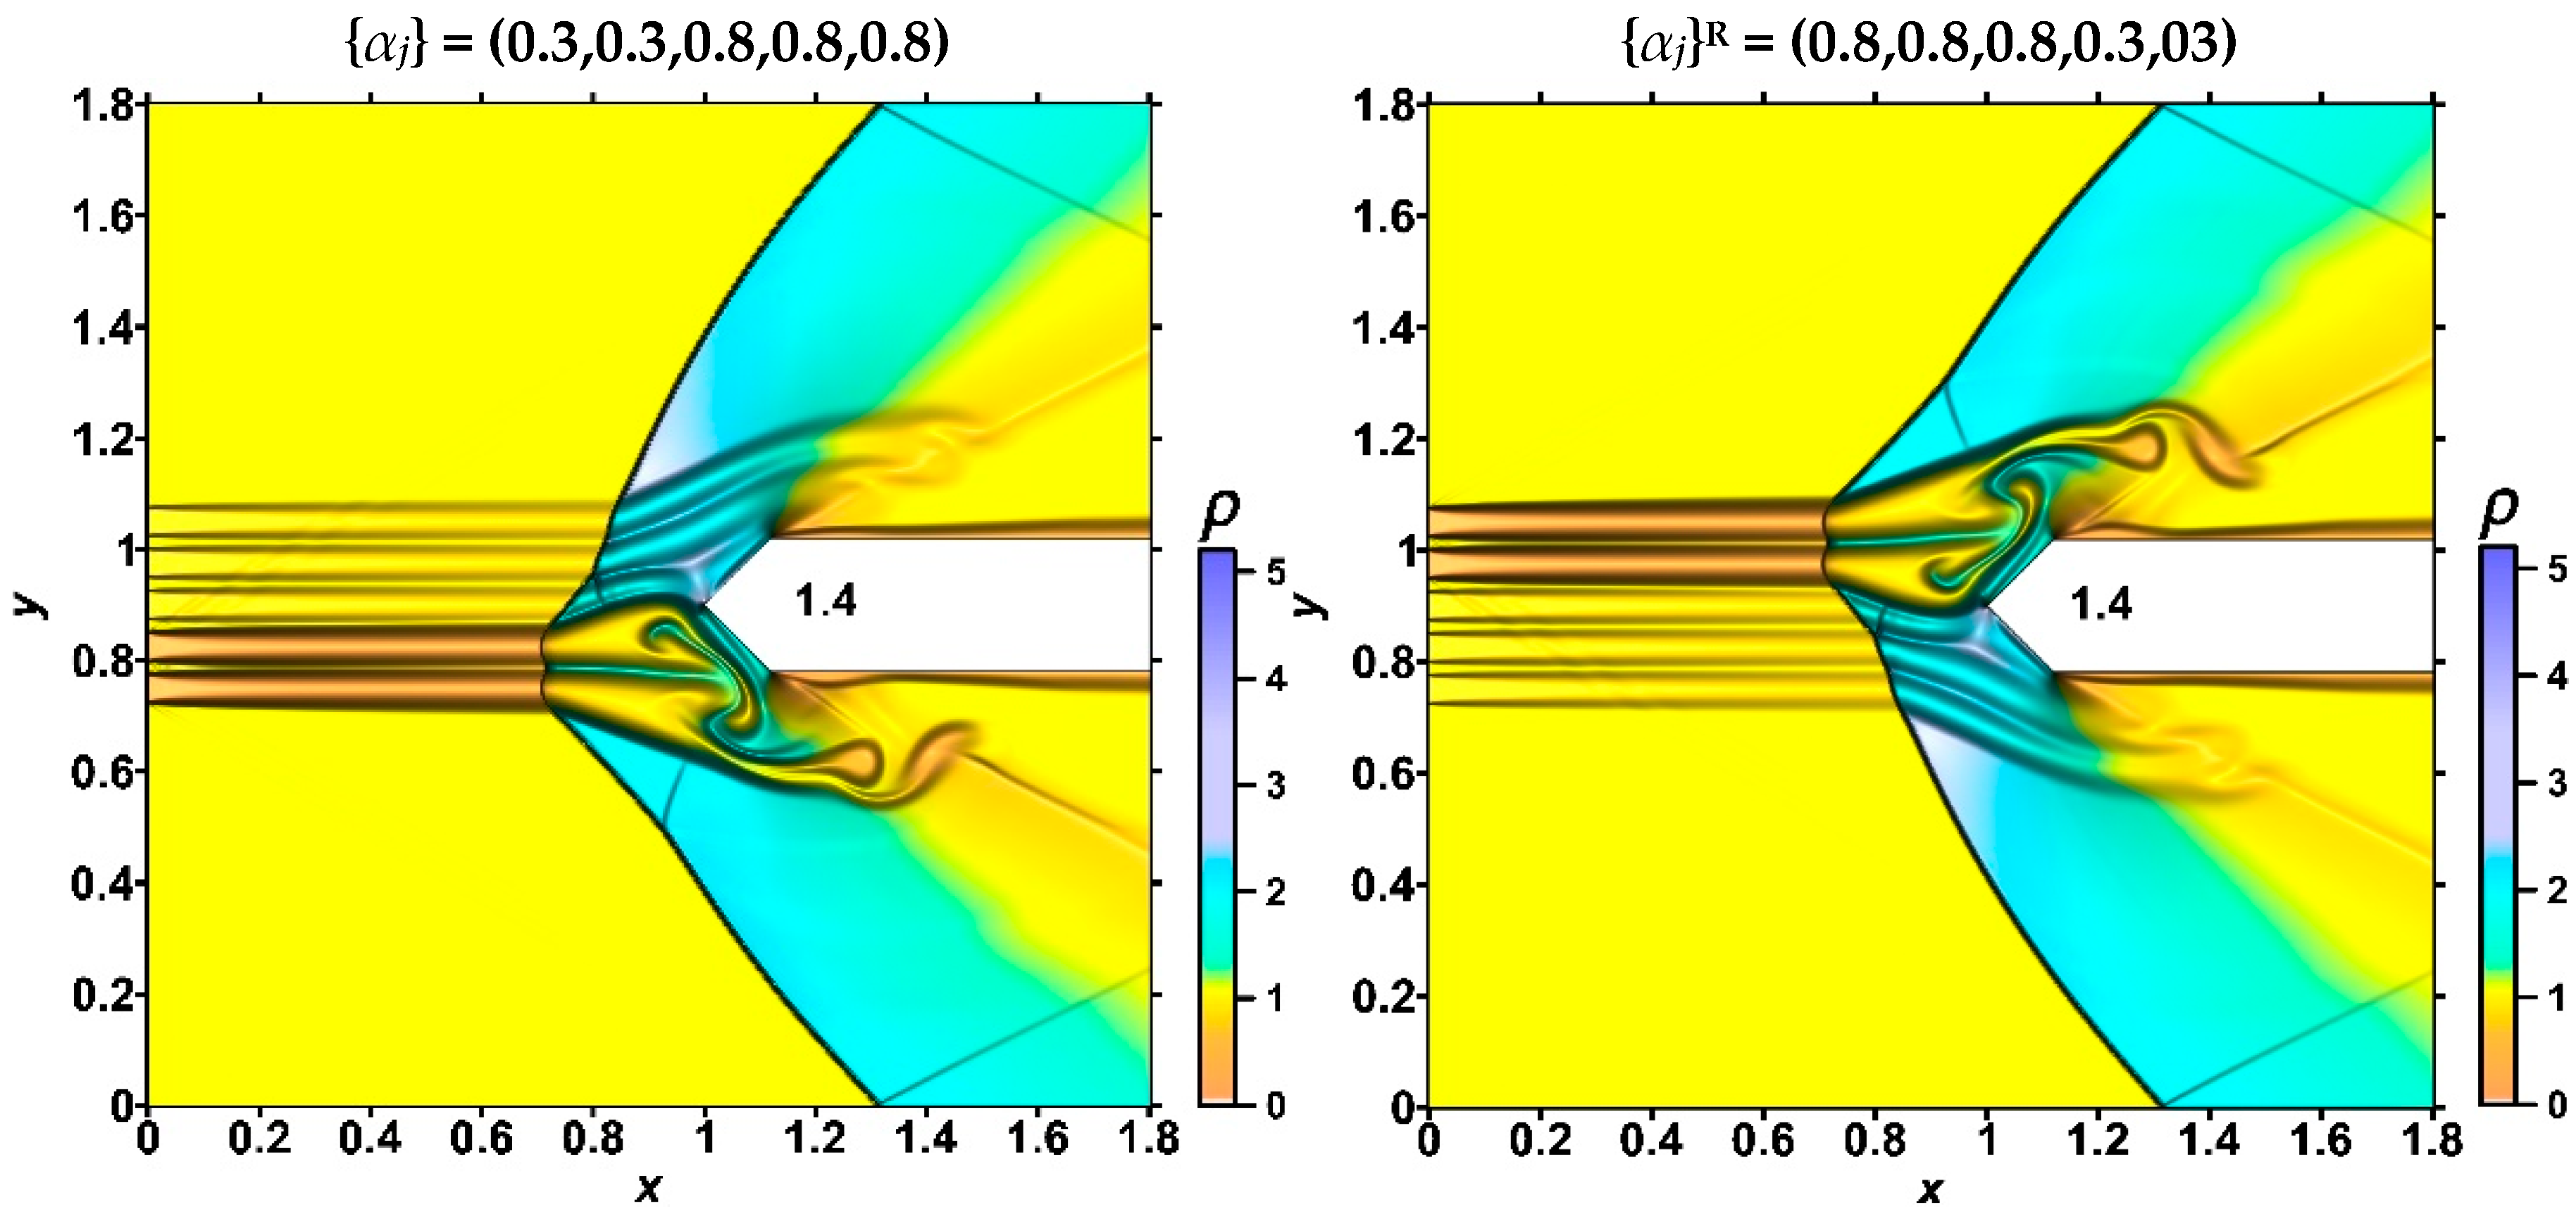
It was obtained that for the set {αj} = (α1,α2,α3,α4,α5) and for the reverse set {αj}R = (α5,α4,α3,α2,α1) in a permanently operating stratified energy source, the flow patterns are exactly opposite due to the assumption that the axis of symmetry of the stratified source coincides with the axis of symmetry of an AD body.
-
It was shown that a stratified source with a reverse set {αj}R (in comparison with the source with {αj}) produces equal, in absolute value, and oppositely directed lift (pitch) forces constantly acting on the body (at zero angle of attack) and the same drag force Fdrag, the parameters at the top, and the average front surface temperature. It was also shown that a steady flow mode can be changed to another one characterized by an oppositely directed lift (pitch) force by switching at some time the set {αj} to the reverse one {αj}R. In this case, the drag force Fdrag and the parameters at the top as well as the average front surface temperature do not change.

Funding

This research received no external funding.

Institutional Review Board Statement

Not applicable.

Informed Consent Statement

Not applicable.

Data Availability Statement

All obtained data underlying the conclusions made can be provided by the author upon request.

Conflicts of Interest

The author declares no conflict of interest.

Nomenclature

DTransverse size of the aerodynamic body
FDrag force of the front surface of the aerodynamic body
hjThe width of the layers in the energy source
MThe freestream Mach number
p, ρ, u, v, T, MPressure, density, velocity components, temperature, and local Mach number of the flow
PrThe Prandtl number
ReThe Reynolds number
TaAverage temperature on the front surface of the aerodynamic body
tTime
y0Coordinate of the axis of symmetry of an AD body
αjRarefaction parameter in the j-layer of the stratified energy source
γRatio of specific heats
εSpecific internal energy of the gas
Indices
jParameters in the layers of the stratified energy source
nNormalizing parameters
tParameters at the top of the body
Freestream parameters
ADAerodynamic

References

  1. Knight, D.D. Energy Deposition for High-Speed Flow Control; Cambridge University Press: Cambridge, MA, USA, 2019. [Google Scholar] [CrossRef]
  2. Knight, D.D. Survey of aerodynamic drag reduction at high speed by energy deposition. J. Propuls. Power 2008, 24, 1153–1167. [Google Scholar] [CrossRef]
  3. Fomin, V.M.; Tretyakov, P.K.; Taran, J.-P. Flow control using various plasma and aerodynamic approaches (short review). Aerosp. Sci. Technol. 2004, 8, 411–421. [Google Scholar] [CrossRef]
  4. Rashid, S.; Nawaz, F.; Maqsood, A.; Salamat, S.; Riaz, R. Review of wave drag reduction techniques: Advances in active, passive, and hybrid flow control. Proc. Inst. Mech. Eng. Part G J. Aerosp. Eng. 2022, 12, 1–83. [Google Scholar] [CrossRef]
  5. Ahmed, M.Y.M.; Qin, N. Forebody shock control devices for drag and aero-heating reduction: A comprehensive survey with a practical perspective. Prog. Aerosp. Sci. 2020, 112, 100585. [Google Scholar] [CrossRef]
  6. Starikovskiy, A.Y.; Aleksandrov, N.L. Gasdynamic flow control by ultrafast local heating in a strongly nonequilibrium pulsed plasma. Plasma Phys. Rep. 2021, 47, 148–209. [Google Scholar] [CrossRef]
  7. Leonov, S.B.; Adamovich, I.V.; Soloviev, V.R. Dynamics of near-surface electric discharges and mechanisms of their interaction with the airflow. Plasma Sources Sci. Technol. 2016, 25, 063001. [Google Scholar] [CrossRef]
  8. Leonov, S.B. Review of plasma-based methods for high-speed flow control. In Proceedings of the Sixth International Conference on Fluid Mechanics AIP Conference Proceedings, Guangzhou, China, 30 June–3 July 2011. [Google Scholar] [CrossRef]
  9. Russell, A.; Zare-Behtash, H.; Kontis, K. Joule heating flow control methods for high-speed flows. J. Electrost. 2016, 80, 34–68. [Google Scholar] [CrossRef] [Green Version]
  10. Znamenskaya, I.A. Methods for panoramic visualization and digital analysis of thermophysical flow fields. A review. Sci. Vis. 2021, 13, 125–158. [Google Scholar] [CrossRef]
  11. Georgievsky, P.Y.; Levin, V.A. Supersonic flow over bodies in the presence of external energy release. Pis’ma Zhurnal Teh. Phiz 1988, 14, 684–687. Available online: http://journals.ioffe.ru/articles/viewPDF/31216 (accessed on 1 October 2022). (In Russian).
  12. Artem’ev, V.I.; Bergel’son, V.I.; Nemchinov, I.V.; Orlova, T.I.; Smirnov, V.A.; Hazins, V.M. Changing the regime of supersonic streamlining obstacles via raising the thin channel of low density. Izv. Akad. Nauk. SSSR Meh. Židk. Gaza 1989, 5, 146–151. (In Russian) [Google Scholar]
  13. Nemchinov, I.V.; Artem’ev, V.I.; Bergel’son, V.I.; Hazins, V.M.; Orlova, T.I.; Rybakov, V.A. Rearrangement of the bow shock shape using a “hot spike”. Shock Waves 1994, 4, 35–40. [Google Scholar] [CrossRef]
  14. Kolesnichenko, Y.F.; Brovkin, V.G.; Azarova, O.A.; Grudnitsky, V.G.; Lashkov, V.A.; Mashek, I.C. Microwave energy release regimes for drag reduction in supersonic flows. Paper AIAA-2002-0353. In Proceedings of the 40th Aerospace Sciences Meeting and Exhibit, Reno, NV, USA, 14–17 January 2002. [Google Scholar] [CrossRef]
  15. Myrabo, L.N.; Raizer, Y.P. Laser-Induced Air Spikes for Advanced Transatmospheric Vehicles. Paper AIAA-1994-2451. In Proceedings of the 25th AIAA Plasma Dynamics and Lasers Conference, Colorado Springs, CO, USA, 20–23 June 1994. [Google Scholar]
  16. Tretyakov, P.K.; Fomin, V.M.; Yakovlev, V.I. New principles of control of aerophysical processes-research development. In Proceedings of the International Conference on the Methods of Aerophysical Research, Novosibirsk, Russia, 29 June–3 July 1996; pp. 210–220. [Google Scholar]
  17. Kim, S.; Lee, H.J. Influence of laser energy deposition conditions on the drag of a sphere in supersonic flow. Energies 2019, 12, 3914. [Google Scholar] [CrossRef] [Green Version]
  18. Bityurin, V.; Klimov, A.; Leonov, S.; Brovkin, V.; Kolesnichenko, Y.; Popov, N.; Van Wie, D.M. Shock waves structure and velocity at propagation through non-homogeneous plasma. AIAA Paper 2000–2571. In Proceedings of the 31st Plasmadynamics and Lasers Conference, Denver, CO, USA, 19–22 June 2000. [Google Scholar] [CrossRef]
  19. Ukai, T.; Kontis, K. Thermal fluctuation characteristics around a nanosecond pulsed dielectric barrier discharge plasma actuator using a frequency analysis based on schlieren images. Energies 2020, 13, 628. [Google Scholar] [CrossRef] [Green Version]
  20. Lapushkina, T.A. Principles of magnetohydrodynamical control of internal and external supersonic flows. Energies 2022, 15, 5641. [Google Scholar] [CrossRef]
  21. Lapushkina, T.A.; Erofeev, A.V. Supersonic flow control via plasma, electric and magnetic impacts. Aerosp. Sci. Technol. 2017, 69, 313. [Google Scholar] [CrossRef]
  22. Georgievsky, P.Y.; Levin, V.A. Transition to irregular regimes of supersonic flows over bodies initiated by energy deposition. AIAA Paper 2005-1047. In Proceedings of the 43rd AIAA Aerospace Sciences Meeting and Exhibit, Reno, NV, USA, 10–13 January 2005. [Google Scholar] [CrossRef]
  23. Azarova, O.A. A minimum-stencil difference scheme for computing two-dimensional axisymmetric gas flows: Examples of pulsating flows with instabilities. Comput. Math. Math. Phys. 2009, 49, 710–728. [Google Scholar] [CrossRef]
  24. Azarova, O.A.; Knight, D.D.; Kolesnichenko, Y.F. Pulsating stochastic flows accompanying microwave filament/supersonic shock layer interaction. Shock Waves 2011, 21, 439–450. [Google Scholar] [CrossRef]
  25. Azarova, O.; Knight, D.; Kravchenko, O. Lift Forces, heat fluxes and self-sustained oscillations over supersonic bodies under asymmetric energy deposition. In Proceedings of the 8th European Conference for Aeronautics and Space Sciences (EUCASS), Madrid, Spain, 1–4 July 2019. [Google Scholar] [CrossRef]
  26. Khamseh, A.P.; Kiriakos, R.M.; DeMauro, E.P. Stereoscopic particle image velocimetry of laser energy deposition on a Mach 3.4 flow field. Exp. Fluids 2021, 62, 39. [Google Scholar] [CrossRef]
  27. Knight, D.D.; Azarova, O.A.; Kolesnichenko, Y.F. On details of flow control via characteristics and location of microwave filament during its interaction with supersonic blunt body. AIAA Paper 2009-847. In Proceedings of the 47th AIAA Aerospace Sciences Meeting Including the New Horizons Forum and Aerospace Exposition, Orlando, FL, USA, 5–8 January 2009. [Google Scholar] [CrossRef]
  28. Azarova, O.A.; Knight, D.D.; Kolesnichenko, Y.F. Flow control via instabilities, vortices and steady structures under the action of external microwave energy release. Proc. Inst. Mech. Eng. Part G J. Aerosp. Eng. 2013, 227, 1498–1515. [Google Scholar] [CrossRef]
  29. Leonov, S.; Carter, C.; Houpt, A.; Ombrello, T. Mitigation of reflected shock wave by streamwise plasma array. In Proceedings of the 7th European Conference for Aeronautics and Space Sciences, Milan, Italy, 3–6 July 2017. [Google Scholar] [CrossRef]
  30. Andrews, P.; Lax, P.; Leonov, S. Triggering shock wave positions by patterned energy deposition. Energies 2022, 15, 7104. [Google Scholar] [CrossRef]
  31. Leonov, S.B.; Carter, C.D.; Hedlund, B.E.; Houpt, A.W.; Ombrello, T.; Firsov, A.A. Control of amplitude and position of reflected shock wave by stripwise plasma. AIAA 2018-0683. In Proceedings of the Aerospace Sciences Meeting, Kissimmee, FL, USA, 8–12 January 2018. [Google Scholar] [CrossRef]
  32. Leonov, S.B.; Firsov, A.A.; Houpt, A.W. Suppression of reflected oblique shock wave by multi-filamentary plasma. J. Phys. Conf. Ser. 2018, 1112, 012005. [Google Scholar] [CrossRef]
  33. Lapushkina, T.A.; Erofeev, A.V.; Azarova, O.A.; Kravchenko, O.V. Interaction of a plane shock wave with an area of ionization instability of discharge plasma in air. Aerosp. Sci. Technol. 2019, 85, 347–358. [Google Scholar] [CrossRef]
  34. Gan, T.; Wu, Y.; Sun, Z.; Jin, D.; Song, H.; Jia, M. Shock wave boundary layer interaction controlled by surface arc plasma actuators. Phys. Fluids 2018, 30, 055107. [Google Scholar] [CrossRef]
  35. Tang, M.; Wu, Y.; Guo, S.; Sun, Z.; Luo, Z. Effect of the streamwise pulsed arc discharge array on shock wave/boundary layer interaction control. Phys. Fluids 2020, 32, 076104. [Google Scholar] [CrossRef]
  36. Samimy, M.; Webb, N.; Esfahani, A. Reinventing the wheel: Excitation of flow instabilities for active flow control using plasma actuators. J. Phys. D Appl. Phys. 2019, 52, 354002. [Google Scholar] [CrossRef]
  37. Apazidis, N.; Sembian, S.; Liverts, M. Blast wave interaction with thermal and density inhomogeneities in air. In Proceedings of the 32nd International Symposium on Shock Waves, Singapore, 14–19 July 2019. [Google Scholar] [CrossRef]
  38. Sembian, S.; Liverts, M.; Apazidis, N. Plane blast wave interaction with an elongated straight and inclined heat-generated inhomogeneity. J. Fluid Mech. 2018, 851, 245–267. [Google Scholar] [CrossRef]
  39. Azarova, O.A. Generation of Richtmyer-Meshkov and secondary instabilities during the interaction of an energy release with a cylinder shock layer. Aerosp. Sci. Technol. 2015, 42, 376–383. [Google Scholar] [CrossRef]
  40. Azarova, O.A.; Kravchenko, O.V.; Lapushkina, T.A.; Erofeev, A.V. Density and temperature fluctuations behind a shock wave under the influence of a stratified energy source. Tech. Phys. Lett. 2020, 46, 649–652. [Google Scholar] [CrossRef]
  41. Azarova, O.A.; Krasnobaev, K.V.; Kravchenko, O.V.; Lapushkina, T.A.; Erofeev, A.V. Redistribution of energy in a viscous heat-conductive medium during the interaction of a shock wave with a temperature layered plasma region. J. Phys. Conf. Ser. 2020, 1698, 012004. [Google Scholar] [CrossRef]
  42. Azarova, O.A.; Lapushkina, T.A.; Krasnobaev, K.V.; Kravchenko, O.V. Redistribution of energy during interaction of a shock wave with a temperature layered plasma region at hypersonic speeds. Aerospace 2021, 8, 326. [Google Scholar] [CrossRef]
  43. Azarova, O.A. Supersonic flow control using combined energy deposition. Aerospace 2015, 2, 118–134. [Google Scholar] [CrossRef] [Green Version]
  44. Azarova, O.A.; Kravchenko, O.V. Impact of a thermally stratified energy source on the bow shock wave and aerodynamic characteristics of a body. J. Phys. Conf. Ser. 2021, 1891, 012025. [Google Scholar] [CrossRef]
  45. Azarova, O.A.; Kravchenko, O.V. Principles of unsteady high-speed flow control using limited in time thermally stratified energy source. Fluids 2022, 7, 326. [Google Scholar] [CrossRef]
  46. Roache, P.J. Computational Fluid Dynamics; Mir: Moscow, Russia, 1980. [Google Scholar]
  47. Azarova, O.A. Complex conservative difference schemes for computing supersonic flows past simple aerodynamic forms. J. Comput. Math. Math. Phys. 2015, 55, 2025–2049. [Google Scholar] [CrossRef]
Figure 1. Statement of the problem (schematic). A numbering of layers in a stratified energy source is shown.
Energies 15 08627 g001
Figure 2. Analysis of the grid convergence on three different grids: (a) density fields (isochores, superposed); (b) dynamics of the pressure pt and density ρt at the top of the body.
Energies 15 08627 g002
Figure 3. Dynamics of density fields for symmetrical set {αj} = (0.3,0.3,0.3,0.3,0.3) in the thermally stratified energy source during new steady-state establishing (planar view).
Energies 15 08627 g003
Figure 4. Dynamics of density fields for symmetrical set {αj} = (0.3,0.3,0.3,0.3,0.3) in the thermally stratified energy source during new steady-state establishing (surface view).
Energies 15 08627 g004
Figure 5. Dynamics of pressure fields for symmetrical set {αj} = (0.3,0.3,0.3,0.3,0.3) in the thermally stratified energy source during new steady-state establishing.
Energies 15 08627 g005
Figure 6. Dynamics of temperature fields for symmetrical set {αj} = (0.3,0.3,0.3,0.3,0.3) in the thermally stratified energy source during new steady-state establishing.
Energies 15 08627 g006
Figure 7. Dynamics of the fields of local Mach number for symmetrical set {αj} = (0.3,0.3,0.3,0.3,0.3) in the thermally stratified energy source during new steady-state establishing.
Energies 15 08627 g007
Figure 8. Density fields for different symmetrical sets {αj} in the thermally stratified energy source in the new steady flow modes established (surface view).
Energies 15 08627 g008aEnergies 15 08627 g008b
Figure 9. Fields of pressure in the steady flow mode (isolines, imposition of images) (a); dynamics of pressure, density, and temperature at the top of the body (b); and average front surface temperature and drag force (c) during the steady flow establishing for different sets {αj} with equal values αj.
Energies 15 08627 g009
Figure 10. Density fields for different asymmetrical sets {αj} in the thermally stratified energy source during the new steady flow modes established; t = 1.2 (left row), t = 3.6 (right row) (surface view).
Energies 15 08627 g010
Figure 11. Fields of pressure in the steady flow mode (isochores, imposition of images) (a); dynamics of pressure, density, temperature at the top of the body (b); and average front surface temperature and drag force (c) during the steady flow establishing for different symmetrical sets {αj}.
Energies 15 08627 g011aEnergies 15 08627 g011b
Figure 12. Dynamics of density fields for asymmetrical set {αj} = (0.3,0.3,0.8,0.8,0.8) in the thermally stratified energy source during new steady-state establishing.
Energies 15 08627 g012
Figure 13. Dynamics of pressure fields for asymmetrical set {αj} = (0.3,0.3,0.8,0.8,0.8) in the thermally stratified energy source during new steady-state establishing.
Energies 15 08627 g013
Figure 14. Dynamics of pressure and density at the top of the body (a); temperature at the top, average front surface temperature, and drag forces (b) and lift forces (c) during the flow pulsations for {αj} = (0.3,0.3,0.8,0.8,0.8).
Energies 15 08627 g014
Figure 15. Fields of density, pressure, temperature, and local Mach number, {αj} = (0.3,0.3,0.8,0.8,0.8): left row—at time instant of maximum value of pressure at the top; right row—at time instant of minimum value of pressure at the top.
Energies 15 08627 g015aEnergies 15 08627 g015b
Figure 16. Suppression of the flow pulsations: dynamics of (a) pressure and density at the top of the body; temperature at the top and average front surface temperature (b); drag and lift forces (c); pressure fields for different {αj} (imposition of images) (d).
Energies 15 08627 g016
Figure 17. Suppression of the flow pulsations: {αj} = (0.3,0.3,0.8,0.8,0.8) for t < 5.4 and {αj} = (0.4,0.4,0.8,0.8,0.8) for t > 5.4. Dynamics of pressure and density at the top of the body (a); temperature at the top and average front surface temperature (b); drag and lift forces (c); pressure fields for different {αj} (imposition of images) (d).
Energies 15 08627 g017
Figure 18. Fields of density for {αj} = (0.3,0.3,0.8,0.8,0.8) (left row) and for according reverse sets {αj}R = (0.8,0.8,0.8,0.3,0.3) (right row).
Energies 15 08627 g018aEnergies 15 08627 g018b
Figure 19. Flow characteristics for{αj}R = (0.8,0.8,0.8,0.3,0.3). Dynamics of (a) pressure and density at the top of the body; temperature at the top, average front surface temperature, and drag forces (b); lift forces during the flow pulsations; dashed lines—the same for {αj} = (0.3,0.3,0.8,0.8,0.8) (c).
Energies 15 08627 g019aEnergies 15 08627 g019b
Figure 20. Formation of the opposite lift force. Combined action {αj} = (0.4,0.4,0.8,0.8,0.8) for t < 5.0 and {αj} = (0.8,0.8,0.8,0.4,0.4) for t > 5.0. Dynamics of pressure and density at the top of the body (a); temperature at the top, average front surface temperature (b), drag, and lift forces (c); steady pressure fields for considered {αj} (imposition of images) (d).
Energies 15 08627 g020
Figure 21. Generation of multiple Richtmyer–Meshkov instability and density fields: (a) t = 0.6012; (b) t = 0.76; (c) t = 0.76, enlarged; (d) t = 0.76, enlarged, surface view.
Energies 15 08627 g021
Table 1. Parameters of the oncoming flow, AD body, and stratified energy source.
DescriptionDesignationValue
Freestream Mach numberM2
Ratio of specific heatsγ1.4
Reynolds numberRe9500
Prandtl number (20C)Pr0.703
Ratio of the width of an AD body to the width of the layers in the energy sourceD/hj4.8
The duration of the source action in timeL
Table 2. Characteristics of grids and relative errors at t = 0.6.
GridSteps hx = hySizesRelative Error, ptRelative Error, ρt
Grid10.00053400 × 28001.81%1.75%
Grid20.000(6)2550 × 21001.57%2.04%
Grid30.0011700 × 14001.17%2.52%
Publisher’s Note: MDPI stays neutral with regard to jurisdictional claims in published maps and institutional affiliations.

