Abstract
Energy deposition for flow and flight control has received significant interest in the past several decades due to its potential application to high-speed flow and flight control. This paper reviews recent progress and recommends future research.
1. Introduction
Flow control is the modification of the flow structure by means of either active or passive modification to the original flow configuration. Cattafesta and Sheplak [1] categorize the former into three classes of actuators. The first class is fluidic characterized by fluid injection or suction. An example is the zero net mass flux jet actuator [2]. The second class is moving surface. An example is a vibrating flap [3]. The third class is plasma actuators including Dielectric Barrier Discharge (DBD) [4] and DC, laser and microwave discharge [5]. By contrast, passive flow control is characterized by a fixed change to the geometry of a body resulting in a modification of the flowfield. Examples include aerodynamic drag reduction using microstructure variations in the surface of a body (riblets) [6] and control of shock wave boundary layer interaction using vortex generators [7]. See also the review by Gad-el-Hak [8].
During the past several decades, numerous experimental and computational investigations have examined the effect of energy deposition on high-speed flow. The methods can be divided into continuous (c) and pulsed (p) energy deposition. A partial list of methods is shown in Table 1.

Table 1.
Methods of Energy Deposition in High-Speed Flow.
Recent reviews of energy deposition methods include Chernyi [9], Bityurin [10], Russell et al. [11], Knight [12], Zheltovodov [13], Knight et al. [14], Fomin et al. [15], Bletzinger et al. [16], Zubkov et al. [17] and Knight [5]. The present review focuses on developments since the publication of Knight [5] with a focus on three areas: (1) SparkJet, (2) drag reduction, and (3) flow control.
2. SparkJet
2.1. Background
The SparkJet (also known as Plasma Jet, Plasma Synthetic Jet or Plasma Synthetic Jet Actuator) was originally developed by Grossman et al. [18,19] and Cybyk et al. [20,21,22]. The concept is shown in Figure 1 for a SparkJet in an ambient environment. Two (or more) electrodes are contained within a cavity. A small orifice typically designed as a converging nozzle allows exchange of gas with the exterior. An electrical energy source (e.g., charged capacitor) is discharged between two electrodes within a cavity (Stage 1). The resultant spark creates a high pressure, high temperature plasma and a high-speed jet issues from the cavity exit (Stage 2). The pressure in the cavity decreases as the jet exhausts the cavity, and the cavity cools due to heat transfer to the surrounding surface. Subsequently the pressure drops below the external ambient pressure, and a reverse flow of air refills the cavity (Stage 3).
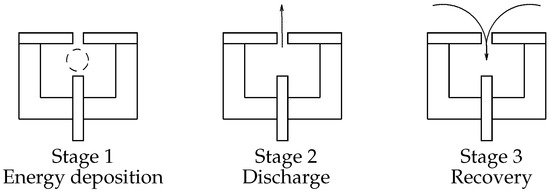
Figure 1.
SparkJet operation.
Other early studies of SparkJets include Haack et al. [23,24,25], Caruana et al. [26], Hardy et al. [27], Narayanswami et al. [28,29,30,31], Anderson and Knight [32,33] and Golbabaei-Asl and Knight [34,35], Emerick et al. [36], Laurendeau et al. [37], Sary et al. [38], Zong et al. [39,40,41,42], Zong and Kotsonis [43,44,45,46,47].
2.2. Wang et al. (2018)
Wang et al. [48] conducted a combined computational and experimental study of the effect of an array of pulsed SparkJets on boundary layer separation in supersonic flow. A nominally two dimensional blunt flat plate with forward facing step generated a large separation region (Figure 2). The flow conditions are detailed in Table 2.
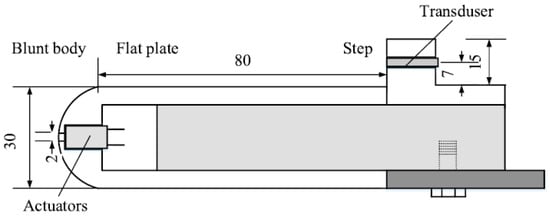
Figure 2.
Model (side view). Reprint from [48] with permission from Elsevier.
Table 2.
Flow Conditions.
Experiments were performed for three SparkJet pulse frequencies in quiescent air and at Mach 2. The parameters are listed in Table 3. Figure 3 displays the average SparkJet force defined as
where is the “dynamic pressure” (presumably, the stagnation pressure since the jet Mach number is subsonic) at the orifice exit of area A. The force decreases with time as the jet weakens, and is insensitive to the pulse frequency. Figure 4 shows time-averaged Schlieren images of the boundary layer for both no energy deposition and the three different frequencies of energy deposition. The separation region ahead of the forward facing step is significantly reduced by the pulsed SparkJets. The natural frequency of the separation shock in the absence of energy deposition is in the range of 2 kHz to 4 kHz, and therefore the energy deposition at and (Cases 2 and 3) causes resonance.
Table 3.
SparkJet Parameters.
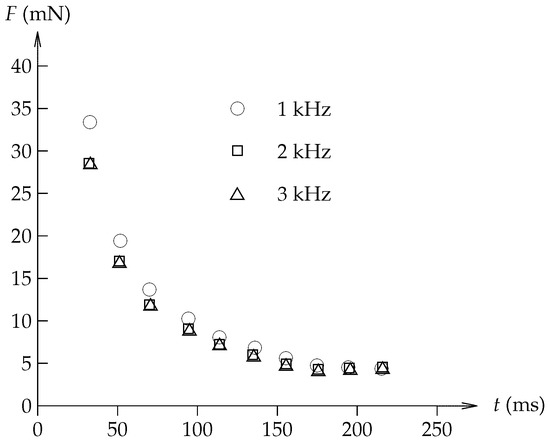
Figure 3.
F versus t.
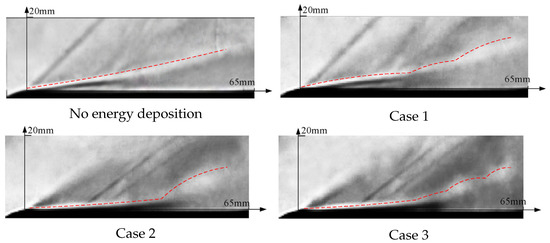
Figure 4.
Time averaged Schlieren images. Reprint from [48] with permission from Elsevier.
2.3. Zhou et al. (2018–2019)
Zhou et al. [49] and Zhou et al. [50] examined two- and three-electrode SparkJet arrays. Zhou et al. [49] focused on the efficiency and flow properties of a serial array of SparkJets. Figure 5 illustrates the concept of parallel and serial arrays. The parallel array uses separate energy supplies for each actuator, while the serial array uses a single energy supply. Figure 6 indicates the power supply circuit for the serial array. Figure 7 shows a sectional view of the two-electrode SparkJet.
Figure 5.
SparkJet arrays in parallel and serial.
Figure 6.
Power supply.
Figure 7.
Sectional view of two-electrode SparkJet.
A series of experiments were performed to measure the efficiency of the SparkJet serial array. The efficiency is defined as
where
where C is the capacitance of the capacitor, U is the maximum voltage across the actuator array when a pulse arc discharge occurs, i is the current and R is the resistance of the wire. The average value of three tests is .
Figure 8 shows an example of the velocities of the jet front and shock for the first SparkJet of a three SparkJet array. The velocities of the second and third SparkJets are similar. The initial velocity is nearly 350 m/s (i.e., ) but rapidly decreases with time. The precursor shock wave velocity is initially slightly supersonic, but rapidly decreases to an acoustic disturbance. Additional experiments examined the effects of actuator spacing.
Figure 8.
Velocities of jet front and shock.
Zhou et al. [50] investigated the effect of a single three-electrode SparkJet discharge on the interaction of a hypersonic laminar boundary with a compression corner at Mach 5. The experimental configuration is shown in Figure 9. Experiments were performed for different air supply pressures to the SparkJet cavity. The capacitor voltage U at discharge (and thus energy deposition) increases with increasing air supply pressure. Schlieren images at selected times are presented in Figure 7 of Zhou et al. [50] for different air supply pressures and orifice inclination angles and indicate a significant effect of the SparkJet discharge on the flowfield structure. Additional references from these authors are Zhou et al. [51], Zou et al. [52], and Zou et al. [53].
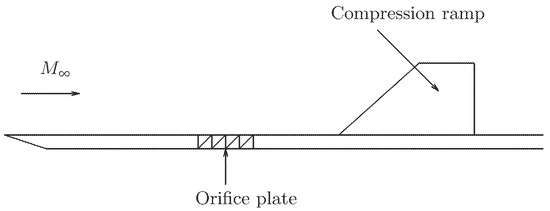
Figure 9.
Model configuration.
2.4. Zhang et al. (2017–2020)
Zhang et al. [54] examined experimentally a multichannel discharge SparkJet. They studied two types of multichannel SparkJet, namely, multi-electrode SparkJet containing 11 electrodes and multi SparkJet array of 12 two-electrode SparkJets. Both of the multichannel SparkJets are using one single power supply. The schematic of the circuit is illustrated in Figure 10. Figure 11 shows the 11-electrode SparkJet.
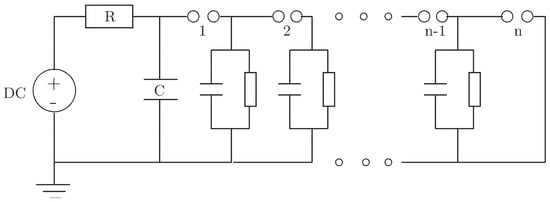
Figure 10.
Schematic of the multichannel SparkJet circuit.
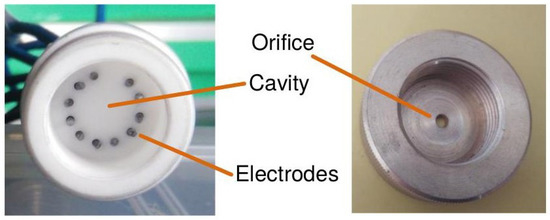
Figure 11.
11-electrode SparkJet. Reprint from [54] with permission from Elsevier.
The efficiency of the 11-electrode SparkJet is 77% which is three times higher than a 2-electrode SparkJet (efficiency of 25%). Figure 12 presents the schlieren images of variable electrode SparkJets. Note that the numbers 1 to 10 represents 2 to 11-electrode SparkJets, respectively. Additionally, the jet presented in the figure shows an increase in the jet front velocity by increasing the number of electrodes. For example, the 11-electrode SparkJet jet front velocity is 50% higher than a 2-electrode SparkJet.
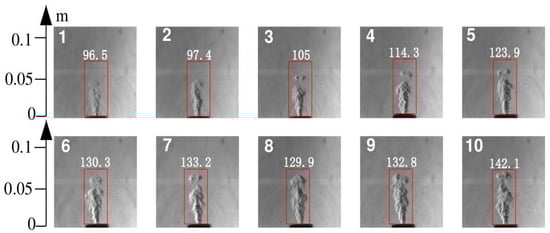
Figure 12.
Schlieren images of several multichannel SparkJet. Reprint from [54] with permission from Elsevier.
Figure 13 displays the side-by-side comparison of a 12-SparkJet array and a single SparkJet. The affected area using a 12-SparkJet array is about 6 times the affected area of a single SparkJet. The jet front velocity of each SparkJet in the 12-SparkJet array is presented in Figure 14. The SparkJet numbering is from the left to the right of Figure 13. The average jet front velocity for the 12-SparkJet array is about 100 m/s which is 64% of the single SparkJet (157 m/s).
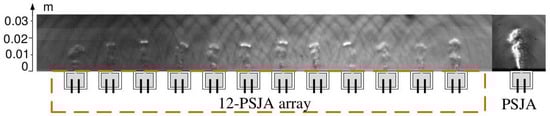
Figure 13.
Schlieren images of 12-SparkJet array and single SparkJet. Reprint from [54] with permission from Elsevier.
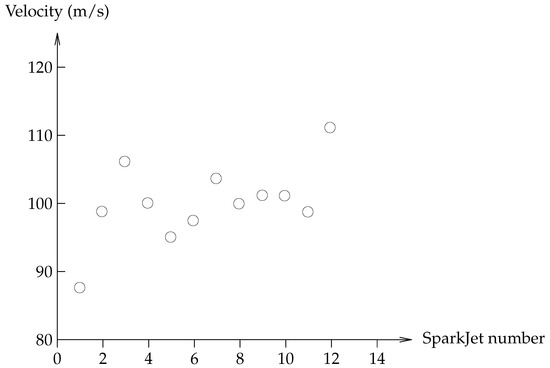
Figure 14.
Jet front velocity of each SparkJet in the 12-SparkJet array.
Zhang et al. [55] performed an experimental examination of the 10-SparkJet array on the interaction of the supersonic turbulent boundary layer with a 20 compression corner at Mach 2. The SparkJet array is placed in the streamwise direction and connected to a single power supply. The experimental configuration is shown in Figure 15. As seen in Figure 16 and Figure 17, the 10-SparkJet array has a significant effect on the flowfield structure. The effective controlling time for the SparkJet array was about two times the jet ejection time for a single actuator.
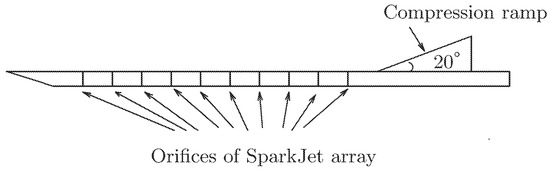
Figure 15.
Model configuration.
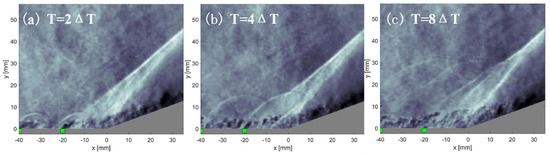
Figure 16.
Interaction of the SparkJet induced shock with the separation shock. Reprint from [55] with permission from Elsevier.
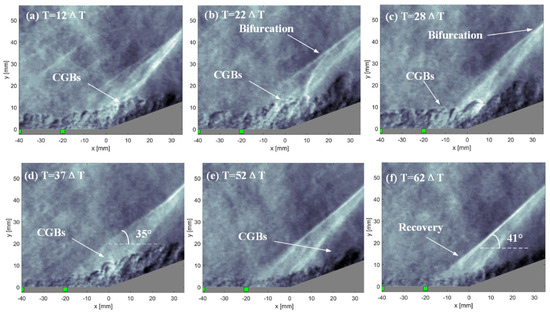
Figure 17.
Interaction of the heated region with the separation shock. Reprint from [55] with permission from Elsevier.
2.5. Kyu Hong Kim et al. (2018–2019)
Kim et al. [56], Kim et al. [57] and Shin et al. [58] conducted a series of computational investigations of the SparkJet. Kim et al. [56] performed unsteady three-dimensional compressible Navier–Stokes simulations of a SparkJet model shown in Figure 18. Thermodynamic properties were obtained assuming chemical equilibrium [59]. The dimensions are listed in Table 4. Figure 19 shows the jet front position versus time. Comparison with the experimental data of Laurendeau et al. [37] is excellent. Additional analysis of the wave structure within the cavity is presented.
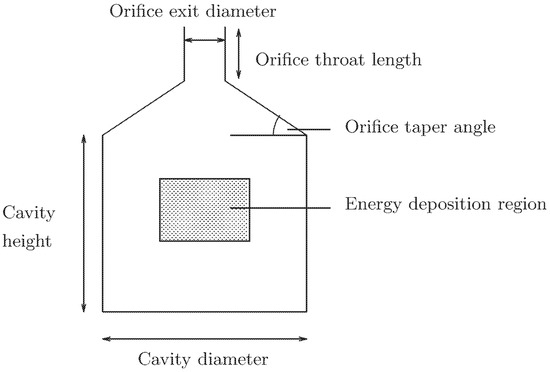
Figure 18.
SparkJet model.
Table 4.
SparkJet Model Characteristics.
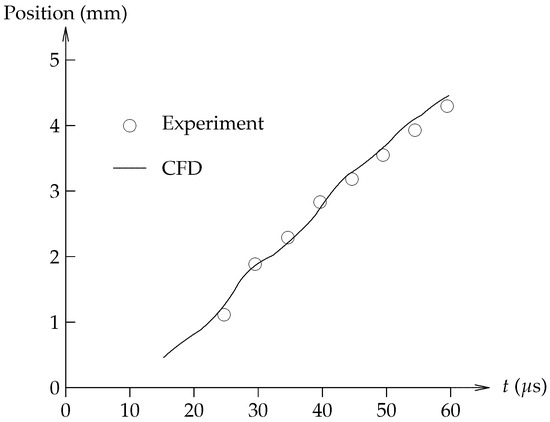
Figure 19.
Jet position versus time.
Kim et al. [57] performed unsteady three-dimensional compressible Navier–Stokes simulations of the same configuration as Kim et al. [56] using both perfect gas and equilibrium thermochemistry. Results are shown in Figure 20 and indicate that the equilibrium thermochemistry model provides better agreement with experiment of Laurendeau et al. [37].
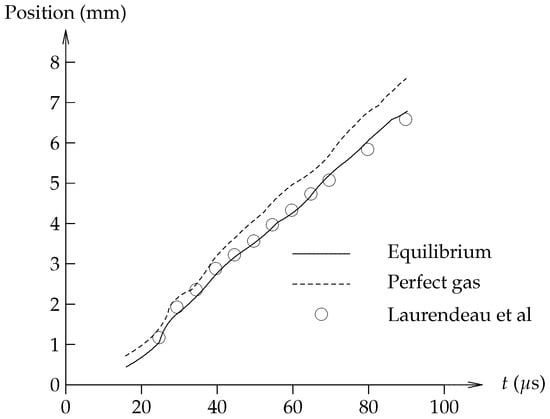
Figure 20.
Jet position versus time.
Shin et al. [58] performed a computational parametric study of the effect of location of the electrodes on the impulse generated by a SparkJet. The SparkJet configuration is indicated in Table 4. Electrode heights of 1 mm to 3 mm (measured from the bottom of the cavity) were considered. The computed impulse and jet ejection duration for each case is shown in Table 5. The largest impulse is achieved for the lowest position of the electrodes which allows the largest initial increase in the pressure within the cavity. An analytic model is presented for calculation of the initial blast wave within the cavity and its reflection.
Table 5.
Effect of Electrode Location.
2.6. Zong et al. (2018–2022)
Zong and Kotsonis [60] performed a series of five experiments for a single SparkJet configuration. The model is shown in Figure 21 and the electronic circuitry in Figure 22. Details of the experiment are listed in Table 6 where the dimensionless energy deposition is defined as the ratio of the discharged capacitor energy to the initial static enthalpy in the SparkJet cavity (note the error in Equation (2.1) in Zong and Kotsonis [60]).
where and are the capacitance and initial capacitor voltage; and are the initial density and temperature of the gas in the SparkJet cavity, and is the cavity volume. Additionally, is the discharge frequency and is the Helmholtz frequency of the SparkJet cavity [61].
where is the initial speed of sound in the cavity, is the cavity exit area and is the throat length. The experimental diagnostic is phase-locked Particle Image Velocimetry (PIV).
Figure 21.
Model.
Figure 22.
Electronic circuit.
Table 6.
Experiments.
Figure 23 shows the jet exit velocity versus time for Cases 1 to 3 corresponding to J to J at Hz. The peak exit velocity increases with increasing at fixed . Zong and Kotsonis conclude
Figure 23.
Jet exit velocity versus time at fixed .
Figure 24 displays the jet exit velocity versus time for Cases 2, 4 and 5 corresponding to J and Hz to 200 Hz. The peak exit velocity is invariant with for fixed implying that the cavity gas has returned to its approximate initial state between discharges. The efficiency is defined as
where is the net jet mechanical energy during a cycle
where . The experiments show an efficiency on the order of 0.01%.
Figure 24.
Jet exit velocity versus time at fixed .
Zong [62] conducted experiments on two different SparkJet models shown in Figure 25 and Figure 26. Details of the two models are shown in Table 7. Experimental diagnostic is Particle Image Velocimetry (PIV).
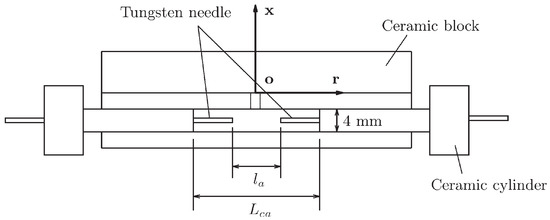
Figure 25.
Small cavity model.
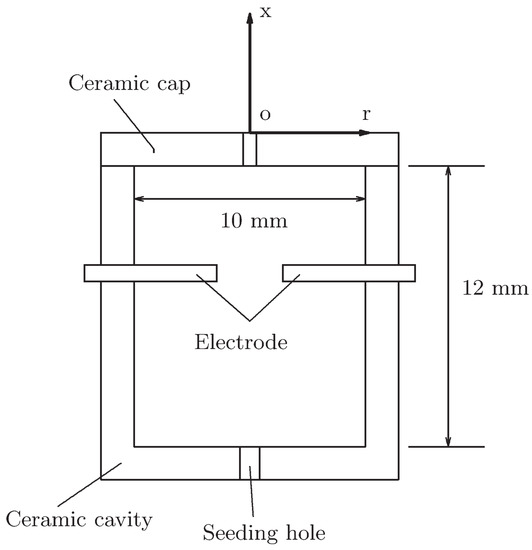
Figure 26.
Large cavity model.
Table 7.
Experiments.
Figure 27 presents the spatially averaged exit velocity versus time for the large cavity model for different values of the electrode spacing from 2 mm to 8 mm. The peak exit velocity increases with electrode spacing due to the greater volume of heated gas by the electrical discharge.
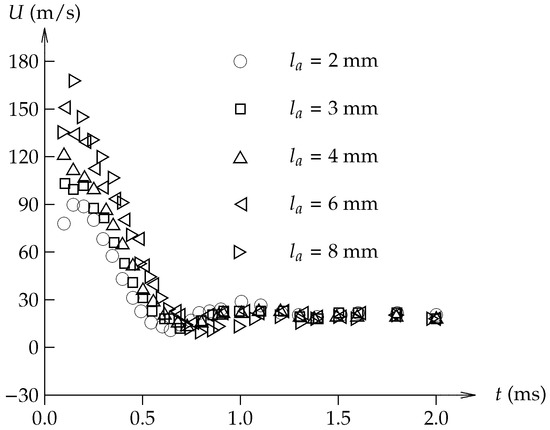
Figure 27.
Jet exit velocity versus time.
Figure 28 shows the efficiency defined by Equation (8) for the small and large cavity models versus the dimensionless heating volume defined as
where is the separation distance between electrodes, is the mean arc diameter, and and are the length and diameter of the cavity, respectively. The experiments indicate a monotonic increase in efficiency with dimensionless heating volume, and an approximately order of magnitude difference in efficiency between the small and large cavity models.
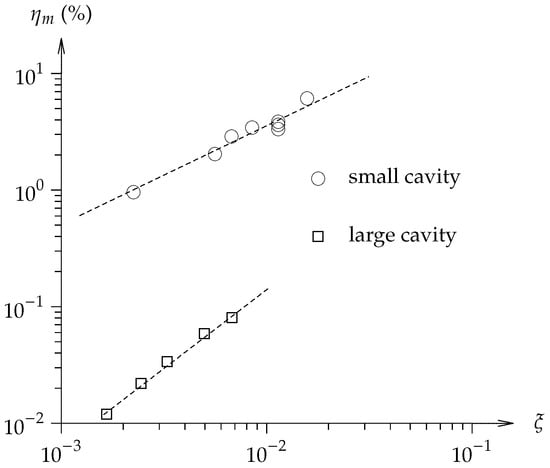
Figure 28.
Efficiency versus dimensionless heating volume.
Zong et al. [63] review developments of SparkJet research during the previous fifteen years including experimental and numerical investigations for both SparkJet performance in quiescent and applications to flow control. Discussion includes power supply systems, actuator construction, structure of the jet and vortex formed by the SparkJet and effect of the electrical parameters on the performance.
Figure 29 shows the peak jet velocity versus the dimensionless energy deposition defined as
where and are the voltage and current across the electrode, is the time interval of the discharge, is the volume of the cavity, and , and are the specific heat at constant volume, density and temperature of the air in the cavity. Results are shown from studies by Belinger et al. [64], Reedy et al. [65], Wang et al. [66], Zong et al. [39] and Zong and Kotsonis [60]. Peak values up to 300 m/s are observed.
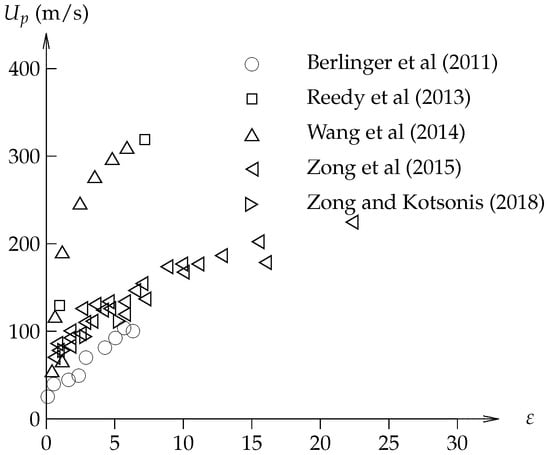
Figure 29.
Peak jet velocity versus dimensionless energy deposition [39,60,64,65,66].
Figure 30 displays the relative peak jet velocity versus relative dimensionless energy deposition where and correspond to the peak jet velocity at the lowest dimensionless energy value and the lowest dimensionless energy. Zong and Kotsonis [60] proposed (Equation (7)) which implies
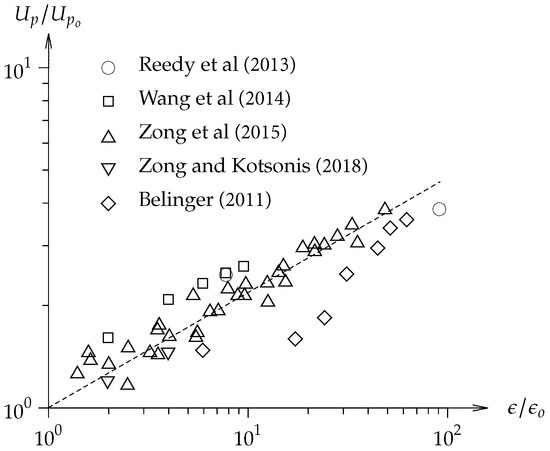
Figure 30.
Relative peak jet velocity versus relative dimensionless energy deposition [39,60,64,65,66].
The experimental data generally follow this trend.
2.7. Xie et al. (2022)
Xie et al. [67] performed experimental and numerical simulations for opposing SparkJets to examine the use of opposing SparkJet for drag reduction at Mach 3. They placed a SparkJet with 1.08 J discharge energy at the nose of a 50 m diameter hemisphere. The comparison of their simulation was in good agreement with the experimental data as shown in Figure 31. The variation of the drag in response to the opposing SparkJet is presented in Figure 32. Moreover, they numerically studied the effects of SparkJet exit diameter, discharge energy, freestream Mach number, freestream static pressure, and angle of attack on drag reduction. They find out that there is an optimal value for exit diameter and discharge energy. The average drag reduction decreases with increasing Mach number, the static pressure of the freestream flow, and the angle of attack. Additionally, they find out that in general, the cases that show the existence of a large penetration mode at some duration of the simulation have better performance in drag reduction in comparison with the cases that only create a short penetration mode.
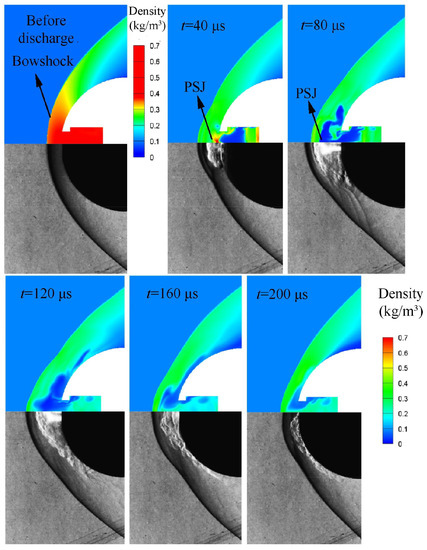
Figure 31.
Comparison of the experimental and numerical results. Adapted from [67].
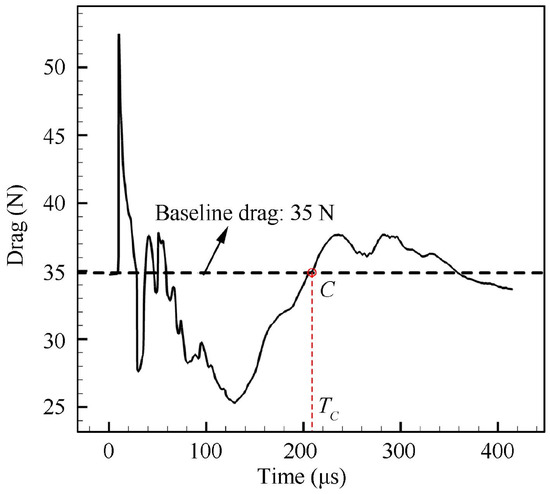
Figure 32.
Change in drag in response to the opposing SparkJet. Adapted from [67].
Xie et al. [68] also examined the effect of the SparkJet exit shape, i.e., Laval shape versus straight shape, on the drag reduction of a hemisphere at Mach 3. They validate their simulations with the experimental schlieren imaging of the Laval-shaped SparkJet in quiescent air. The design of the SparkJet is displayed in Figure 33. As shown in Figure 6 of Xie et al. [68], the comparison of the experiment and numerical simulation is reasonable. The variation of the maximum exit Mach number with the dimensionless energy is presented in Figure 34, where is the input electrical energy and and and are the cavity density and temperature, respectively. The improvement of the Laval-shaped SparkJet maximum exit Mach number becomes evident for which is the critical value that changes the flow in the diverging section of the exit to supersonic flow.
Figure 33.
Schematic of the SparkJet and the Laval-shape exit.
Figure 34.
Variation of maximum exit Mach number with dimensionless energy of the SparkJet.
Figure 15 and Figure 16 of Xie et al. [68] compare the variation of the drag vs. time for Laval-shaped and straight exit SparkJets represent respectively for and . Since for in the Laval-shaped exit the exit flow is subsonic, there is no improvement in drag reduction using the Laval-shaped exit at . However, since the exit flow for is supersonic, the Laval-shaped exit makes a significant improvement. Figure 35 shows the average drag reduction vs. for both types of SparkJets. Again, the main difference appears for . Additionally, an optimal value of exists which is because of the increase in the drag rise in the initial stage of the discharge due to the stronger shock in the discharge cavity.
Figure 35.
Average drag reduction vs. dimensionless energy.
Xie et al. [69] examined experimentally the application of the SparkJet for shock control in hypersonic flow at Mach 6.9 with total enthalpy of about 5 MJ. They pressurized the SparkJet chamber to improve the controlling effect of the SparkJet. Figure 36 presents the jet front velocity of the pressurized SparkJet which shows a significant increase in comparison with the unpressurized SparkJet (about 500 m/s). Figure 37 displays the effect of a SparkJet with a pressurized cavity of 133 kPa and discharge energy of 13.5 J on the oblique shock of a 50 ramp showing a significant change in the flow structure. They showed that the SparkJet will have a better shock controlling effect by increasing the discharge energy (or in other words increasing the pressure in the SparkJet chamber) or increasing the distance between the SparkJet and the ramp, and by decreasing the ramp angle. They also investigate the effect of a pressurized SparkJet on a shock-shock interaction over a double ramp. A significant change in flow structure is achieved as displayed in Figure 38.
Figure 36.
Variation of jet front velocity by time.
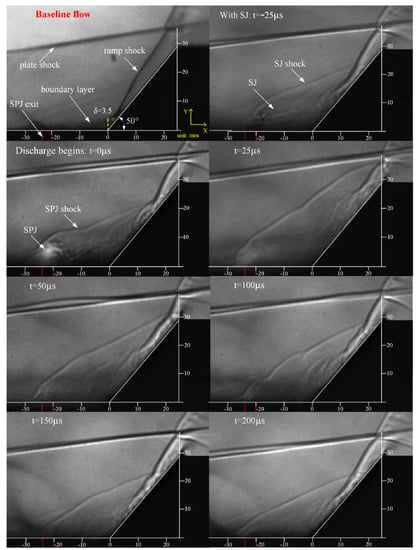
Figure 37.
Change in flow structure over a ramp due to a pressurized SparkJet. Reprint from [69] with permission from Elsevier.
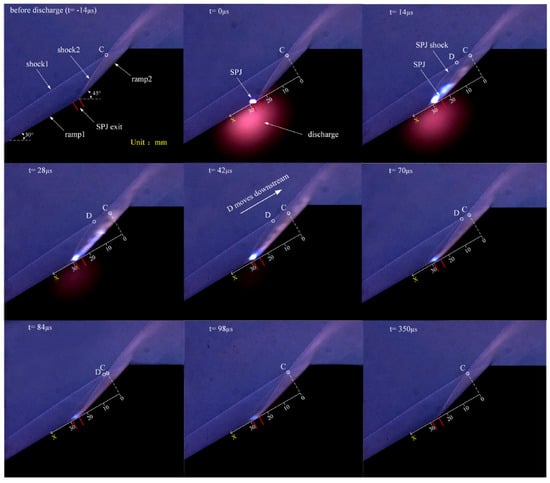
Figure 38.
Change in flow structure of shock-shock interaction over a double ramp due to a SparkJet. Reprint from [69] with permission from Elsevier.
3. Drag Reduction
3.1. Background
An early area of research interest in energy deposition was aerodynamic drag reduction in supersonic and hypersonic flows. Georgievskii and Levin [70] considered the effect of a steady energy deposition upstream of a body of revolution in supersonic flow at zero angle of attack assuming a Gaussian energy. A reduction in drag (i.e., integrated frontal surface pressure) was observed for sufficiently high levels of energy deposition. Toro et al. [71] performed a series of experiments for a “Directed Air Energy Spike” based on the concepts of Myrabo and Raizer [72] and achieved a reduction in frontal drag. Tretyakov et al. [73] (also see Tretyakov et al. [74]) measured the drag on a cone-cylinder and hemisphere-cylinder at Mach 2 in Argon with a high frequency CO2 laser discharge upstream of the body and observed drag reduction up to 45%. Kolesnichenko et al. [75,76,77,78,79,80,81] observed drag reduction due to a microwave filament discharge on blunt bodies at Mach 1.7 to 2.1 in air, argon, carbon dioxide and nitrogen. See also the reviews by Knight [82]. Recent research in energy deposition for drag reduction is discussed below.
3.2. Dobrov et al. (2018)
Dobrov et al. [83] conducted an experimental and numerical investigation of the interaction of a heated microwave filament with a blunt cylinder at Mach 1.6. The cylinder diameter is 12 mm. The cylinder axis length is 20 mm and is aligned with the freestream. A microwave discharge generated a heated filament in the shape of an ellipsoid of revolution upstream of the cylinder with a major axis of 15 mm aligned with the freestream. The flow conditions are listed in Table 8. A gradient heat flux sensor was attached to the flat face of the cylinder.
Table 8.
Flow Conditions.
The interaction of the heated filament with the blunt body shock generated by the cylinder caused a momentary lensing forward of the shock as seen in previous experiments [82]. Figure 39 shows the upper and lower bounds of experimental heat flux variation at the stagnation point on the cylinder face versus time. The interaction of the heated region causes an initial reduction in surface heat flux followed by an overshoot and return to the undisturbed level.
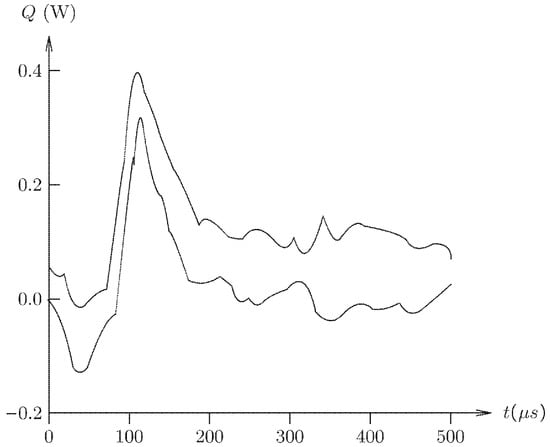
Figure 39.
Upper and lower limits of stagnation point heat flux Q versus time.
3.3. Yu et al. (2018)
Yu et al. [84] performed a two-dimensional numerical investigation of the interaction of pulsed energy deposition on the pressure drag of a cylinder with diameter D at Mach 8. The cylinder axis is perpendicular to the freestream flow and the pulsed instantaneous energy deposition was modeled as an increase in pressure and temperature within a circular region upstream of the cylinder at a distance D on the symmetry plane. The dimensionless energy deposition was defined as
where is the instantaneous temperature increase in the circular region representing the discharge and V is the volume per unit depth of the discharge. Thus represents the ratio of energy added per unit depth at constant volume to the static enthalpy per unit depth of the undisturbed freestream flow. The flow conditions are shown in Table 9.
Table 9.
Flow Conditions.
The reduced (dimensionless) frequency of energy deposition is
where f is the frequency of the energy deposition where kHz, 20 kHz and 100 kHz. The reduced frequency is the ratio of the flow convective timescale (corresponding to the time for the flow to travel a distance D [equal to the distance from the laser discharge to the cylinder]) to the period of the energy discharge. Figure 40 displays the relative wave drag coefficient versus the reduced frequency where is the wave drag coefficient in the absence of energy deposition. The results indicate a nearly linear decrease in wave drag with increase in reduced frequency.
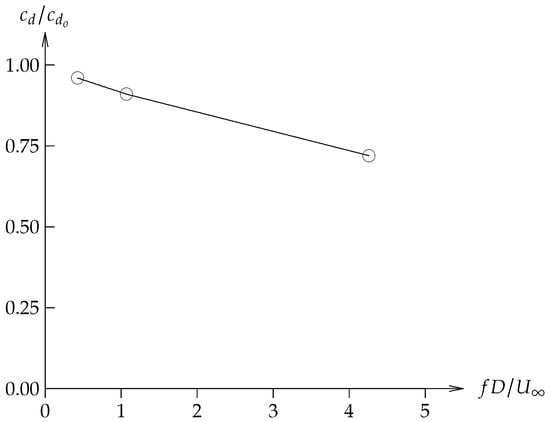
Figure 40.
Wave drag versus dimensionless.
3.4. Alberti et al. (2019–2021)
Alberti et al. [85,86] conducted a numerical investigation of the interaction of a laser discharge with hemisphere and double cone configurations. The simulations incorporate a self-consistent, physical-based laser induced breakdown model incorporating non-equilibrium thermochemical and thermodynamic effects and radiation [87,88,89]. The compressible unsteady laminar Navier–Stokes equations are solved assuming a two temperature model with a thermochemistry model incorporating nineteen species. The radiation field is modeled using the radiative transfer equation [90].
The experiment of Adelgren et al. [91] was simulated. A laser spark was discharged upstream of a hemisphere. The experimental configuration is shown in Figure 41. The freestream conditions and laser discharge parameters are listed in Table 10. The laser energy discharged at the laser head mJ. The calculated laser energy absorbed by the gas mJ [86] representing 14.41% of the laser discharge energy. The difference is due to absorption in the tunnel glass walls and radiation from the discharge focal region. An additional simulation was performed using mJ with a resultant mJ corresponding to 8.06% of the discharge energy. The discharge was focused on the axis of the sphere at one diameter upstream (Figure 42).
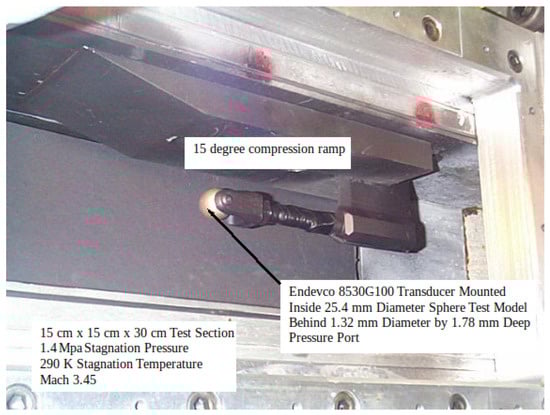
Figure 41.
Experiment. Adapted from [91].
Table 10.
Flow Conditions.
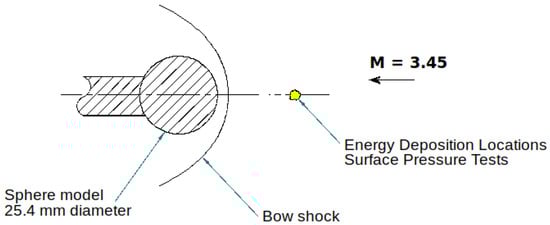
Figure 42.
Laser discharge. Adapted from [91].
Figure 43 compares the computed and experimental centerline pressure on the sphere. Also shown are the simulations by Kandala and Candler [92] and Zheltovodov et al. [93]. All simulations show differences compared to the experiment.
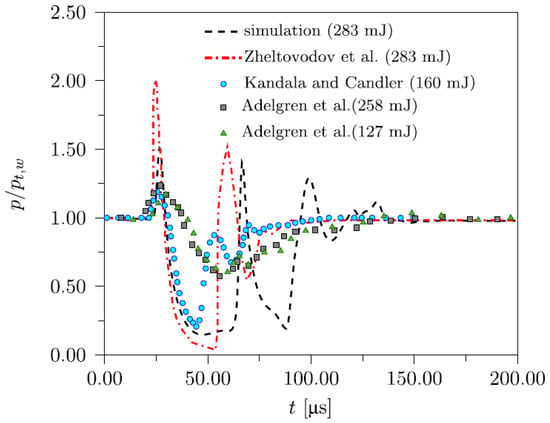
Figure 43.
Centerline pressure versus time. Adapted from [86].
3.5. Azarova et al. (2019)
Azarova et al. [94] performed a computational investigation of the interaction of a continuous heated filament with a simple two-dimensional body at Mach 2.5. The flow configuration is described in Figure 44a which shows the instantaneous density contours corresponding to the approach of the off-axis heated filament to the wedge shaped body. The governing equations are the unsteady laminar compressible Navier–Stokes equations for a perfect gas. The flow conditions are listed in Table 11 where is the ratio of specific heats, is the molecular Prandtl number, d is the height of the filament, D is height of the wedge body and is the ratio of the density in the filament to the freestream density. The velocity and pressure in the filament upstream of the blunt body shock are equal to the ambient velocity and pressure.
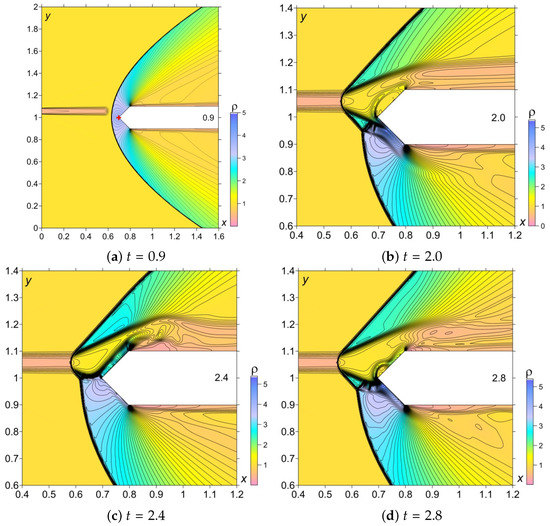
Figure 44.
Density contours showing oscillatory behavior. Adapted from [94].
Table 11.
Flow Conditions.
Figure 44 displays instantaneous density contours for at four different dimensionless times. The interaction of the heated filament with the blunt body shock causes a lensing forward (upstream) of the shock system and the formation of a shear layer and triple point. A self-sustained oscillation forms resulting in a periodic behavior of the stagnation pressure at the apex of the wedge (Figure 45a). Simulations based upon the Euler equations show significantly lower level of oscillations compared to the Navier–Stokes results. The resultant total lift force for shows oscillatory behavior (Figure 45b). The oscillations decay for , and no oscillatory behavior is observed for (Figure 45b).
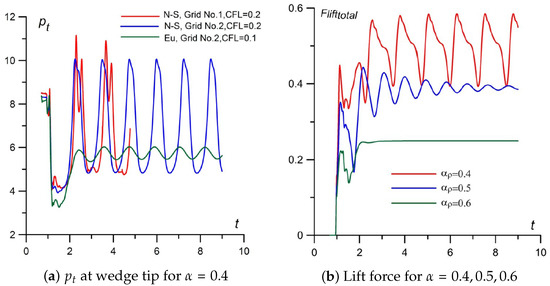
Figure 45.
Stagnation pressure at wedge tip and lift force versus time. Adapted from [94].
3.6. Das et al. (2019)
Das et al. [95] conducted a numerical study of the interaction of a continuous energy deposition source of strength Q with a sphere of diameter D at Mach 8 for both earth and Mars atmospheres. The flow configuration is shown in Figure 46 and the conditions are listed in Table 12. The simulations are based on the axisymmetric compressible Euler equations incorporating non-equilibrium thermochemistry with a five species model for the Earth atmosphere (78% N, 22% O) and eight species model for the Mars atmosphere (97% CO, 3% N).
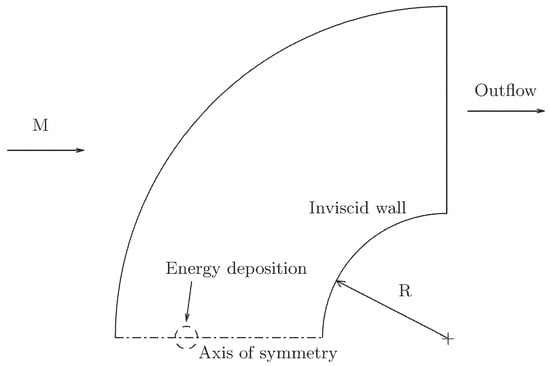
Figure 46.
Flow configuration.
Table 12.
Flow Conditions.
Figure 47a,b show the power effectiveness P for the earth and Mars atmospheres, respectively, versus the energy power Q where
where and D are the pressure drag in the absence and presence, respectively, of energy deposition. There is an optimal power Q for drag reduction which is less than the maximum power examined, and a significant difference in the peak power effectiveness between the earth and Mars simulations. The observed difference is attributed to the difference in the ratios of specific heats for the earth and Mars atmospheres. Figure 48a displays Mach contours for the Mars simulation at W and W. The effect of energy deposition is the formation of a recirculation region in front of the sphere and the movement of the stagnation line upwards on the sphere surface. Figure 48b shows the surface pressure distribution for the earth and Mars simulations at W. The location of peak surface pressure is at a higher angle for the earth simulation, resulting in a lower drag and higher power effectiveness.
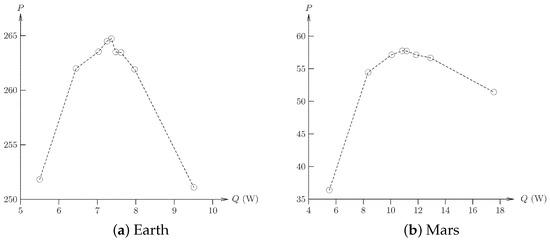
Figure 47.
Efficiency of energy deposition.
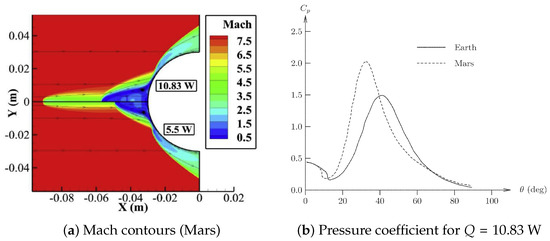
Figure 48.
Mach contours and pressure coefficient. Reprint from [95] with permission from Elsevier.
3.7. Elias et al. (2018)
Elias et al. [96] conducted a computational and experimental investigation of the interaction of a heated filament generated by a femtosecond laser discharge with a blunt hemisphere-cylinder model ( mm) at Mach 3. The experiments were performed in the ONERA R1Ch blow-down wind tunnel. The axisymmetric simulations were conducted using the CEDRE code [97]. The experimental configuration is shown in Figure 49. A femtosecond laser discharge is focused on axis using a mirror and transparent diaphragm at the blunt nose of the hemisphere-cylinder. The flow conditions and laser properties are listed in Table 13 and Table 14.
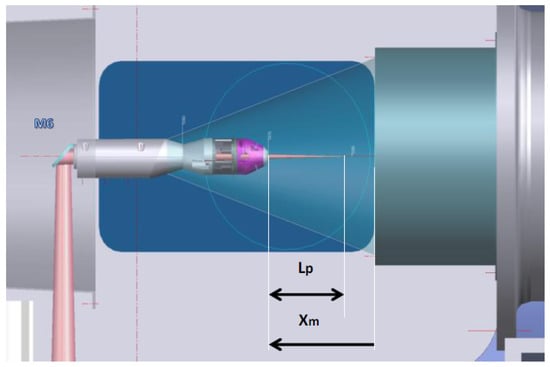
Figure 49.
Flow configuration. Reprint from [96] with permission from ONERA.
Table 13.
Flow Conditions.
Table 14.
Laser Properties.
Figure 50 displays the measured drag force versus time for a single femtosecond laser discharge. The energy deposition creates a heated filament with a maximum diameter of 5 mm. The filament convects with the flow and interacts with the blunt body shock generated by the blunt hemisphere-cylinder. The initial rise in the drag force is due to the impact of the blast wave, while the subsequent interaction of the heated filament creates an oscillation in the measured drag. Figure 51a,b show the experimental and simulated schlieren images at three instants of time illustrating the interaction of the heated filament with the blunt hemisphere-cylinder. The flow structures are in close agreement.
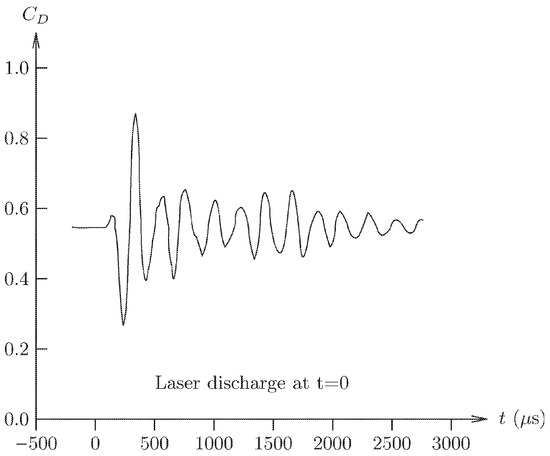
Figure 50.
Drag versus time.
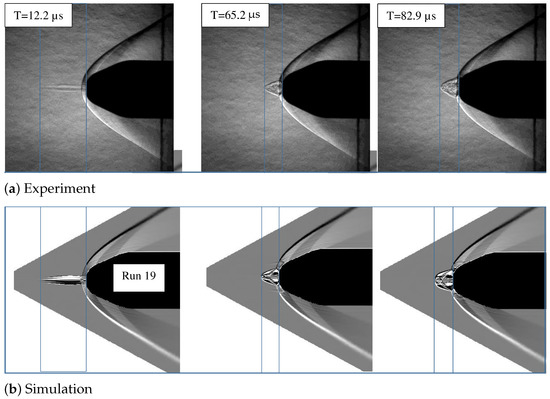
Figure 51.
Comparison of experiment and simulation. Reprint from [96] with permission from ONERA.
4. Energy Deposition for Flow Control
4.1. Background
The application of energy deposition for flow control (other than drag reduction) attracted interest subsequent to the early work cited in Section 3.1. Following previous research efforts involving both passive and active flow control devices (Section 1), interest focused on a variety of topics in flow control including, for example, shock waves position [98,99,100,101] and boundary layer separation control [28,29,102,103]. See also Starikovskiy and Aleksandrov [104]. Examples of recent research are described below.
4.2. Takahashi and Ohnishiy (2018)
Takahashi and Ohnishiy [105] conducted a computational study of the effect of repetitive laser energy pulses on separation control for a diamond airfoil at Mach 1.17. The airfoil chord is 400 mm and the thickness to chord ratio is 0.1. The two-dimensional simulations were performed using the compressible Navier–Stokes equations for a perfect gas. The angle of attack is to cause separation on the upper surface near the trailing edge due to the recompression shock wave. Pulsed laser energy deposition was focused on the lower surface of the wing near the trailing edge. The flow conditions and laser properties are listed in Table 15 and Table 16.
Table 15.
Flow Conditions.
Table 16.
Laser Parameters.
Figure 3a,b of Takahashi and Ohnishiy [105] display Mach number contours for the no energy deposition case and an instantaneous image for energy deposition under the trailing edge of the wing. The combined effect of the initial blast wave (increasing the pressure momentarily on the lower surface) and subsequent expansion (reducing the pressure momentarily on the upper surface) reduces the separation bubble on the upper surface and increased the lift-to-drag ratio from 4.16 to 4.26.
4.3. Ukai et al. (2018)
Ukai et al. [106] investigated the effect of a laser discharge on the flowfield structure of a laminar boundary layer on a flat plate at Mach 5. The flow conditions are shown in Table 17. A Nd:YAG laser was focused on the surface of a flat plate at distances from 10 mm to 40 mm from the leading edge. The laser parameters are listed in Table 18.
Table 17.
Flow Conditions.
Table 18.
Laser Parameters.
Figure 52 shows a sequence of schematic schlieren images describing the effect of the laser discharge on the flowfield structure for Case 2 at m. Figure 52a shows the moment of laser discharge. The sphere spot indicates the location of the discharge at the surface and beneath the leading edge shock wave (LSW) induced by the boundary layer displacement thickness. Figure 52b shows the formation of the laser-induced blast wave (LIBW) characteristic of laser discharge [5]. A separate laser-induced oblique shock wave (LIOSW) forms on the upstream side of the blast wave due to the interaction of the blast wave with the laminar boundary layer. The boundary layer thickness at this location (in the absence of the laser discharge) is approximately 0.8 mm. The shock wave boundary layer interaction results in the formation of a triple point and a slip line. Subsequently, the blast wave moves outwards and interacts with the weak leading edge shock wave.
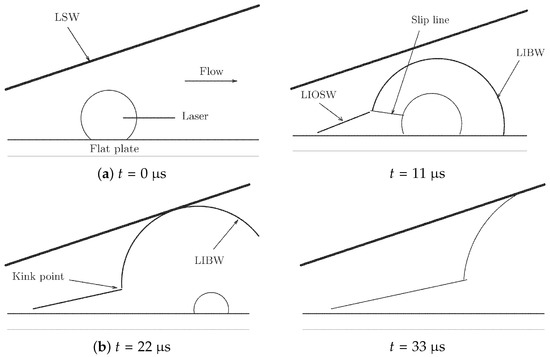
Figure 52.
Schematic of schlieren images of laser discharge.
4.4. Feng et al. (2022)
Feng et al. [107] conducted a combined computational and experimental investigation of the interaction of a distributed arc discharge array with a shock wave turbulent boundary layer at Mach 2.5. The configuration, shown in Figure 53, is mounted flush with the tunnel test section wall. An incident shock wave is generated by a wedge mounted on the opposite side of the wind tunnel (Figure 54). The flow conditions are shown in Table 19. Experiments were performed for three different shock strengths. The capacitor discharge energy mJ for each experiment, and the estimated energy deposition into the air was 60 mJ based upon an assumed efficiency of 30% [108].
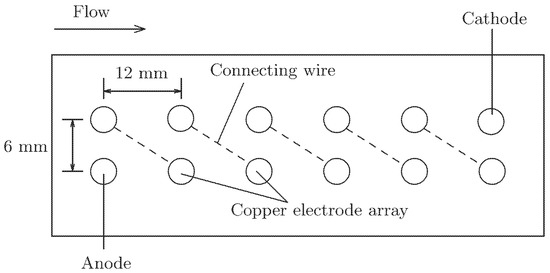
Figure 53.
Surface Arc Plasma Actuator.
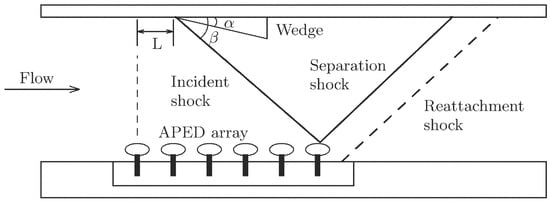
Figure 54.
Flow configuration.
Table 19.
Flow Conditions.
Figure 55 displays schlieren images of the initial discharge () and later interaction (, where is the temporal resolution equal to 33.3 s) of the plasma with the shock wave turbulent boundary layer interaction. The influence of the heated regions is seen in the momentary virtual disappearance of the forward shock wave. Direct Numerical Simulation shows qualitatively similar results.
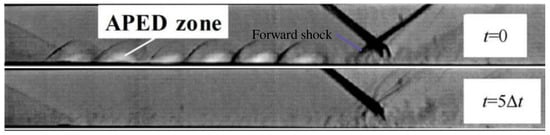
Figure 55.
Interaction of arc plasma discharge with shock wave turbulent boundary layer. Reprint from [107] with the permission of AIP Publishing.
4.5. Gan and Wang (2022)
Gan and Wang [109] examined the effect of a Surface Arc Plasma Actuator (SAPA) on the shock wave boundary layer interaction generated by a ramp at Mach 2. The flow conditions are listed in Table 20 and the experimental configuration in Figure 56. Details of the power supply are indicated in Table 21.
Table 20.
Flow Conditions.
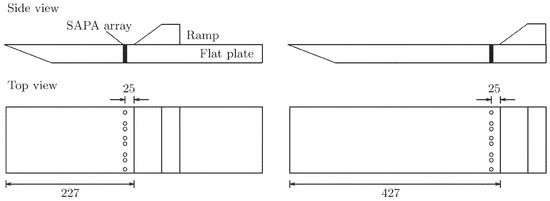
Figure 56.
Flow configuration.
Table 21.
Power Supply Parameters.
Figure 57 displays schlieren images of the interaction of the SAPA with the shock wave boundary layer interaction generated by the ramp. The initial discharge (Figure 57a) forms a blast wave and a heated region ejected into the incoming boundary layer. The interaction of the blast wave with the ramp shock forms a triple point (Figure 57b). The ramp shock is momentarily moved upstream by the interaction (Figure 57c) before relaxing to its original position (Figure 57d).
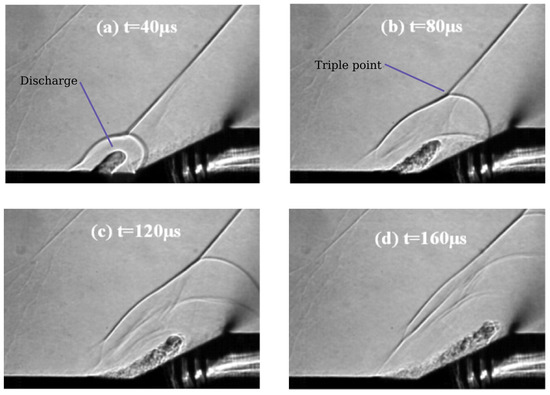
Figure 57.
Interaction of energy deposition with shock. Reprint from [109] with permission from Elsevier.
4.6. Ma et al. (2022)
Ma et al. [110] performed a numerical simulation of the interaction of a pulsed arc discharge with the shock wave boundary layer interaction generated by a half cylinder attached to a flat plate at Mach 2.5. The configuration corresponds to the experiment of Feng et al. [111]. The flow conditions are listed in Table 22 and the configuration is shown in Figure 58. The simulations are based on the compressible Reynolds-Averaged Navier–Stokes equations for a thermally perfect gas with the SST turbulence model. The energy deposition is modeled by a periodic energy source term with a volume estimated from the experiments of Feng et al. [111]. Energy deposition at reduced frequencies and are examined where , f is the frequency, is the streamwise spacing between energy deposition regions and is the freestream velocity.
Table 22.
Flow Conditions.
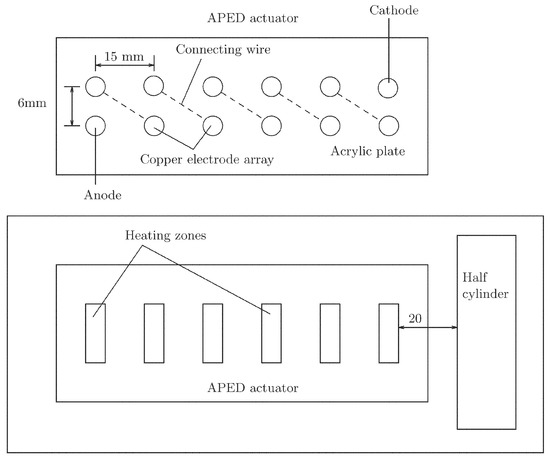
Figure 58.
Flow configuration.
Figure 59 displays instantaneous contours of the magnitude of the density gradient for . The heated regions generated by the energy deposition (CGB or Controlling Gas Bubbles according to Ma et al. [110]) are apparent near the surface. The separation region in front of the half cylinder is increased compared to the no energy deposition configuration, with a maximum reduced of 25.5% in drag coefficient achieved.
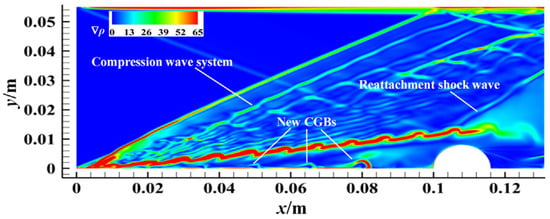
Figure 59.
Instantaneous density contours for . Reprint from [110] with the permission of AIP Publishing.
5. Conclusions
Energy deposition for aerospace applications including drag reduction and flow control is certainly appealing for many researchers, as evidenced by the amount of available literature. However, the question is the feasibility of using energy deposition for any of the assumed applications. Despite being proven in the literature that using energy deposition can reduce the drag of a body, due to the amount of energy that is required and the complexity of implementing the required technology for this purpose the practicality of this method is unproven. On the other hand, energy deposition for flow control has not matured yet. It is well known that the interaction of the blast wave and heated region resulting from energy deposition will change the flow structure. However, how we can use this change for practical applications should be the topic of future research in this field. Some example questions are as follows: Is it possible to use this method to solve the startup problem of ramjets and scramjets? Is it simpler to have a pulse of energy deposition at the entrance of an inlet to start an unstarted supersonic engine rather than a complex mechanical mechanism to change the area distribution? Can energy deposition be effective in modifying the flight trajectory of supersonic and hypersonic aircraft?
Author Contributions
All authors equally contributed to this paper. All authors equally searched the literature to find the proper papers. All authors equally worked on the figure creation and figure permissions. All authors worked equally in writing and revision of the paper. All authors have read and agreed to the published version of the manuscript.
Funding
This research received no external funding.
Data Availability Statement
This is a review paper and therefore, no new data were created.
Conflicts of Interest
The authors declare no conflict of interest.
References
- Cattafesta, L.; Sheplak, M. Actuators for Active Flow Control. In Annual Review of Fluid Mechanics; Davis, S., Moin, P., Eds.; Annual Reviews, Inc.: Lafayette, IN, USA, 2011; pp. 247–272. [Google Scholar]
- Glezer, M.; Amitay, M. Synthetic Jets. In Annual Review of Fluid Mechanics; Lumley, J., Davis, S., Moin, P., Eds.; Annual Reviews, Inc.: Lafayette, IN, USA, 2002; pp. 503–529. [Google Scholar]
- Katz, Y.; Nishri, B.; Wygnanski, I. The Delay of Turbulent Boundary Layer Separation by Oscillatory Active Control. Phys. Fluids A 1989, 1, 179–181. [Google Scholar] [CrossRef]
- Corke, T.; Inloe, C.; Wilkinson, S. Dielectric Barrier Discharge Plasma Actuators for Flow Control. In Annual Review of Fluid Mechanics; Davis, S., Moin, P., Eds.; Annual Reviews, Inc.: Lafayette, IN, USA, 2010; pp. 505–529. [Google Scholar]
- Knight, D. Energy Deposition for High Speed Flow Control; Cambridge University Press: Cambridge, UK, 2019. [Google Scholar]
- Walsh, M. Riblets as a Viscous Drag Reduction Technique. AIAA J. 1983, 21, 485–486. [Google Scholar] [CrossRef]
- McCormick, D. Shock-Boundary Layer Interaction Control with Low-Profile Vortex Generators and Passive Cavity. AIAA J. 1993, 31, 91–96. [Google Scholar] [CrossRef]
- Gad-el-Hak, M. Flow Control: Passive, Active and Reactive Flow; Cambridge University Press: Cambridge, UK, 2000. [Google Scholar]
- Chernyi, G.G. Some Recent Results in Aerodynamic Applications of Flows with Localized Energy Addition; AIAA Paper 1999-4819; American Institute of Aeronautics and Astronautics: Norfolk, VA, USA, 1999. [Google Scholar] [CrossRef]
- Bityurin, V. (Ed.) Perspectives of MHD and Plasma Technologies in Aerospace Applications; Russian Academy of Sciences, Institute for High Temperatures: Moscow, Russia, 1999. [Google Scholar]
- Russell, A.; Zare-Behtash, H.; Kontis, K. Joule Heating Flow Control Methods for High-Speed Flows. J. Electrost. 2016, 80, 34–68. [Google Scholar] [CrossRef]
- Knight, D.; Kuchinskiy, V.; Kuranov, A.; Sheikin, E. Aerodynamic Flow Control at High Speed Using Energy Deposition. In Proceedings of the Fourth Workshop on Magneto-Plasma Aerodynamics for Aeropace Applications, Moscow, Russia, 9–11 April 2002. [Google Scholar]
- Zheltovodov, A. Development of the Studies on Energy Deposition for Application to the Problems of Supersonic Aerodynamics; Preprint 10-2002; Institute of Theoretical and Applied Mechanics: Novosibirsk, Russia, 2002; 43p.
- Knight, D.; Kuchinskiy, V.; Kuranov, A.; Sheikin, E. Survey of Aerodynamic Flow Control at High Speed Using Energy Addition; AIAA Paper 2003-0525; American Institute of Aeronautics and Astronautics: Reno, NV, USA, 2003. [Google Scholar] [CrossRef]
- Fomin, V.; Tretyakov, P.; Taran, J.P. Flow Control Using Various Plasma and Aerodynamic Approaches (Short Review). Aerosp. Sci. Technol. 2004, 8, 411–421. [Google Scholar] [CrossRef]
- Bletzinger, P.; Ganguly, B.; Van Wie, D.; Garscadden, A. Plasmas in High Speed Aerodynamics. J. Phys. D Appl. Phys. 2005, 38, R33–R57. [Google Scholar] [CrossRef]
- Zubkov, A.; Garanin, A.; Safronov, V.; Sukhanovskaya, L.; Tretyakov, P. Supersonic Flow Past an Axisymmetric Body with Combustion in Separation Zones at the Body Nose and Base. Thermophys. Aeromech. 2005, 12, 1–12. [Google Scholar]
- Grossman, K.; Cybyk, B.; Rigling, M.; Van Wie, D. SparkJet Actuators for Flow Control; AIAA Paper 2003-0057; American Institute of Aeronautics and Astronautics: Reno, NV, USA, 2003. [Google Scholar]
- Grossman, K.; Cybyk, B.; Rigling, M.; Van Wie, D. Characterization of SparkJet Actuators for Flow Control; AIAA Paper 2004-0089; American Institute of Aeronautics and Astronautics: Reno, NV, USA, 2004. [Google Scholar]
- Cybyk, B.; Grossman, K.; Wilkerson, J.; Chen, J.; Katz, J. Single-Pulse Performance of the SparkJet Flow Control Actuator; AIAA Paper 2005-0401; American Institute of Aeronautics and Astronautics: Reno, NV, USA, 2005. [Google Scholar]
- Cybyk, B.; Simon, D.; Land, H.; Chen, J.; Katz, J. Experimental Characterization of a Supersonic Flow Control Actuator; AIAA Paper 2006-0478; American Institute of Aeronautics and Astronautics: Reno, NV, USA, 2006. [Google Scholar]
- Cybyk, B.; Wilkerson, J.; Simon, D. Enabling High-Fidelity Modeling of a High-Speed Flow Control Actuator Array; AIAA Paper 2006-8034; American Institute of Aeronautics and Astronautics: Canberra, Australia, 2006. [Google Scholar]
- Haack, S.; Land, B.; Cybyk, B.; Ko, H.; Katz, J. Characterization of a High-Speed Flow Control Actuator Using Digital Speckle Tomography and PIV; AIAA Paper 2008-3759; American Institute of Aeronautics and Astronautics: Seattle, WA, USA, 2008. [Google Scholar]
- Haack, S.; Taylor, T.; Emhoff, J.; Cybyk, B. Development of an Analytical SparkJet Model; AIAA Paper 2010-4979; American Institute of Aeronautics and Astronautics: Chicago, IL, USA, 2010. [Google Scholar]
- Haack, S.; Taylor, T.; Cybyk, B.; Foster, C.; Alvi, F. Experimental Estimation of SparkJet Efficiency; AIAA Paper 2011-3997; American Institute of Aeronautics and Astronautics: Honolulu, HI, USA, 2011. [Google Scholar]
- Caruana, D.; Barricau, P.; Hardy, P.; Cambronne, J.; Belinger, A. The ’Plasma Synthetic Jet’ Actuator—Aerothermodynamic Characterization and First Flow Control Applications; AIAA Paper 2009-1307; American Institute of Aeronautics and Astronautics: Orlando, FL, USA, 2009. [Google Scholar]
- Hardy, P.; Barricau, P.; Caruana, D.; Gleyzes, C.; Belinger, A.; Cambronne, J. Plasma Synthetic Jet for Flow Control; AIAA Paper 2010-5103; American Institute of Aeronautics and Astronautics: Chicago, IL, USA, 2010. [Google Scholar] [CrossRef]
- Narayanswamy, V.; Shin, J.; Clemens, N.; Raja, L. Investigation of Plasma-Generated Jets for Supersonic Flow Control; AIAA Paper 2008-0285; American Institute of Aeronautics and Astronautics: Reno, NV, USA, 2008. [Google Scholar]
- Narayanswamy, V.; Shin, J.; Clemens, N.; Raja, L. Investigation of Pulsed-Plasma Jet for Shock/Boundary Layer Control; AIAA Paper 2010-1089; American Institute of Aeronautics and Astronautics: Orlando, FL, USA, 2010. [Google Scholar]
- Narayanswamy, V.; Raja, L.; Clemens, N. Characterization of a High-Frequency Pulsed-Plasma Jet Actuator for Supersonic Flow Control. AIAA J. 2010, 48, 297–305. [Google Scholar] [CrossRef]
- Narayanswamy, V.; Raja, L.; Clemens, N. Control of a Shock/Boundary Layer Interaction by Using a Pulsed Plasma Jet Actuator. AIAA J. 2012, 50, 246–249. [Google Scholar] [CrossRef]
- Anderson, K.; Knight, D. Energy Deposition Induced Synthetic Jet for Flow Control; CCD Report 2011-3; Center for Computational Design, Rutgers University: Piscataway, NJ, USA, 2011; Available online: http://coewww.rutgers.edu/knight (accessed on 20 March 2011).
- Anderson, K.; Knight, D. Pendulum Swing from Pulsed Cavity Jet; CCD Report 2011-6; Center for Computational Design, Rutgers University: Piscataway, NJ, USA, 2011; Available online: http://coewww.rutgers.edu/knight (accessed on 22 June 2011).
- Golbabaei-Asl, M.; Knight, D.; Anderson, K.; Wilkinson, S. SparkJet Efficiency; AIAA Paper 2013-0928; American Institute of Aeronautics and Astronautics: Grapevine, TX, USA, 2013. [Google Scholar] [CrossRef]
- Golbabaei-Asl, M.; Knight, D. Numerical Characterization of High-Temperature Filament Interaction with Blunt Cylinder at Mach 3. Shock Waves 2014, 24, 123–138. [Google Scholar] [CrossRef]
- Emerick, T.; Ali, M.; Foster, C.; Alvi, F.; Popkin, S. SparkJet Characterization in Quiescent and Supersonic Flowfields. Exp. Fluids 2014, 55, 1–21. [Google Scholar] [CrossRef]
- Laurendeau, F.; Chedevergne, F.; Casalis, G. Transient Ejection Phase Modeling of Plasma Synthetic Jet Actuator. Phys. Fluids 2014, 26, 125101. [Google Scholar] [CrossRef]
- Sary, G.; Dufour, G.; Rogier, F.; Kourtzanidis, K. Modeling and Parametric Study of a Plasma Synthetic Jet for Flow Control. AIAA J. 2014, 52, 1591–1603. [Google Scholar] [CrossRef]
- Zong, H.; Cui, W.; Wu, Y.; Zhang, Z.; Liang, H.; Jia, M.; Li, Y. Influence of Capacitor Energy on Performance of Three-Electrode Plasma Synthetic Jet Actuator. Sens. Actuators A Phys. 2015, 222, 114–121. [Google Scholar] [CrossRef]
- Zong, H.h.; Wu, Y.; Li, Y.h.; Song, H.m.; Zhang, Z.b.; Jia, M. Analytic Model and Frequency Characteristics of Plasma Synthetic Jet Actuator. Phys. Fluids 2015, 27, 027105. [Google Scholar] [CrossRef]
- Zong, H.; Wu, Y.; Jia, M.; Song, H.; Liang, H.; Li, Y.; Zhang, Z. Influence of Geometric Parameters on Performance of Plasma Synthetic Jet Actuator. J. Phys. D 2016, 49, 025504. [Google Scholar] [CrossRef]
- Zong, H.; Wu, Y.; Song, H.; Jia, M.; Liang, H.; Li, Y.; Zhang, Z. Investigation of the Performance Characteristics of a Plasma Synthetic Jet Actuator Based on a Quantitative Schlieren Method. Meas. Sci. Technol. 2016, 27, 055301. [Google Scholar] [CrossRef]
- Zong, H.; Kotsonis, M. Characteristics of Plasma Synthetic Jet Actuators in Quiescent Flow. J. Phys. D 2016, 49, 335202. [Google Scholar] [CrossRef]
- Zong, H.; Kotsonis, M. Electro-mechanical Efficiency of Plasma Synthetic Jet Actuator Driven by Capacitive Discharge. J. Phys. D 2016, 49, 455201. [Google Scholar] [CrossRef]
- Zong, H.; Kotsonis, M. Experimental Investigation on Frequency Characteristics of Plasma Synthetic Jets. Phys. Fluids 2017, 29, 115107. [Google Scholar] [CrossRef]
- Zong, H.; Kotsonis, M. Effect of Slotted Exit Orifice on Performance of Plasma Synthetic Jet Actuator. Exp. Fluids 2017, 58. [Google Scholar] [CrossRef]
- Zong, H.; Kotsonis, M. Interaction Between Plasma Synthetic Jet and Subsonic Turbulent Boundary Layer. Phys. Fluids 2017, 49, 045104. [Google Scholar] [CrossRef]
- Wang, H.; Li, J.; Jin, D.; Tang, M.; Wu, Y.; Xiao, L. High Frequency Counter-Flow Plasma Synthetic Jet Actuator and Its Application in Suppression of Supersonic Flow Separation. Acta Astronaut. 2018, 142, 45. [Google Scholar] [CrossRef]
- Zhou, Y.; Xia, Z.; Luo, Z.; Wang, L.; Deng, X. Experimental Characteristics of Two-Electrode Plasma Synthetic Jet Actuator Array in Serial. Chin. J. Aeronaut. 2018, 31, 2234–2247. [Google Scholar] [CrossRef]
- Zhou, Y.; Xia, Z.; Luo, Z.; Wang, L.; Deng, X.; Zhang, Q.; Yang, S. Characterization of Three-Electrode SparkJet Actuator for Hypersonic Flow Control. AIAA J. 2019, 57, 879–885. [Google Scholar] [CrossRef]
- Zhou, Y.; Xia, Z.; Wang, L.; Luo, Z.; Peng, W.; Deng, X. Discharge and Electrothermal Efficiency Analysis of Capacitive Discharge Plasma Synthetic Jet Actuator in Single-Shot Mode. Sens. Actuators A Phys. 2019, 287, 102–112. [Google Scholar] [CrossRef]
- Zhou, Y.; Xia, Z.; Luo, Z.; Wang, L. EEffect of Three-Electrode Plasma Synthetic Jet Actuator on Shock Wave Control. Sci. China Technol. Sci. 2017, 60, 146–152. [Google Scholar] [CrossRef]
- Zhou, Y.; Xia, Z.; Luo, Z.; Wang, L.; Deng, X. A Novel Ram-Air Plasma Synthetic Jet Actuator for Near Space High-Speed Flow Control. Acta Astronaut. 2017, 133, 95–102. [Google Scholar] [CrossRef]
- Zhang, Z.; Wu, Y.; Jia, M.; Song, H.; Sun, Z.; Zong, H.; Li, Y. The Multichannel Discharge Plasma Synthetic Jet Actuator. Sens. Actuators A Phys. 2017, 253, 112–117. [Google Scholar] [CrossRef]
- Zhang, Z.; Zhang, X.; Wu, Y.; Jia, M.; Jin, D.; Sun, Z.; Li, Y. Experimental Research on the Shock Wave Control Based on One Power Supply Driven Plasma Synthetic Jet Actuator Array. Acta Astronaut. 2020, 171, 359–368. [Google Scholar] [CrossRef]
- Kim, H.J.; Chae, J.; Ahn, S.; Kim, K. Numerical Analysis of Jet Formation Process of SparkJet Actuator; AIAA Paper 2018-1552; American Institute of Aeronautics and Astronautics: Kissimmee, FL, USA, 2018. [Google Scholar] [CrossRef]
- Kim, H.J.; Shin, J.; Ahn, S.; Kim, K. Numerical Analysis on Flow Characteristics and Jet Boundary Condition of SparkJet Actuator; AIAA Paper 2019-0736; American Institute of Aeronautics and Astronautics: San Diego, CA, USA, 2019. [Google Scholar] [CrossRef]
- Shin, J.; Kim, H.J.; Ahn, S.; Kim, K. A Parametric Study and Analytical Model Development of SparkJet Actuator Using CFD; AIAA Paper 2019-0999; American Institute of Aeronautics and Astronautics: San Diego, CA, USA, 2019. [Google Scholar] [CrossRef]
- Gordon, S.; McBride, B. Computer Program for Calculation of Complex Chemical Equilibrium Compositions and Applications. I. Analysis; RP 1311; National Aeronautics and Space Administration: Cleveland, OH, USA, 1994.
- Zong, H.; Kotsonis, M. Formation, Evolution and Scaling of Plasma Synthetic Jets. J. Fluid Mech. 2018, 837, 147–181. [Google Scholar] [CrossRef]
- de Luca, L.; Girfoglio, M.; Coppola, G. Modeling and Experimental Validation of the Frequency Response of Synthetic Jet Actuators. AIAA J. 2014, 52, 1733–1748. [Google Scholar] [CrossRef]
- Zong, H. Influnece of Nondimensional Heating Volume on Efficiency of Plasma Synthetic Jet Actuators. AIAA J. 2018, 56, 2075–2078. [Google Scholar] [CrossRef]
- Zong, H.; Chiatto, M.; Kotsonis, M.; de Luca, L. Plasma Synthetic Jet Actuators for Active Flow Control. Actuators 2018, 7, 77. [Google Scholar] [CrossRef]
- Belinger, A.; Hardy, P.; Barricau, P.; Cambronne, J.; Caruana, D. Influence of the Energy Dissipation Rate in the Discharge of a Plasma Synthetic Jet Actuator. J. Phys. D Appl. Phys. 2011, 44, 365201. [Google Scholar] [CrossRef]
- Reedy, T.; Kale, N.; Dutton, J.; Elliott, G. Experimental Characterization of a Pulsed Plasma Jet. AIAA J. 2013, 51, 2027–2031. [Google Scholar] [CrossRef]
- Wang, L.; Xia, Z.; Luo, Z.; Zhang, Y. Effect of Pressure on the Performance of Plasma Synthetic Jet Actuator. Sci. China Phys. Mech. Astron. 2014, 57, 2309–2315. [Google Scholar] [CrossRef]
- Xie, W.; Luo, Z.; Zhou, Y.; Peng, W.; Liu, Q.; Wang, D. Experimental and Numerical Investigation on Opposing Plasma Synthetic Jet for Drag Reduction. Chin. J. Aeronaut. 2022, 35, 75–91. [Google Scholar] [CrossRef]
- Xie, W.; Luo, Z.; Hou, L.; Zhou, Y.; Liu, Q.; Peng, W. Characterization of Plasma Synthetic Jet Actuator with Laval-Shaped Exit and Application to Drag Reduction in Supersonic Flow. Phys. Fluids 2021, 33, 096104. [Google Scholar] [CrossRef]
- Xie, W.; Luo, Z.; Zhou, Y.; Gao, T.; Wu, Y.; Wang, Q. Experimental Study on Shock Wave Control in High-Enthalpy Hypersonic Flow by Using SparkJet Actuator. Acta Astronaut. 2021, 188, 416–425. [Google Scholar] [CrossRef]
- Georgievsky, P.; Levin, V. Supersonic Flow over a Body with Heat Supply Ahead of It; Steklov Institute of Mathematics: Moscow, Russia, 1991; pp. 229–234. [Google Scholar]
- Toro, P.; Myrabo, L.; Nagamatsu, H. Pressure Investigation of the Hypersonic ’Directed Energy Air Spike’ Inlet at Mach Number 10 up to 70 kW; AIAA Paper 1998-0991; American Institute of Aeronautics and Astronautics: Reno, NV, USA, 1998. [Google Scholar]
- Myrabo, L.; Raizer, Y. Laser-Induced Air Spike for Advanced Transatmospheric Vehicles; AIAA Paper 1994-2451; American Institute of Aeronautics and Astronautics: Colorado Springs, CO, USA, 1994. [Google Scholar]
- Tretyakov, P.; Garanin, A.; Kraynev, V.; Tupikin, A.; Yakovlev, V. Investigation of Local Laser Energy Release Influence on Supersonic Flow by Methods of Aerophysical Experiments. In Proceedings of the 8th International Conference on Methods of Aerophysical Research, Novosibirsk, Russia, 2–6 September 1996. [Google Scholar]
- Tretyakov, P.; Kraynev, V.; Yakovlev, V.; Grachev, G.; Ivanchenko, A.; Ponomarenko, A.; Tischenko, V. A Powerful Optical Pulsating Discharge as the Source of Energy Release in Supersonic Flow. In Proceedings of the 7th International Conference on Methods in Aerophysical Research, Novosibirsk, Russia, 22–26 August 1994; pp. 224–228. [Google Scholar]
- Kolesnichenko, Y.; Brovkin, V.; Leonov, S.; Krylov, A.; Lashkov, V.; Mashek, I.; Gorynya, A.; Ryvkin, M. Investigation of AD-Body Interaction with Microwave Discharge Region in Supersonic Flows; AIAA Paper 2001-0345; American Institute of Aeronautics and Astronautics: Reno, NV, USA, 2001. [Google Scholar]
- Kolesnichenko, Y.; Brovkin, V.; Leonov, S.; Krylov, A.; Lashkov, V.; Mashek, I.; Gorynya, A.; Ryvkin, M. Influence of Differently Organized Microwave Discharge on AD-Body Characteristics in Supersonic Flow; AIAA Paper 2001-3060; American Institute of Aeronautics and Astronautics: Anaheim, CA, USA, 2001. [Google Scholar] [CrossRef]
- Kolesnichenko, Y.; Brovkin, V.; Azarova, O.; Grudnitsky, V.; Lashkov, V.; Mashek, I. Energy Release Regimes for Drag Reduction in Supersonic Flow; AIAA Paper 2002-0353; American Institute of Aeronautics and Astronautics: Reno, NV, USA, 2002. [Google Scholar]
- Kolesnichenko, Y.; Brovkin, V.; Khmara, D.; Lashkov, V.; Mashek, I.; Ryvkin, M. Microwave Discharge Parameters in Supersonic Flow; AIAA Paper 2002-0356; American Institute of Aeronautics and Astronautics: Reno, NV, USA, 2002. [Google Scholar] [CrossRef]
- Kolesnichenko, Y.; Brovkin, V.; Azarova, O.; Grudnitsky, V.; Lashkov, V.; Mashek, I. Microwave Energy Deposition for Aerodynamic Application; AIAA Paper 2003-0361; American Institute of Aeronautics and Astronautics: Reno, NV, USA, 2003. [Google Scholar]
- Kolesnichenko, Y.; Brovkin, V.; Khmara, D.; Lashkov, V.; Mashek, I.; Ryvkin, M. Fine Structure of Microwave Discharge: Evolution Scenario; AIAA Paper 2003-0362; American Institute of Aeronautics and Astronautics: Reno, NV, USA, 2003. [Google Scholar]
- Kolesnichenko, Y.; Azarova, O.; Brovkin, V.; Khmara, D.; Lashkov, V.; Mashek, I.; Rivkin, M. Basics in Beamed MW Energy Deposition for Flow/Flight Control; AIAA Paper 2004-0669; American Institute of Aeronautics and Astronautics: Reno, NV, USA, 2004. [Google Scholar]
- Knight, D. Survey of Aerodynamic Drag Reduction at High Speed by Energy Deposition. J. Propuls. Power 2008, 24, 1153–1167. [Google Scholar] [CrossRef]
- Dobrov, Y.; Lashkov, V.; Mashek, I.; Khoronzhuk, R. Investigation of Heat Flux on Aerodynamic Body in Supersonic Gas Flow with Local Energy Deposition. AIP Conf. Proc. 2018, 1959, 050009-1–050009-6. [Google Scholar]
- Yu, X.; Yan, H.; Wang, Y. Numerical Investigation on Wave Drag Reduction by Laser Energy Deposition. In Proceedings of the Tenth International Conference on Computational Fluid Dynamics, Barcelona, Spain, 9–13 July 2018; pp. ICCFD10-272-1–ICCFD10-272-8. [Google Scholar]
- Alberti, A.; Munafò, A.; Pantano, C.; Panesi, M. Supersonic and Hypersonic Non-Equilibrium Flow Control Using Laser Energy Deposition; AIAA Paper 2019-2867; American Institute of Aeronautics and Astronautics: Dallas, TX, USA, 2019. [Google Scholar] [CrossRef]
- Alberti, A.; Munafò, A.; Pantano, C.; Panesi, M. Self-Consistent Computational Fluid Dynamics of Supersonic Drag Reduction via Upstream-Focused Laser Energy Deposition. AIAA J. 2021, 59, 1214–1224. [Google Scholar] [CrossRef]
- Alberti, A.; Munafò, A.; Sahai, A.; Pantano, C.; Panesi, M. FEM Simulation of Laser-Induced Plasma Breakdown Experiments for Combustion Applicatoins; AIAA Paper 2017-1111; American Institute of Aeronautics and Astronautics: Grapevine, TX, USA, 2017. [Google Scholar] [CrossRef]
- Munafó, A.; Alberti, A.; Pantano, C.; Freund, J.; Panesi, M. Modeling of Laser-Induced Breakdown Phenomena in Non-Equilibrium Plasmas; AIAA Paper 2018-0171; American Institute of Aeronautics and Astronautics: Kissimmee, FL, USA, 2018. [Google Scholar] [CrossRef]
- Alberti, A.; Munafò, A.; Pantano, C.; Freund, J.; Panesi, M. Modeling of Air Breakdown by Single-Mode and Multi-Mode Lasers; AIAA Paper 2019-1250; American Institute of Aeronautics and Astronautics: San Diego, CA, USA, 2019. [Google Scholar] [CrossRef]
- Oxenius, J. Kinetic Theory of Particles and Photons: Theoretical Foundations of Non-LTE Plasma Spectroscopy; Springer: New York, NY, USA, 2012. [Google Scholar]
- Adelgren, R.; Yan, H.; Elliott, G.; Knight, D.; Beutner, T.; Zheltovodov, A. Control of Edney IV Interaction by Pulsed Laser Energy Deposition. AIAA J. 2005, 43, 256–269. [Google Scholar] [CrossRef]
- Kandala, R.; Candler, G. Numerical Studies of Laser-Induced Energy Deposition for Supersonic Flow Control. AIAA J. 2004, 42, 2266–2275. [Google Scholar] [CrossRef]
- Zheltovodov, A.; Pimonov, E.; Knight, D. Energy Deposition Influence on Supersonic Flow Over Axisymmetric Bodies; AIAA Paper 2007-1230; American Institute of Aeronautics and Astronautics: Reno, NV, USA, 2007. [Google Scholar] [CrossRef]
- Azarova, O.; Knight, D.; Kravchenko, O. Lift Forces, Heat Fluxes and Self-Sustained Oscillations Over Supersonic Bodies under Asymmetric Energy Deposition. In Proceedings of the 8th European Conference on AeroSpace Sciences, Madrid, Spain, 1–4 July 2019. [Google Scholar] [CrossRef]
- Das, D.; Desai, S.; Kulkarni, V.; Gadgil, H. Performance Assessment of Energy Deposition Based Drag Reduction Technique for Earth and Mars Flight Conditions. Acta Astronaut. 2019, 159, 418–428. [Google Scholar] [CrossRef]
- Elias, P.Q.; Severac, N.; Luyssen, J.M.; Tobeli, J.P.; Lambert, F.; Bur, R.; A Houard, Y.B.A.; Albert, S.; Mysyrowicz, A.; Doudet, I. Experimental Investigation of Linear Energy Deposition Using Femtosecond Laser Filamentation in a M = 3 Supersonic Flow; AIAA Paper 2018-4896; American Institute of Aeronautics and Astronautics: Cincinnati, OH, USA, 2018. [Google Scholar] [CrossRef]
- Refloch, A.; Courbet, B.; Murrone, A.; Villedieu, P.; Laurent, C. CEDRE Software. Aerosp. Lab J. 2011, 2, 1–10. [Google Scholar]
- Leonov, S.; Yarantsev, D.; Soloviev, V. High Speed Inlet Customization by Surface Electrical Discharge; AIAA Paper No. 2006-0403; American Institute of Aeronautics and Astronautics: Reno, NV, USA, 2006. [Google Scholar]
- Caraballo, E.; Webb, N.; Little, J.; Kim, J.H.; Samimy, M. Supersonic Inlet Flow Control Using Plasma Actuators; AIAA Paper 2009-924; American Institute of Aeronautics and Astronautics: Orlando, FL, USA, 2009. [Google Scholar]
- Leonov, S.; Firsov, A.; Yarantsev, D. Active Steering of Shock Waves in Compression Ramp by Nonuniform Plasma; AIAA Paper 2010-0260; American Institute of Aeronautics and Astronautics: Orlando, FL, USA, 2010. [Google Scholar] [CrossRef]
- Falempin, F.; Firsov, A.; Yarantsev, D.; Goldfeld, M.; Timofeev, K.; Leonov, S. Plasma Control of Shock Wave Configuration in Off-Design Model of M = 2 Inlet. Exp. Fluids 2015, 56, 54. [Google Scholar] [CrossRef]
- Leonov, S.; Bityurin, V.; Savelkin, K.; Yarantsev, D. Effect of Electrical Discharge on Separation Processes and Shocks Position in Supersonic Airflow; AIAA Paper No. 2002-0355; American Institute of Aeronautics and Astronautics: Reno, NV, USA, 2002. [Google Scholar]
- Utkin, Y.; Keshav, S.; Kim, J.H.; Kastner, J.; Adamovich, I.; Samimy, M. Development and Use of Localized Arc Filament Plasma Actuators for High-Speed Flow Control. J. Phys. D Appl. Phys. 2007, 40, 685–694. [Google Scholar] [CrossRef]
- Starkovskiy, A.; Aleksandrov, N. Gasdynamic Flow Control by Ultrafast Local Heating in a Strongly Nonequilibrium Pulsed Plasma. Plasma Phys. Rep. 2021, 47, 148–209. [Google Scholar] [CrossRef]
- Takahashi, M.; Ohnishi, N. Separation Control on an Airfoil Using Repetitive Laser Pulses; AIAA Paper 2018-1430; American Institute of Aeronautics and Astronautics: Kissimmee, FL, USA, 2018. [Google Scholar] [CrossRef]
- Ukai, T.; Kontis, K.; Yang, L. Flow Structure Generated by Laser-Induced Blast Wave Propagation Through the Boundary Layer of a Flat Plate. Aerosp. Sci. Technol. 2018, 78, 569–573. [Google Scholar] [CrossRef]
- Feng, L.; Ma, X.; Zhang, Y. Response Characteristics of Impinging Shock Wave/Turbulent Boundary Layer Interaction Disturbed by Arc Plasma Energy Deposition. Phys. Fluids 2022, 34, 015132. [Google Scholar] [CrossRef]
- Tang, M.; Wu, Y.; Wang, H.; Jin, D.; Guo, S.; Gan, T. Effects of Capacitance on a Plasma Synthetic Jet Actuator with a Conical Cavity. Sens. Actuators 2018, A 276, 284–295. [Google Scholar] [CrossRef]
- Gan, T.; Wang, Q. Manipulation of Ramp-Induced Shock Using an Array of Surface Arc Plasma Actuators. Int. J. Heat Fluid Flow 2022, 93, 108894. [Google Scholar] [CrossRef]
- Ma, X.; Fan, J.; Wu, Y.; Liu, X.; Xue, R. Study on the Mechanism of Shock Wave and Boundary Layer Interaction Control Using High-Frequency Pulsed Arc Discharge Plasma. Phys. Fluids 2022, 34, 086102. [Google Scholar] [CrossRef]
- Feng, L.; Wang, H.; Chen, Z.; Zhou, Y.; Yang, Y. Unsteadiness Characterization of Shock Wave/Turbulent Boundary Layer Interaction Controlled by High-Frequency Arc Plasma Energy Deposition. Phys. Fluids 2021, 33, 015114. [Google Scholar] [CrossRef]


Publisher’s Note: MDPI stays neutral with regard to jurisdictional claims in published maps and institutional affiliations. |
© 2022 by the authors. Licensee MDPI, Basel, Switzerland. This article is an open access article distributed under the terms and conditions of the Creative Commons Attribution (CC BY) license (https://creativecommons.org/licenses/by/4.0/).