Article

Discriminability Analysis of Characterization Parameters in Micro-Leakage of Turbocharged Boiler’s Evaporation Tube

1
College of Power Engineering, Naval University of Engineering, Wuhan 430033, China
2
College of Weapon Engineering, Naval University of Engineering, Wuhan 430033, China
*
Authors to whom correspondence should be addressed.
Energies 2022, 15(22), 8636; https://doi.org/10.3390/en15228636
Submission received: 30 October 2022 / Revised: 14 November 2022 / Accepted: 16 November 2022 / Published: 17 November 2022

Abstract

:
It is extremely dangerous for a turbocharged boiler to have a leakage fault in its vaporization tube. However, early detection and fault diagnosis of micro-leakage faults are very difficult. On the one hand, there are few fault samples that lead to a difficult and intelligent diagnosis. On the other hand, the system fault response characteristics of the characterization parameters in the process are complex and easily confused with the load-changing characteristics. In order to obtain fault samples and identify fault characteristics, a fault simulation model for the micro-leakage of the boiler evaporation tube is established based on the dynamic mathematical model of all working conditions. The model’s effectiveness is verified by typical fault experiments. The dynamic simulation experiments of three kinds of micro-leakage and four kinds of load changing were carried out. Through the analysis of combustion equilibrium and vapor-liquid equilibrium of 14 groups of characterization parameters, it is found that: (1) The reason for the poor discriminability in micro-leakage faults is that most of the characterization parameters tend to balance after 300 s and the dynamic response characteristics are similar to those of load increase. (2) There are four highly distinguishable parameters: the speed of the turbocharger unit, the air supply flow, the flue gas temperature at the superheater outlet, and the furnace pressure. When the micro-leakage fault is triggered, the first three parameters have a large disturbance. They show a trend of decreasing first and then increasing in short periods, unlike normal load-changing conditions. The fourth parameter (furnace pressure) rises abnormally fast after failure. (3) Under the normal working condition of varying loads, the main common parameters take 300 s to stabilize; the common stability parameter values should be recorded because when the micro-leakage fault of evaporation occurs, the steady-state increment of failure is larger than the normal steady increment under variable load conditions, by 2 to 3 times. (4) As the leakage fault increases, the disturbance amplitude of the characteristic parameters becomes larger. In addition, the stability of the steam system becomes worse, and fault discrimination becomes more obvious.

1. Introduction

The leakage faults of the four tubes of a boiler have caused great harm to the safety of the steam system and have attracted extensive attention at home and abroad [1,2,3,4]. The pipes inside the furnace, such as the water wall, riser pipes, and evaporation pipes, have higher external temperatures and a greater risk of pipe rupture. At the same time, because they are close to the furnace, the leaked steam will directly pour into the furnace, causing deterioration of the combustion.
In the research field of boiler system leakage and tube-burst failures, the main research method is structural chemical analysis due to the destructive nature of a physical experiment. Nurbanasari, Abdulrachim, etc., conducted a case analysis based on the leakage fault of a 660 MW supercritical boiler [5]. Facai Rena, Jinsha Xu, etc., conducted a failure analysis on the leakage of a circulating fluidized bed boiler water wall pipeline [6]. Husaini, Nurdin Ali, etc., conducted a fracture failure study on the superheater water tube boiler [7]. Zhang, J; Wang, M.J., etc., summarized and commented on the morphologies and thermal-hydraulic characteristics in nuclear systems’ micro-cracks [8]. The above research reveals that boiler pipe ruptures often originate from small pipe leakages. Even after continuous impact and oxidation, they were not found until a large rupture or pipe explosion occurred after a long time.
To find faults as early as possible and reduce the occurrence probability of four tube faults, a large number of integrated intelligent means are applied to fault diagnosis. Kong, Qian; Jiang, Gen Shan, et al. used the acoustic method and artificial neural network to study leakage locations of water wall tubes [9]. Lamiaa M. Elshenawy, Mohamed A, et al. established a fault monitoring and diagnosis system for nuclear power plants using unsupervised machine learning [10]. Khalid, Salman, Lim, Woocheol, et al. used the machine learning method to detect the leakage of boiler water wall tubes in steam power plants [11].
However, there were some problems in intelligent fault diagnosis methods, such as insufficient training data and poor analyticity of the training process and training results; therefore, some researchers began to explore model-based fault simulation methods. Soumitro Nagpal discussed a number of heat-exchanger tube-rupture scenarios and suggested that dynamic simulation should be considered for evaluating tube-rupture scenarios of liquid-filled systems [12]. Qi Hongwei et al. aiming at the problem of power outage faults that cannot be monitored integrated the ETAP scientific calculation model and simulation training system through the communication interface and realized the transient analysis of high- and medium-voltage electrical phase failure in nuclear power plants [13]. Li Xiaopeng, Nihe, et al. aiming at the problem of fault samples that cannot be obtained, established a dynamic model of a fuel system and obtained typical fault sample data with realistic responses to parameter changes [14]. In response to the problem that existing intelligent diagnostic methods require a large amount of normal and faulty engine operation data while new equipment failures are insufficient, Matulic, Nikola, et al. [15] using the engine model developed by AVL CruiseM as the basis, built an engine model capable of simulating multiple engine failures such as injector leakage and exhaust valve leakage simultaneously and applied it to diagnostic software development and software-in-the-loop environment testing.
The supercharged boiler system has become one of the main forms of power for ships because of its small size and lightweight, fast speed of changing load, and good energy efficiency. In the last decade, research on pressurized boiler systems has focused on the optimization of system performance design [16,17,18] and the optimization of changing-load characteristics. In the early days, Wang Cheng, Zhang Guolei, et al. studied the steady-state performance calculation and dynamic process simulation of a supercharged boiler system based on GSE software [19,20]. Later, Zhang Guolei, Li Jian, et al. continued the study of the response rules of the power system under different active steam return control conditions of marine turbocharged units and the dynamic characteristics of rapid load reduction of the steam system under different operating environments [21,22,23]. Recently, Boyu Deng, Man Zhang, et al. analyzed the full cycle dynamics of a 350 MW supercritical CFB boiler during load regulation through modeling [24]. Taler, Dawid, etc., determined the steam and water parameter characteristics during boiler startup by simulation and evaluated the performance of key components [25]. It can be seen that using simulation to study the dynamic characteristics of steam systems is a mature and reliable technology.
From the above research, it can be seen that a large number of studies focus on the simulation of variable load characteristics of supercharged boiler systems, some of which involve the pipeline damage of auxiliary systems and their application in fault diagnosis. The field of boiler tube-burst research is mainly focused on structural chemical analysis, and a very small amount is related to the simulation analysis of superheater pipe damage. It is aimed at pipe burst simulations with large pipeline damage, where the type of pipeline does not involve the bursting of the evaporation pipe and micro-leakage. It is difficult to analyze and deal with the leakage of the evaporation pipe in a supercharged marine boiler. The main reason is that the coupling between the components of the boiler is stronger than that of the non-turbocharged boiler, and the response characteristics of each system are more complex. The leakage fault characteristics of the evaporation tube are easily confused with the load-changing response characteristics of the system. To the author’s knowledge, little research has been conducted regarding leakage faults in evaporation tubes of supercharged marine boilers. Taking advantage of pipeline fault simulation technology and boiler system dynamic characteristics simulation technology, this paper intends to fill this gap.
In the paper, a leakage fault model of the evaporation tube is to be established based on the dynamic mathematical model of the steam power plant, in addition to the simulation verification being carried out. Under the condition of boiler evaporation tube leakage, the combustion balance characteristics and the steam-water balance characteristics are to be examined by comparing some simulation experiments with load changings and simulation experiments with evaporation tube leakage faults. Furthermore, the discriminability of the main characterization parameters will be investigated under the condition of a leakage of the evaporation tube in a supercharged marine boiler. Finally, the research results can provide enough reliable samples for fault diagnosis research, and the identifiability research results can be used for early fault detection and late fault diagnosis of the crew.

2. Overview of a Supercharged Boiler System

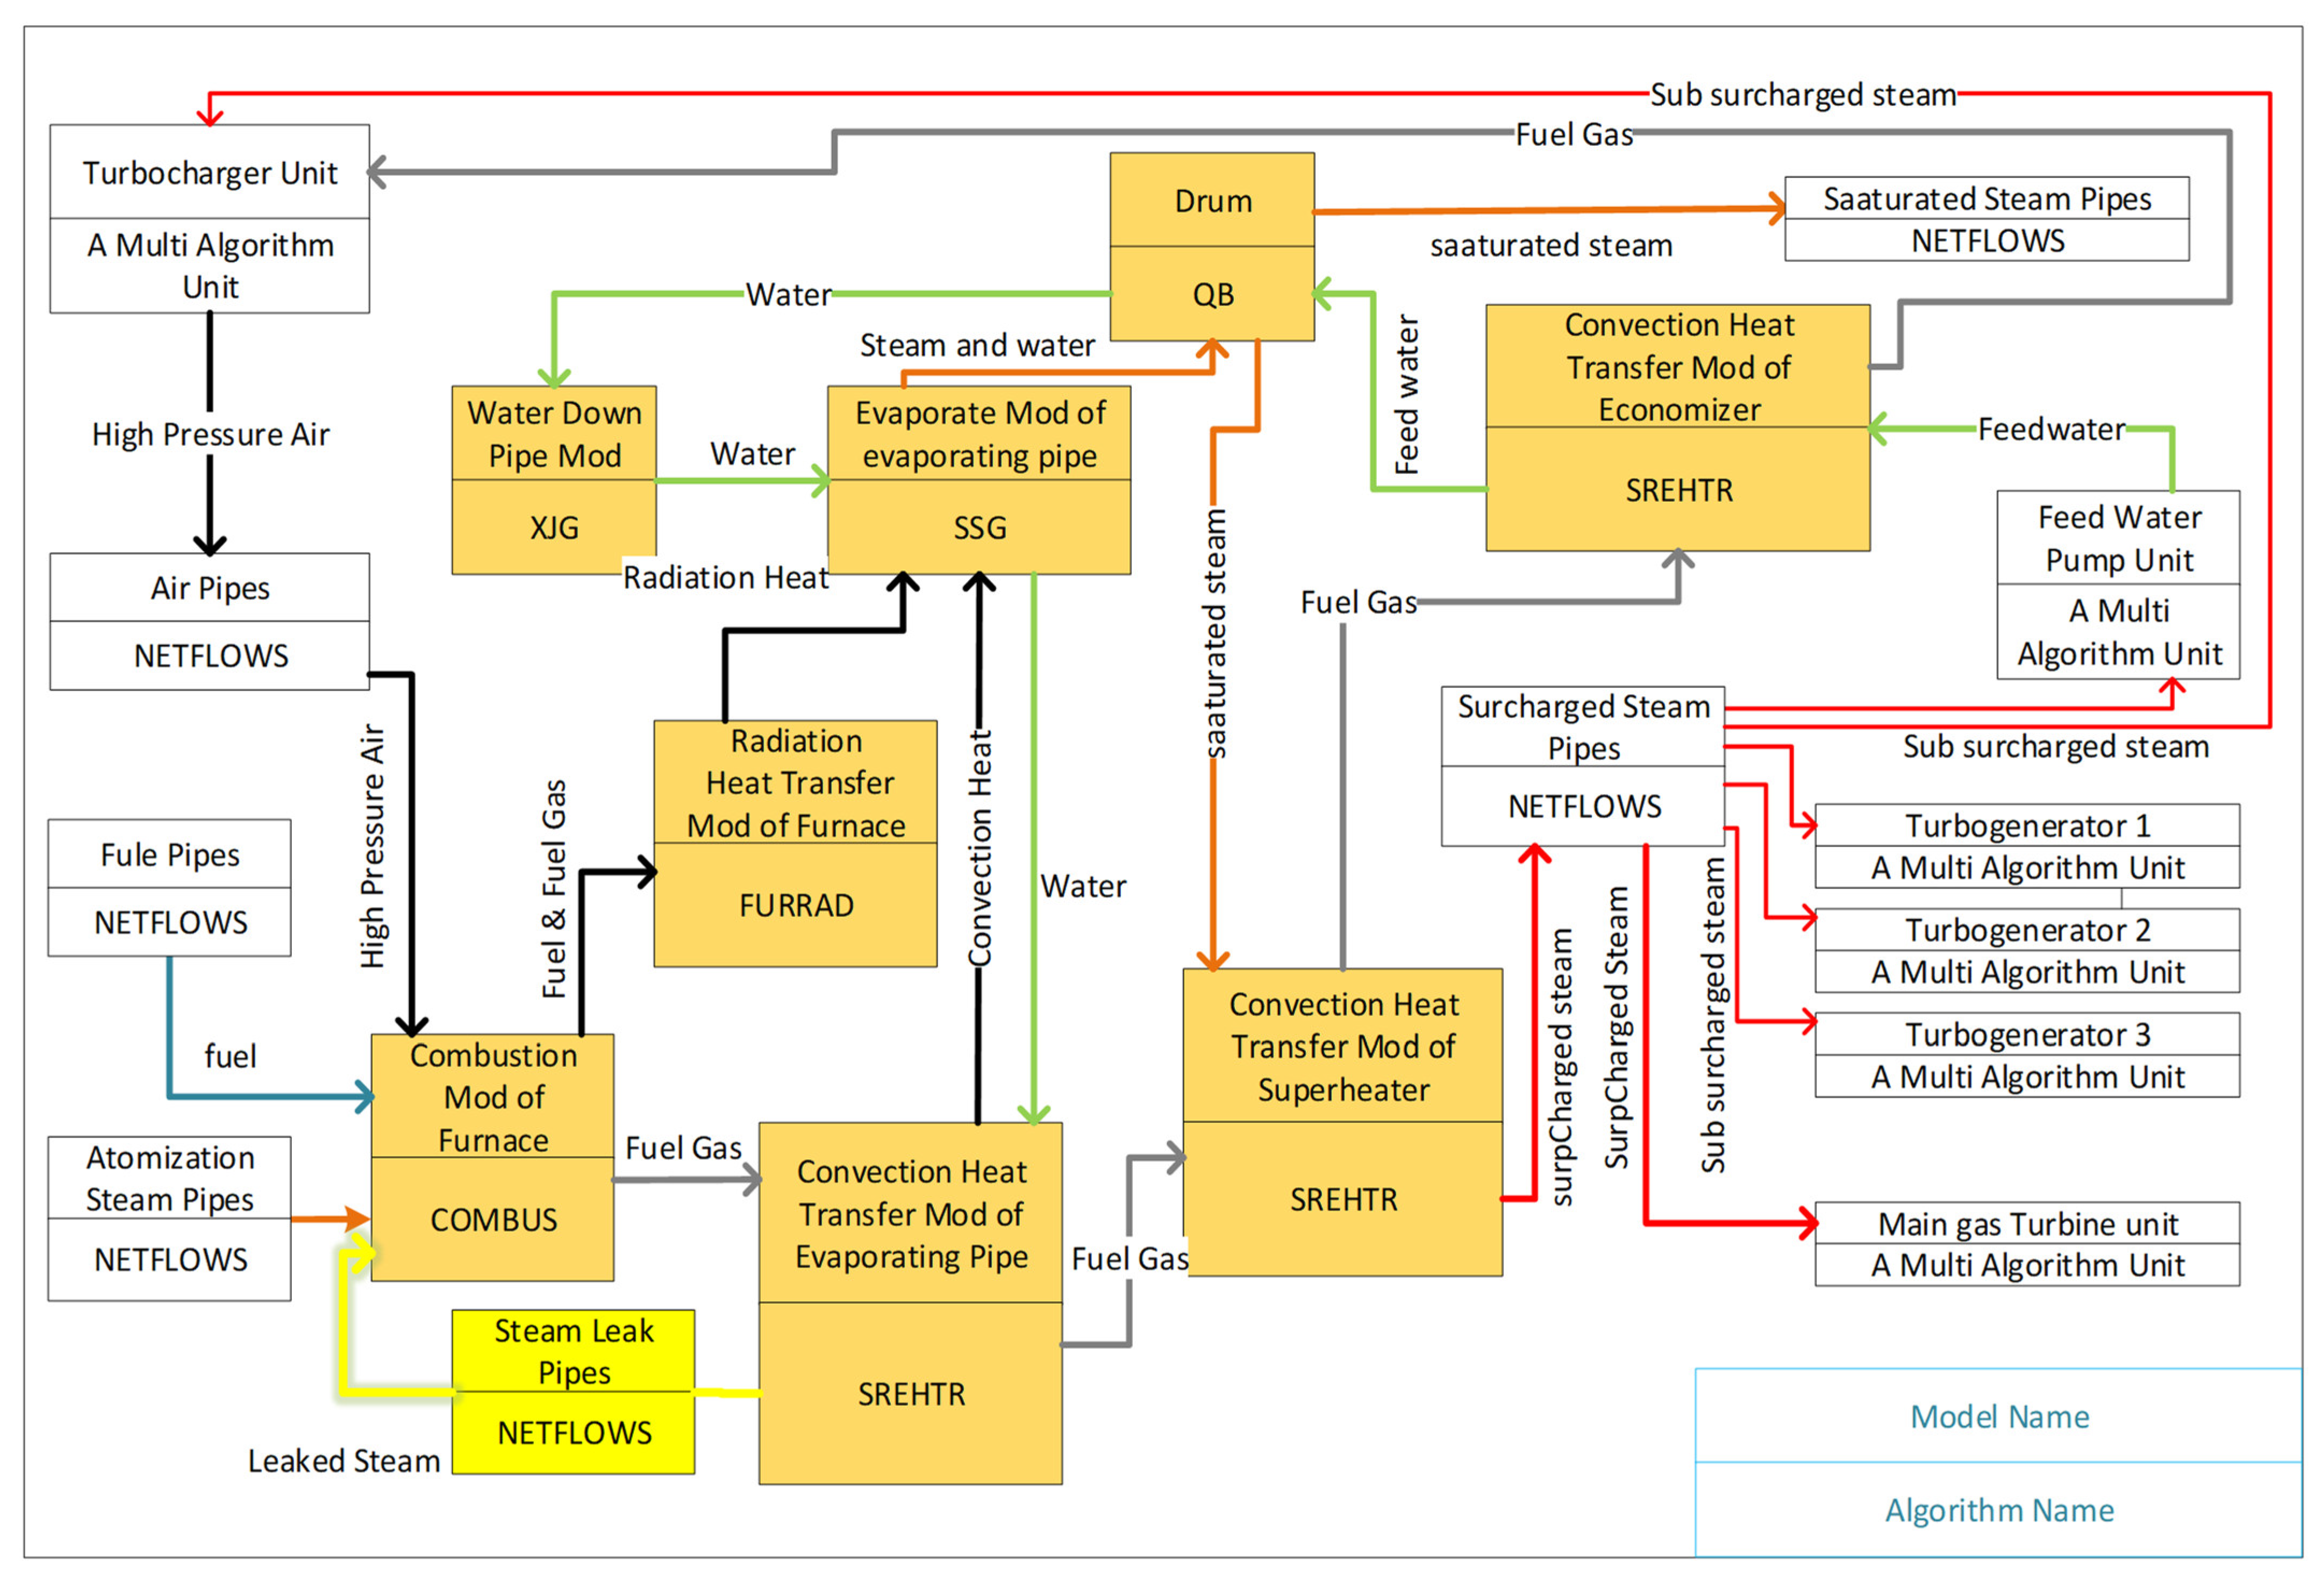
The steam power system is composed of an air supply system, combustion system, steam system, and condensate water supply system. The system diagram is shown in Figure 1. The combustion system is mainly composed of an oil supply, air supply, atomized steam, furnace, water wall, riser tube, and evaporation tube bundle. The chemical energy generated by combustion is transferred to the steam drum and superheater through various tube bundles in the way of radiation and convection heat transfer. The flue gas and some superheated steam are supplied to the booster fan to supply air to the boiler. Saturated steam (No. 9) supplies the auxiliary system, The main superheated steam shown in No. 10 is supplied to the main turbine and turbine generator. The condensate returns to the boiler drum through the condenser, feedwater unit, and economizer.

3. Evaporator Tube Leakage Fault Model and Model Verification

3.1. Simulation Assumptions and Module Division

Micro-leakage of the evaporation tube is the main research problem in this paper. It can be seen from Figure 1 that when saturated steam leaks from evaporation tube No. 5, it will flow into furnace No. 4. First, it affects combustion and heat transfer, and then it will spread to the whole steam system to produce a strong coupling fault response. For this reason, the mathematical model of all working conditions is required as the basis to simulate such faults realistically. The full working condition mathematical model has been established and verified in the articles [26,27,28]; the relevant simulation assumptions are also applicable to this paper. This part mainly establishes the fault simulation model of the boiler body system and describes the modified mathematical model of the relevant modules based on the improvement of the steam leakage model. All mathematical models are encapsulated in modules, and the lapping of simulation modules can reflect the connection relationship of main physical quantities in mathematical models. The module lapping diagram is shown in Figure 2. First, the steam leak pipes module is established according to the fluid network principle, which is connected to the evaporation pipe module and the furnace module. The evaporation pipe module only has the reduction of the steam flow, which will not be detailed in this paper, while the combustion mathematical models will be detailed because the combustion module of the furnace is greatly affected and improved.

3.2. Mathematical Model of Leakage

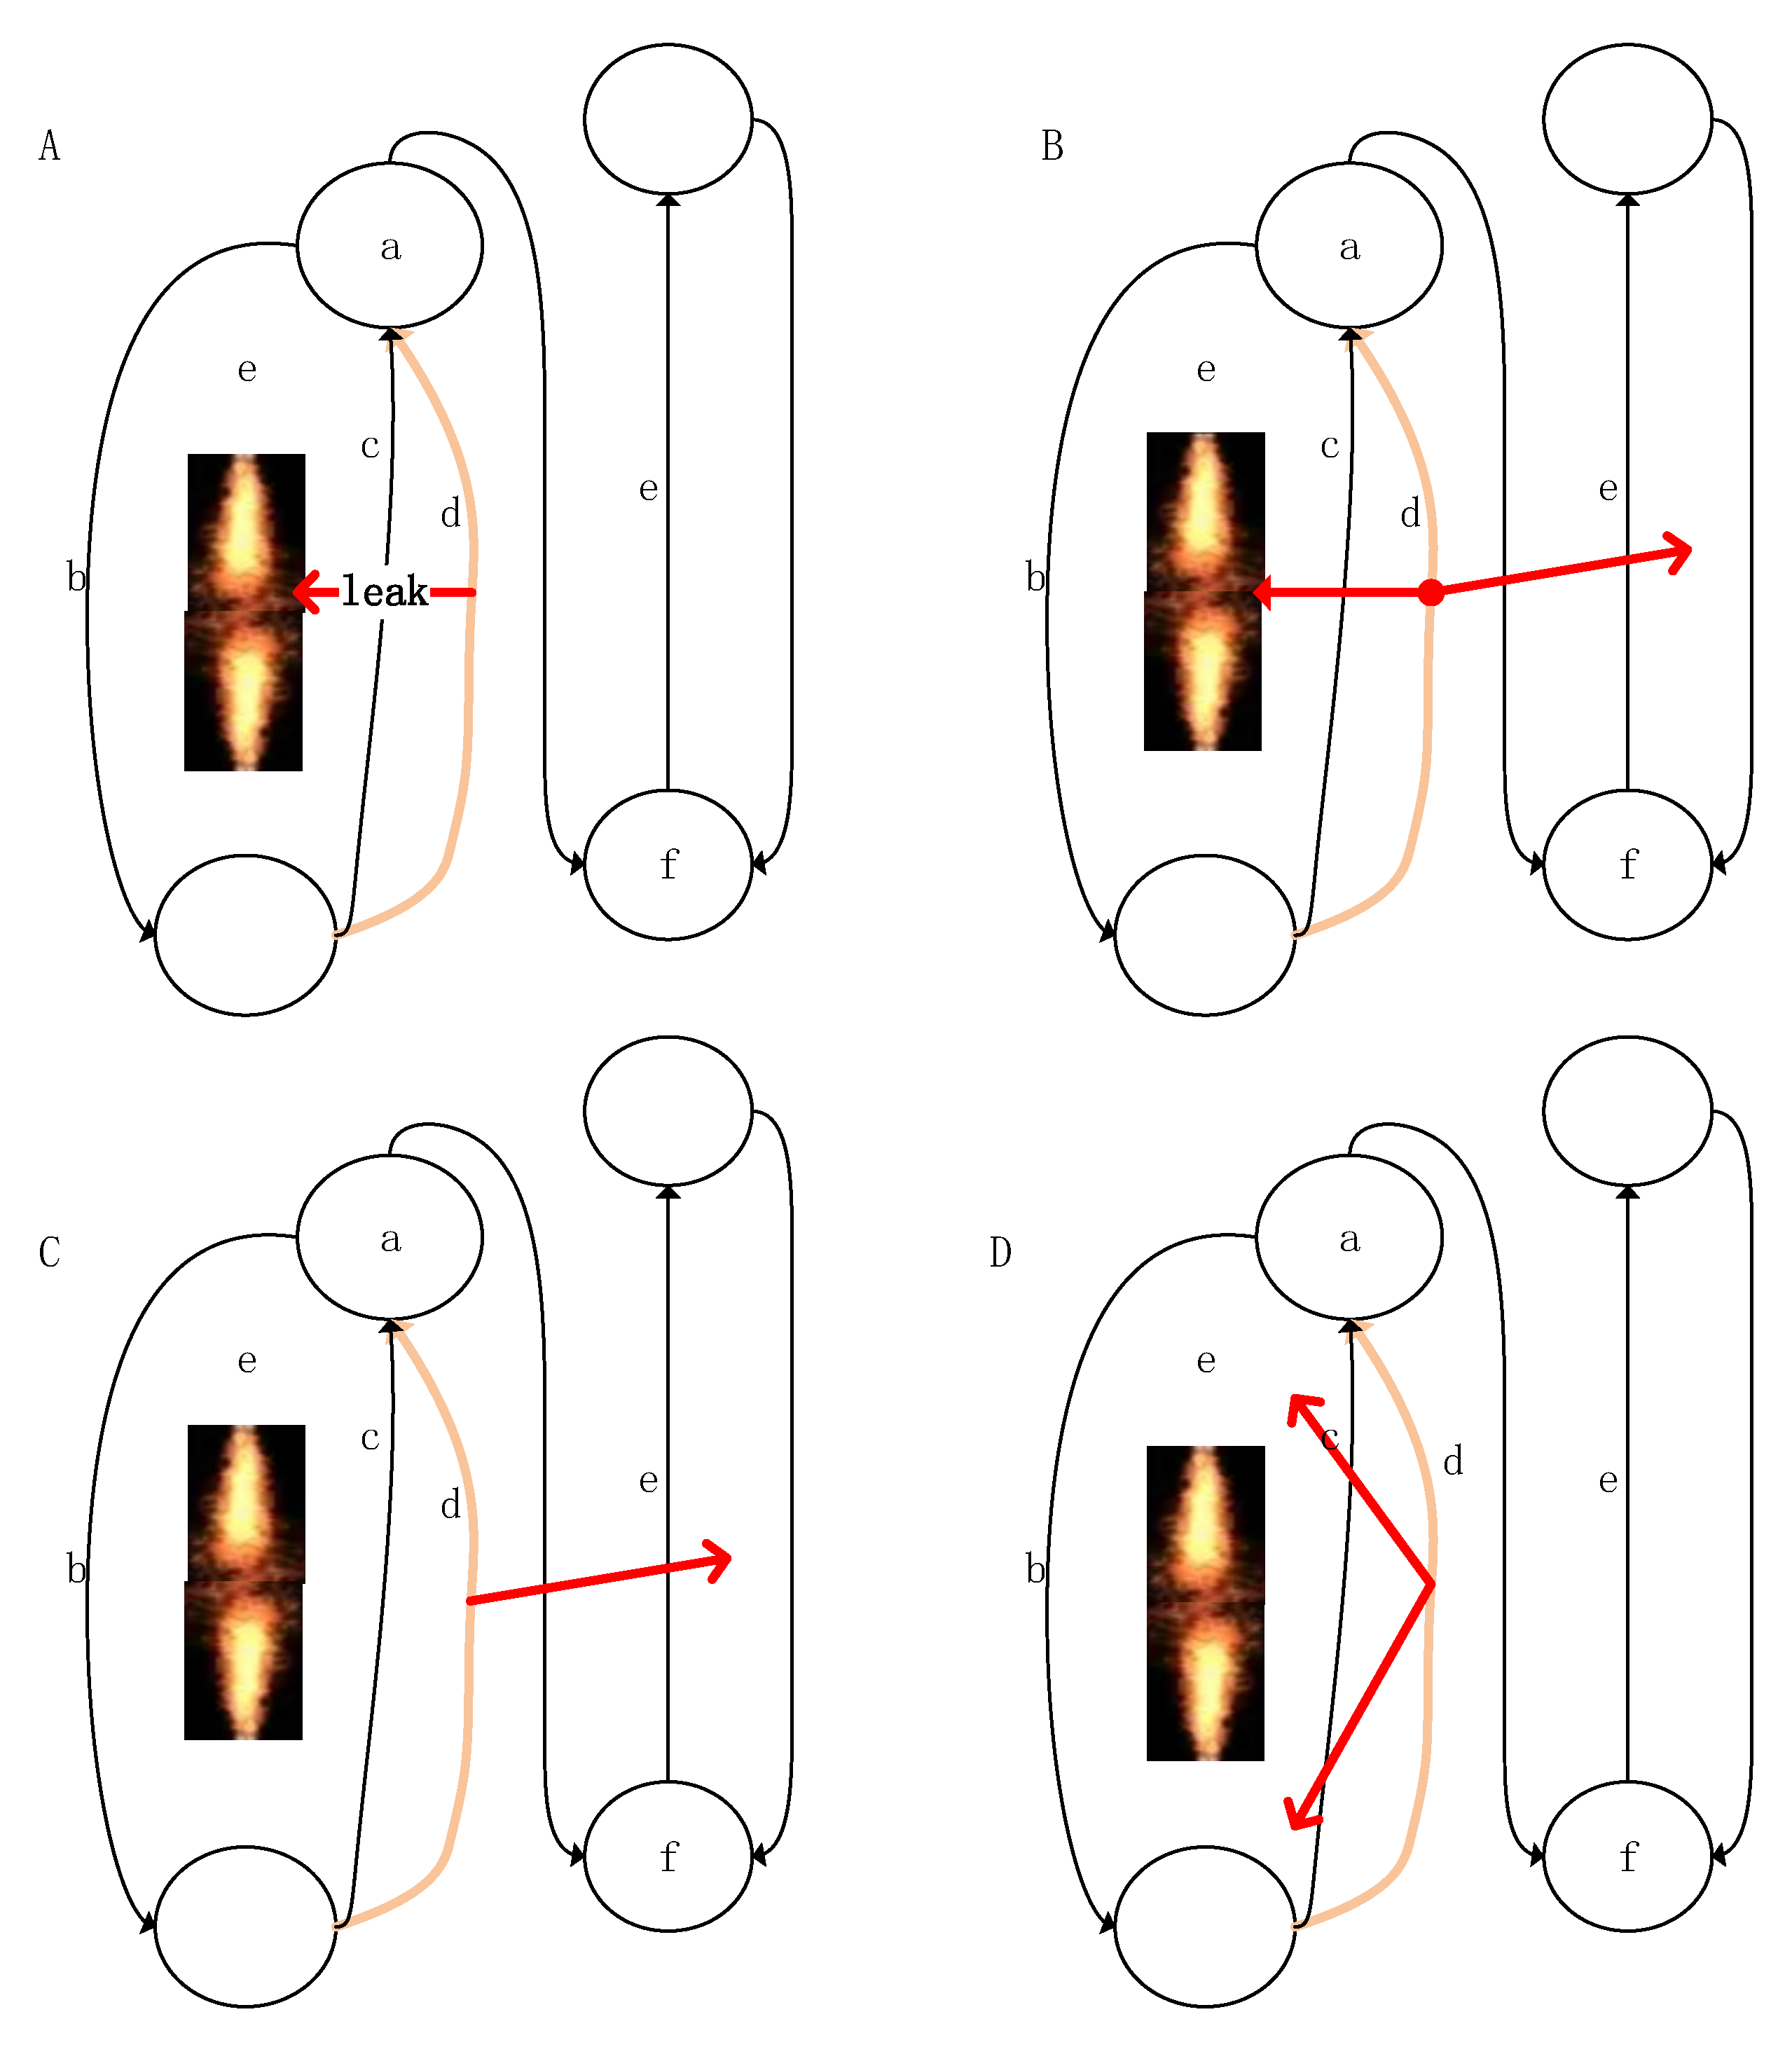
The pipeline leakage model was originally proposed by Henry and Fauske in 1971 [29] and was improved in 2005 into the HNE-DS model, which is applicable to control valves, nozzles, and slits in two-phase flow [30] (p. 29). Recently, XiaWu, Changjun Li, et al. improved the isentropic expansion principle of this model [31]. J. Zhang, H. Yu et al. successfully used and improved the model in a short pipe cracking test study [32] (p. 154). Hongdong Zhen, Songtao Yin et al. improved the HNE-DS model again and applied it in a leakage test study considering upstream parameters [33]. In view of the good adaptability and wide application background of the HNE-DS model, this paper estimates the tiny leakage flow of a single pipe. However, the HNE-DS leakage model is mainly used for fine simulation. In this paper, the lumped parameter modeling method is used, and the simulation accuracy is limited. In this case, the HNE-DS model does not have advantages. At the same time, the leakage of the evaporation tube is relatively complicated, which can be summarized in the four cases shown in Figure 3. In the case of A, the fluid leaked from the evaporation tube is directly injected into the flame, which has a great impact on the flame and even leads to extinguishment. In the case of B, part of the fluid leaked from the evaporation tube is sprayed into the flame, and part of it is discharged into the furnace. In case C, all the fluid leaked from the evaporation tube is discharged into the furnace through the heater. In the case of D, the fluid leaked from the evaporation tube is sprayed upward or downward and then atomized into steam, and all of it is discharged into the furnace. In the actual system, type D leakage is the most common. In this paper, type D micro-leakage is taken as the research object. The fluid network calculation method [34] is adopted for the calculation of leakage flow, and the calculation formula of leakage flow is as follows:
W leak = C ( P 1 2 P 2 2 )
The total admittance of evaporation pipe leakage is estimated inversely using Formula (1); in the estimation, the rated flow of feed water is used as the flow, the steam pressure of evaporation pipe is used as the upstream pressure, and the furnace rated pressure is used as the downstream pressure.

3.3. Mathematical Model of the Combustion Products

The mathematical model of the combustion products in the furnace chamber simulates the dynamic characteristics of the combustion zone based on gas parameters, atomized steam parameters, fuel parameters, and related components. The main balance relations considered are a mass balance of combustion, energy, and gas components. The mass balance of combustion: fuel oil, atomized steam, air, and the amount of steam leaked when considering the evaporation tube leakage failure, are fed into the chamber, and the main outflow of the chamber is flue gas. So, the fuel mass conservation equation of the chamber can be expressed as:
W gas = W oil + W h 2 o + W air + W leak
For the gas component mass balance, the main chemical reactions include hydrogen combustion to produce water vapor, carbon combustion to produce carbon dioxide, carbon combustion to produce carbon monoxide, carbon monoxide combustion to produce carbon dioxide, and a small amount of sulfur combustion to produce sulfur dioxide. The main chemical equations are as follows.
C + O 2 CO 2 C + 1 2 O 2 CO H 2 + 1 2 O 2 H 2 O CO + 1 2 O 2 CO 2 S + O 2 SO 2
The mass of oxygen required for the complete combustion of 1 kg of fuel is:
X O 2 = 32 ( C ar 12 + 0.5 H ar 2 O ar 32 + S ar 32 )
The calculation of the mass flow rates of each component in the flue gas when oxygen is sufficient: the fuel is completely burned, the CO in the flue gas is 0, and the components of the flue gas are generated according to the following formulas:
W O 2 , ex = W O 2 W oil X O 2
W H 2 O = W oil ( H ar 2 + M ar 18 ) × 18 + W h 2 o + W leak + W H 2 O , air
W CO 2 = W oil 44 C ar 12 + W CO 2 , air
W SO 2 = W oil 64 S ar 32 + W SO 2 , air
W N 2 = W oil N ar + W N 2 , air
Mass flow rate calculation of each component in the flue gas when oxygen is insufficient: the remaining oxygen in the flue gas is 0, and the flue gas components are calculated as follows:
W cb = W O 2 W oil ( 0.5 H ar / 2 O ar / 32 + S ar / 32 ) × 32 16 C ar / 12
W H 2 O = W cb ( H ar / 2 + M ar / 18 ) × 18 + W h 2 o + W leak + W H 2 O , air
W CO 2 = 44 [ W O 2 W oil ( C ar / 12 + 0.5 H ar / 2 O ar / 32 + S ar / 32 ) × 32 ] / 16 + W CO 2 , air
W CO = 28 [ W O 2 W oil ( 0.5 H ar / 2 O ar / 32 + S ar / 32 ) × 32 ] / 16 + W CO , air
W SO 2 = W cb 64 S ar 32 + W SO 2 , air
W N 2 = W cb N ar + W N 2 , air
The molar flow rate of the flue gas and the molar ratio of each component are derived from the above calculations as follows:
m gas = W O 2 , ex 32 + W H 2 O 18 + W CO 2 44 + W CO 28 + W SO 2 64 + W N 2 28
R O 2 = W O 2 , ex 32 m gas , R H 2 O = W H 2 O 18 m gas , R CO 2 = W CO 2 44 m gas , R CO = W CO 28 m gas , R SO 2 = W SO 2 64 m gas , R N 2 = W N 2 28 m gas

3.4. Correction of Flue Gas Physical Properties Parameters

As the composition of combustion products in turbocharged boilers changes considerably, the physical parameters of flue gas, such as density, specific heat at constant pressure, kinematic viscosity, thermal conductivity, and Prandtl number, are also changed. Therefore, it is necessary to correct the calculation of the flue gas physical parameters. In general, the flue gas is considered a mixture of ideal gases, and the correction coefficient is calculated based on the actual composition of the flue gas, and then a function of the flue gas’s physical properties parameters is established according to the calculation method of the physical properties parameters of multi-component gas mixtures. The density of flue gas is a function of the flue gas temperature, pressure, and molar ratio of each component, which is obtained by data fitting according to the relevant data in the Handbook of Thermophysical Properties of Substances Commonly Used in Engineering [35] and calculated as follows:
ρ gas = f ρ ( T , P , R O 2 , R H 2 O , R CO 2 , R CO , R SO 2 , R N 2 ) = P gas ( 32 R O 2 + 18 R H 2 O + 44 R CO 2 + 28 R CO + 64 R SO 2 + 28 R N 2 ) / ( 8314 T gas )
The specific heat of flue gas at constant pressure is a function of the temperature of the flue gas and the molar ratio of the components, as calculated by the following formula:
C pgas = f c p ( T , R O 2 , R H 2 O , R CO 2 , R CO , R SO 2 , R N 2 ) = 4.1868 [ 0.7 R O 2 C O 2 + 1.2444 R H 2 O C H 2 O + 0.50901 ( R CO 2 + R SO 2 ) C CO 2 + 0.8 R CO C CO + 0.8 R N 2 C N 2 ]
Among them:
C O 2 = 0.3097695 + 2.102232 × 10 6 T gas + 6 . 175837 × 10 8 T gas 2 - 5 . 39404 × 10 11 T gas 3 + 1 . 978219 × 10 14 T gas 4
C H 2 O = 0.3567226 + 2.4795243 × 10 5 T gas + 5 . 72072221 × 10 8 T gas 2 - 3 . 5393369 × 10 11 T gas 3 + 9 . 1538884 × 10 15 T gas 4
C CO 2 = 0 . 38231419 + 2 . 5207184 × 10 4 T gas - 1 . 6633384 × 10 7 T gas 2 + 7 . 6427112 × 10 11 T gas 3 - 2 . 0555466 × 10 14 T gas 4
C CO = 0 . 17661723 + 1 . 7788785 × 10 4 T gas - 2 . 6438212 × 10 7 T gas 2 + 1 . 7190313 × 10 10 T gas 3 - 2 . 0249676 × 10 14 T gas 4
C N 2 = 0.30929091 - 3.5619473 × 10 6 T gas + 6 . 0760977 × 10 8 T gas 2 - 4 . 7710105 × 10 11 T gas 3 + 1 . 543612 × 10 14 T gas 4
The kinematic viscosity of flue gas is a function of flue gas temperature, flue gas pressure, mass fraction of each component, and flue gas density, calculated as follows:
μ gas = f μ ( T , P , g O 2 , g H 2 O , g CO 2 , g SO 2 , g N 2 ) = 1.388 ( 1.2622 g O 2 T + 138 + 1.8875 g H 2 O T + 1191 + 1.1394 ( g CO 2 + g SO 2 ) T + 252 + 1.0385 g N 2 T + 118 ) × 10 6 T 1.5
γ gas = μ gas ρ gas
Thermal conductivity of flue gas:
λ gas = f λ ( T , R O 2 , R H 2 O , R CO 2 , R CO , R SO 2 , R N 2 ) = λ i R i M i 1 3 R i M i 1 3
Prandtl number of smoke:
Pr gas = μ gas C pgas λ gas

3.5. Energy Conservation of Fuels

The conservation of energy in the combustion zone involves the heat generated by various combustion reactions and the physical, sensible heat of the air and fuel fed into the furnace, so the effective heat input to the furnace is:
Q in = W oil C oil T oil , in + W air , in C p , air T a i r + W cb Q net
C p , air , C oil obtained by polynomial fitting, the method is from Preparation and Application of Calculation Procedures for Thermophysical Properties of Work Substances [36], and the data are cited from Handbook of Thermophysical Properties of Substances Commonly Used in Engineering [35]:
C p , air = 1 . 03409 - 0 . 000284887   ( T air + 273 . 25 ) + 7 . 81682 × 10 7 ( T air + 273 . 25 ) 2 -   4 . 97079 × 10 10 ( T air + 273 . 25 ) 3 + 1 . 07702 × 10 13 ( T air + 273 . 25 ) 4
C oil = 2 . 2827 + 0 . 0006 T oil , in
Theoretical combustion temperature of the furnace chamber:
T th = Q in W gas C p , gas
Some modules and parameters of the boiler, such as air excess coefficient, radiation module, and unidirectional media heat exchanger, were obtained from related research results of North China Electric Power University [37,38]. Others are related to the author’s previous work [26,27,28,39].

3.6. Simulation Verification

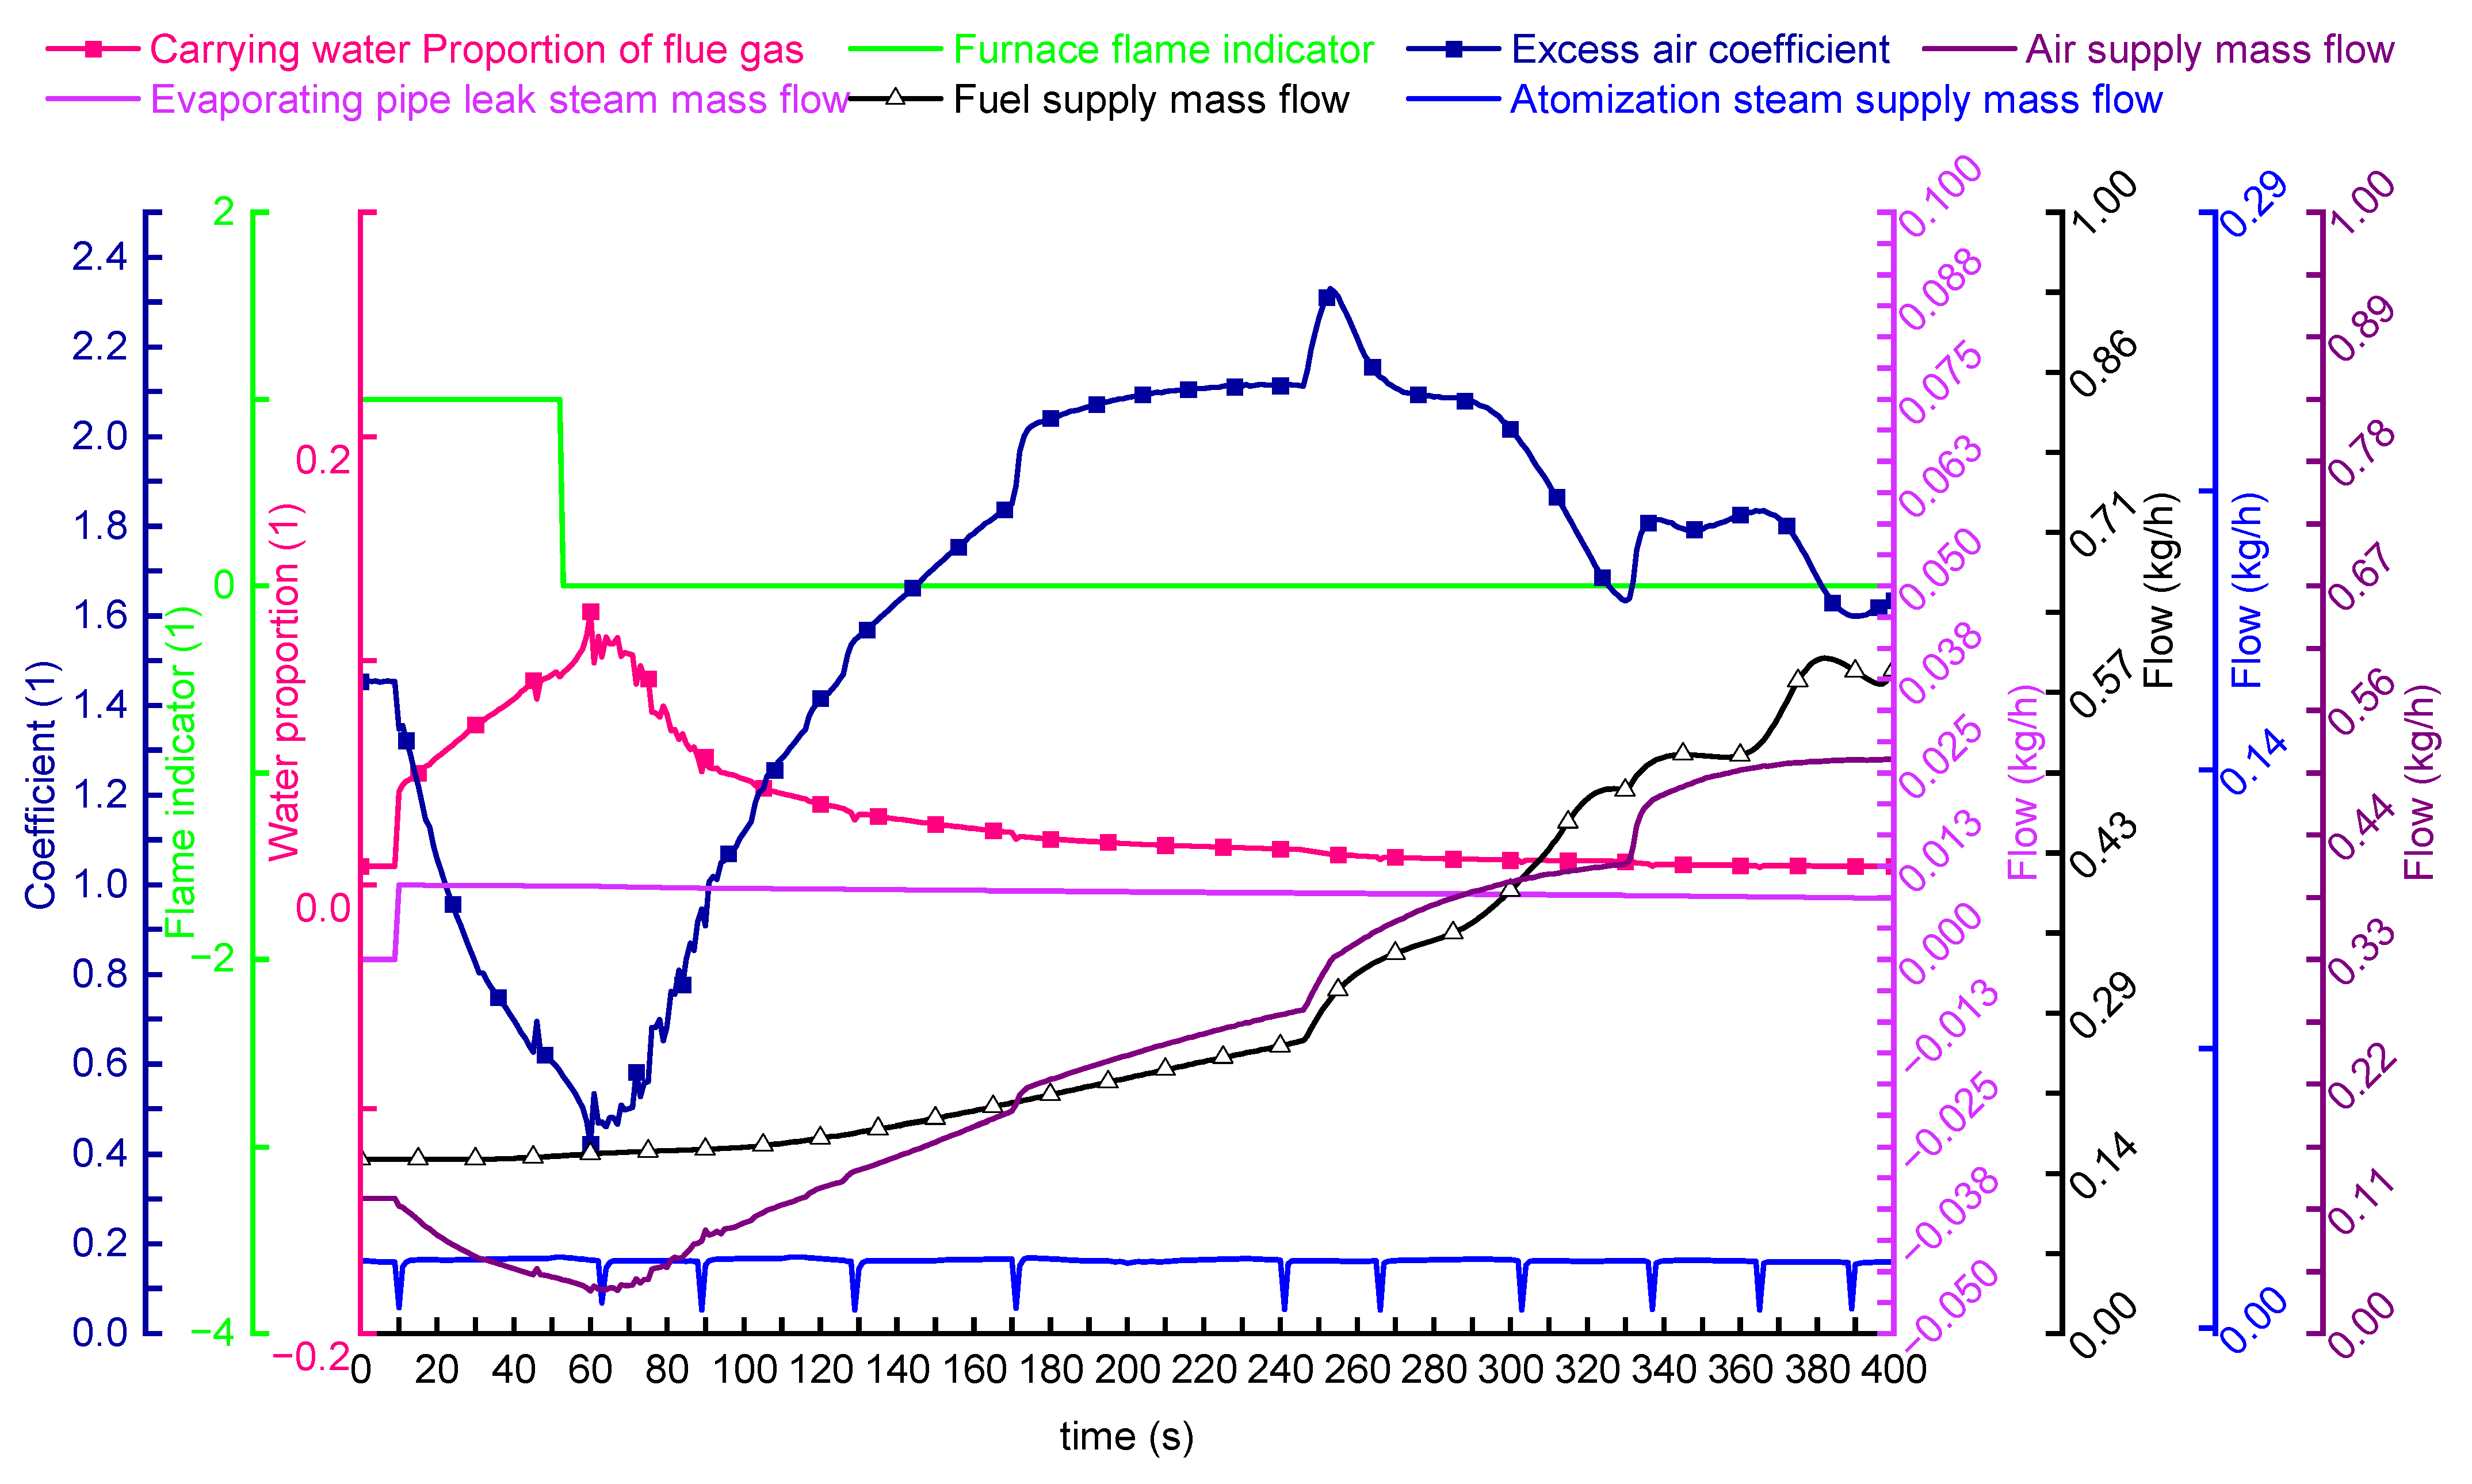
During the years of operation of a supercharged marine boiler, leakage faults of evaporation pipe occur frequently, and a large number of valuable empirical data can be used for reference. Typical leakage faults of evaporation pipe can be described as the rise of furnace pressure, white smoke from the chimney, furnace flameout, etc. To verify the feasibility of the micro-leakage fault simulation model, the typical leakage fault experiences are used as the analysis data. The leakage occurs 10 s after the stable combustion of the boiler, and the max steam leakage is 1% of the total quality of feed water. The objects analyzed are a set of internal parameters in the furnace affecting combustion and heat transfer, including the proportion of water in the gas after leakage; an increase means that the smoke emitted is white; combustion indication, where a change to 0 means furnace flameout; air excess coefficient, the main factor ensuring the normal combustion of the furnace; air supply flows, which decrease when the furnace pressure is rising; team leakage flow rate; fuel flow; and atomized steam flow.
The fault evolution process of internal parameters is shown in Figure 4. It can be seen that when the system operated stably 10 s before, the steam leakage suddenly increased in 10 s, the proportion of water in flue gas increased gradually, the air supply decreased, the fuel flow increased, the excess air coefficient decreased, and the boiler flameout was caused by the air excess coefficient being too low and exceeding the limit in 52 s. To verify the combustion mechanism, the fuel flow’s quick shut-off valve is disabled in the experiment so that the ventilation continues after flameout, the amount of fuel and air supply increases continuously, the air excess coefficient increases, and the leakage flow decreases to a certain extent, due to the decrease of drum pressure. The whole process accords with the combustion mechanism and fault experience of this type of boiler.

4. Simulation Experiments and Analysis of Simulation Results

4.1. Simulation Experiment Design

In general, the experimental parameters respond more clearly under commonly used fixed boundary conditions, but the fixed boundary conditions, such as the control system put into the manual or solidified part of the boiler auxiliary system operation environment, are not the typical conditions of the actual steam-power system. Auxiliary systems of power systems are always supported when the units are running in rated operating conditions, and the control systems are always utilized to the maximum extent possible [4]. Therefore, to make the research results more instructive to the operators, the simulation experiment condition selected in this paper is that the system operates fully automatically and all auxiliary systems are loaded. To ensure a longer physical or chemical response, the boiler and main turbine protection inputs are canceled in the experiments. In Table 1, seven groups of experiments are set up to distinguish normal load disturbances from fault responses.
The experiment was recorded from a steady state. One hundred forty related variables were monitored in each group of experiments at the same time, and the dynamic changes were recorded for 400 s, the input micro-leakage disturbance variable at the 10th second, and recording stopped after 400 s. The chart line comparison method is used to analyze combustion balance and steam-water balance by selecting 14 variables from 140 related variables, extracting relevant parameters from seven groups of data, and comparing the results; a comparison of normal dynamic response characteristics and fault dynamic response characteristics were made. The selected 14 variables and their locations are shown in Table 2.
Due to the confidentiality of the research object, the relevant sensitive parameters are dimensionless. To accurately express the physical meaning, the vertical coordinate of the figure is the actual parameter value/rated parameter value, and the vertical coordinate unit maintains the original physical quantity unit.
Table 2. The selected parameters and their locations.
NO.Parameters NameCompare in Which FigureLocation in Figure 1 Schematic Flow Diagram of System
1leak steam mass flow of riser tubesFigure 5leak steam(Yellow arrow)
2Fuel supply mass flowFigure 6NO.1 Fuel
3Air supply mass flow Figure 7NO.2 Air
4Excess air coefficientFigure 8NO.2 Air /NO.1 Fuel
5Flue gas temperature at of superheater outletFigure 9NO.12 Flue gas’ temperature at NO.6 Superheater’s outlet
6Carrying water Proportion of flue gasFigure 10(NO.3 + leak steam)/(NO.1 + NO.2)
7Furnace pressure Figure 11NO.4 Furnace’s pressure
8Speed of Turbocharger Unit Figure 12NO.13 Turbocharger Unit’s speed
9Steam drum water levelFigure 13NO.8 Steam drum’s water level
10Steam drum pressureFigure 14NO.8 Steam drum’s steam pressure
11Superheated steam consumption mass flowFigure 15NO.6 Superheater’s outlet steam flow
12Water supply mass flowFigure 16NO.11 Feed Water
13Superheated steam temperatureFigure 17NO.6 Superheater’s steam temperature
14Saturated steam consumption mass flowFigure 18NO.9 Saturated steam

4.2. Combustion Balance Analysis

Combustion balance refers to the proper matching of fuel supply and air supply in the furnace with stable combustion. This section analyzes the similarities and differences between normal dynamic response characteristics and the faults’ dynamic response characteristics on the basis of judging combustion stability. The main variables include evaporation pipe leakage, fuel supply, air supply, flue gas temperature after superheater, the proportion of water in flue gas, furnace pressure, and turbocharger unit speed. Relevant results are shown in Figure 5, Figure 6, Figure 7, Figure 8, Figure 9, Figure 10 and Figure 11.
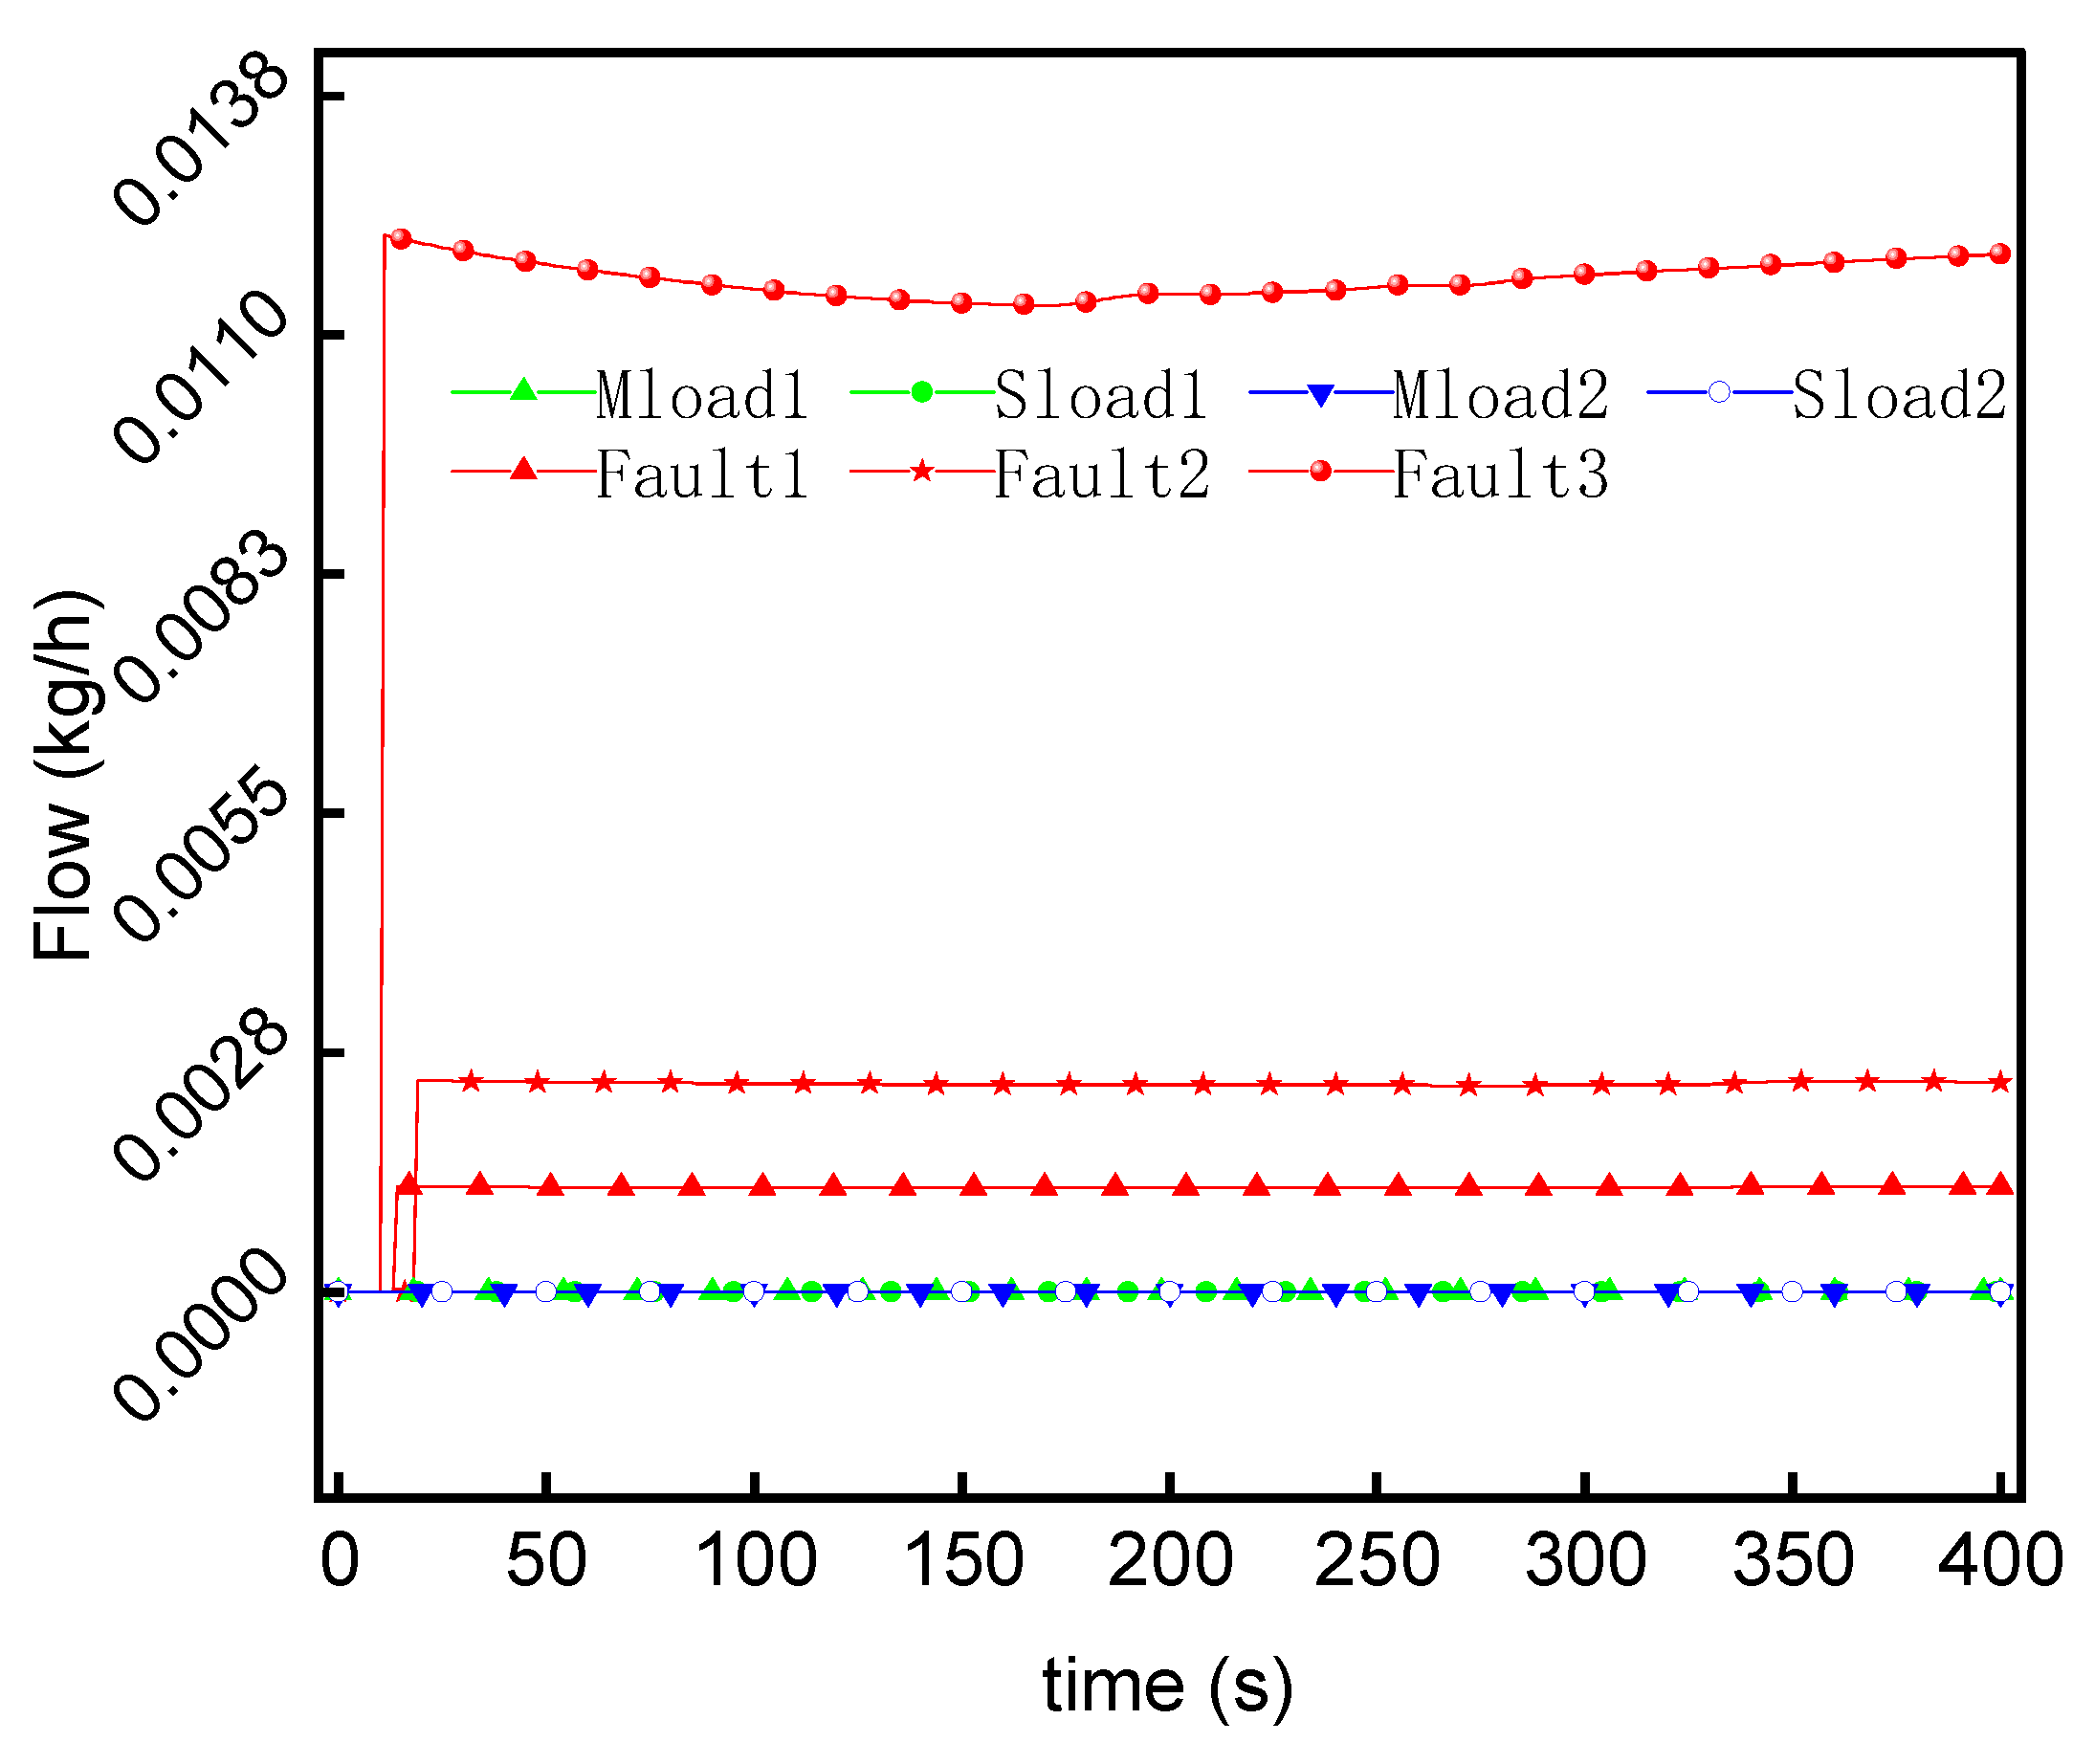
It can be seen from Figure 5 that the leakage under normal load disturbance is 0, and the leakage flow increases significantly with the increase in leakage size.
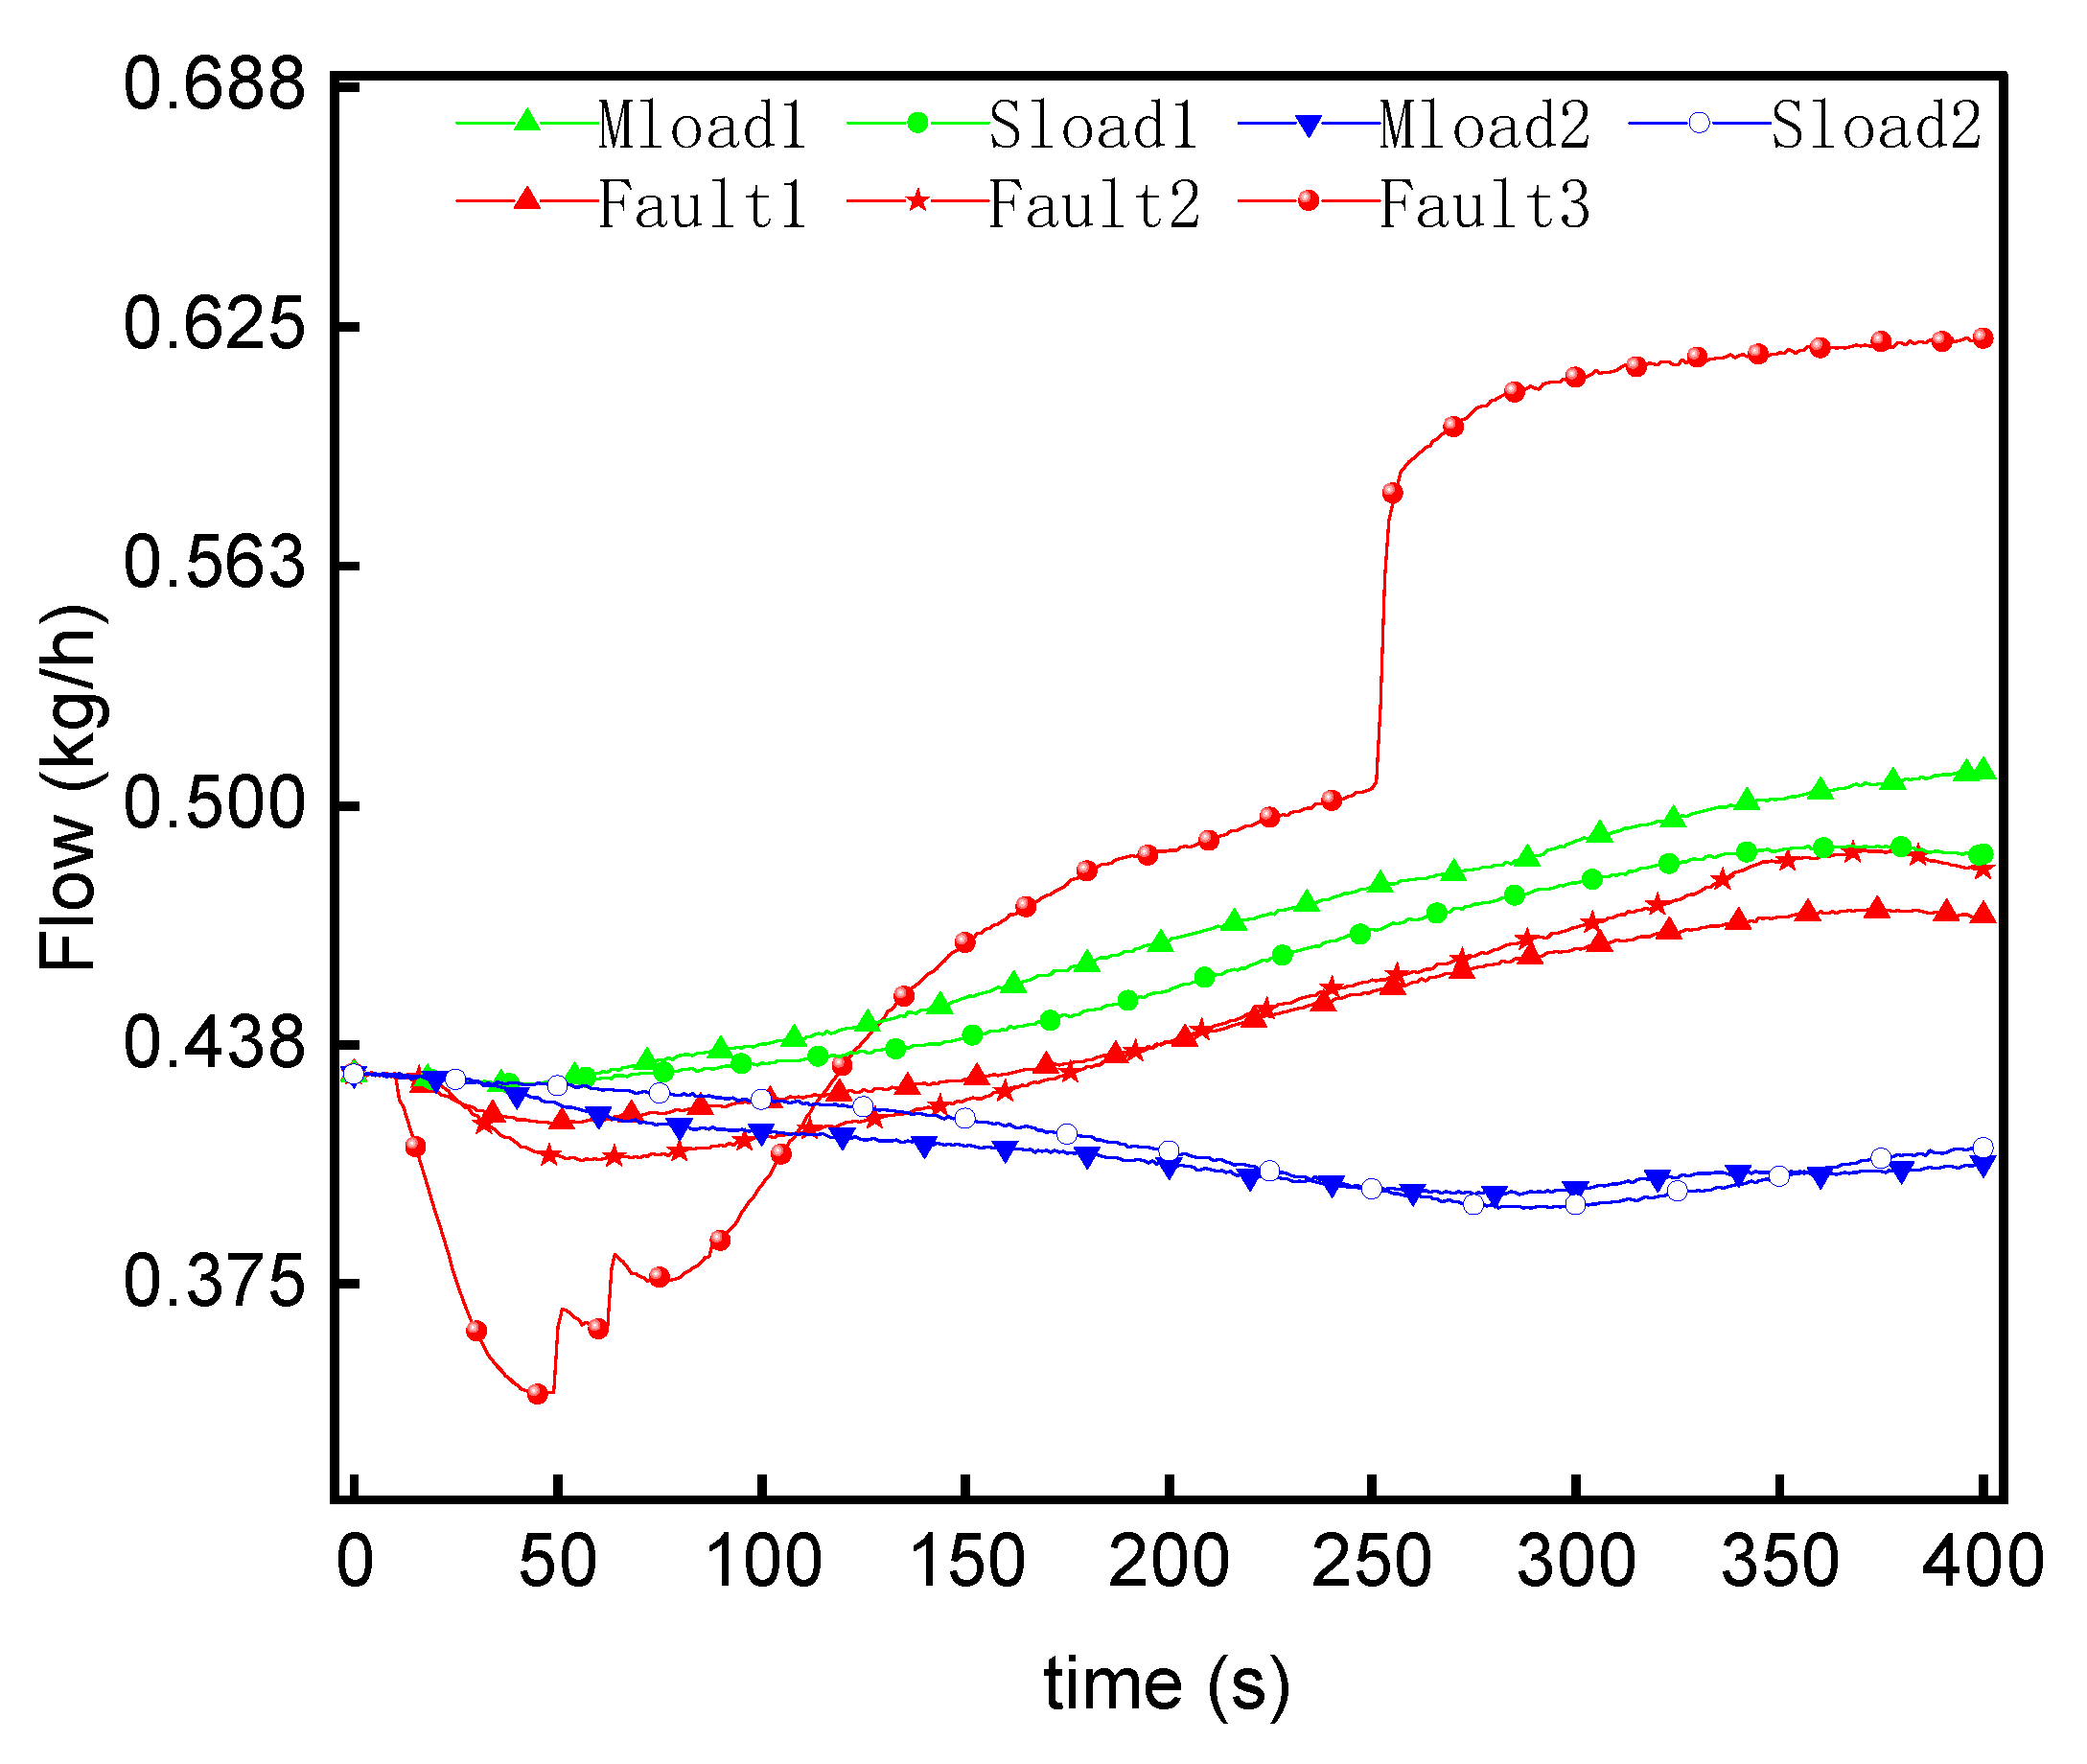
As shown in Figure 6, the fuel supply mass flow shows the following characteristics: the fuel supply flow decreases when the load is reduced, the fuel supply flow increases when the load is increased, or the evaporation pipe leaks occur. The bigger the fault, the greater the disturbance of the curve; after 300 s, most curves tend to be stable. However, the change of the fuel supply for the largest fault after approaching the balance is nearly twice as large as the normal load disturbance.
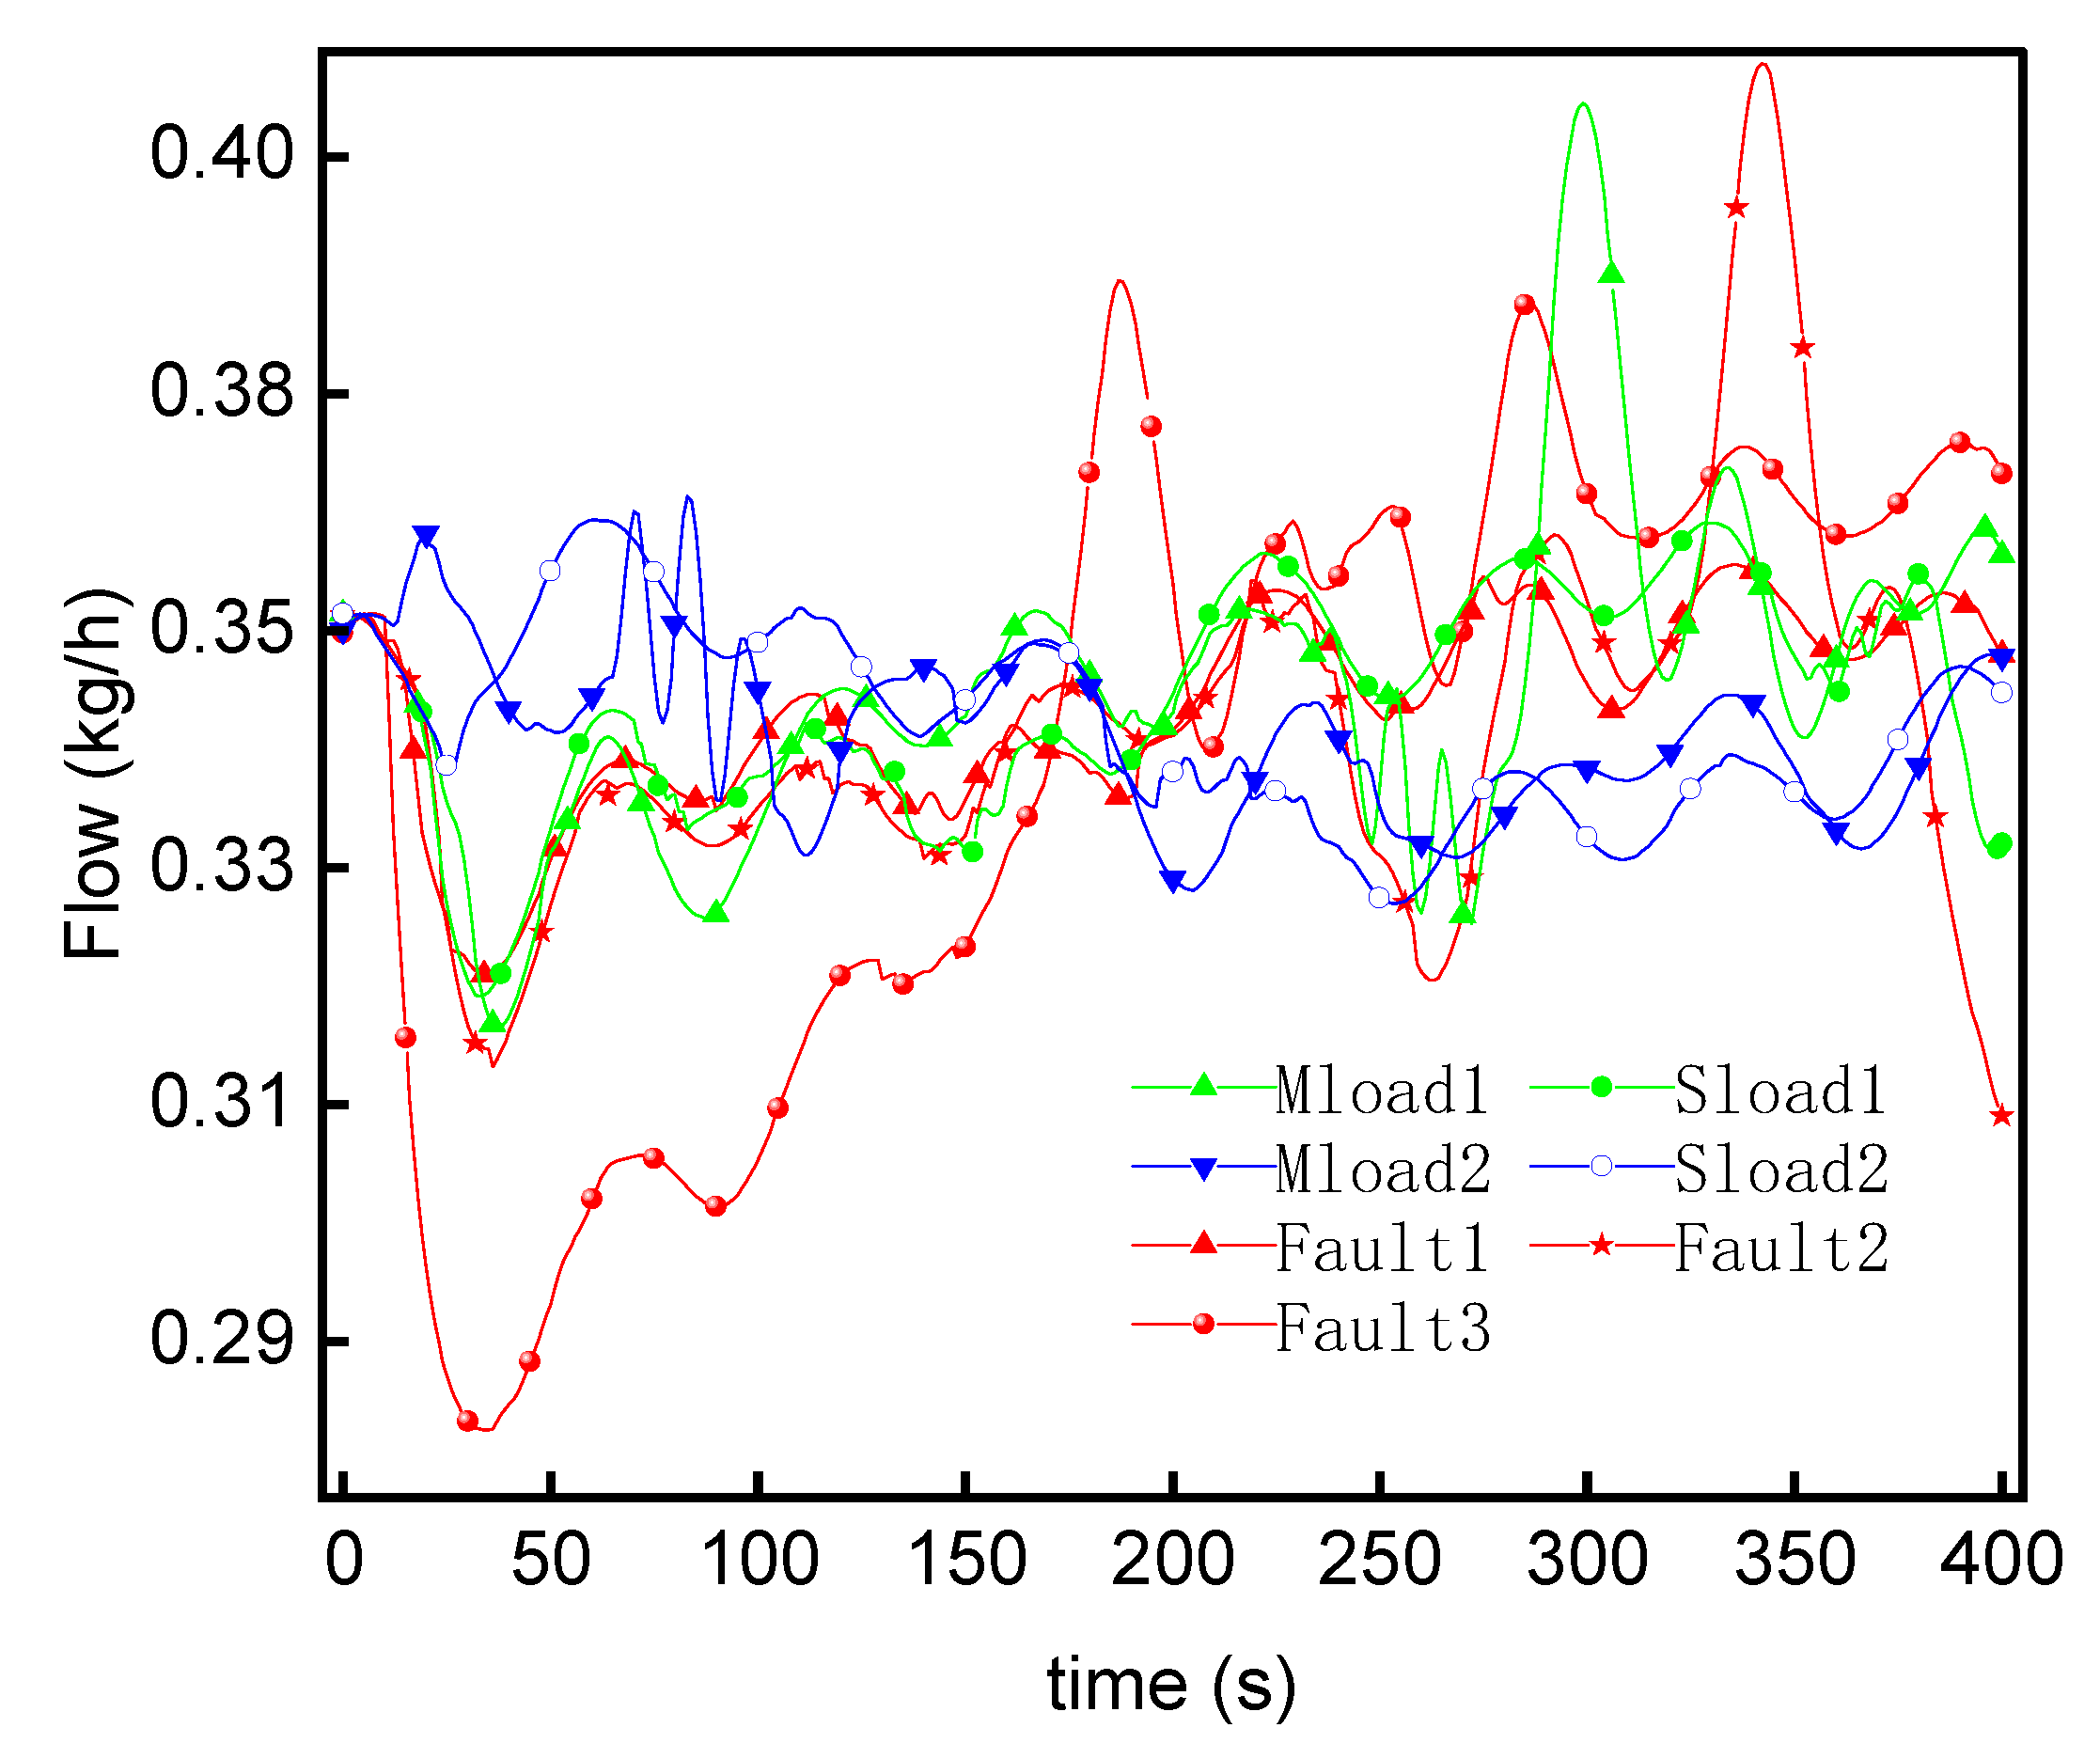
As shown in Figure 7, the air supply flow decreases when the load is reduced and increases when the load is increased. In the case of micro-leakage of the evaporation tube, the air supply volume first decreases and then increases in a short time, and Fault3, representing the fault of maximum micro-leakage, is more disturbed than the other curves. Most curves tend to be stable after 300 s, but the change in the largest fault after approaching the balance is nearly triple the size of the normal load disturbance.
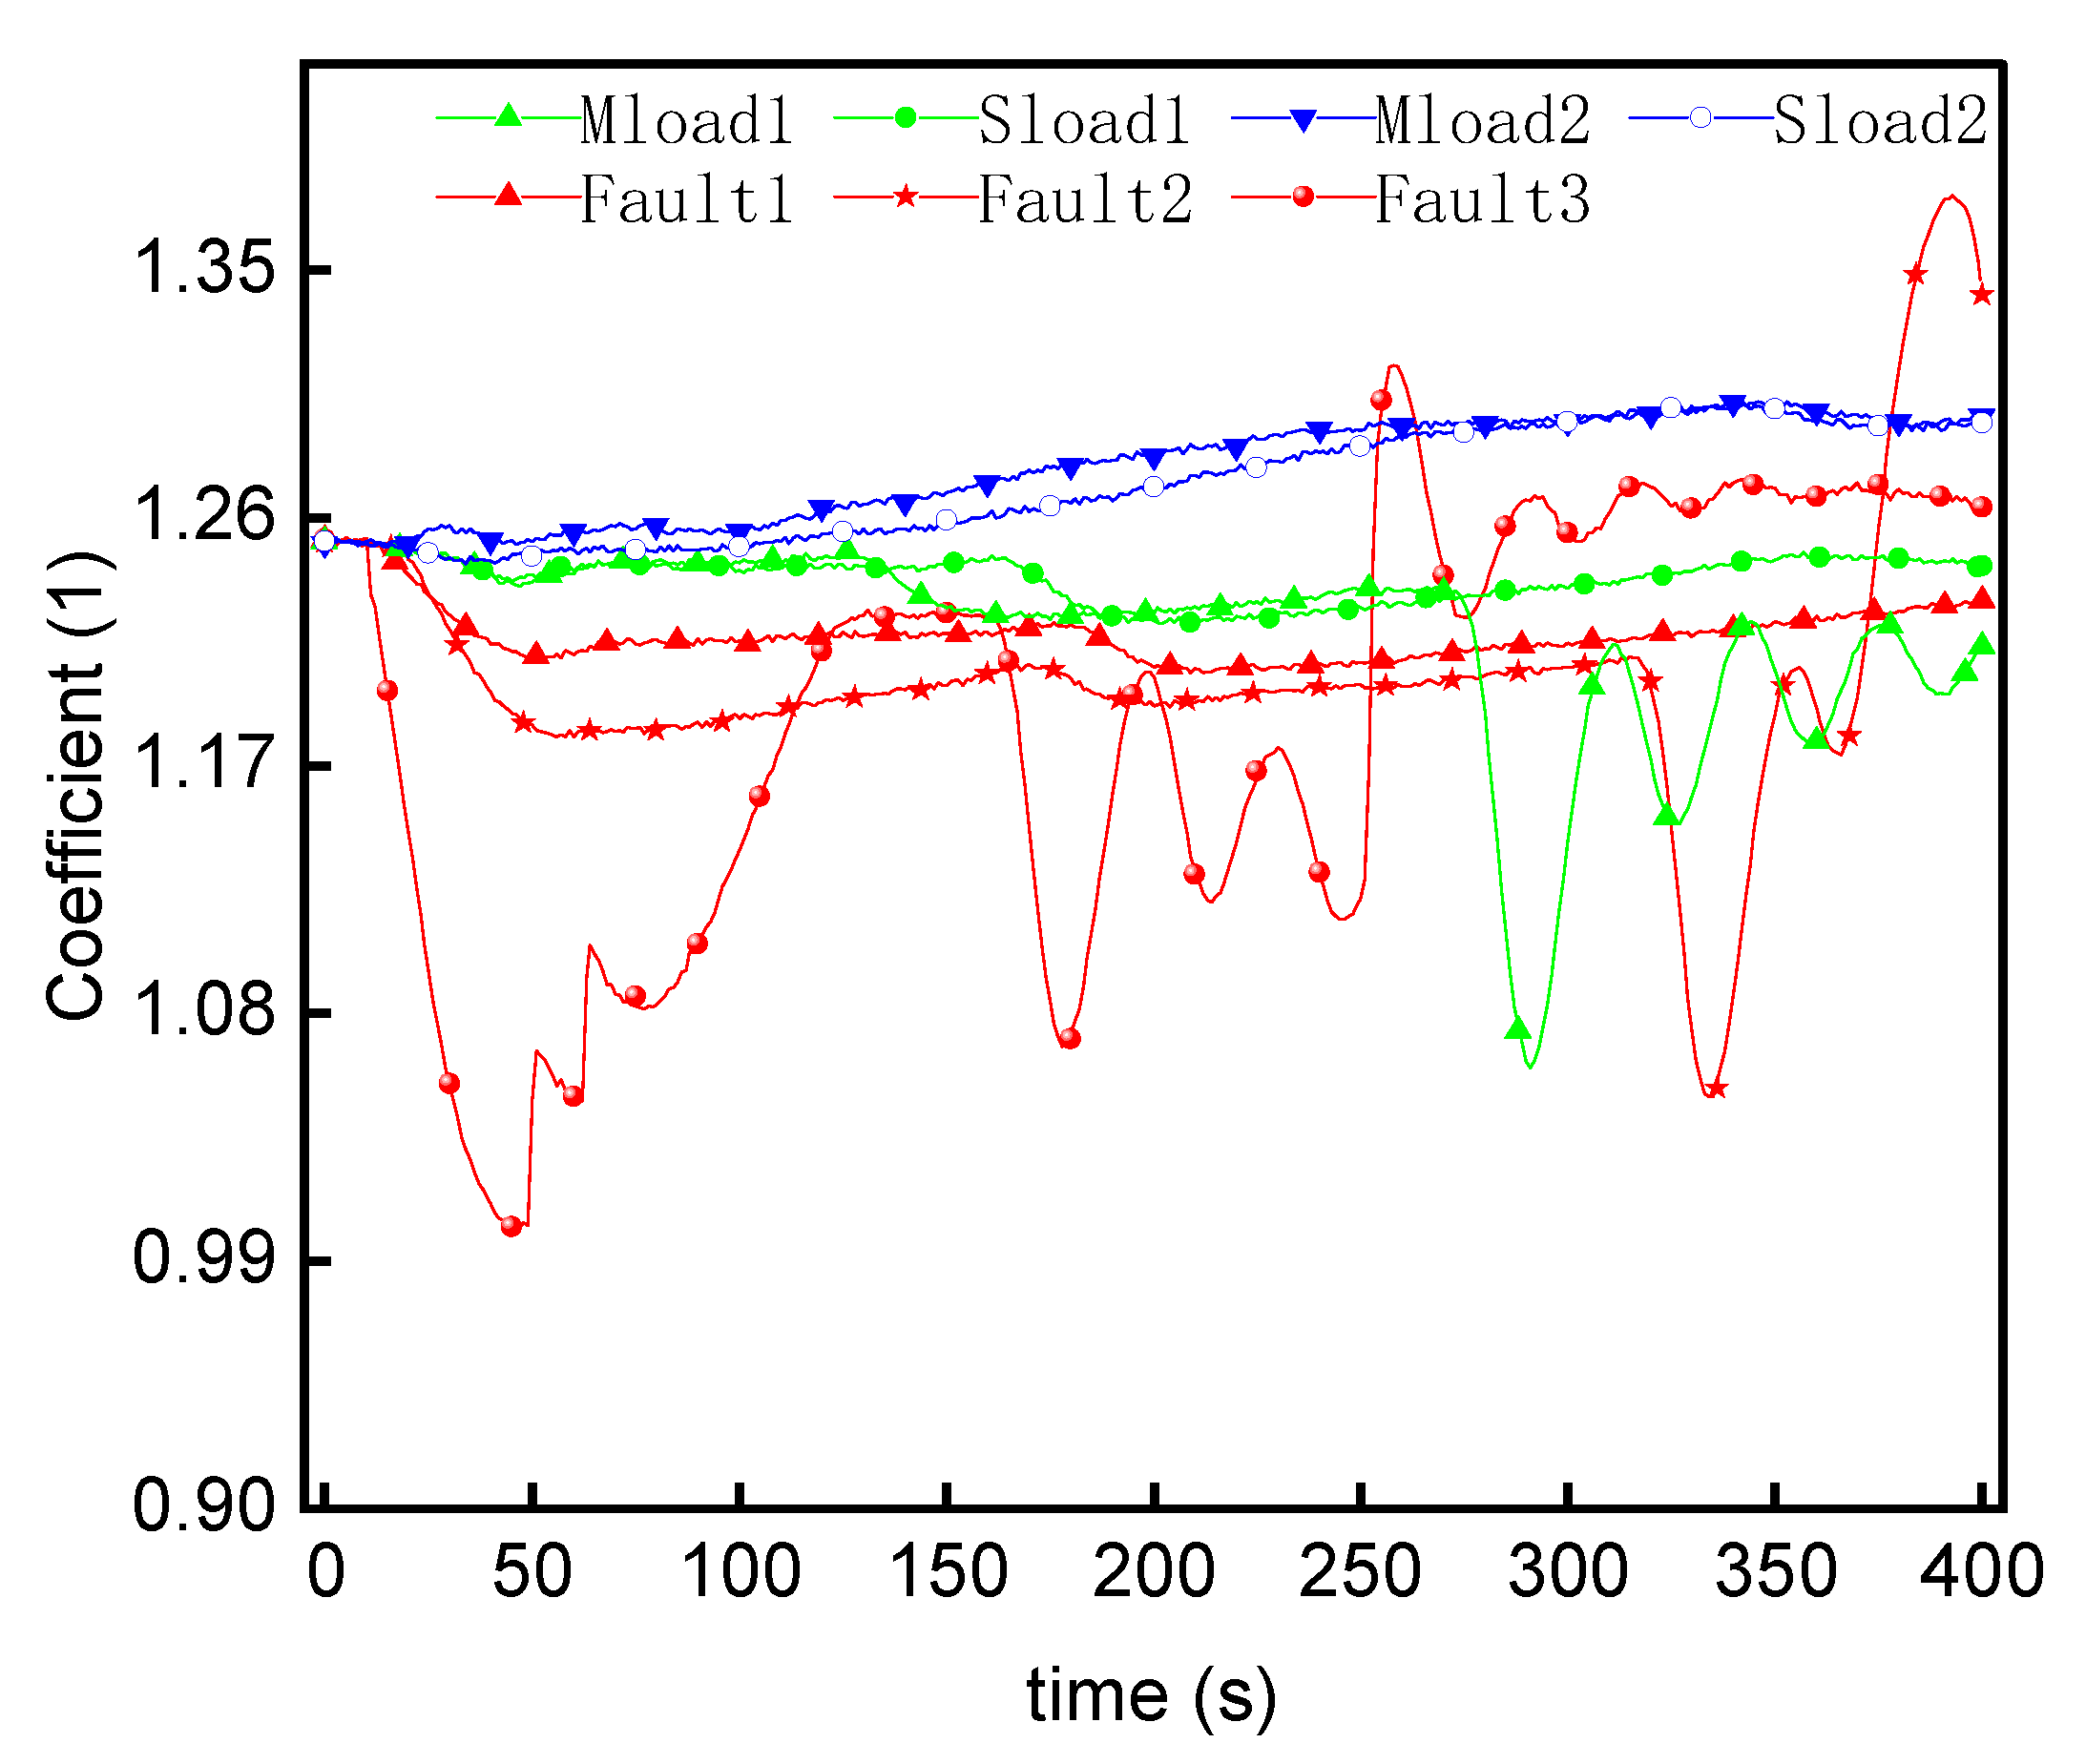
As shown in Figure 8, when increasing and decreasing load, the disturbance of air excess coefficient is small, and the changing at the front and back periods are smooth. When the fault occurs, although the overall characteristics are similar to the load-raising characteristics, the disturbance in the early stages is large. According to the air supply change in Figure 7, the main reason for the imbalance in air oil matching is the disturbance of air supply in the early stage of the micro-leakage of the evaporation pipe.
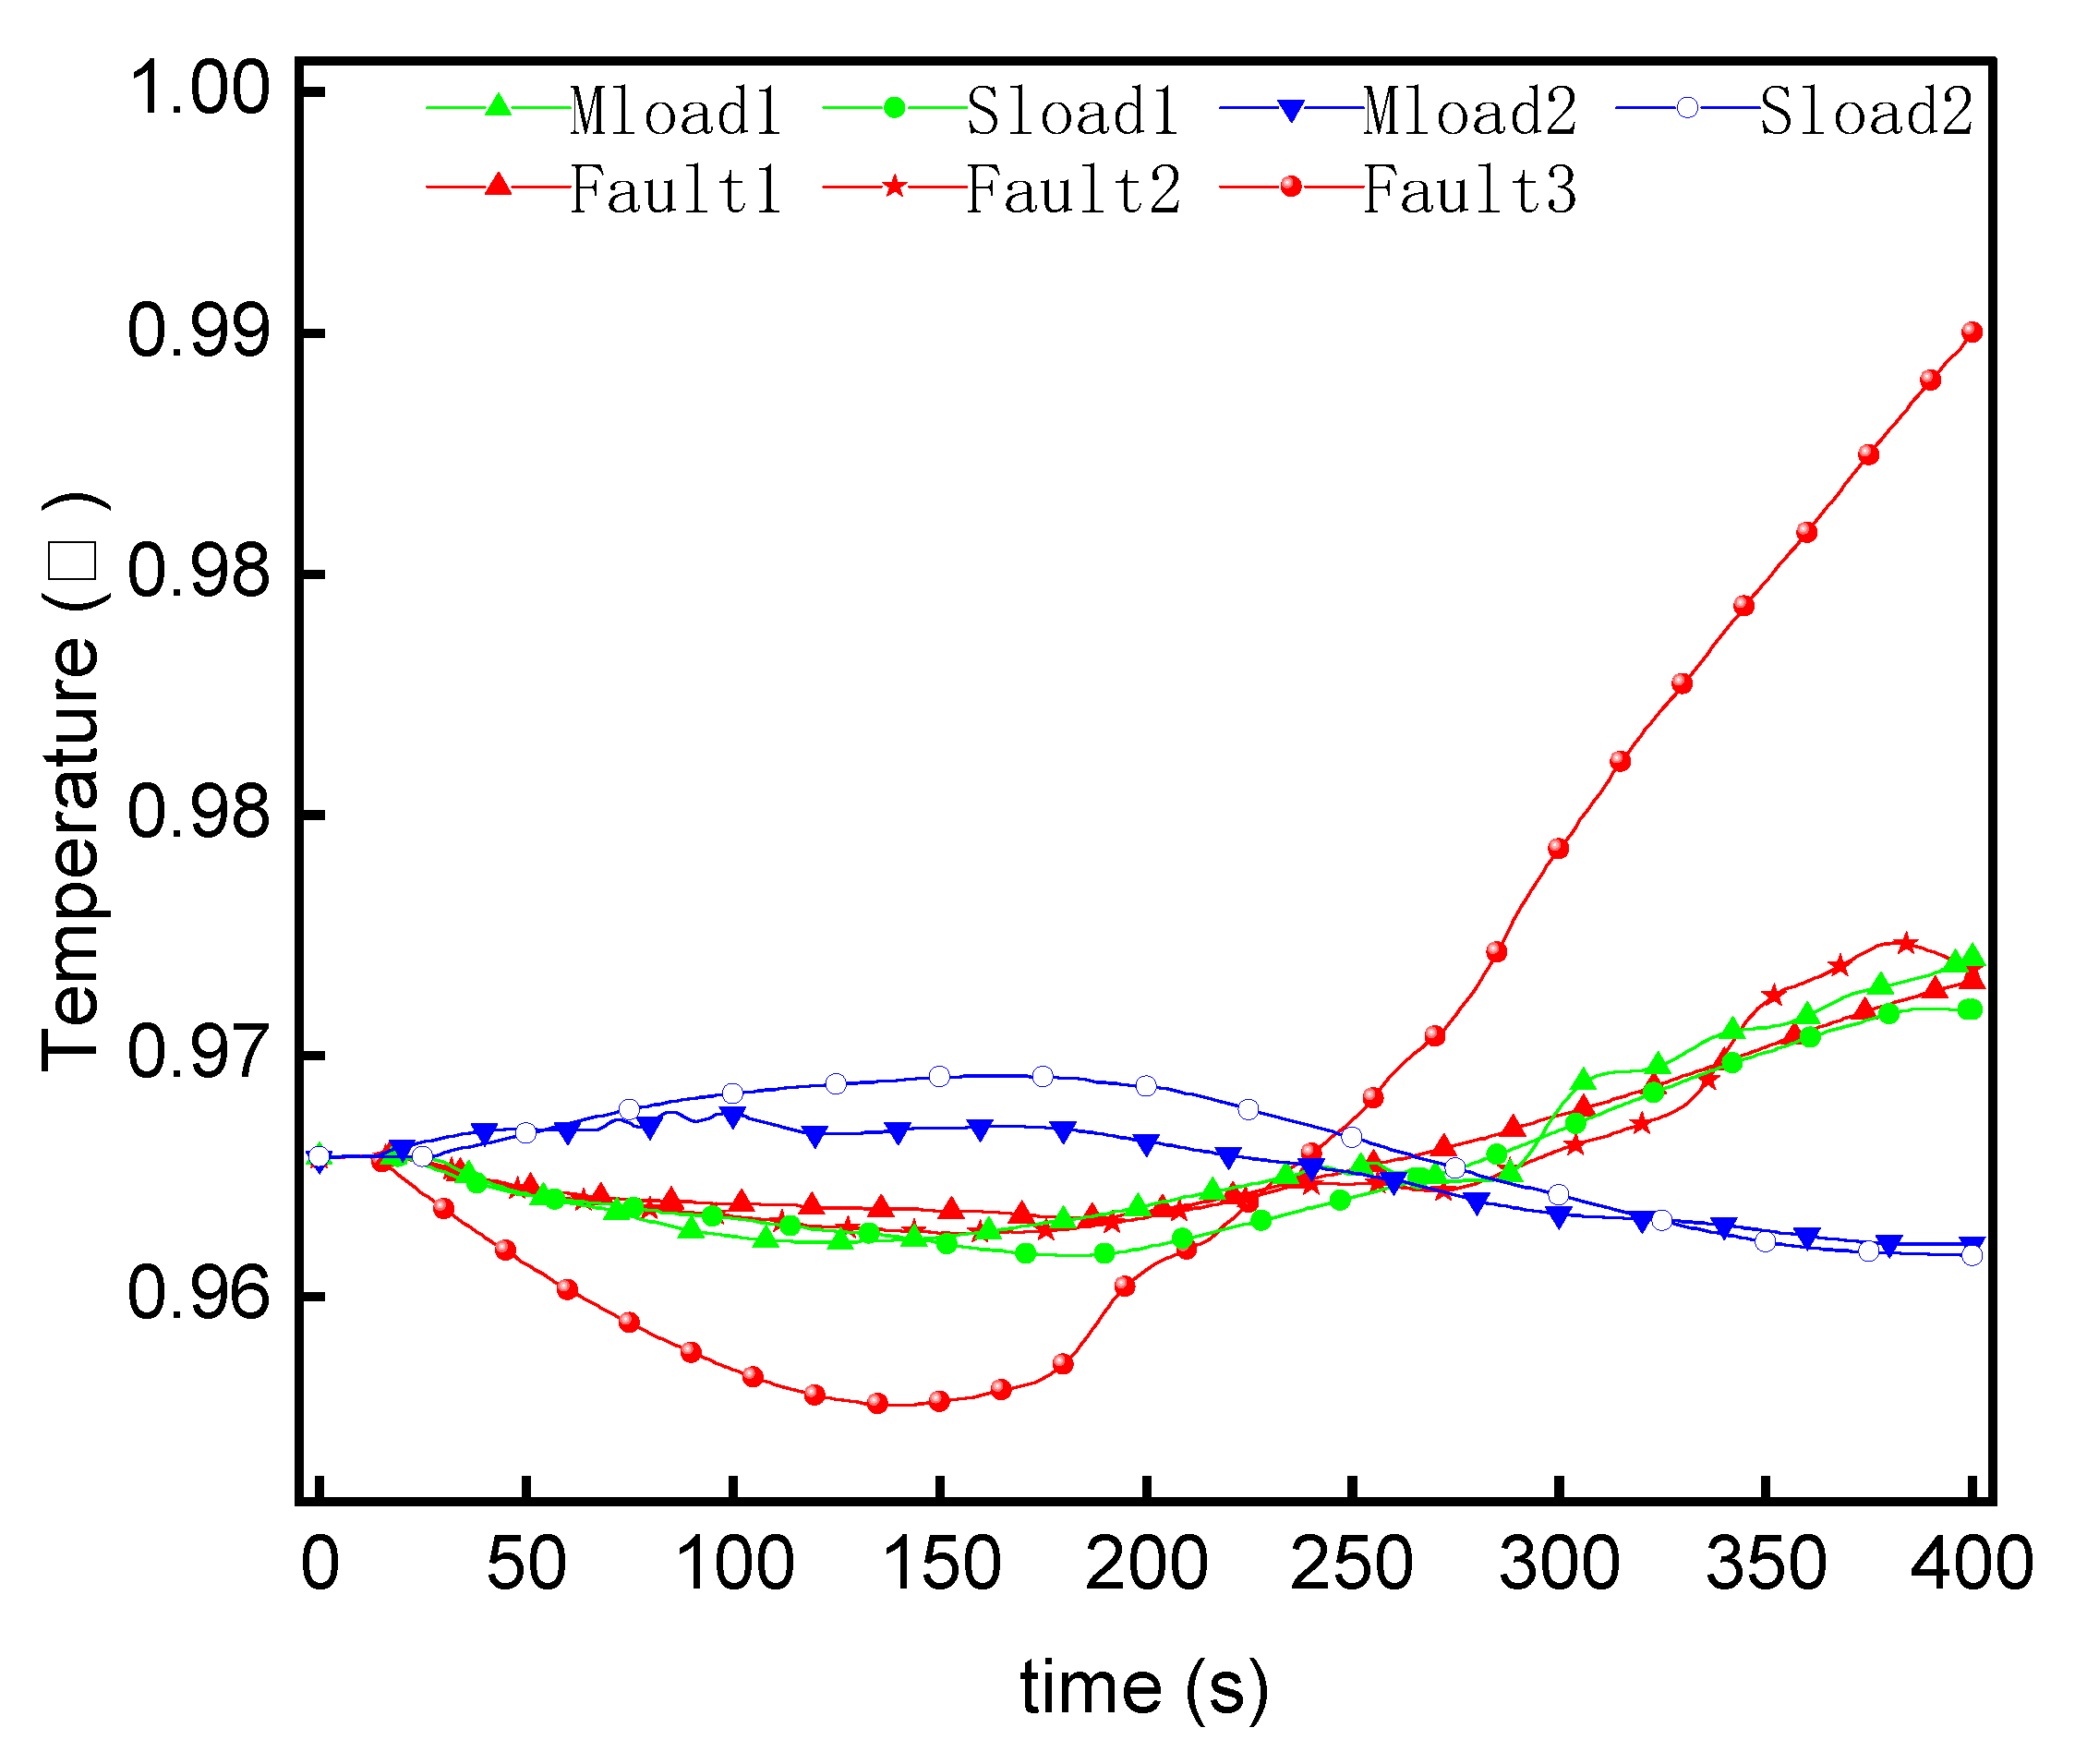
As shown in Figure 9, the flue gas temperature at the superheater outlet decreases when the load is reduced and increases when the load is increased. In the case of micro-leakage of the evaporation tube, the temperature first decreases and then increases in a short time, and Fault3, which represents the maximum fault of micro-leakage, has greater disturbance than other curves. According to Figure 6, Figure 7 and Figure 8, we can find the reason for the large disturbance of Fault3. The drop in Fault3 in the first 50 s is more than 0.03, mainly because the drop rate of the excess air coefficient is the largest in the first 50 s, and the excess air coefficient value below 1.0 indicates that the furnace combustion is insufficient. At the same time, the rising range of Fault3 exceeds 0.09 in 50–300 s, mainly because Fault3 has the largest steam leakage flow, which leads to the largest reduction in combustion efficiency. The automatic control system adjusts the air supply and fuel supply to supplement the combustion efficiency at a higher rate in the range of 50–300 s until 300 s later when the balance is reached.
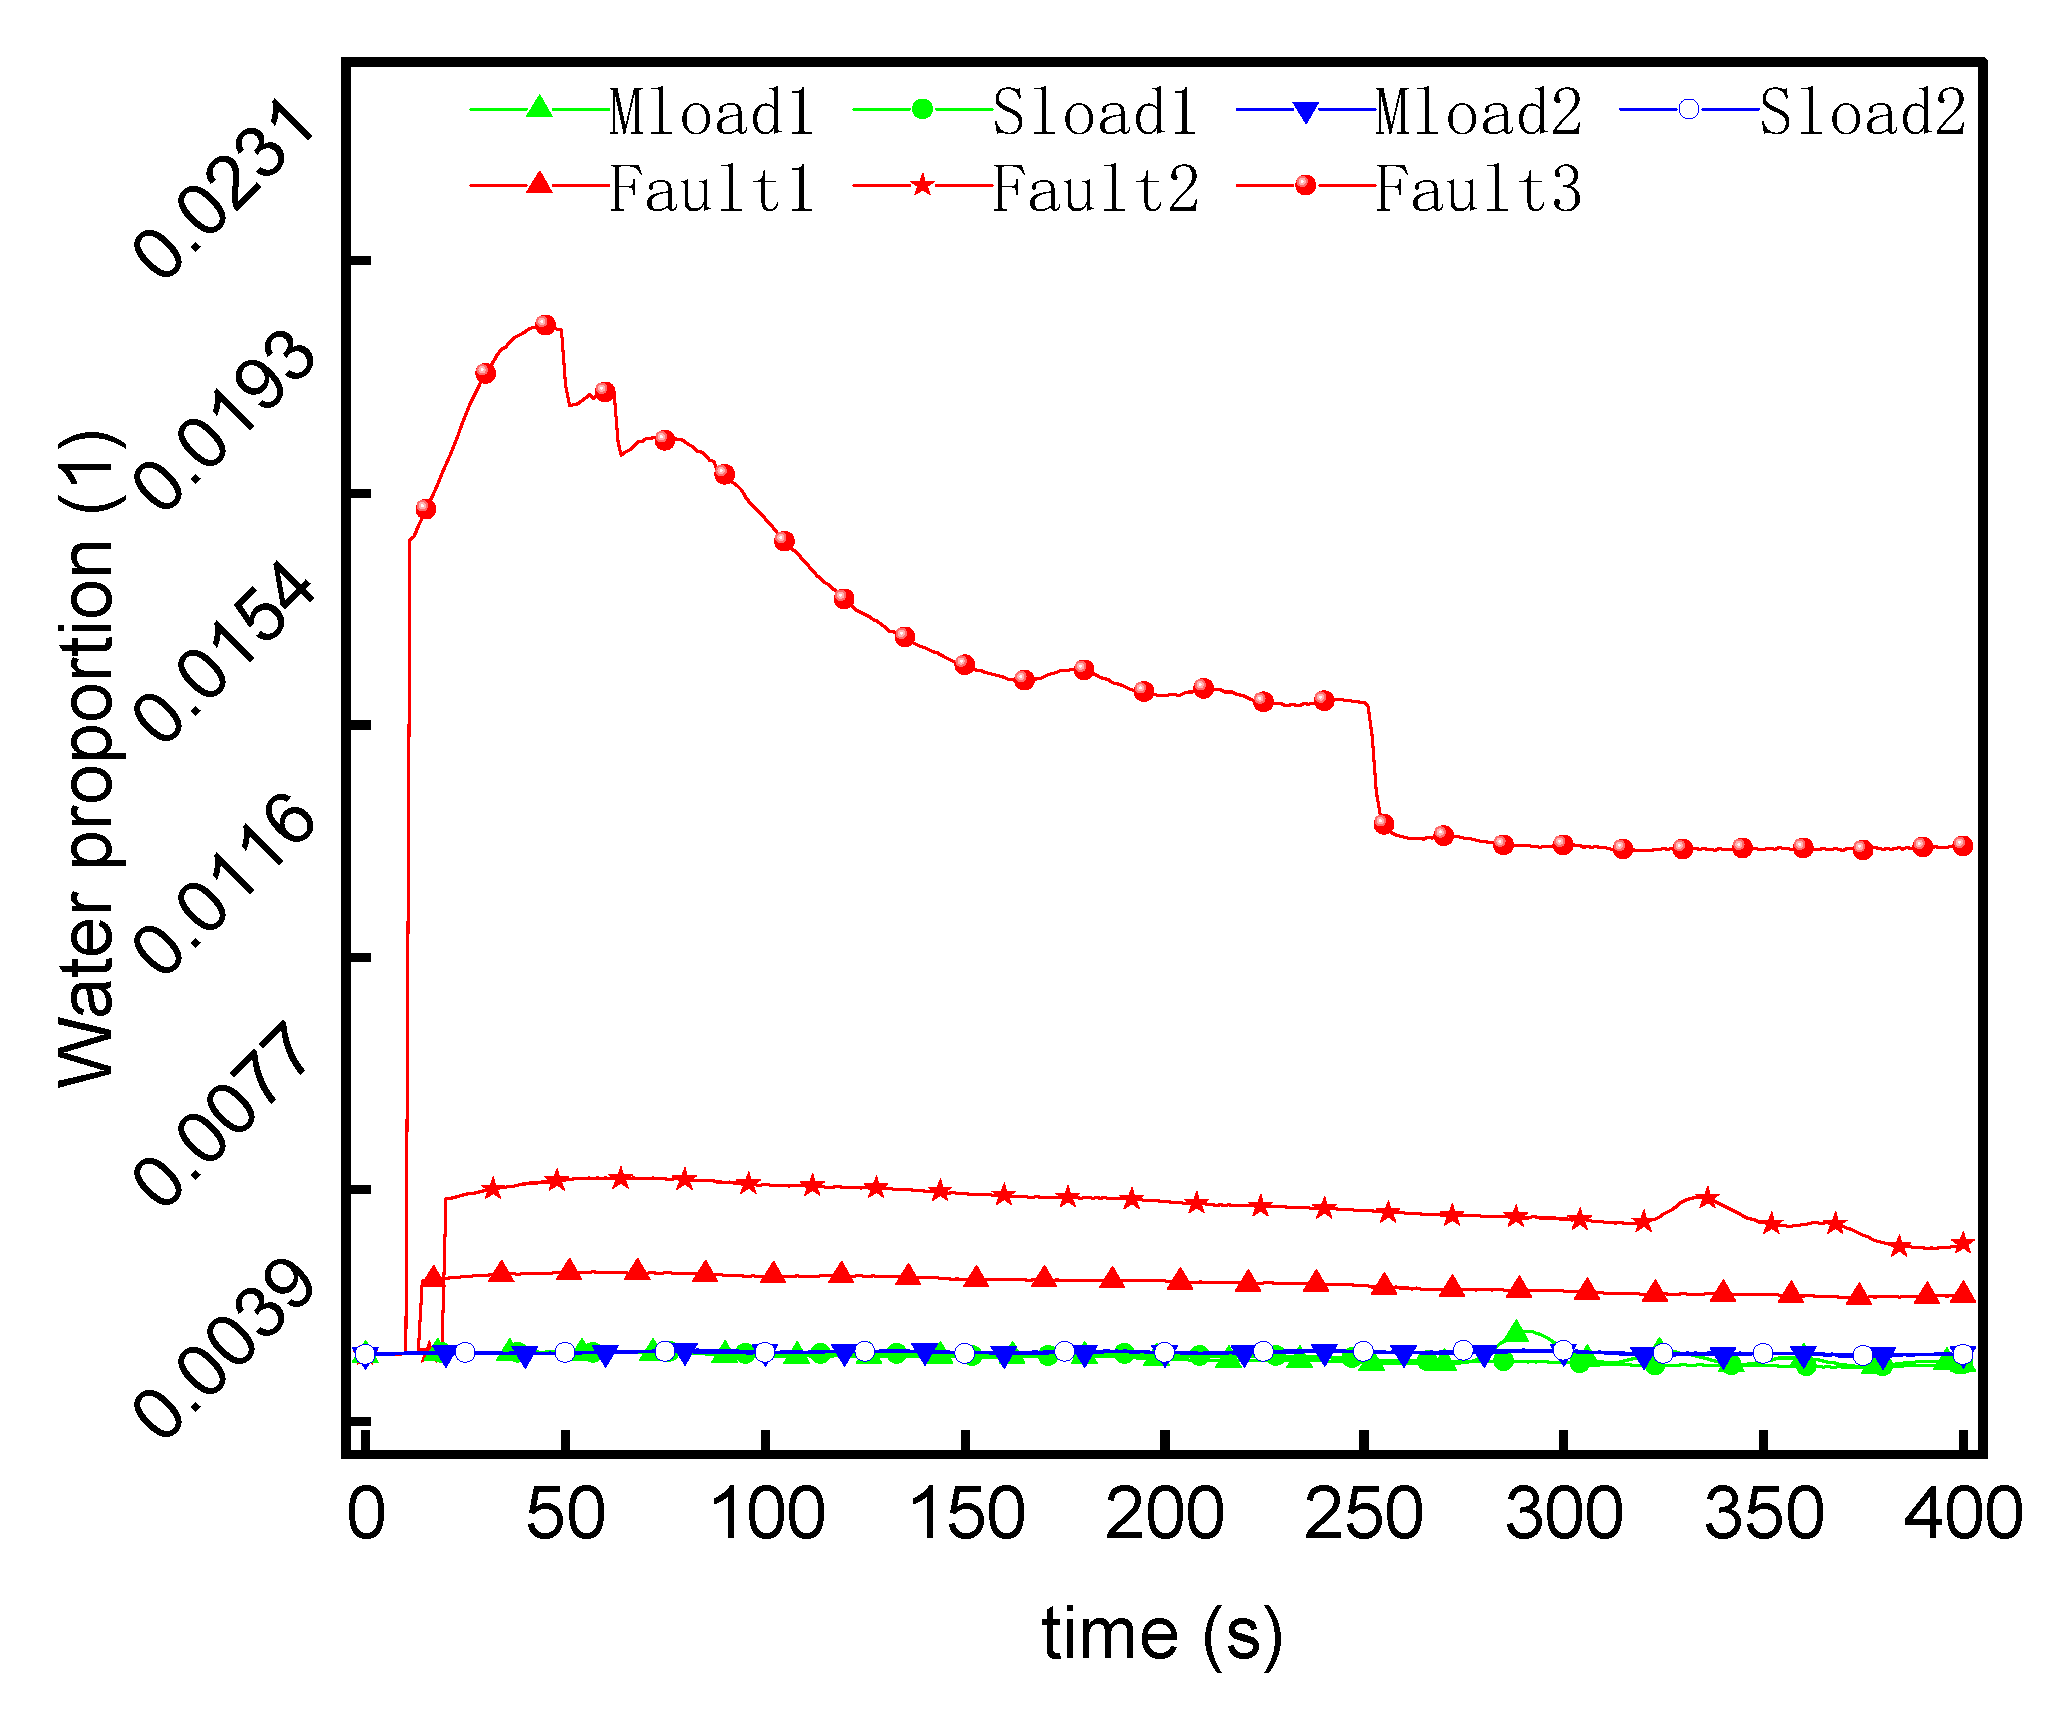
As shown in Figure 10, the carrying water proposal of flue gas is smooth and stable during load increases and decreases. It rises sharply in a short time when the evaporation tube leaks slightly and decreases slightly after that. The increase of this parameter represents the increase of water vapor content in the flue gas. When it increases to a certain extent, a large amount of white water vapor is mixed in with the flue gas and flows out of the flue gas channel; the external performance is white smoke from the chimney [40].
As shown in Figure 11, the furnace pressure decreases when the load is reduced, increases when the load is increased, and rises rapidly and sharply at an abnormal speed when the evaporation tube leaks slightly. The fault phenomenon is consistent with the literature [40].
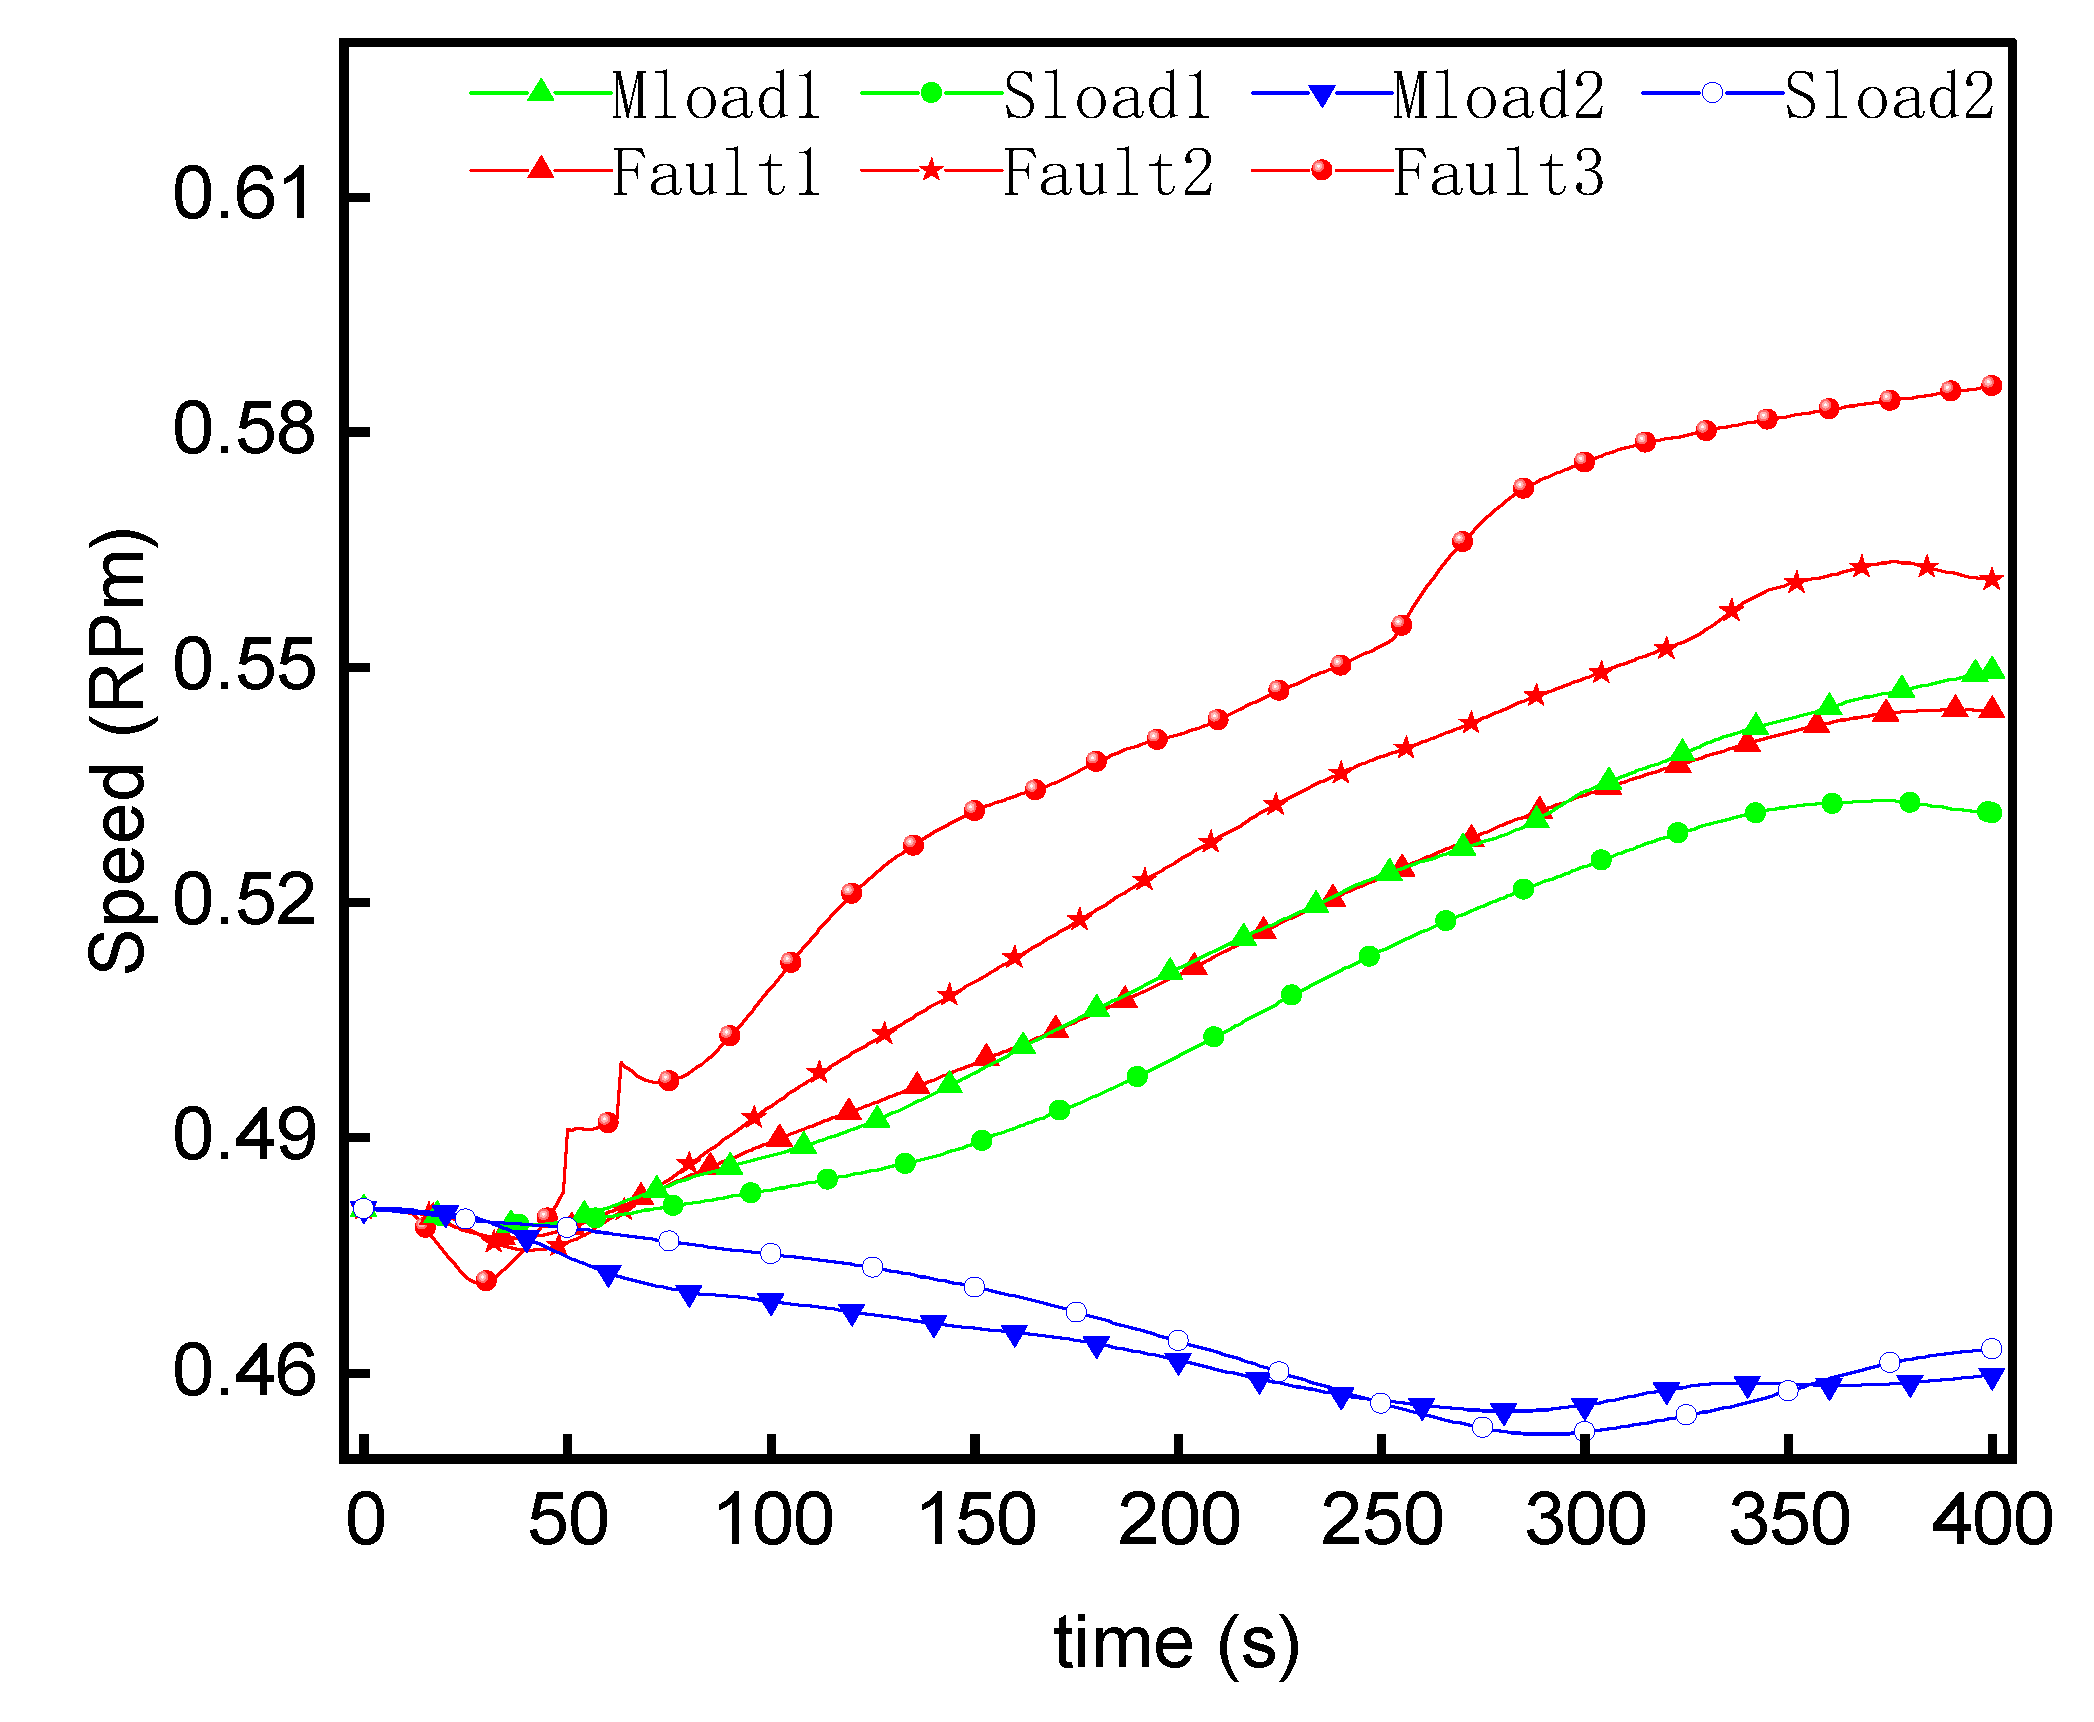
As shown in Figure 12, the speed of the turbocharger unit decreases when the load is reduced and increases when the load is increased. When the evaporation tube has a slight leakage, it tends to decrease first and then increase in a short time; Fault3, representing the maximum and minor leakage fault, is more disturbed than other curves.
Figure 5. Leak steam mass flow of riser tubes.
Energies 15 08636 g005
Figure 6. Fuel supply mass flow.
Energies 15 08636 g006
Figure 7. Air supply mass flow.
Energies 15 08636 g007
Figure 8. Excess air coefficient.
Energies 15 08636 g008
Figure 9. Flue gas temperature at of superheater outlet.
Energies 15 08636 g009
Figure 10. Carrying water proportion of flue gas.
Energies 15 08636 g010
Figure 11. Furnace pressure.
Energies 15 08636 g011
Figure 12. Speed of Turbocharger Unit.
Energies 15 08636 g012
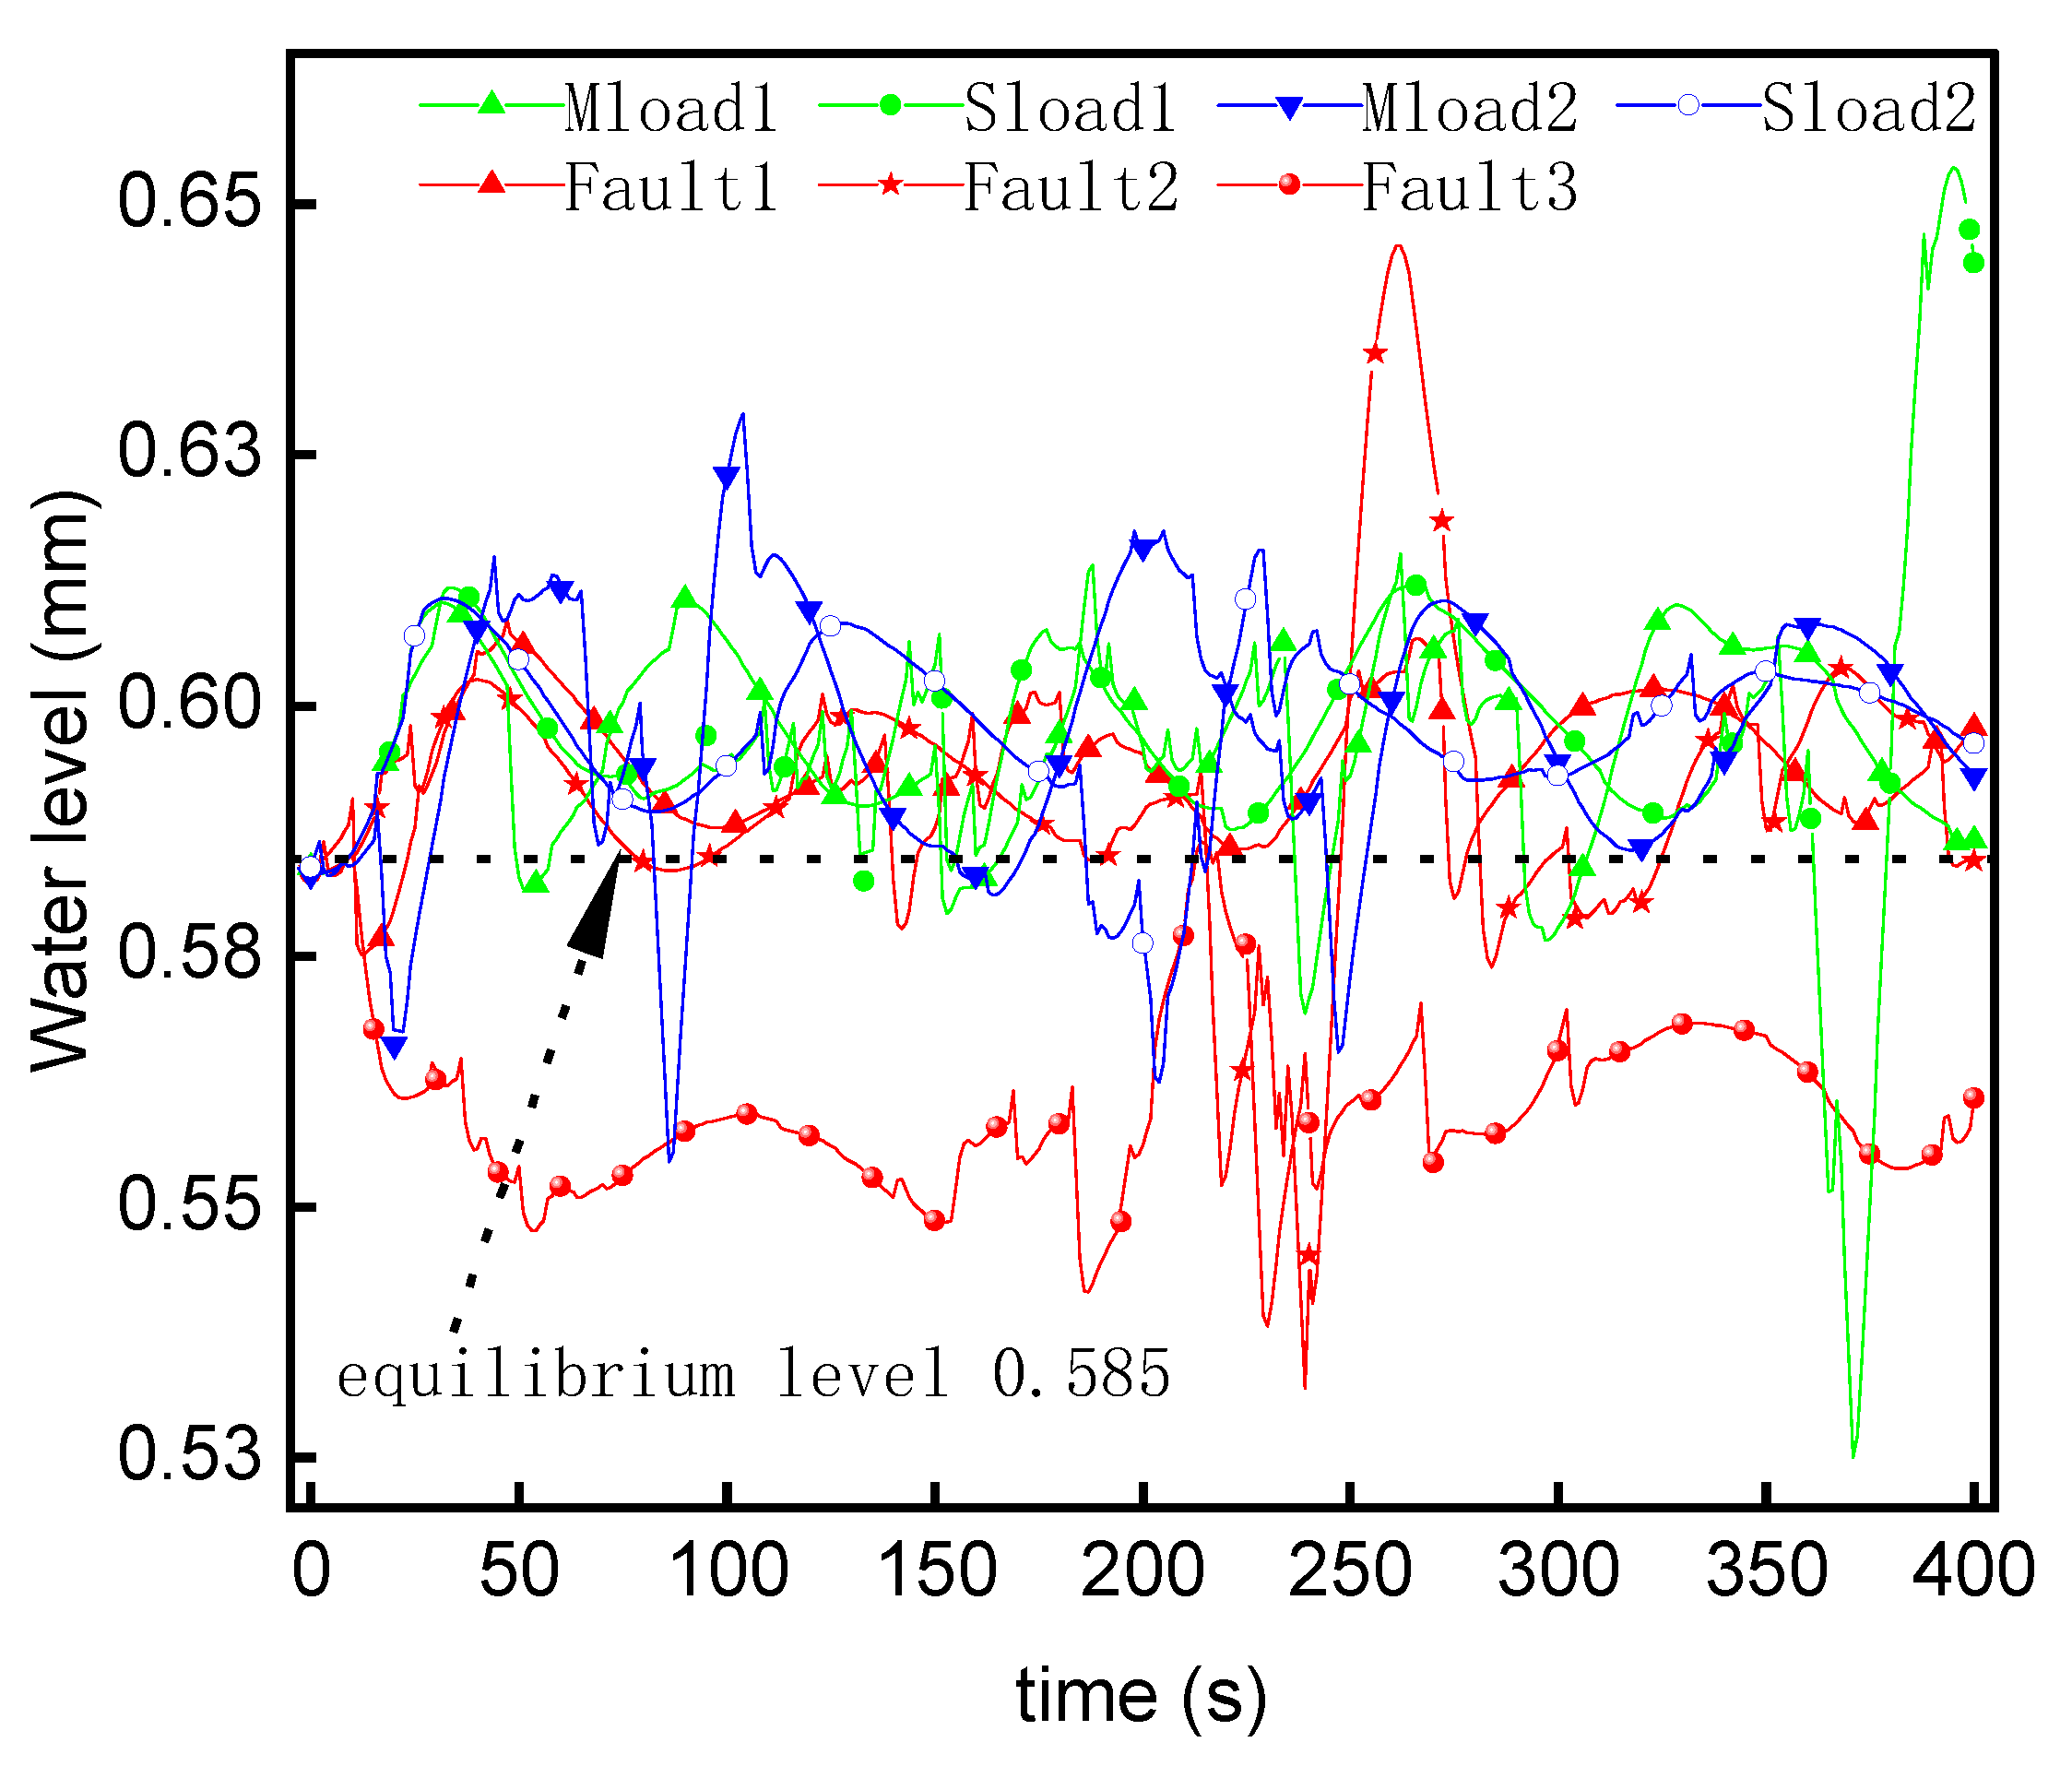
Figure 13. Steam drum water level.
Energies 15 08636 g013
Figure 14. Steam drum pressure.
Energies 15 08636 g014
Figure 15. Superheated steam consumption mass flow.
Energies 15 08636 g015
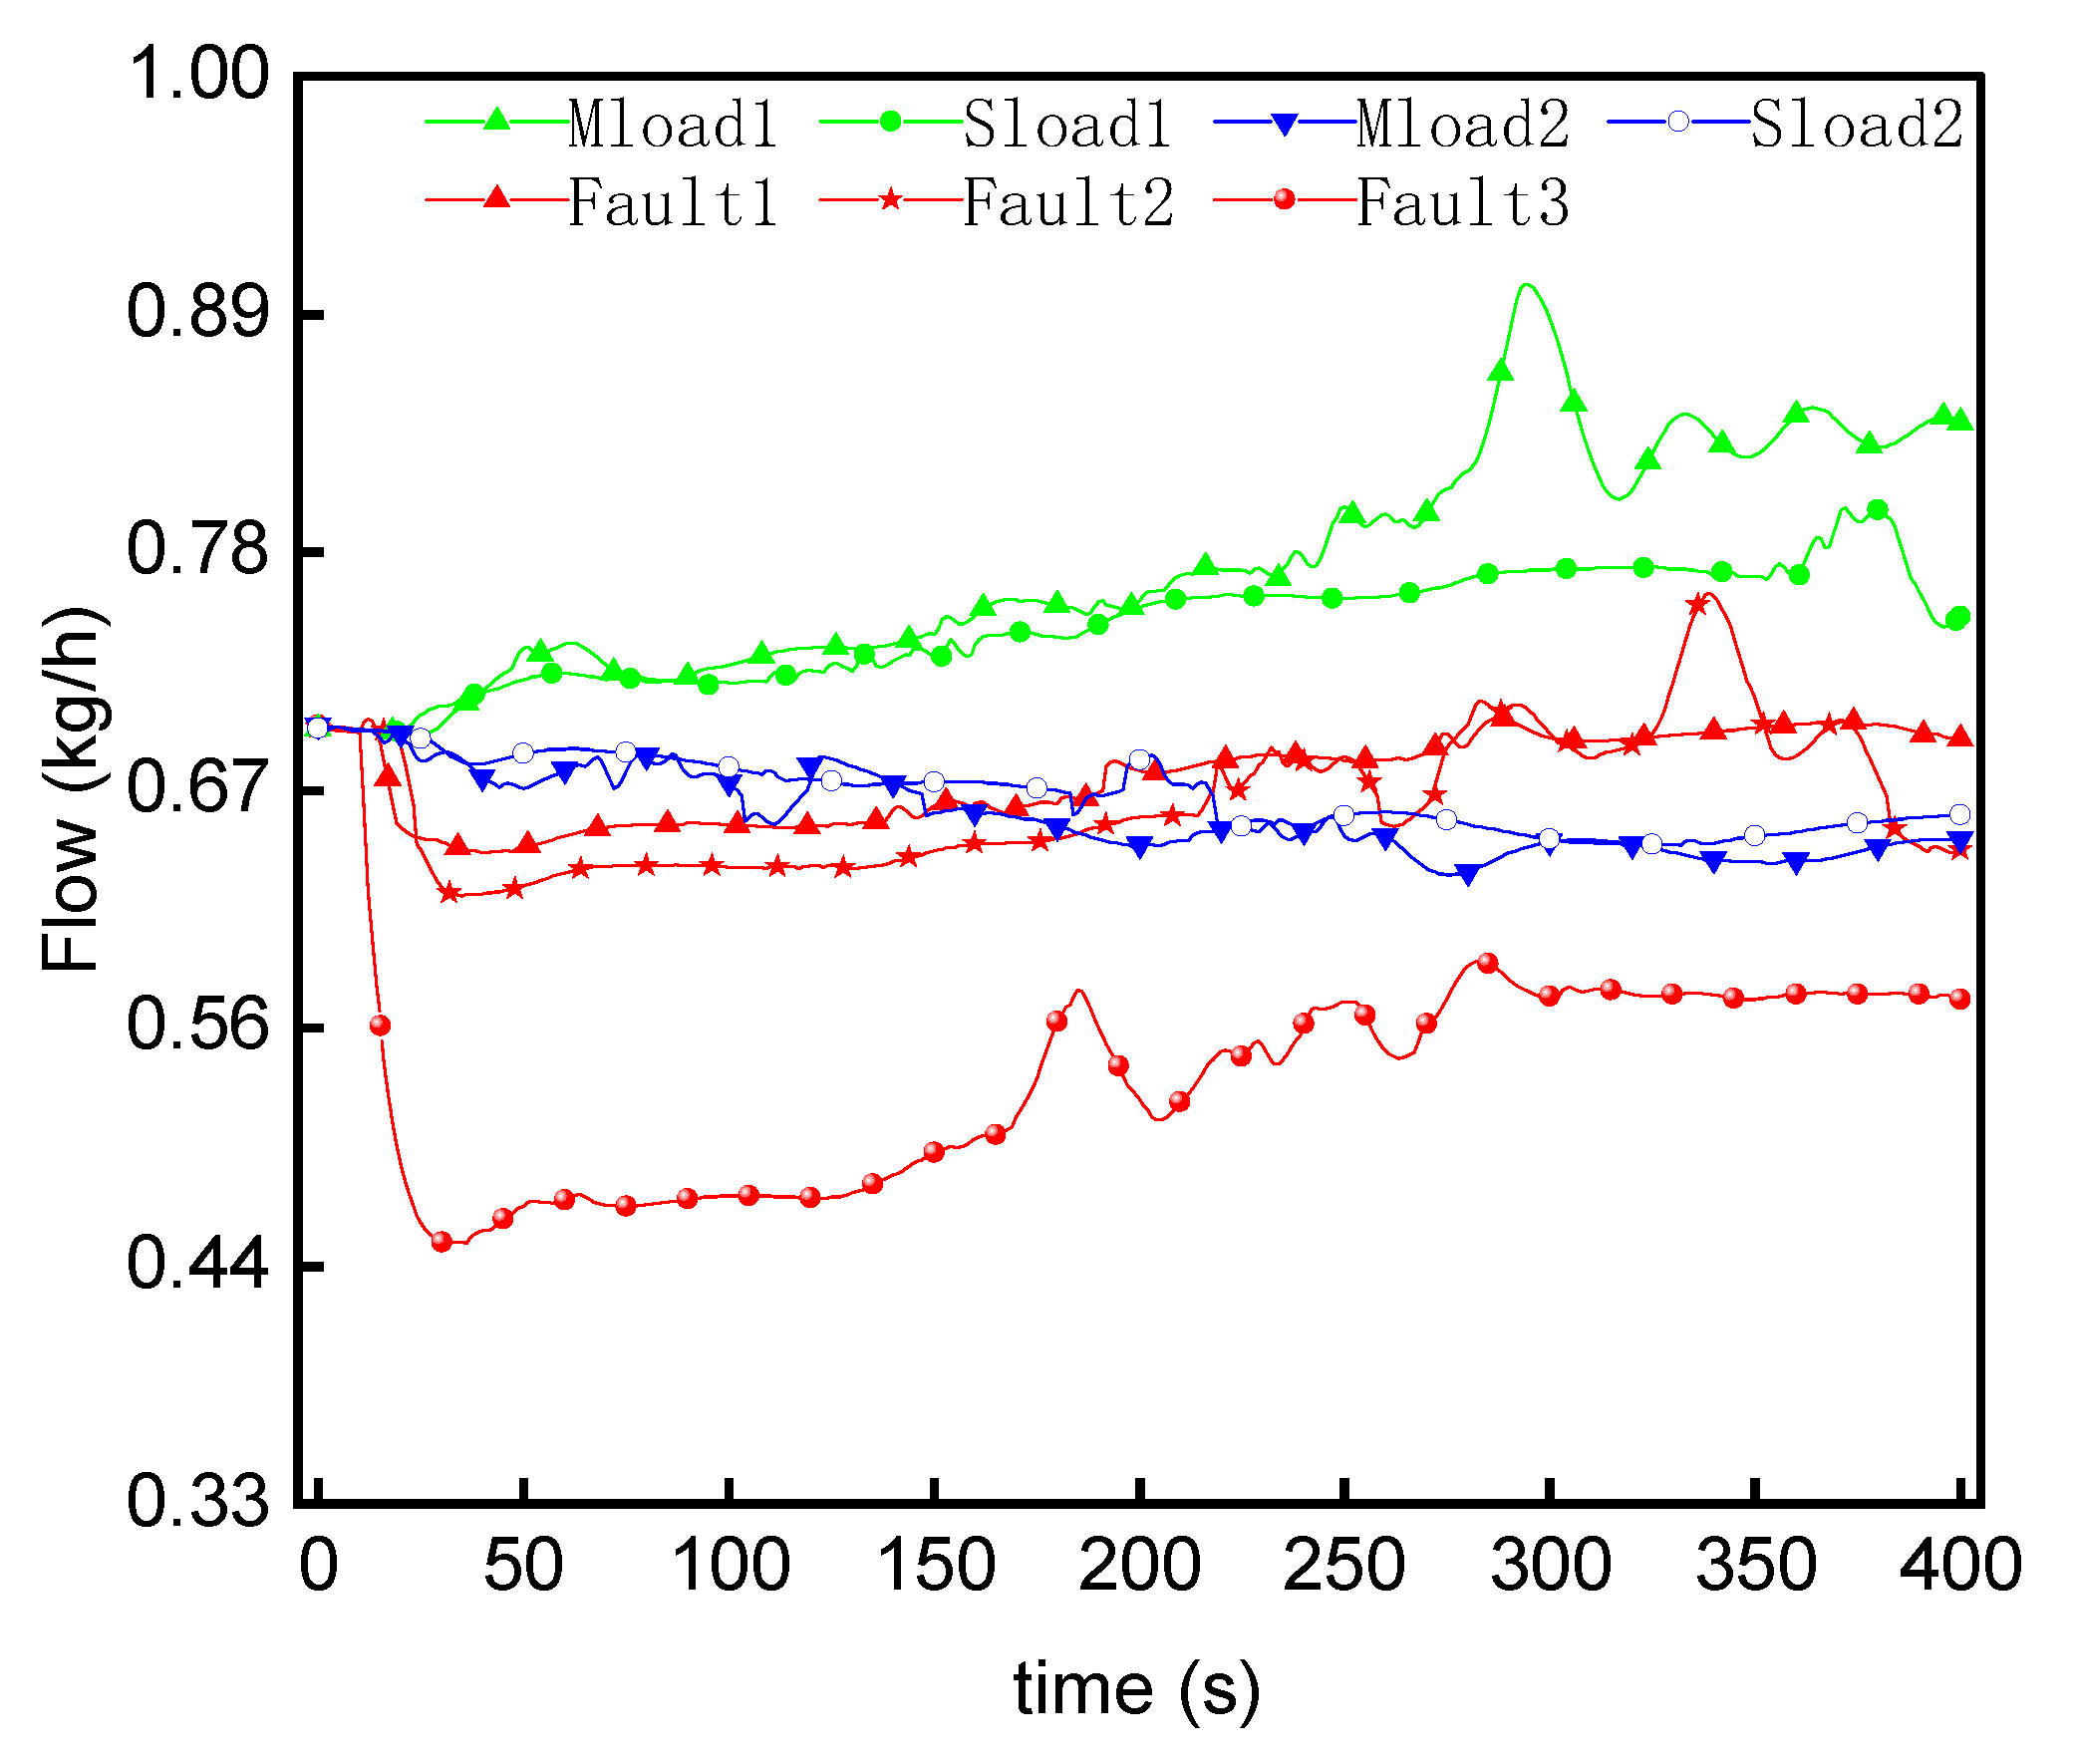
Figure 16. Water supply mass flow.
Energies 15 08636 g016
Figure 17. Superheated steam temperature.
Energies 15 08636 g017
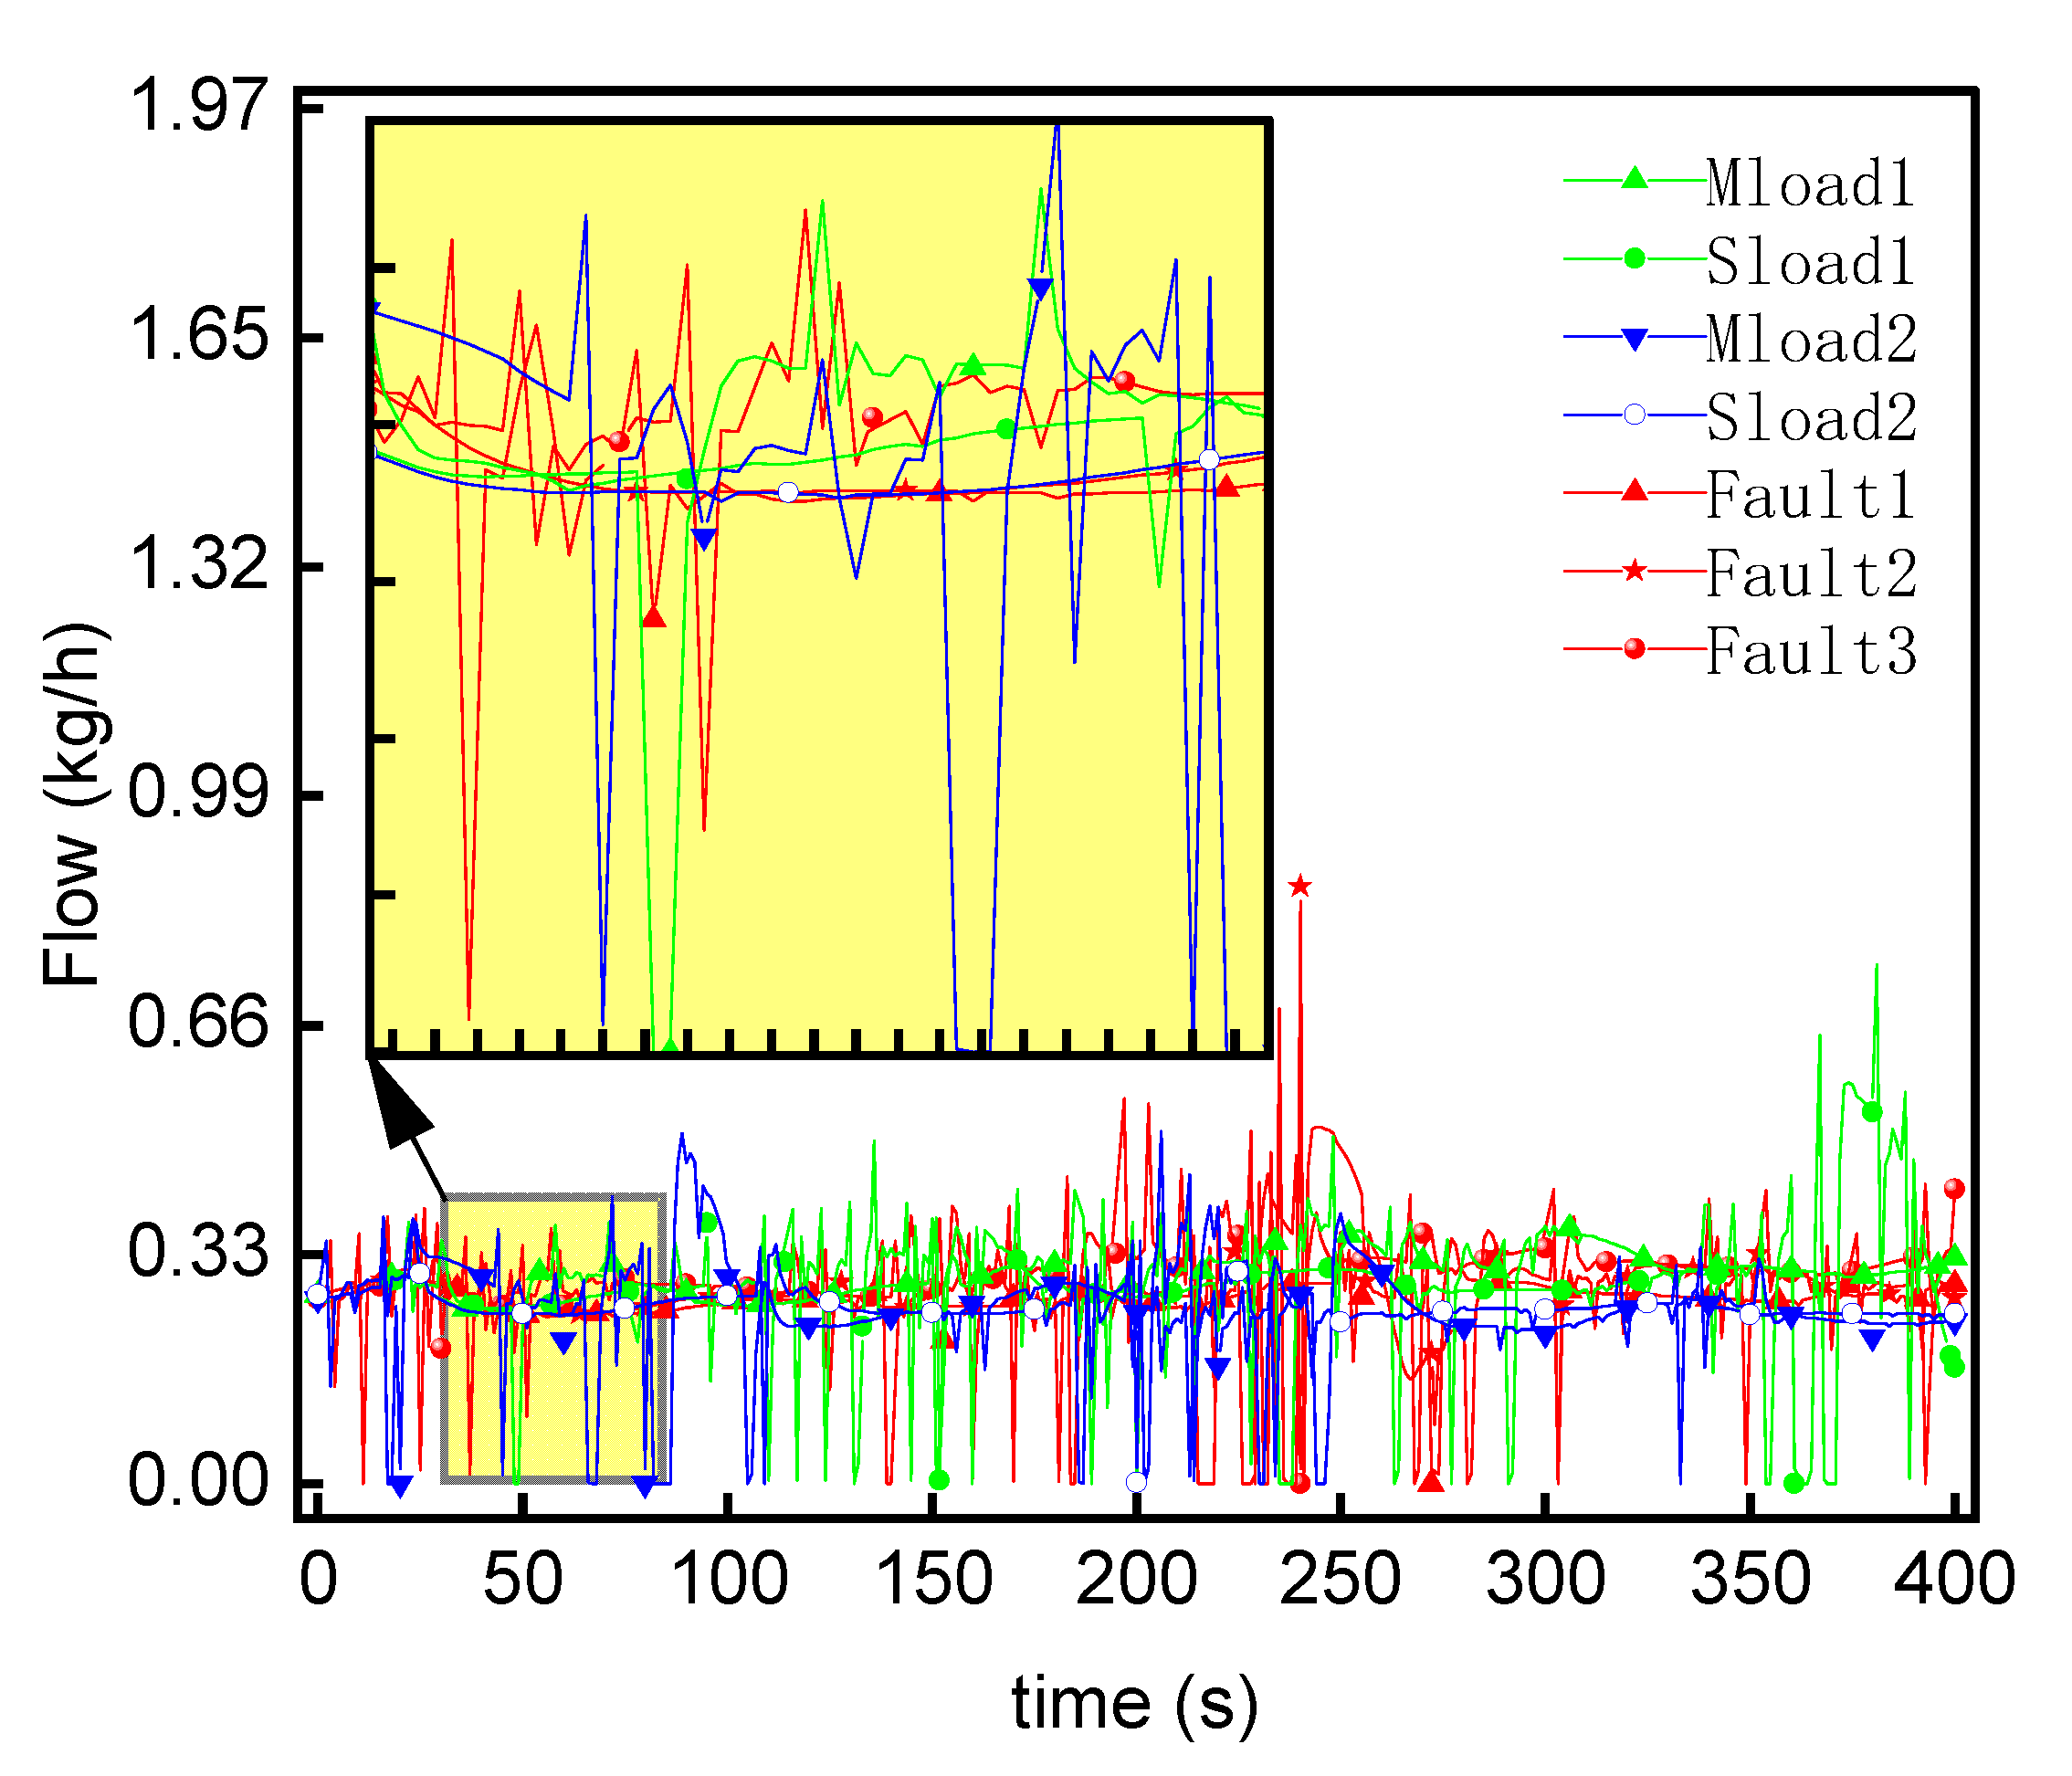
Figure 18. Saturated steam consumption mass flow.
Energies 15 08636 g018

4.3. Steam-Water Balance Analysis

A steam-water balance analysis focuses mostly on the steam drum. The pressure and water level of the steam drum present a slight disturbance when the steam and water supplies are balanced. This section analyzes the similarities and differences between the normal dynamic response characteristics and the fault dynamic response characteristics based on judging the stability of the steam and water system. The main variables include drum water level, drum pressure, superheated steam consumption mass flow, saturated steam consumption mass flow, water supply, and the main superheated steam temperature. The relevant results are shown in Figure 13, Figure 14, Figure 15, Figure 16, Figure 17 and Figure 18.
As shown in Figure 13, under most working conditions, the water level fluctuates up and down near the equilibrium point of 0.585, indicating that the water level of the steam drum has a good balance ability within the experimental range. While the water level of Fault3 drops sharply after the failure, the equilibrium level is reached at a point near 220 s, and the water level fluctuates below the equilibrium level throughout. It can be seen that Fault3′s disturbance is more obvious than other curves, indicating that the water level balance ability of Fault3 decreases, showing the trend of water level decline. The phenomenon of Fault3 water level drop is common in boiler tube-burst failures [40]. The main reason is that during the internal circulation of the boiler steam-water circulation, a large amount of water-steam mixture that should have flowed into the steam drum from the evaporation pipe leaks into the furnace, as shown in Figure 1, with the purple process from No. 5 to No. 8 and the yellow arrow of the steam leak.
As shown in Figure 14, the steam drum pressure increases when the load is reduced and decreases when the load is increased, or the evaporation pipe leaks occur and trend to a balanced level in the latter. The bigger the fault, the greater the decrease in the rate of the curve due to the larger reduction of combustion efficiency.
As shown in Figure 15 and Figure 18, the change in steam consumption is obvious. The steam consumption gradually increases when the load is increased and decreases when the load is decreased. However, when the fault occurs, the steam consumption suddenly decreases and then rises slowly, and the later trend is similar to the load increase. The steam consumption suddenly decreases due to the steam drum pressure decreasing quickly with the steam consumption valve of the turbine opening slowly.
As shown in Figure 16, the water supply response is rapid, which is why the water level of the steam drum can keep essentially stable in the disturbance of the steam consumption.
As shown in Figure 17, when Fault1 and Fault2 have a small leakage fault, the superheated steam temperature is very similar to that of a load increase. When the leakage fault increases, as shown in Fault3, the temperature gradually becomes unstable. Fault3 dropped sharply and rose sharply. The main reason can be analyzed through the combination of Figure 9, Figure 15 and Figure 18. In the early stage of the fault, although the consumption of the main superheated steam was greatly reduced, the temperature of the flue gas, which is the heat source of the superheated steam, was greatly reduced. That is, the temperature of superheated steam was greatly reduced due to the sharp cooling of the heating source. Later, although the main superheated steam supply increased slowly, the flue gas temperature at the superheater outlet increased significantly, which led to a rapid and significant increase in the superheated steam temperature in the later period. The fault phenomenon presented by the simulation is consistent with the literature [40].

5. Conclusions

This paper takes a marine supercharged boiler system as the research object, establishes a model for the micro-leakage of the boiler evaporation tube, compares the dynamic response of 14 thermal parameters under fault and load-changing conditions through the perspective of combustion balance and steam-water balance, and analyzes their discriminability. The conclusions are as follows:
(1)
The mathematical model of evaporation tube micro-leakage conforms to the fault mechanism and experience. The variable load dynamic response characteristics of the main parameters are consistent with those described in References [19,20,21,22,23], and the fault simulation phenomena are consistent with those described in References [3,4,40].
(2)
The reasons for poor discriminability of the micro-leakage fault have been found: In the case of micro-leakage, most of the characterization parameters can still tend to balance after 300 s and the dynamic response characteristics are similar to those of load increase.
(3)
Two points should be suggested to distinguish the micro-leakage fault of evaporation. First, there are four highly distinguishable parameters, which are the speed of the turbocharger unit, the air supply flow, the flue gas temperature at the superheater outlet, and the furnace pressure. When the micro-leakage fault is triggered, the first three parameters have a large disturbance. They show a trend of decreasing first and then increasing in a short period of time, unlike the normal load-changing condition. The fourth parameter, furnace pressure, rises abnormally fast after failure. Second, under the normal working condition of varying loads, the main parameters are commonly 300 s to stabilize; common stability parameter values should be recorded because, in the micro-leakage fault where evaporation occurs, a steady-state increment of the failure is larger than a normal steady increment under variable load conditions by 2 to 3 times.
(4)
As the leakage fault increases, the disturbance amplitude of the characteristic parameters becomes larger. In addition, the stability of the steam system becomes worse, and fault discrimination becomes more obvious.
(5)
The research method can be extended to various types of boiler pipe leakage. The research results can provide enough reliable samples for fault diagnosis research, and the suggestions to distinguish the micro-leakage fault of evaporation can be used for early fault detection and late fault diagnosis of the crew.

Author Contributions

Conceptualization, D.L. and J.G.; methodology, D.L. and J.G.; software, D.L. and J.G.; validation, D.L. and J.G.; formal analysis, D.L. and S.X.; investigation, D.L. and S.X.; resources, D.L. and F.M.; data curation, D.L. and Y.C.; writing—original draft preparation, D.L. and G.Z.; writing—review and editing, D.L. and S.X.; visualization, D.L. and S.X.; supervision, D.L. and S.X. All authors have read and agreed to the published version of the manuscript.

Funding

This research was funded by the National Natural Science Foundation of China (grant number 51576207). This research was also supported by the National Natural Science Foundation of China (grant number 11974429).

Conflicts of Interest

The authors declare no conflict of interest.

Nomenclature

CTotal admittance of evaporation pipe leakage
P1Steam pressure in evaporation pipe
P2Boiler furnace pressure
W gas Flue gas mass flow at furnace outlet, kg/s
W oil Fuel flow, kg/s
W h 2 o Atomizing steam flow, kg/s
W air Airflow, kg/s
W leak Leakage steam flow of evaporation pipe, kg/s
X O 2 Oxygen mass percentage required for complete combustion of unit mass fuel, kg/kg
W O 2 Oxygen quality in the air, kg/s
M ar Mass percentage of water in fuel, %;
W O 2 , ex , W H 2 O , W CO 2 , W SO 2 , W N 2 Mass flow of O2, H2O, CO2, SO2 and N2 in flue gas, kg/s
W H 2 O , air , W CO 2 , air , W SO 2 , air , W N 2 , air Mass flow of H2O, CO2, SO2 and N2 in intake air, kg/s
W O 2 Oxygen quality in the intake air, kg/s
W cb Fuel quantity involved in combustion, kg/s
W CO 2 Mass flow of CO2 in flue gas, kg/s
W CO Mass flow of CO in flue gas, kg/s
C ar , H ar , O ar , S ar , N ar Mass percentage of carbon, hydrogen, oxygen, sulfur, and nitrogen in fuel, %
m gas Molar flow of flue gas, mol/s
R O 2 , R H 2 O , R CO 2 , R CO , R SO 2 , R N 2 It is the molar ratio of oxygen, water vapor, carbon dioxide, carbon monoxide, sulfur dioxide, and nitrogen in flue gas, %
ρ gas Density of flue gas, kg/m3
P gas Flue gas pressure, MPa
T gas Flue gas temperature, K
μ gas Dynamic viscosity of flue gas, Pa·s
γ gas Kinematic viscosity of flue gas, m2/s
g O 2 , g H 2 O , g CO 2 , g SO 2 , g N 2 It refers to the mass fraction of oxygen, water vapor, carbon dioxide, sulfur dioxide, and nitrogen in the flue gas, %
λ gas Thermal conductivity of flue gas, W/(m2·K)
λ i The thermal conductivity of each component is a function of T, W/(m2·K)
R i Molar fraction of each component, %
M i Molar mass of each component, g/mol
Pr gas Molar mass of each component
Q in Effective heat input into furnace, kJ;
C o i l Specific heat of fuel, kJ/(kg·°C)
T oil Fuel inlet temperature, °C
C p , air Specific heat of air at constant pressure, kJ/(kg·°C)
T air Air temperature, °C;
Q net Low temperature calorific value of oil,kJ/kg
T th Theoretical combustion temperature, °C
C p , gas Specific heat of flue gas at constant pressure, kJ/(kg·°C)

References

  1. Alobaid, F.; Mertens, N.; Starkloff, R.; Lanz, T.; Heinze, C.; Epple, B. Progress in dynamic simulation of thermal power plants. Prog. Energy Combust. Sci. 2017, 59, 79–162. [Google Scholar] [CrossRef]
  2. Haghighat-Shishavan, B.; Firouzi-Nerbin, H.; Nazarian-Samani, M.; Ashtari, P.; Nasirpouri, F. Failure analysis of a superheater tube ruptured in a power plant boiler: Main causes and preventive strategies. Eng. Fail. Anal. 2019, 98, 131–140. [Google Scholar] [CrossRef]
  3. Xu, H. Qualitative Reasoning Analysis of Boiler “Four-Tube Leakage” Based on QSIM; North China Electric Power University: Beijing, China, 2014. [Google Scholar]
  4. Wang, N. Simulation Research and Intelligent Fault Diagnosis for Boiler Four-Tube Leakage Faults; North China Electric Power University: Beijing, China, 2014. [Google Scholar]
  5. Nurbanasari, M.; Abdurrachim. Investigation of Leakage on Water Wall Tube in a 660 MW Supercritical Boiler. J. Fail. Anal. Preven. 2014, 14, 657–661. [Google Scholar] [CrossRef]
  6. Ren, F.; Xu, J.; Si, J. Leakage failure analysis of water wall tube in circulating fluidized bed boiler. J. Phys. Conf. Ser. 2020, 1653, 12007. [Google Scholar] [CrossRef]
  7. Husaini; Ali, N.; Teuku, E.P.; Faleri, A.; Akhyar. Study on fracture failures of the super heater water pipe boiler. Defect Diffus. Forum 2020, 402, 20–26. [Google Scholar] [CrossRef]
  8. Zhang, J.; Wang, M.J.; Zhang, Z.; Sun, H.; Wu, Y.W.; Tian, W.X.; Qiu, S.Z.; Su, G.H. A comprehensive review of the leak flow through micro-cracks (in LBB) for nuclear system: Morphologies and thermal-hydraulic characteristics. Nucl. Eng. Des. 2020, 362, 110537. [Google Scholar] [CrossRef]
  9. Kong, Q.; Jiang, G.; Liu, Y.; Sun, J. Location of the Leakage from a Simulated Water-Cooling Wall Tube Based on Acoustic Method and an Artificial Neural Network. IEEE Trans. Instrum. Meas. 2021, 70, 1–18. [Google Scholar] [CrossRef]
  10. Elshenawy, L.M.; Halawa, M.A.; Mahmoud, T.A.; Awad, H.A.; Abdo, M.I. Unsupervised machine learning techniques for fault detection and diagnosis in nuclear power plants. Prog. Nucl. Energy 2021, 142, 103990. [Google Scholar] [CrossRef]
  11. Khalid, S.; Lim, W.; Kim, H.S.; Oh, Y.T.; Youn, B.D.; Kim, H.-S.; Bae, Y.-C. Intelligent Steam Power Plant Boiler Waterwall Tube Leakage Detection via Machine Learning-Based Optimal Sensor Selection. Sensors 2020, 20, 6356. [Google Scholar] [CrossRef]
  12. Nagpal, S. Evaluate Heat-Exchanger Tube-Rupture Scenarios Using Dynamic Simulation. Chem. Eng. 2015, 122, 48–53. [Google Scholar]
  13. Qi, H.; Sun, Y.; Wang, F.; Tian, Y. Analysis of Simulation in Electrical Open-Phase Malfunction of High Voltage in Nuclear Power Plant. Comput. Simul. 2021, 38, 380–386. [Google Scholar]
  14. Li, X.; Ni, H.; Jin, J. Fault Simulation Research of Marine Power Fuel System. Comput. Simul. 2019, 36, 26–31+377. [Google Scholar]
  15. Matulić, N.; Radica, G.; Nižetić, S. Engine model for onboard marine engine failure simulation. J. Therm. Anal. Calorim. 2020, 141, 119–130. [Google Scholar] [CrossRef]
  16. Feng, H.; Xie, Z.; Chen, L.; Wu, Z.; Xia, S. Constructal design for supercharged boiler superheater. Energy 2020, 191, 116484. [Google Scholar] [CrossRef]
  17. Xie, Z.; Feng, H.; Chen, L.; Wu, Z. Constructal design for supercharged boiler evaporator. Int. J. Heat Mass Transf. 2019, 138, 571–579. [Google Scholar] [CrossRef]
  18. Tang, W.; Feng, H.; Chen, L.; Xie, Z.; Shi, J. Constructal design for a boiler economizer. Energy 2021, 223, 120013. [Google Scholar] [CrossRef]
  19. Cheng, W. Simulation Research on Dynamic Performance of Supercharged Boiler System Based on GSE; Harbin Engineering University: Harbin, China, 2012. [Google Scholar]
  20. Zhang, G. Steady State Performance Calculation and Dynamic Process Simulation in Marine Supercharged Boiler; Harbin Engineering University: Harbin, China, 2008. [Google Scholar]
  21. Zhang, G.; Que, C.; Tan, X.; Li, J.; Song, F. Simulation of initiative counter steam control during process of rapid deceleration in ship. J. Chem. Ind. Eng. 2018, 69, 358–364. [Google Scholar]
  22. Zhang, G.; Sun, R.; Zhang, X.; Feng, Y.; Ma, Q. Dynamic characteristics simulation of marine turbocharger under process of rapid load reduction. J. Chem. Ind. Eng. 2018, 69, 316–323. [Google Scholar]
  23. Li, J.; Zhang, G.; Shi, Z.; Yang, L.; Ma, B. Characteristics of steam dynamic system in different operating environment. J. Chem. Ind. Eng. 2016, 67, 318–325. [Google Scholar]
  24. Deng, B.; Zhang, M.; Shan, L.; Wei, G.; Lyu, J.; Yang, H.; Gao, M. Modeling study on the dynamic characteristics in the full-loop of a 350 MW supercritical CFB boiler under load regulation. J. Energy Inst. 2021, 97, 117–130. [Google Scholar] [CrossRef]
  25. Taler, D.; Dzierwa, P.; Kaczmarski, K.; Taler, J. Increase the flexibility of steam boilers by optimisation of critical pressure component heating. Energy 2022, 250, 123855. [Google Scholar] [CrossRef]
  26. Li, D.; Cheng, G.; Geng, J.; Zhan, G. A New Research on Optimization Control of Supercharged Boiler system’s Characteristics on Ship. Comput. Simul. 2017, 34, 1–6. [Google Scholar]
  27. Li, D.; Cheng, G.; Geng, J. Modeling and Simulation of Auxiliary Turbine Based on Integration Method of Turbine and Fluid Network. Mar. Electr. Electron. Eng. 2019, 39, 21–25. [Google Scholar]
  28. Li, D.; Geng, J.; Cheng, G.; Li, R.; Liu, X. Modeling method and simulation experiments of main steam turbine of ship. Ship Sci. Technol. 2015, 37, 79–82. [Google Scholar]
  29. Henry, R.E.; Fauske, H.K. The two-phase critical flow of one-component mixtures in nozzles, orifices, and short tubes. J. Heat Transf. 1971, 93, 179–187. [Google Scholar] [CrossRef]
  30. Diener, R.; Schmidt, J. Sizing of throttling device for gas/liquid two-phase flow part 2: Control valves, orifices, and nozzles. Proc. Saf. Prog. 2005, 24, 29–37. [Google Scholar] [CrossRef]
  31. Wu, X.; Li, C.; He, Y.; Jia, W. Dynamic Modeling of the Two-Phase Leakage Process of Natural Gas Liquid Storage Tanks. Energies 2017, 10, 1399. [Google Scholar] [CrossRef] [Green Version]
  32. Zhang, J.; Yu, H.; Wang, M.J.; Wu, Y.W.; Tian, W.X.; Qiu, S.Z.; Su, G.H. Experimental study on the flow and thermal characteristics of two-phase leakage through micro crack. Appl. Therm. Eng. 2019, 156, 145–155. [Google Scholar] [CrossRef]
  33. Zhen, H.; Yin, S.; Zhang, L.; Wang, N.; Xu, B.; Wang, H. Effect of Upstream Parameters on Two-Phase Critical Flow Leakage Characteristics. Nucl. Technol. 2021, 207, 54–61. [Google Scholar] [CrossRef]
  34. Geng, J.; Cheng, G.; Li, D.; Sun, L.; Geng, G. Analysis of modular methods of simulation in fluid network. Ship Sci. Technol. 2015, 37, 128–131. [Google Scholar]
  35. Zhang, J.; Zhao, Y. Handbook of Thermophysical Properties of Materials Commonly Used in Engineering; Xin Shi Dai Chu Ban She: Beijing, China, 1987. [Google Scholar]
  36. Liu, Z.; Liu, X.; Zhao, G. Compilation and Application of Engineering Thermophysical Property Calculation Program; Science Press: Beijing, China, 1992. [Google Scholar]
  37. Zhang, N. Investigation on the Boiler Dynamic Based on the Mechanism and Data Integrated Modeling; North China Electric Power University: Baoding, China, 2009. [Google Scholar]
  38. Gao, J. Study of Real-Time Simulation Model and Operation Property for Big Capacity Circulating Fluidized Bed Boiler Unit; North China Electric Power University: Baoding, China, 2005. [Google Scholar]
  39. Li, D.; Cheng, G.; Xu, W.; Zhan, G.; Naval University of Engineering. Optimization Method of Operating Characteristics in Improving Supercharged Boiler System. Mar. Electr. Electron. Eng. 2017, 37, 72–76. [Google Scholar]
  40. Ruan, J. Research on the Boiler Heating Surface Leakage Based on QPT; North China Electric Power University: Beijing, China, 2014. [Google Scholar]
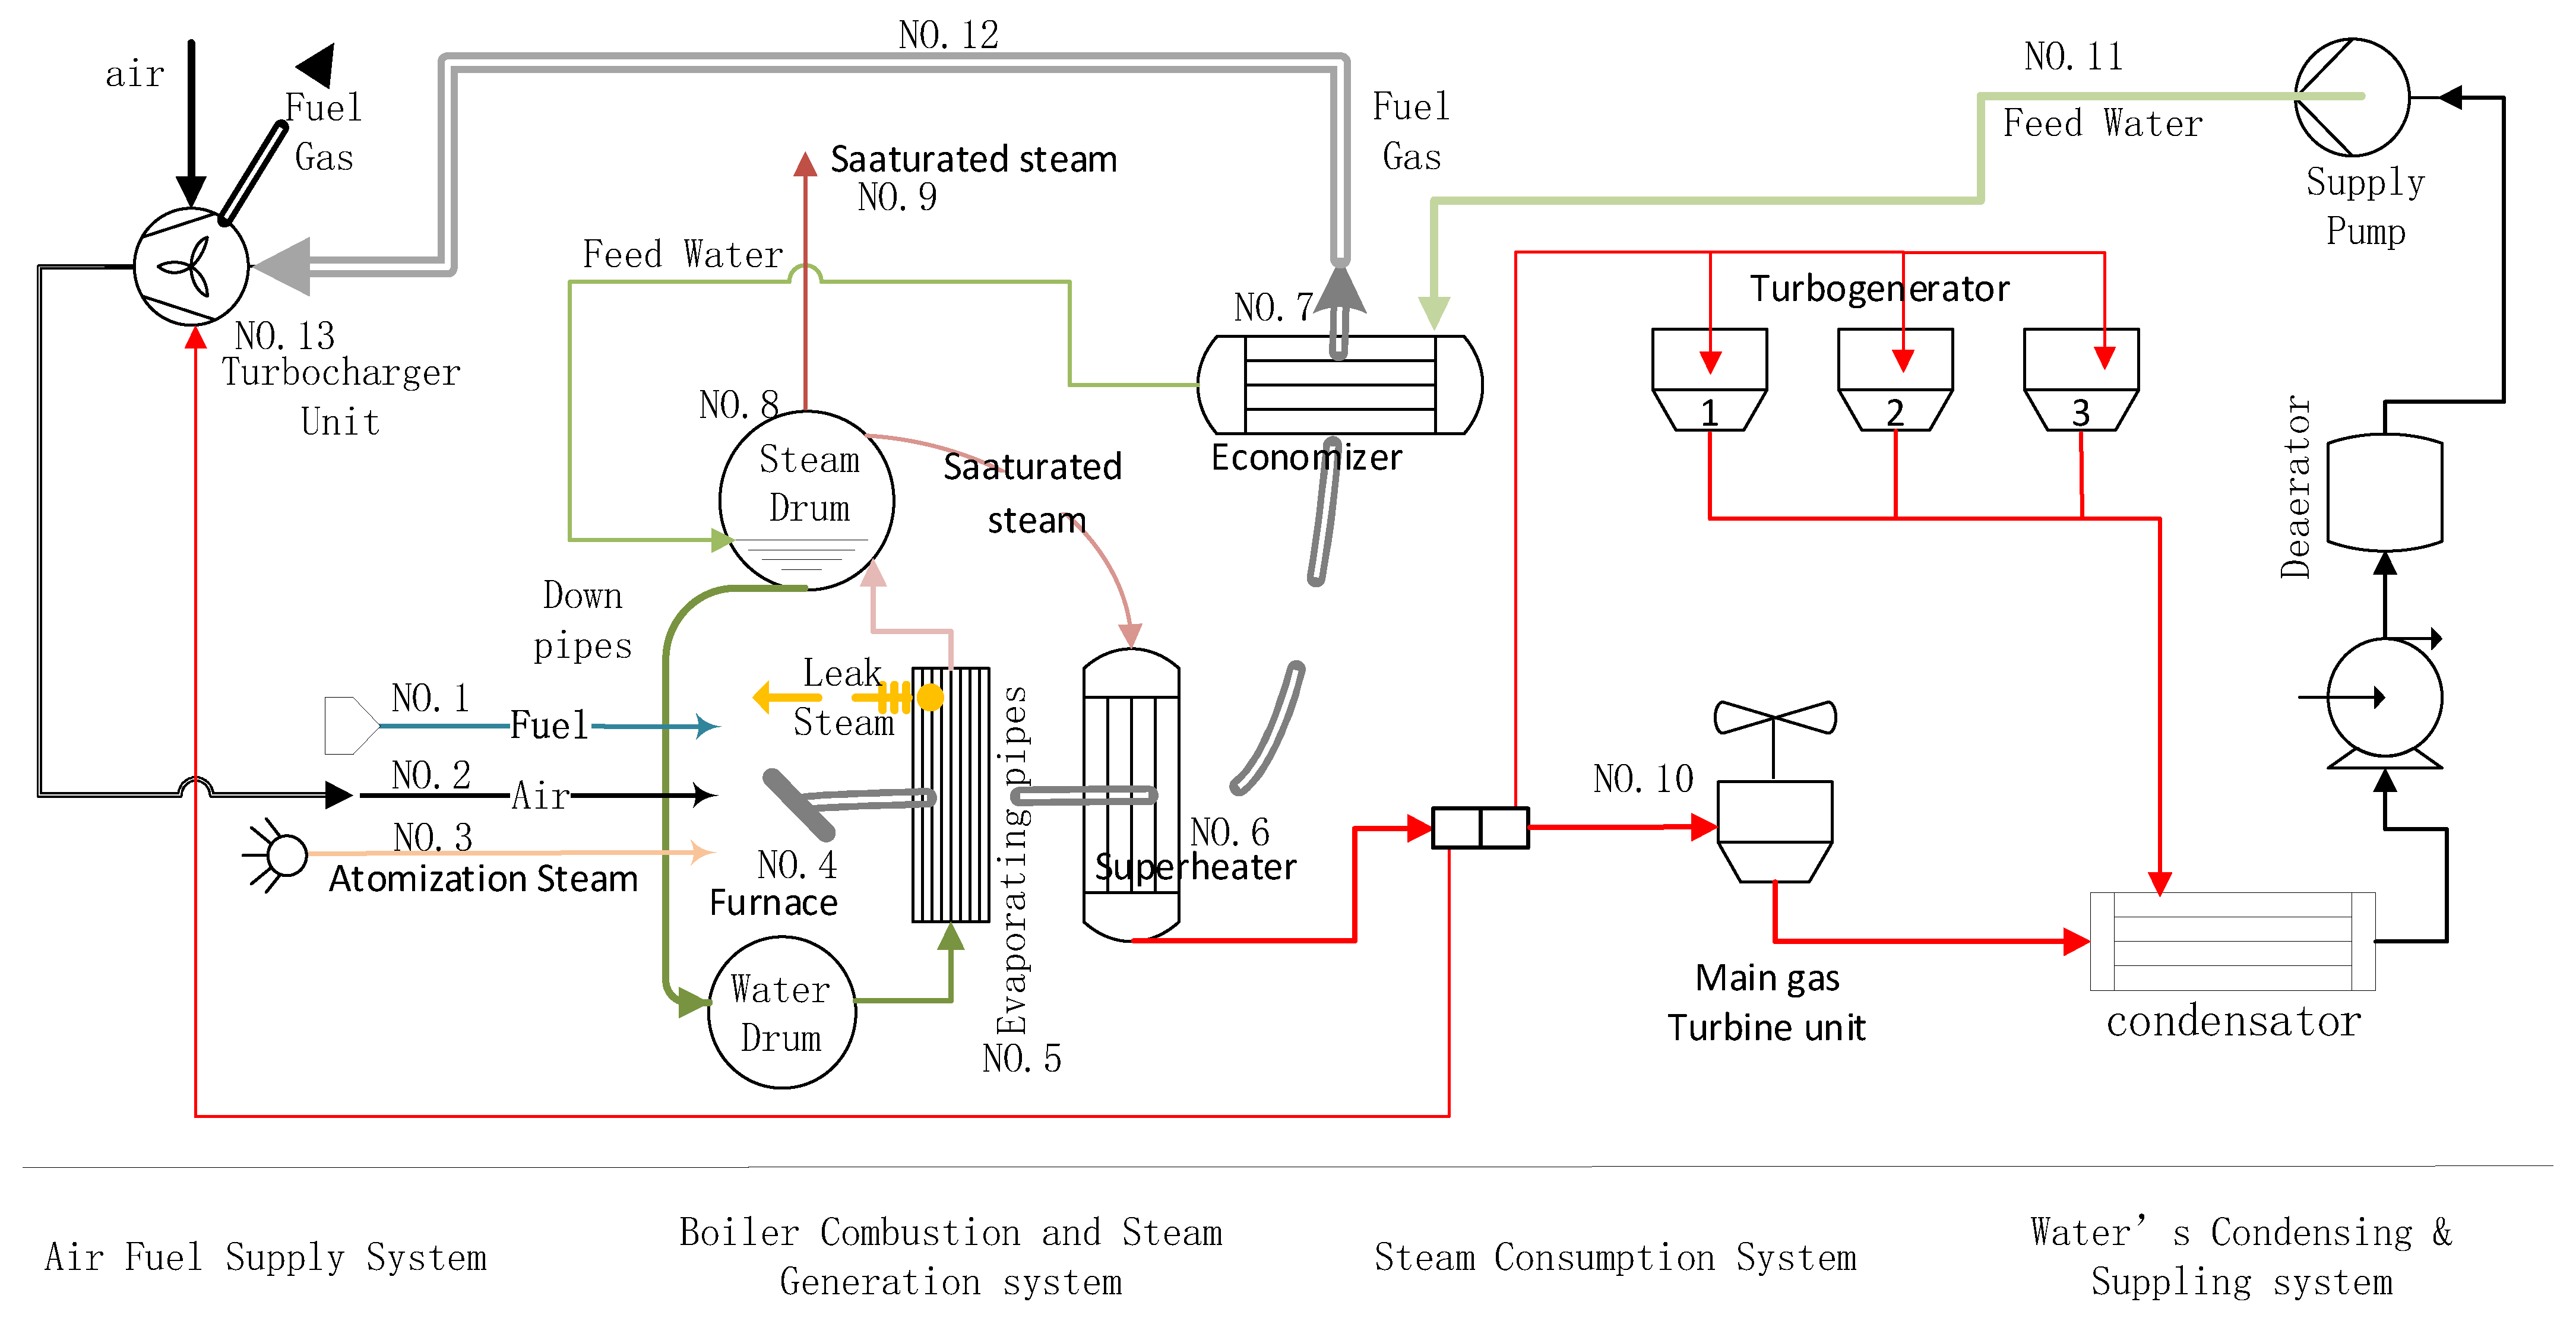
Figure 1. Schematic flow diagram of the system.
Energies 15 08636 g001
Figure 2. A dynamic model of the steam power unit.
Energies 15 08636 g002
Figure 3. Schematic Diagram of Four Typical Leakage Positions. a: Drum; b: Downcomer; c: Riser; d: Evaporator; e: Superheated steam tube; f: Superheater. (AD) represents four types of leakage. The red arrow represents the direction of the leak.
Energies 15 08636 g003
Figure 4. The characteristic’s dynamic response under 1%-leakage of evaporative pipes.
Energies 15 08636 g004
Table 1. Experimental setup table.
No.Experimental IdentificationDisturbance VariableValue
1Fault1Leakage admittance ratio0.05%
2Fault2Leakage admittance ratio0.1%
3Fault3Leakage admittance ratio0.5%
4Mload1Load rise of main turbine10%
5Mload2Load reduction of main turbine−10%
6Sload1Turbine generator loading100%
7Sload2Turbine generator unloading0%
Publisher’s Note: MDPI stays neutral with regard to jurisdictional claims in published maps and institutional affiliations.