Article

A Novel Approach for Flow Analysis in Pulsating Heat Pipes: Cross-Correlation of Local Heat Flux

Department of Architecture and Engineering, University of Parma, Parco Area Delle Scienze 181/A, 43124 Parma, Italy
*
Author to whom correspondence should be addressed.
Energies 2022, 15(22), 8664; https://doi.org/10.3390/en15228664
Submission received: 19 October 2022 / Revised: 10 November 2022 / Accepted: 15 November 2022 / Published: 18 November 2022

Abstract

:
Pulsating heat pipe is a promising two-phase heat transfer device that has many advantages such as a simple wickless structure and high thermal performance. Its thermal behavior is inherently time-dependent, and it can also be characterized by substantial spatial variations. However, there are few studies investigating the interaction or similarity of the local physical quantities, such as heat fluxes exchanged between the working fluid and the device wall in adjacent branches. In the present work, a new approach based on the application of cross-correlation analysis to local heat fluxes is proposed to deepen the understanding of the flow characteristics in pulsating heat pipes. The temperature distribution in the condenser of a seven-turn pulsating heat pipe was measured with an infrared camera, changing the power input. The local heat flux distributions were estimated by solving the inverse heat conduction problem in the tube wall. The cross-correlation of the heat fluxes at different positions of central and edge tubes in the condenser was analyzed. The result revealed the different trends in the cross-correlation depending on the power input: there were no clear cross-correlations in 0.5 W, while it was shown more clearly on the diagonal line with increasing power input to 2 W and 3.5 W because of the more activated flow throughout the heat pipe than that of the low power input. Moreover, the results of 3.5 W indicated a synchronized flow. It is suggested that the original approach presented in this work would lead to a deeper understanding of the chaotic fluid oscillation in pulsating heat pipes.

1. Introduction

Improving microprocessor operation has traditionally been complemented by rising power and enhancing on-chip power density, representing a thermal management challenge [1]. An elevated working temperature degrades the consistency and performance of electronic devices, and eventually causes catastrophic failures. Therefore, efficient thermal management is crucial to dissipating heat and avoiding heat-induced failures. According to Moore and Shi [2], the overall reliability of electronics is determined by the hottest region on the die rather than the average die temperature. Thus, it is essential to spread or remove the heat from heat-generating areas to prevent hot spot formation. The importance of thermal management has also been recognized for lithium-ion batteries [3,4,5,6], which are widely used in automobiles and other electronic devices, due to the relatively narrow allowable temperature range [3,4] and the risk of thermal runaway, where the battery becomes uncontrollably and extremely hot [5]. The basic strategy of a battery’s thermal management is to effectively remove the heat generated by the battery itself [6].
Cooling the heat-generating chips or batteries directly by air or liquid can be the simplest and most effective way to remove heat, but it requires particular layouts for electronics or electric vehicles that are sometimes not feasible. In such cases, heat transfer devices that efficiently transport heat from the heat-generating part to the cooled part are useful. Among heat transfer devices, the heat pipe [7] is a highly effective passive device for heat transport at high rates over considerable distances with extremely small temperature drops, simple construction, and easy control with no external pumping power [8]. Heat pipes are widely used for computers [8], energy systems including batteries [9,10], and satellites [11].
Even after heat pipes were widely spread to real applications, novel heat pipes were invented and developed to overcome the disadvantages of classical heat pipes such as the inefficient gravity-independent functioning of some commercial wicks and low-flexibility, and to enhance heat transport performance [8,12]. Pulsating heat pipe (PHP) is one of the latest “evolved” heat pipes. One of the most attractive characteristics of PHP is its wickless structure: PHP consists of a capillary tube or channel which is repeatedly bent between a heated section (i.e., evaporator) and cooled section (i.e., condenser). A working fluid is charged into the PHP, and it exists as an alternation of vapor and liquid. Once heat is applied to the evaporator section, the self-excited oscillation of fluid occurs between the evaporator and the condenser, leading to heat transport and consequent dissipation at the heat sink. In addition to its simple, cheap, and flexible structure, the PHP is able to work against and even without gravity [13]. All these features have been considered as highly appealing by the scientific community since the PHP first conceptualization in 1990s [14,15], and the works dealing with the study of such heat transfer device have been growing exponentially, especially during the last decade [16,17].
Since PHP has many parameters that affect its heat transfer performance, large number of experimental investigations has been devoted to the study of its influencing parameters. The inner diameter should be small enough so that the surface tension overcomes the gravity and slug/plug flows are induced, however, several studies [18,19] reported that a larger inner diameter within the critical diameter range results in more heat transferred. Increasing the number of turns also enhances the heat transfer performance [20]. The thermophysical properties of working fluid is also important: fluid with low-viscosity, high thermal conductivity, and high partial derivative of pressure with respect to temperature at saturation state is preferable in general for better performance [16,21,22].
PHP industrial applications have been also explored [23,24,25]. Miyazaki [23] proposed a laptop computer where PHP was embedded and could withstand repeated opening and closing. Khandekar et al. [24] suggested a heat exchanger constructed of PHP for waste heat recovery. Rittidech and Wannapakne [25] demonstrated the effectiveness of a solar collector consisted of a PHP and a water tank for solar water heating system and showed that cumulative collect efficiency of 62%.
Despite the above attractive propositions, PHP has not yet been widely used in the real applications and still been studied in the laboratory-scale. This is due to the fact that the governing principles of thermo-fluid dynamics are still not fully understood and the lack of design tools caused by this. The thermal behavior of PHP is inherently time-dependent, and it is also usually characterized by substantial spatial variations. However, so far, in almost all the studies, PHP heat transfer capability is assessed by carrying out a thermal characterization based on the quantification of the PHP overall thermal resistance as a function of the power input provided to the evaporator, which is not enough to investigate PHP′s complex thermofluidic behavior, particularly at microscopic scale.
Several recent studies proposed new approaches to investigate the local thermofluidic behavior. Cattani et al. [26] proposed to apply temperature maps measured by an infrared (IR) camera to estimate the local heat flux exchanged among the pipe surface and fluid by means of the Inverse Heat Conduction Problem (IHCP) solution methodology. Pagliarini et al. [27] adapted this estimation to a metal PHP in a microgravity environment, allowing a quantitative description of fluid motion even without a direct visualization of the fluid. Following the procedure suggested by Perna et al. [28], the oscillations of the working fluid were further described in terms of dominant frequency. However, few studies have provided data regarding the motion of fluid menisci along space without direct fluid visualizations through transparent inserts [29] or neutron radiography [30], though providing either incomplete pieces of data or adopting hardly repeatable techniques. However, there are little studies investigating the interaction or similarity of the local heat fluxes.
The purpose of this work is to newly propose investigating the time–space oscillatory behavior of PHPs through a cross-correlation analysis of the local heat fluxes. Since the operation of PHP is governed by the fluid oscillation in every tube or channel and the interactions between them, investigating the cross-correlation of the time-series heat fluxes at different positions will deepen the understanding on the flow characteristics in PHPs. In this study, the temperature distribution in the condenser of a seven-turn PHP was first measured by an Infrared camera. Then, the local heat flux distributions were estimated by the method in the above literatures, and finally, the cross-correlation of the heat fluxes at different positions was evaluated. The experimental investigation is described in each section as follows: the experimental setup including the details of PHP and the procedures of IHCP and cross-correlation are explained in Section 2, Materials and Methods. In Section 3, Results and Discussion, the results of cross-correlation analysis are shown and their interpretations are discussed. The conclusion is stated in Section 4.

2. Materials and Methods

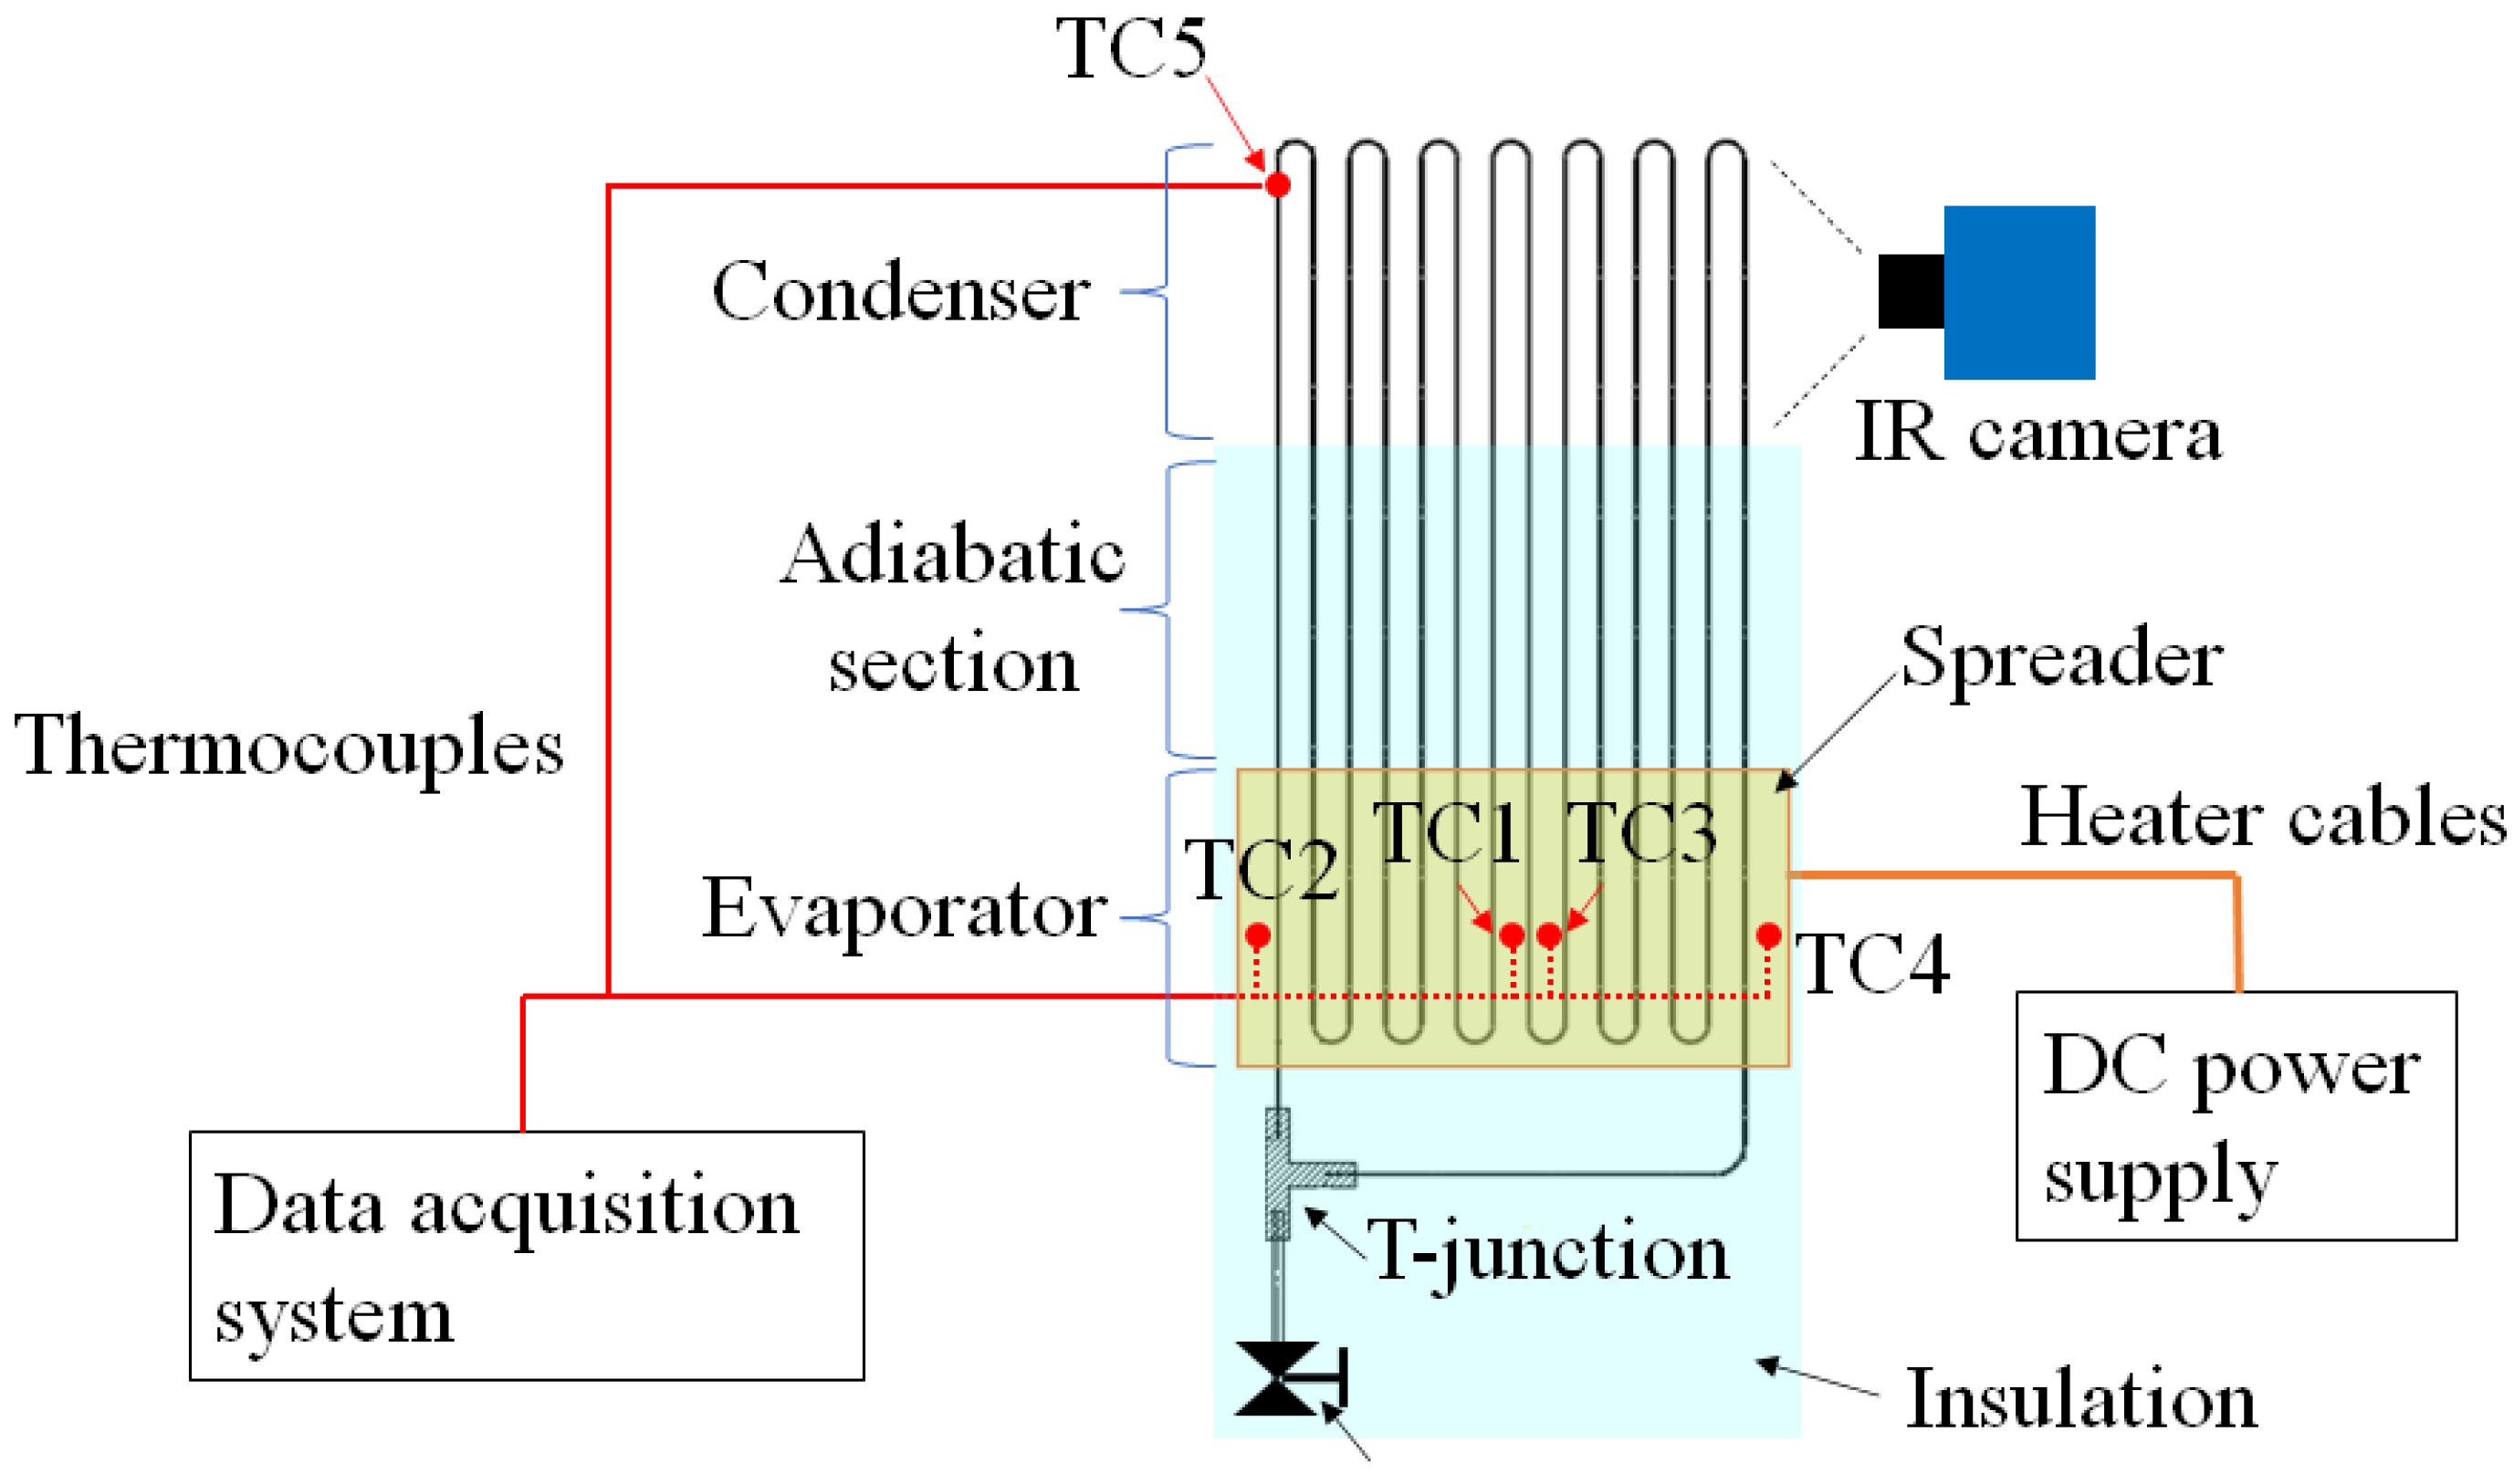
2.1. Experimental Setup

The PHP in this study was fabricated by bending a stainless-steel tube characterized by an internal diameter of 0.32 mm and a wall thickness of 0.1 mm, 13 times. In the temperature interval 280–350 K, the internal diameter is lower than the critical value D c r i t under the gravitational environment specified as [31]:
D c r i t = 2 σ g ρ l ρ v
where σ, g, ρl, and ρv are the surface tension, gravitational acceleration, liquid and vapor densities, respectively. Dcrit values for HFC-134a in the range 280 K–350 K [32] are between 0.99 mm and 1.8 mm.
Both ends of the tubes were interconnected and joined in a T-junction with a tube leading to a charging port, as shown in Figure 1. The distance between turns at both ends were 150 mm, divided into an evaporator, an adiabatic section, and a condenser, each with a length of 50 mm. At the evaporator, the tubes were fixed to a spreader with a polyimide sheet heater attached on the other side that provided the heat power. The condenser tubes were covered by a thin layer of highly emitting paint. The cooling at the condenser was provided by natural convection while heat losses were limited at the evaporator and adiabatic section through an insulating layer. The PHP was partially filled (filling ratio of 46% vol) with HFC-134a. The temperature at the condenser section was acquired thanks to a thermographic camera (FLIR SC7000, spatial resolution: 640 × 512 pixels, accuracy: ±1 K, sensitivity ≤ 20 mK). The temperature in the other sections could not be monitored by the infrared camera due to the presence of the insulating layer. Therefore, type-T thermocouples were adopted, and their position is shown in Figure 1. One probe was placed on the sheet heater (TC1), and three were fixed to the heat spreader at the evaporating section (TC2–TC4). One sensor was positioned also at the condenser to provide a comparison with the infrared measurements (TC5). The uncertainties of the measured quantities are reported in Table 1.
The heat power was supplied at the evaporator section with a stepwise function from 0.1 W to 5 W (up to the operational threshold) by a DC power supply (HEWLETT PACKARD 6631B). Thermocouples signals were acquired by a digital multimeter (AGILENT 34970A) once a pseudo-steady state was reached in the PHP. The IR camera acquired temperature values with a frequency of 18 Hz while thermocouples of 1 Hz. In the performed measurements, the PHP worked in vertical bottom heat mode, i.e., with the evaporator at the bottom. In an earlier analysis [33], further information was provided about the setup and test conditions.

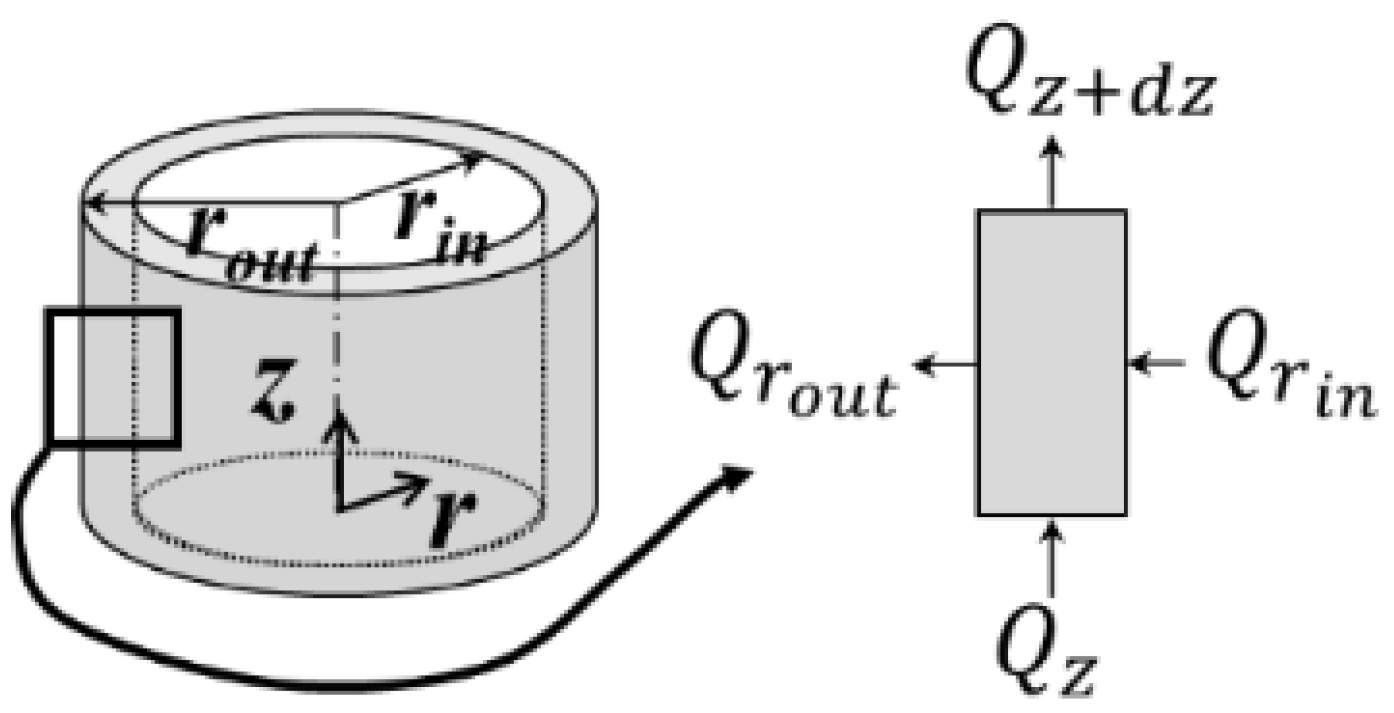
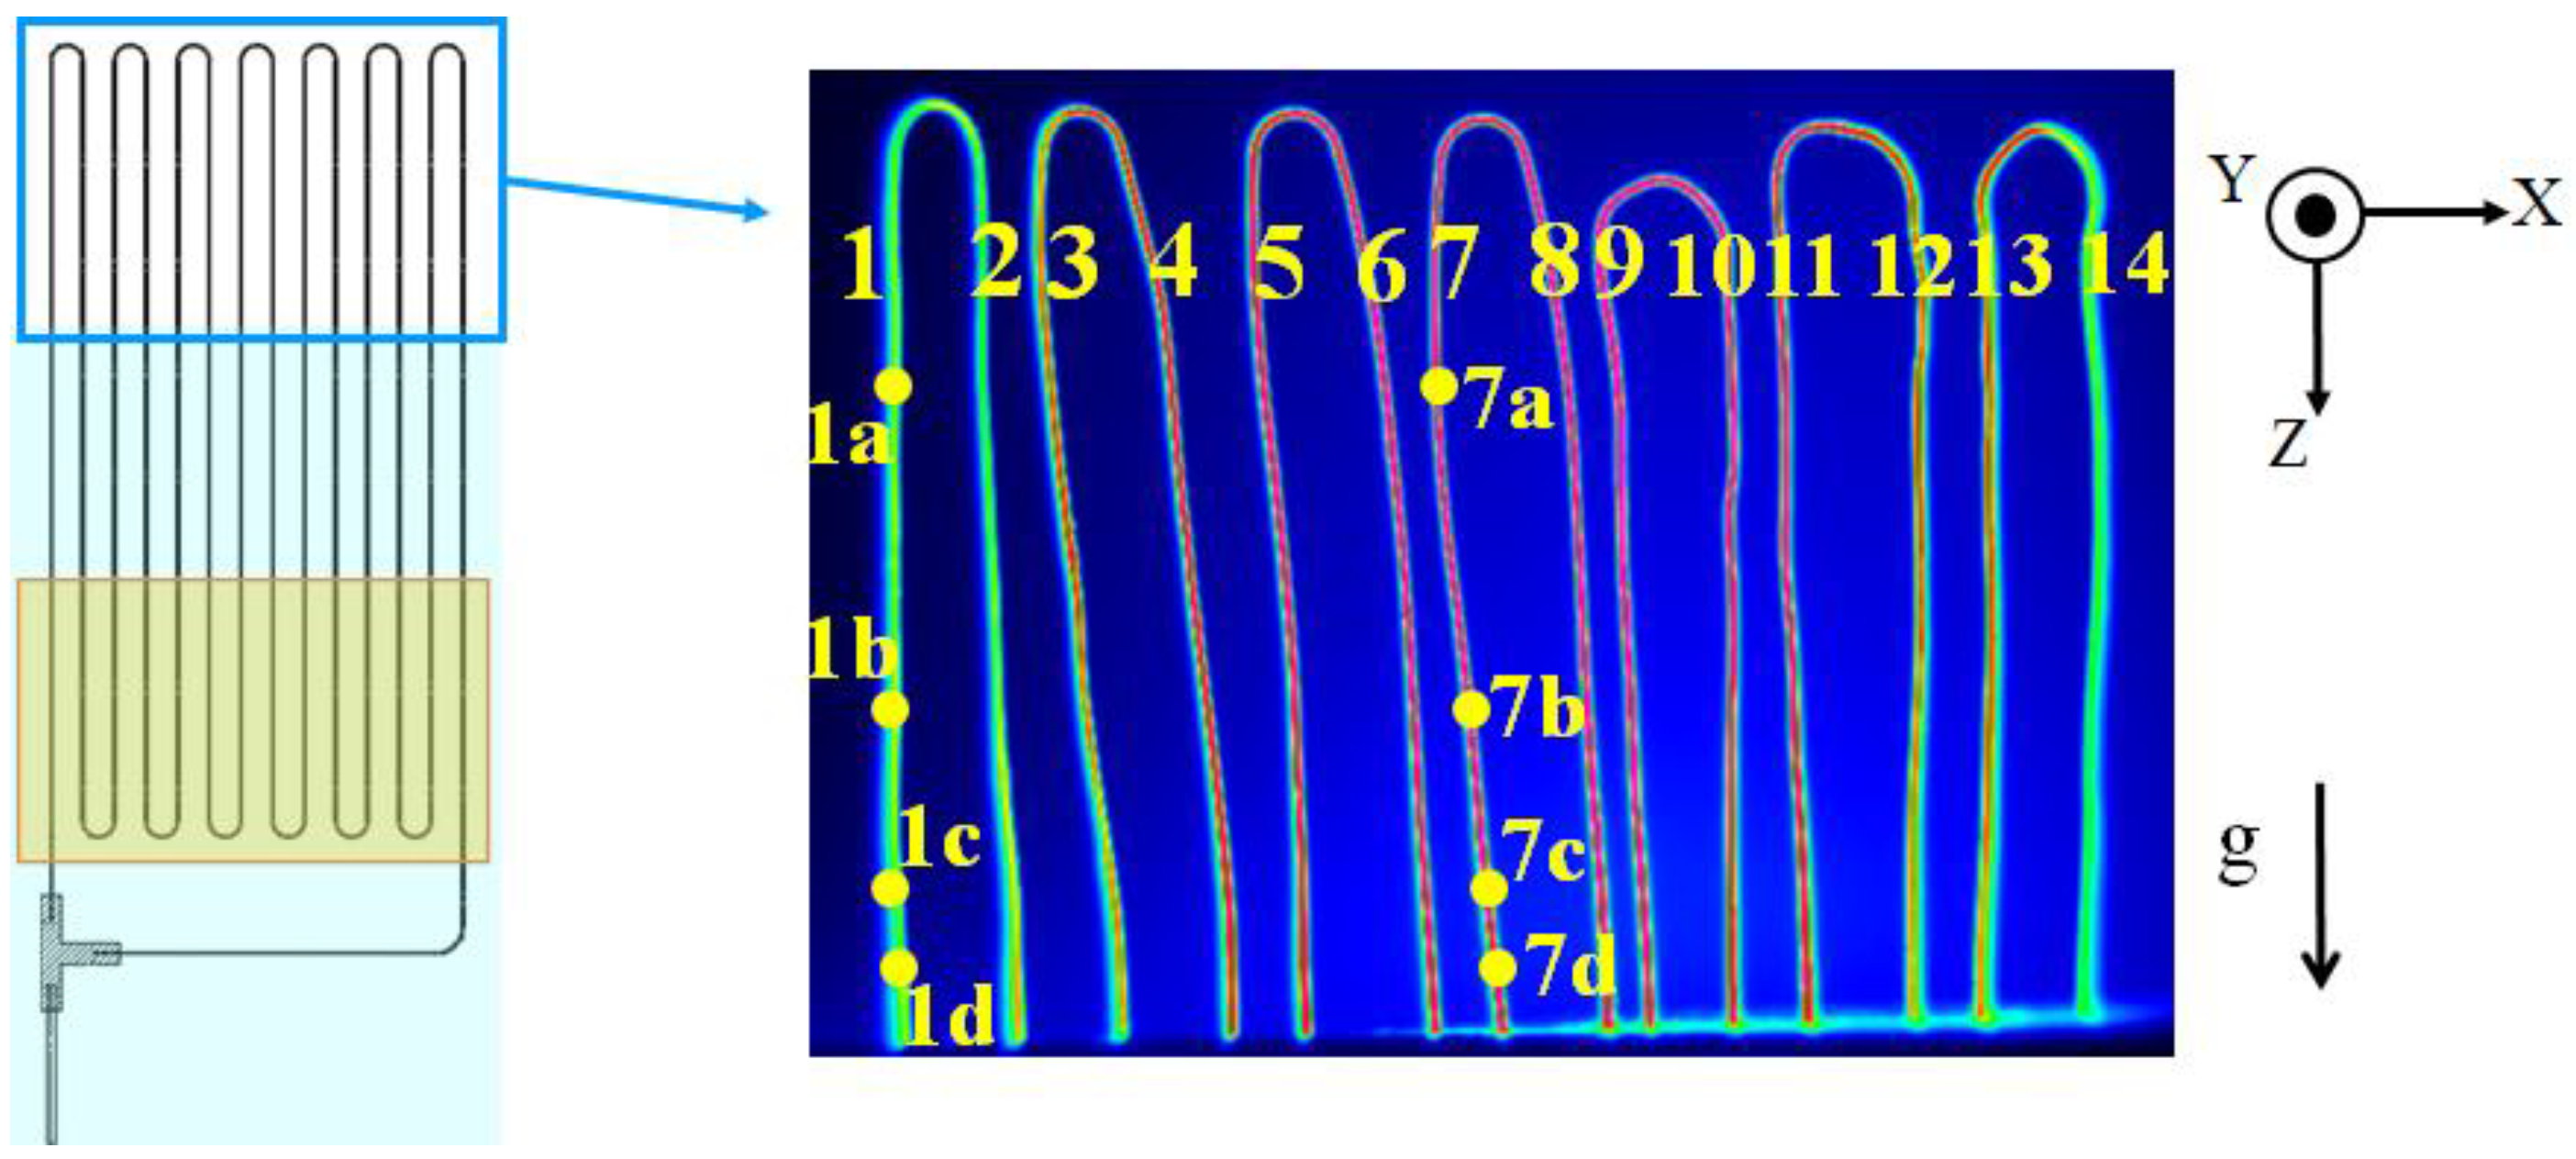
2.2. Post-Processing

Starting from the time–space temperature distribution measured with thermography, the local heat flux at the inner channel surface was determined by the solution of the IHCP in the channel wall. Generally, the fluid-to-wall heat flux cannot be calculated unless both the wall surface and fluid temperatures are measured. The heat flux was estimated without measuring fluid temperature by solving IHCP, which is widely used to determine a heat flux or a temperature distribution which are difficult to measure directly [34]. Every straight portion of the tubes in the condenser section was studied as a 2D-axisimmetric solid domain, shown in Figure 2. Thanks to the thin-wall approximation, whose validity was verified (Biot number ≤ 0.1 for all the tests), the outer channel temperature was assumed equivalent to the inner one. Moreover, due to experimental examinations, the variation of the wall temperature over the angular coordinate can be considered negligible.
Considering these two assumptions and referring to the infinitesimal wall portion highlighted in Figure 2, the energy balance is expressed as:
d U d t = Q Z Q z + Δ z + Q r i n Q r o u t
where Q Z and Q z + Δ z are the heat conduction components in the axial direction z, while Q r o u t and Q r i n represent the heat transferred to the ambient by natural convection and the heat transferred from the fluid to the tube inner wall, respectively, and d U d t is the variation with time of the internal energy. The terms of the energy balance can be defined as:
d U d t = ρ w c p w T t · π r o u t 2 r i n 2 · Δ z
Q z = k w T z · π r o u t 2 r i n 2
Q z + Δ z = k w T z · π r o u t 2 r i n 2 k w 2 T z 2   π r o u t 2 r i n 2 · Δ z
Q r i n = q 2 π r i n · Δ z
Q r o u t = T T e n v h e n v 2 π r o u t · Δ z
where ρ w , c p w and k w are the wall density, specific heat, and thermal conductivity, respectively. The external and internal radiuses of the tube are symbolized as r o u t and r i n . Equation (3a) expresses the time-derivative of internal energy of the infinitesimal tube wall. Equations (3b) and (3c) were derived by the thermal conduction of the tube wall in axial direction. Equation (3d) expresses fluid-to-wall heat transfer using the heat flux of q . In Equation (3e), which expresses the heat transfer from the outer surface of the tube to the ambient air, T , T e n v , and h e n v are the fluid temperature, the ambient temperature, and global heat-transfer coefficient between the channel external surface and the ambient, respectively. By replacing Equations (3a)–(3e) into Equation (2), the heat flux at the channel internal surface q is expressed as:
q = 1 2 r i n ( ρ w c p w T t k w T 2 z 2 ) · r o u t 2 r i n 2 + T T e n v G e n v · 2 r o u t
Equation (4) was resolved adopting the finite difference approach:
q z , t = 1 2 r i n ( ρ w c p w T z ,     t + Δ t T z , Δ t Δ t k w T z + Δ z ,     t + T z Δ z , t 2 T z , t ( Δ z ) 2 ) · r o u t 2 r i n 2 + T z , t T e n v G e n v · 2 r o u t
By solving Equation (5), with inputting the outer surface temperature measured by the IR camera and the environment temperature during the experiment, the local heat flux q can be derived. However, because the raw data of the measured surface temperature are inevitably noisy and the derivative operators are sensitive to small disturbances in the input data, Equation (5) is likely to give unstable results. To overcome this, the regularization method [34] was applied: the heat flux can be obtained by employing the filtered temperature instead of the measured temperature in Equation (5). The filtering temperature was derived by iterative calculation: first, the raw data of the temperatures was converted to the frequency domain. Starting from 2 Hz, the cut-off frequency of the filter was increased until the difference between the measured and the filtered temperatures were nearly equivalent to the standard deviation of the raw measurements. The detailed process is reported in the Authors’ previous work [35].
The above post-processing method was validated by solving a direct problem, i.e., deriving the heat flux from two known temperatures. The maximum error between the heat flux estimated by IHCP and the exact flux, i.e., that derived by solving the direct problem, was found to be equal to 16.1% of exact flux, which provides a reference to the accuracy of the proposed method. The details of the validation are also given in [35].
To investigate the flow characteristics in the PHP, the similarity of two heat flux signals, referring to two different axial coordinates z, was evaluated by classical cross-correlation coefficient. For finite functions x1 and x2, the cross-correlation R x 1 , x 2 τ is estimated by [36]:
R x 1 , x 2 ( τ ) = 1 S τ τ S x 1 ( t ) x 2 t τ d t
where S and τ denote the observation interval and the time delay, respectively.
In order to compare the two heat flux signals at two different time values t 1 and t 2 , it is convenient to choose a M suitable time window and compute the following function based on the cross-correlation between the two shifted signals:
G q 1 , q 2 t 1 , t 2 = 0 M q 1 t 1 + t · q 2 t 2 + t d t
The cross-correlation was normalized so that the autocorrelation at zero lag is 1:
G q 1 , q 2 , n o r m a l i z e d t 1 , t 2 = G x q 1 , x q 2 t 1 , t 2 G q 1 , q 2 t 1 , t 1 G q 1 , q 2 t 2 , t 2
In this way, the flow structures at the two positions were compared for each window from the beginning to the end of the temperature measurement by IR camera to find similarities and differences. As shown in Figure 3, the analyzed target was the condenser that was composed by a section of every straight channel included between 12 mm and 45 mm from the U-shaped apex. Every channel straight portion was constituted by 214 pixels in the axial direction. Each pipe was named from Ch 1 to Ch 14 as shown in the left image of Figure 3. Eight points were selected for the cross-correlation analysis: 1a~1d in Ch1 tube and 7a~7d in Ch7 as shown in the right image of Figure 3. The distance from the apex of the U-shape in the condenser was 13 mm for 1a and 7a, 29 mm for 1b and 7b, 38 mm for 1c and 7c, 44 mm for 1d and 7d. The cross-correlation of the local fluid-to-wall heat flux at these points were evaluated.

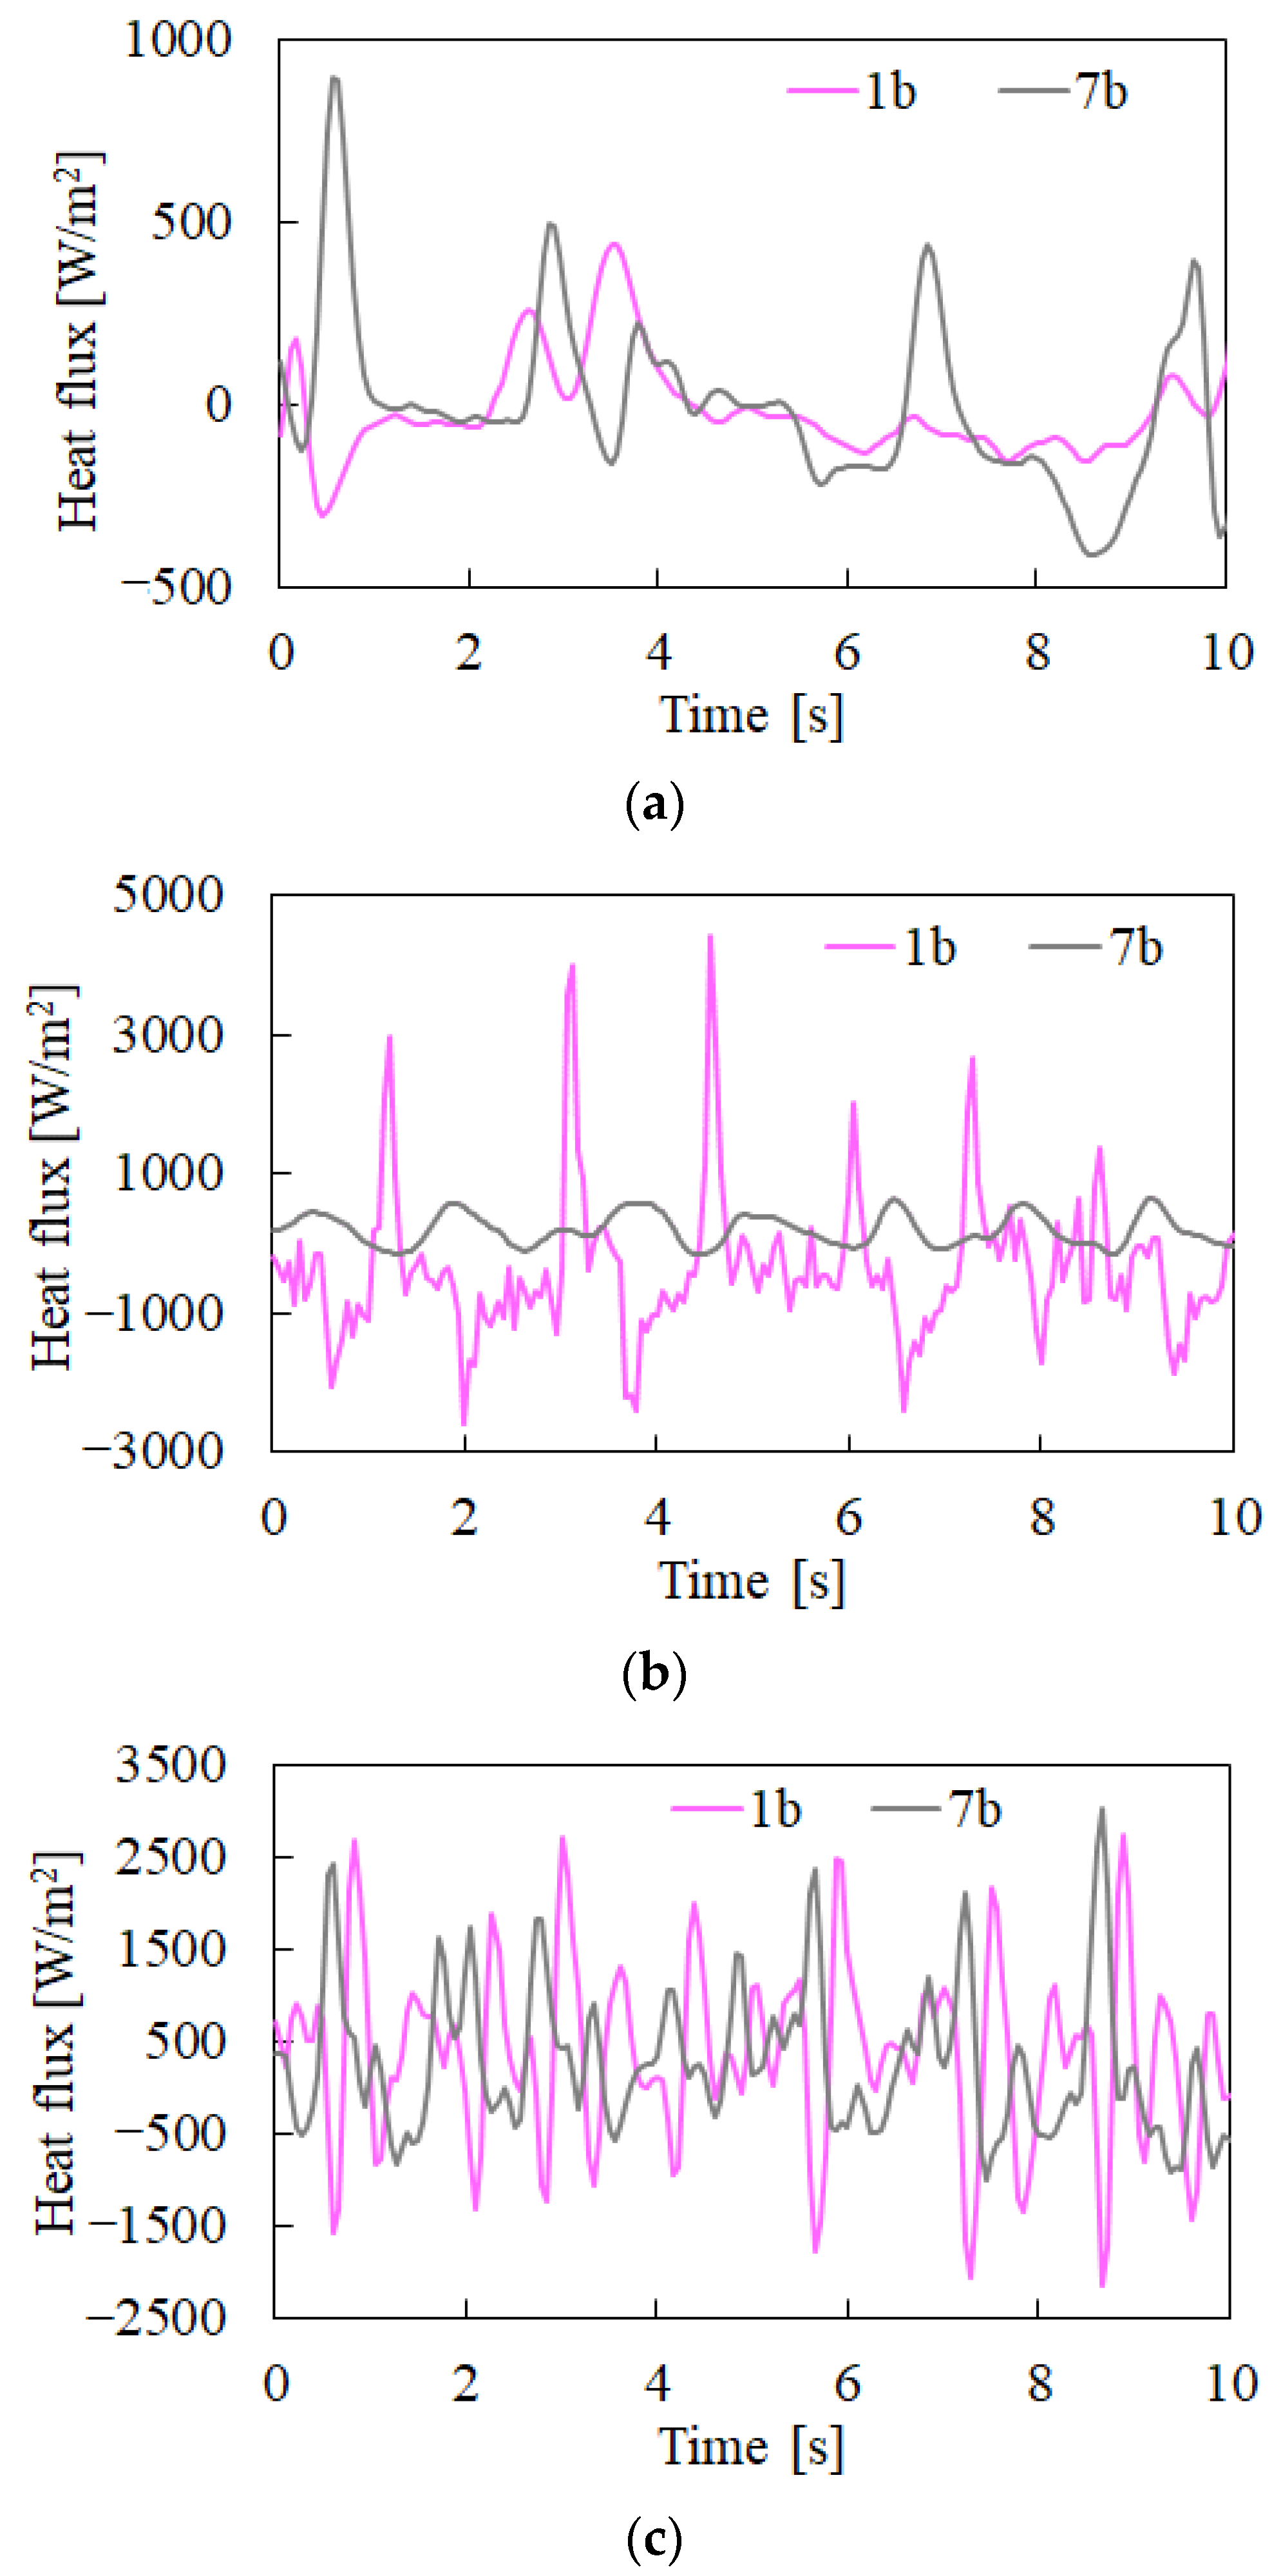
3. Results and Discussion

The measurement results for the IR camera suggested that the ascending fluid from the evaporation section to the condensation section started intermittently at Qele = 0.1 W, while it stopped in the middle of the condenser. Then, at Qele = 0.5 W, the fluid oscillated more actively and ascending fluid returned to the evaporator. Figure 4 shows the estimated heat fluxes at three different positions in the central tube (7a, 7c, and 7d) of the condenser at Qele = 0.5 W, 2 W, and 3.5 W.
The heat fluxes clearly showed the transience of the flow regimes: at low power load of 0.5 W, the fluid oscillation was still intermittent and occurred randomly, while it transitioned to more periodic and active oscillation with the increase of the power input, as could be noticed from the increasing frequency and amplitude of the oscillation shown in Figure 4b,c. Figure 4 presents that the waveforms are consistent when the distance between two positions is as small as 6 mm (7c and 7d), but they shift when the distance is 31 mm (7a and 7d). This trend is most pronounced for the heat fluxes at Qel = 0.5 W.
Cross-correlation was applied to the one-minute time-series heat fluxes of two different combinations of positions on Ch7, namely 7a–7d and 7c–7d. In particular, the cross-correlation was computed by considering 15-s time windows. The results are shown in Figure 5, Figure 6 and Figure 7 for Qele = 0.5 W, 2 W, and 3.5 W, respectively, as the normalized maximum cross-correlations.
The three figures revealed the different trends in the cross-correlation depending on the power input. At 0.5 W, there were no clear cross-correlations between two positions at a longer distance of 31 mm, as Figure 5a shows, though it could be found from the diagonal line in two positions at distance of 6 mm as shown in Figure 5b. On the other hand, in cases of larger heat input of 2 W and 3.5 W, the cross-correlation between two positions appeared more clearly even in the two positions with the distance of 31 mm. At 3.5 W, the cross-correlation could be confirmed in both Figure 7a,b so clearly that the difference due to the distance between two positions was indistinguishable. It suggested that the flow in the condenser changed with the distance from the evaporator in the low power input, possibly due to the intermittent and random oscillations. In other words, the fluid heated in the evaporator did not pass throughout the condenser and stopped in the middle of the tube due to the low driving force (low saturation pressure difference between the evaporator and the condenser). On the other hand, in the high-power input, the fluid was presumed to flow continuously inside the analyzed channel. This is because the higher evaporator temperature provided sufficient driving force for the working fluid to flow through the tube, overcoming gravity and shear force mainly between the liquid slug and the inner tube wall.
The cross-correlation method was applied to the heat fluxes at 1a–1d and 1c–1d (i.e., the three points in the edge tube Ch1) for Qele = 2 W and 3.5 W, which are shown in Figure 8 and Figure 9, respectively. The target time period and time windows were equal to those applied for Figure 5, Figure 6 and Figure 7. Comparison with Figure 6 shows that at 2 W the cross-correlation between the two positions is ambiguous in Ch1, even at a small distance of 6 mm. The Figure 9 also shows the same trend, while the diagonal line is shown more clearly than that of 2 W, in particular in the case of smaller distance (i.e., 6 mm). This suggested two behaviors of the flow: one was that the fluid oscillated more regularly in the central tubes than in the edge tubes. The two edge tubes, Ch1 and Ch14, were interconnected at T-junction which was connected to the manual valve. The total inner volume of the T-junction and the valve were almost equivalent to one-third of the PHP’s whole volume as the PHP’s inner tube diameter was as small as 0.32 mm. Therefore, presumably the junction and the valve acted as a damper to absorb the fluid oscillation, which caused less active and less regular oscillation in the edge tubes than that of the central tubes. The other fluid behavior interpreted by the results of cross-correlation is that the oscillation became uniform in all the tubes with increase of the heat input. This was presumably because more active oscillation at higher power input caused by the higher driving force overcame the damper effect of the edge tubes described above.
Figure 10 shows the estimated heat fluxes at 1b and 7b at Qele = 0.5 W, 2 W, and 3.5 W. At 0.5 W, the heat flux remained at zero between the peaks shown every 3~6 s in each channel as seen in Figure 4a. However, the peaks in each channel appeared to occur randomly with respect to each other. It is presumed that the fluid oscillation occurred in each tube randomly but the oscillation does not propagate throughout the PHP. In general, the propagation of the pressure oscillation between the tubes can be the driving force of the PHP [37]. This results in better heat transfer performance in a PHP with larger number of turns than a PHP with smaller number of turns including a single-loop PHP [38]. In the case of low power input of 0.5 W, there was little interaction of the fluid oscillations between the tubes, resulted in an intermittent flow with a stop-over period in between.
At high heat input, the heat fluxes showed more regular pulsations. At 2 W, however, the waveforms of Ch1 and Ch7 still appeared to be unrelated each other, though their dominant frequency were similar in Figure 10b. In addition, the edge tube showed a waveform with periodic sharp peaks at large amplitudes of up to 4000 W/m2, whereas that of the central tube was a more stable oscillation with a maximum heat flux of 400~500 W/m2. This suggests the existence of the two different types of flow regimes in the PHP; stable and continuous oscillation in the central tube and intermittent and rapid flow of the heated fluid from the evaporator to the condenser in the edge pipe.
Compared with the results of 0.5 W and 2 W, the difference in the waveforms of Ch1 and Ch7 was mitigated at 3.5 W, as shown in Figure 10c. The heat fluxes show the regular and stable oscillations regardless the tube location, unlike with the result of 2 W. The above interpretations are consistent with that for Figure 9. In other words, the fluid oscillations at high power input became more active throughout the PHP due to the high driving force, and the intermittent oscillations in the edge tubes observed at low inputs were no longer present.
To investigate the correlations between the edge and central tubes, the cross-correlation method was applied to the one-minute time-series heat fluxes at 1b and 7b, for Qele = 0.5 W, 2 W, and 3.5 W. The results are displayed in Figure 11. As predicted from Figure 10a, at 0.5 W, there was little cross-correlation between the two tubes. Furthermore, the cross-correlation appeared clearer than that of 0.5 W with the increase of the heat input, also as predicted in Figure 10. At 3.5 W, the diagonal line is clearly shown in Figure 11c, though not as pronounced as in Figure 7 and Figure 9b. This indicated that the flows in the middle and edge tubes were synchronized. One of the reasonable interpretations for this is that the PHP was dominated by a unidirectional flow at the high-power input, as the previous studies reported [39,40]. This interpretation is also consistent with the authors′ previous study [35].

4. Conclusions

Despite the advantages and several potential applications, PHP has not yet been fully put into practical use due to the insufficient knowledge of thermo-fluid dynamics principles. A new approach of applying cross-correlation analysis to local heat fluxes was proposed to deepen the understanding of the flow characteristics in PHPs. The temperature distribution in the condenser of a seven-turn PHP was measured with an IR camera, changing the power input. The local heat flux distributions were assessed by solving the IHCP. The cross-correlation of the heat fluxes at two different positions in the same tube or different two tubes in the condenser was analyzed. The main outcomes are as follows:
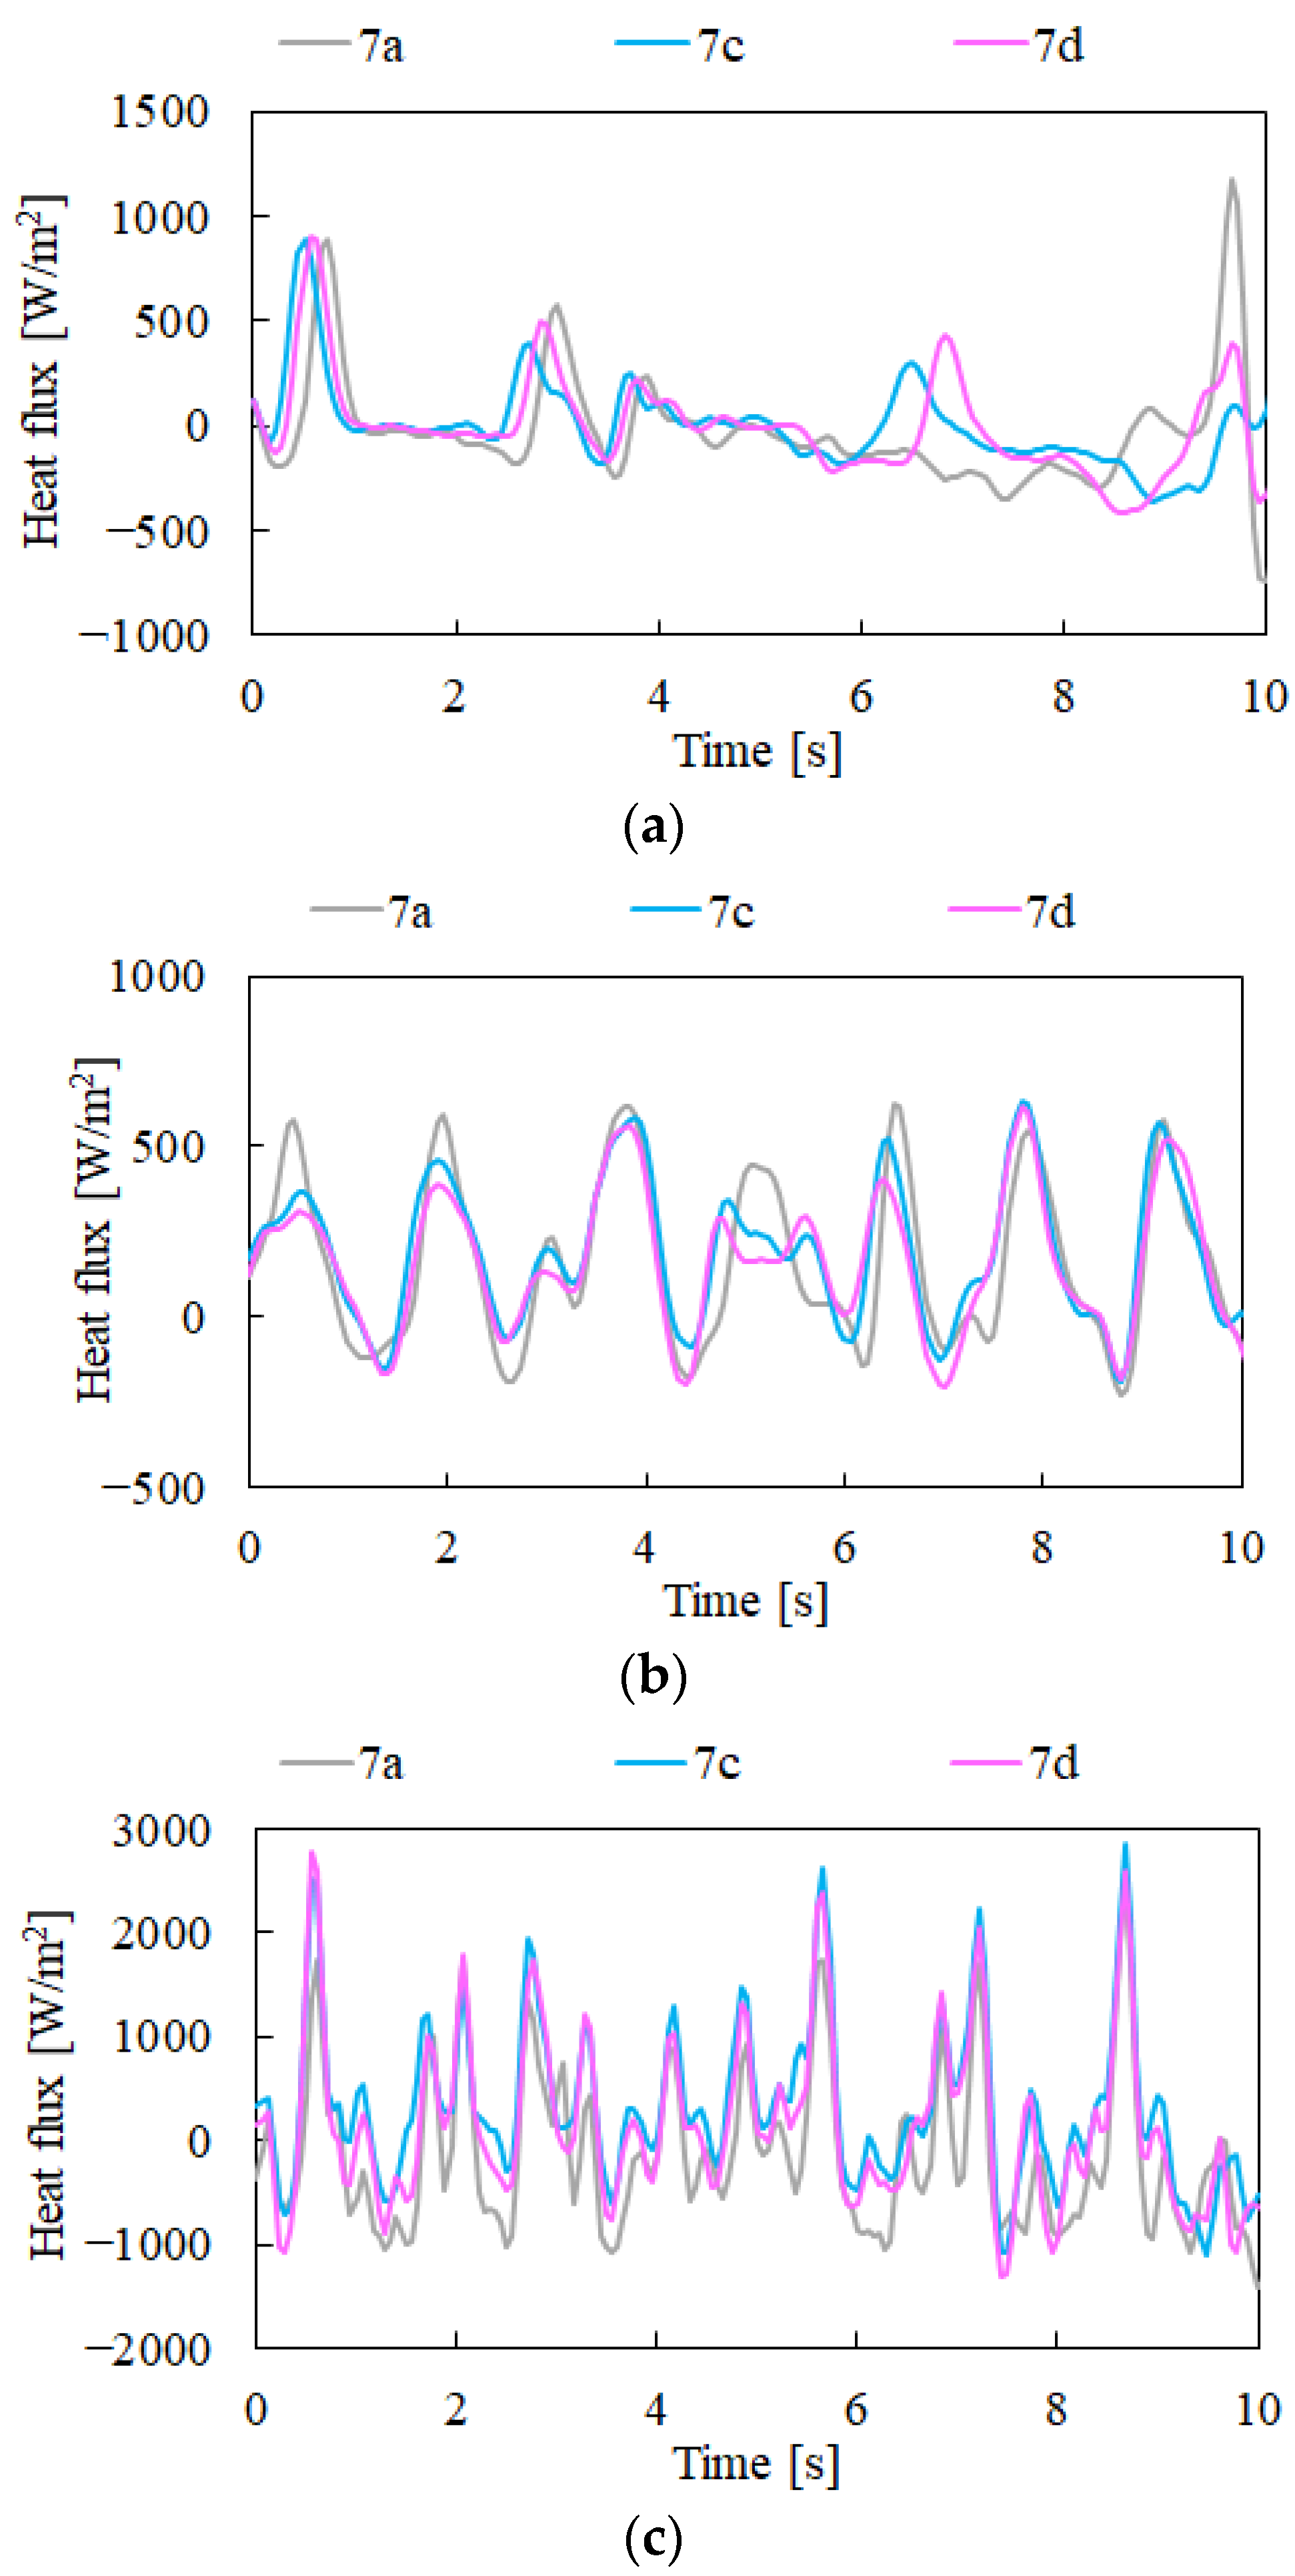
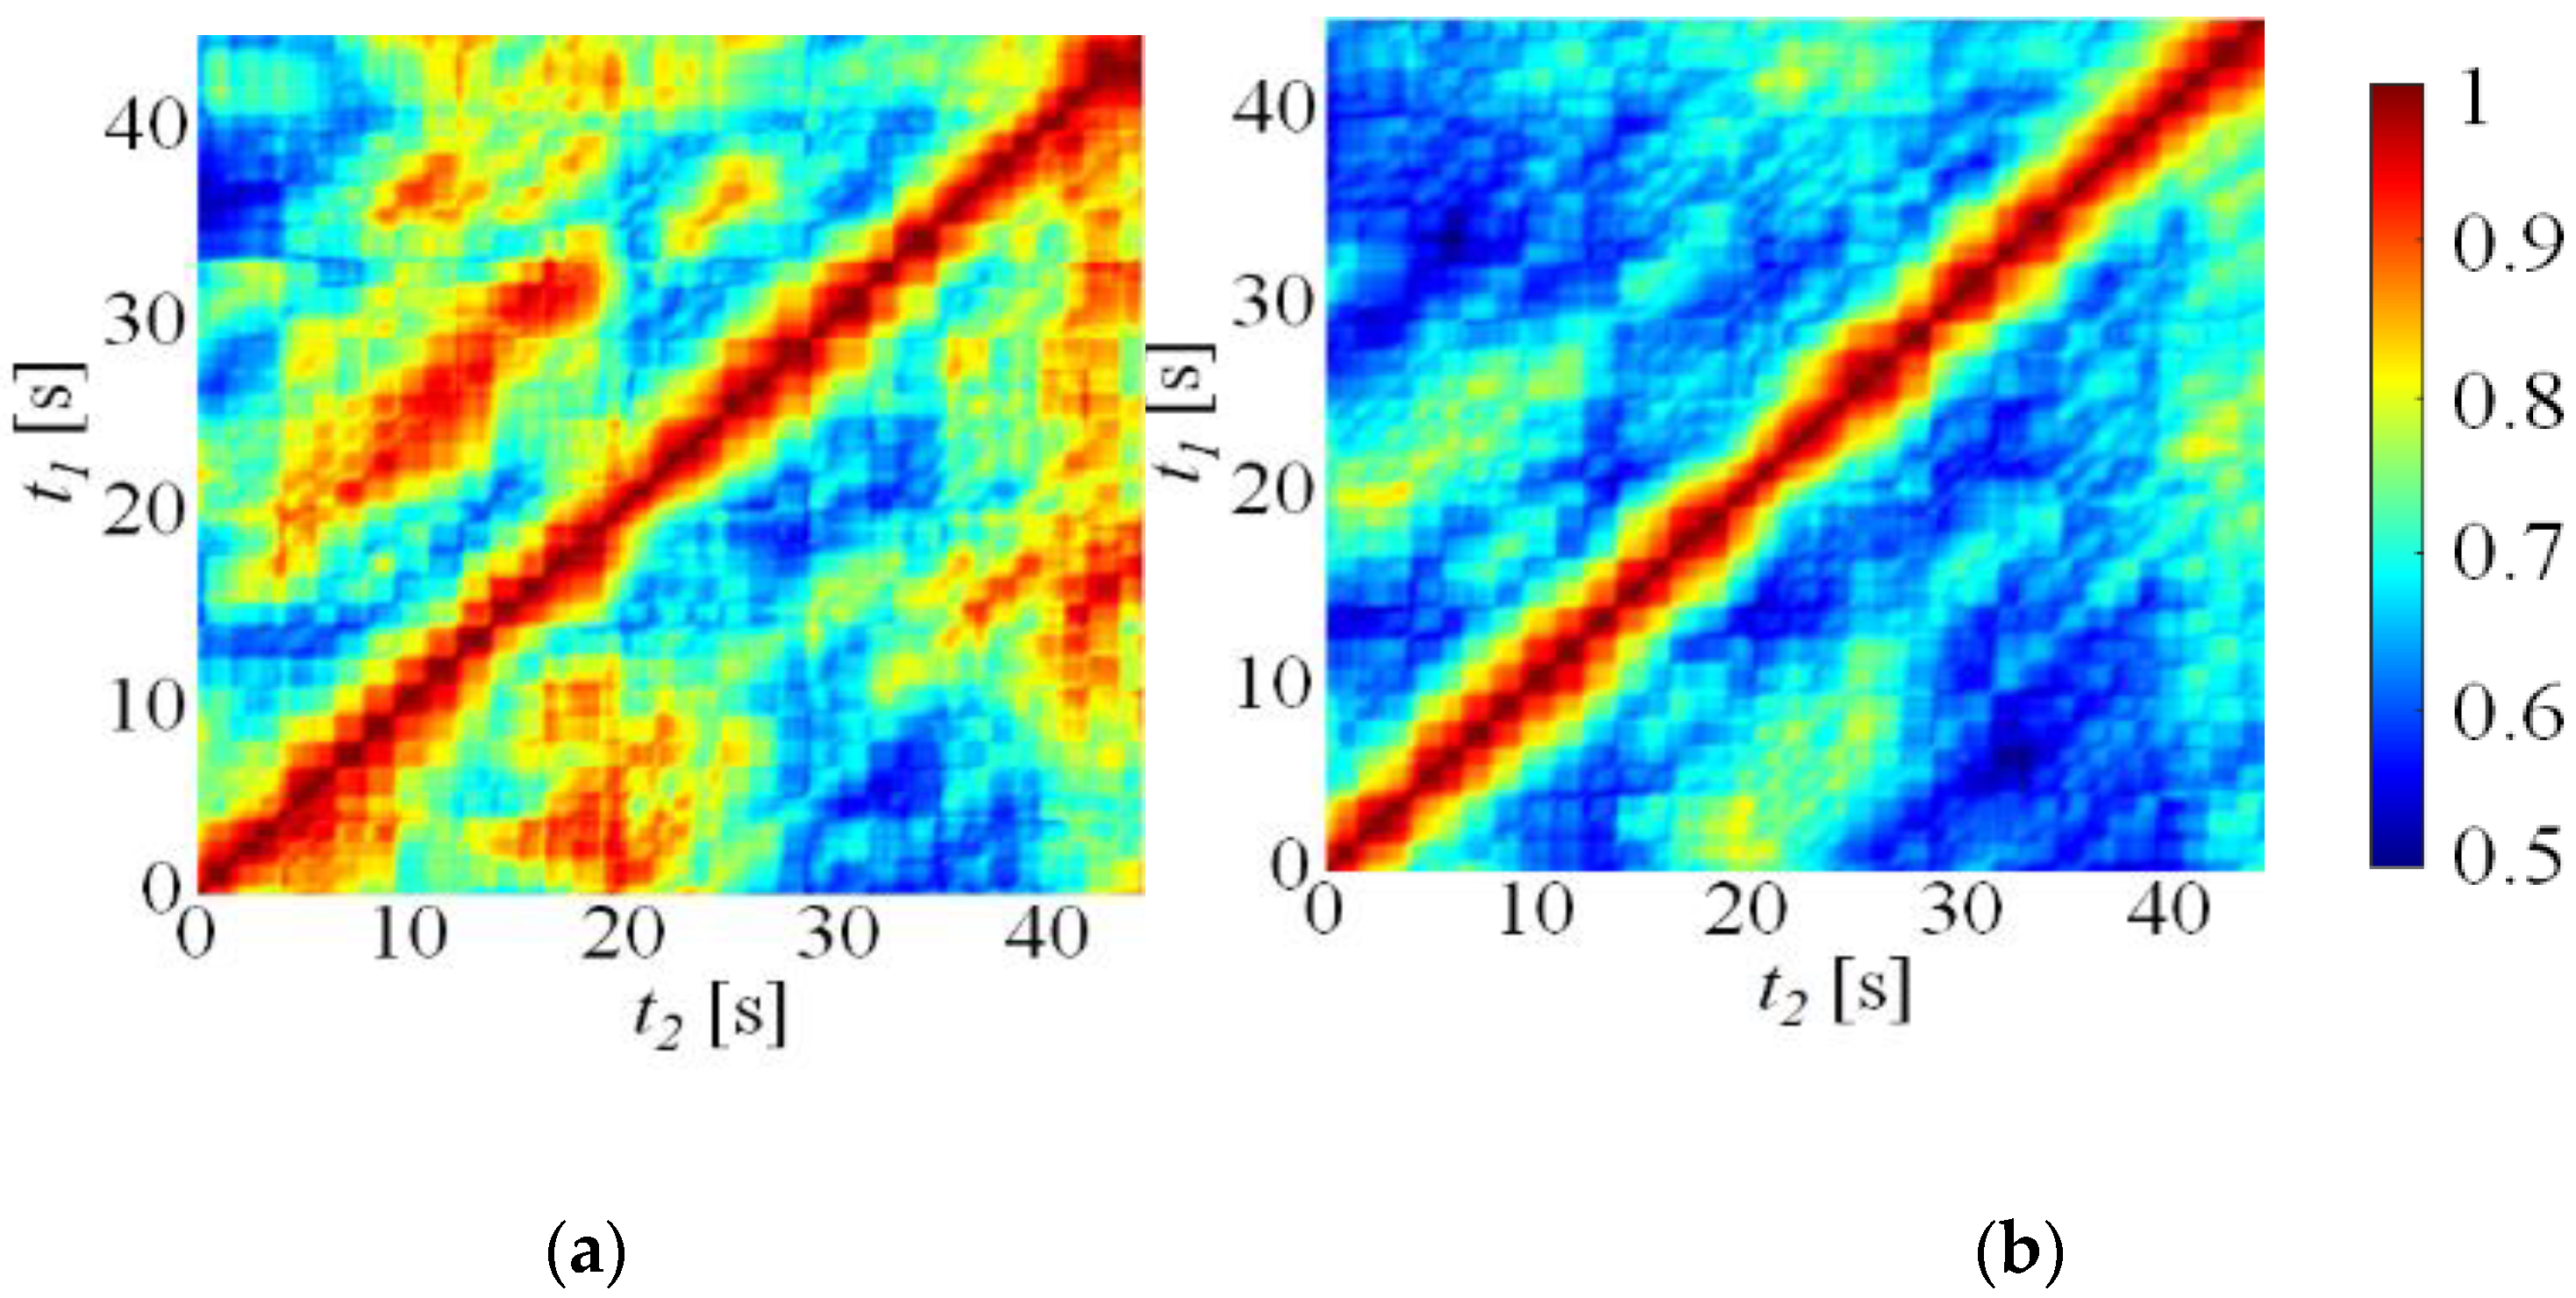
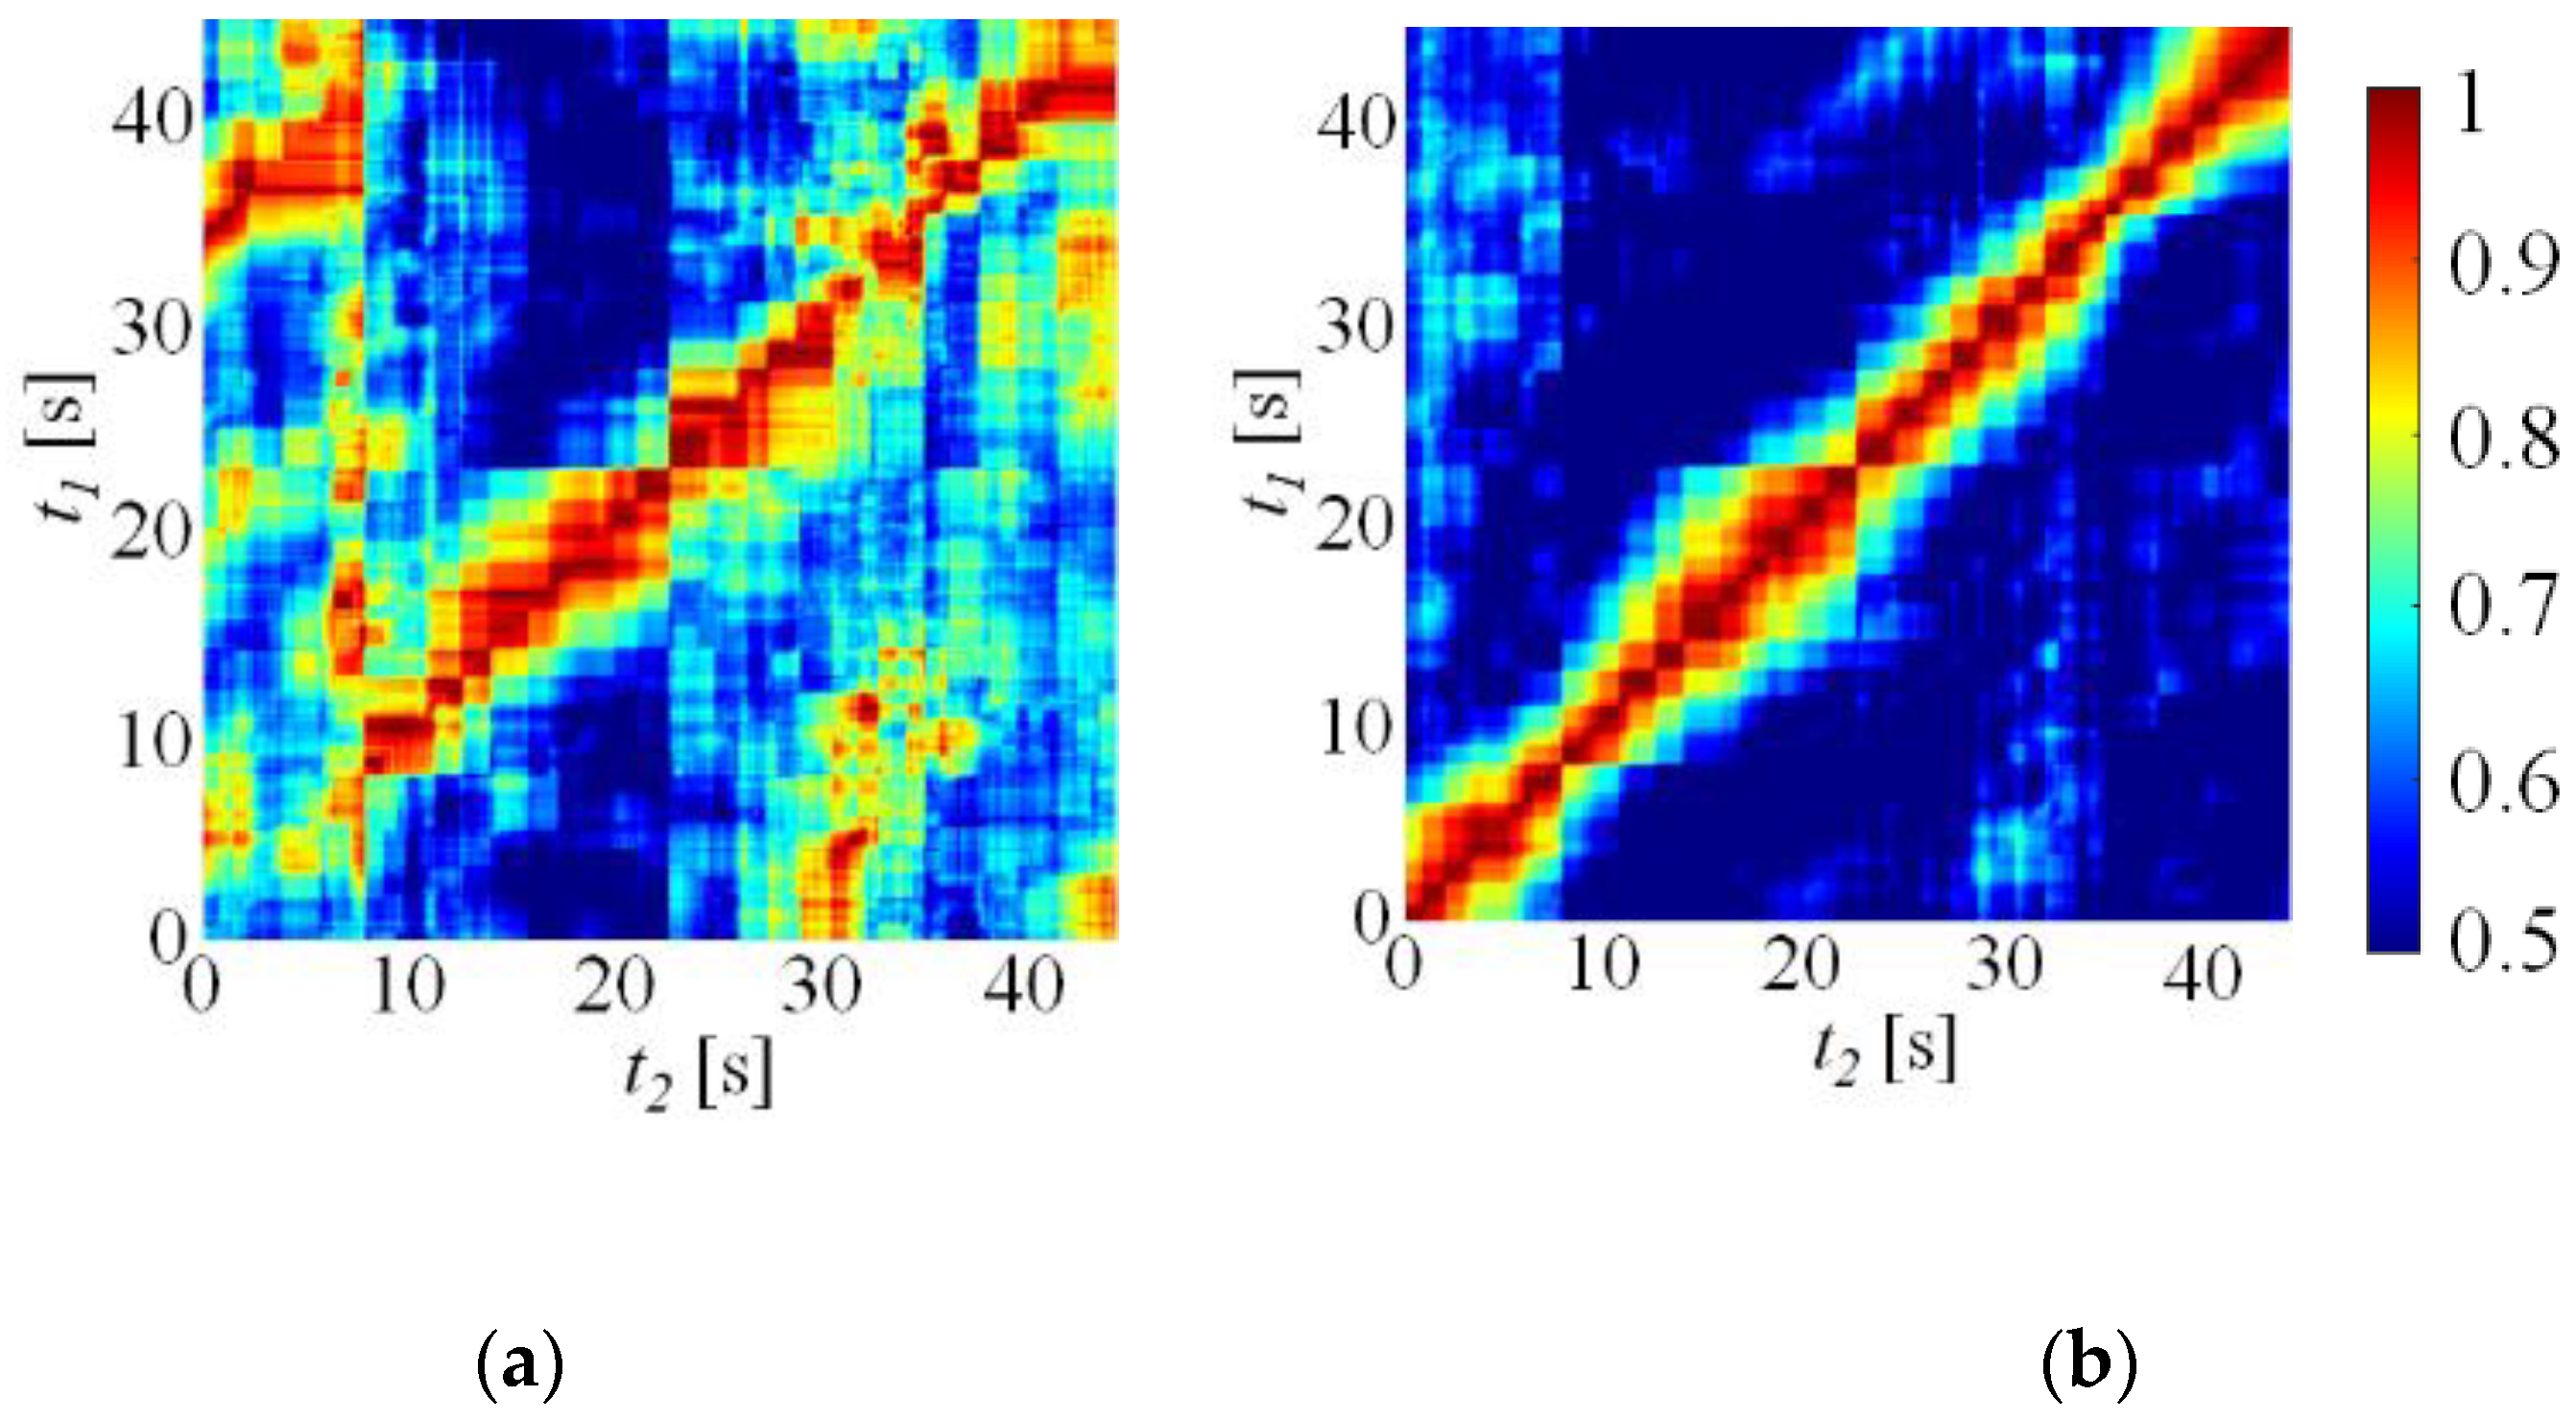
  • No clear cross-correlations were found at low power input of 0.5 W except for the two points with 6 mm distance in the central tube as the fluid heated in the evaporator did not pass throughout the condenser and stopped in the middle of the tube due to the low driving force.
  • At higher inputs of 2 W and 3 W, the fluid oscillated more actively, and the flow became continuous across the entire tube of the condenser, showing a clear cross-correlation with the diagonal.
  • At 2 W, there was little cross-correlation between the central and edge tubes, which suggests the existence of two different flow regimes caused by the damper effect of the T-junction and the valve.
  • The results for 3.5 W showed clear cross-correlation between the edge and central tubes, indicating that they were synchronized and suggesting the PHP was dominated by a unidirectional flow.
In summary, it is suggested that the original approach presented in this study can lead to a better understanding of the chaotic fluid oscillations in PHP.

Author Contributions

Conceptualization, F.B. and N.I.; methodology, F.B. and N.I.; software, L.C., L.P. and N.I.; validation, L.P., L.C. and F.B.; formal analysis, N.I. and L.P.; investigation, N.I., L.C., L.P. and M.M.; resources, F.B.; data curation, N.I. and F.B.; writing—original draft preparation, N.I.; writing—review and editing, L.C., L.P. and M.M.; visualization, L.C.; supervision, F.B. and S.R.; project administration, N.I. and F.B.; funding acquisition, N.I. and F.B. All authors have read and agreed to the published version of the manuscript.

Funding

This work was funded by the European Union′s Horizon 2020 research and innovation program under the Marie Skłodowska-Curie grant agreement No 894750.

Data Availability Statement

Not applicable.

Conflicts of Interest

The authors declare no conflict of interest.

Nomenclature

Cp[J/kgK]Specific heat at constant pressure
D[m]Diameter
G[-]Cross-correlation of heat fluxes
g[m/s2]Gravity acceleration
h[W/m2K]Heat transfer coefficient
k[W/mK]Thermal conductivity
M[-]Number of time windows
Q[W]Heat load
q[W/m2]Heat flux
R[-]Cross-correlation (General definition)
r[m]Radius
S[-]Observation time interval
T[K]Temperature
t[s]Time
U[J]Internal energy
z[-]Axial coordinate
Special characters
ρ[kg/m3]Density
б[N/m]Surface tension
τ[s]Estimate of time delay
Subscripts
crit Critical
ele Electrical
env Environment
in Inner
l Liquid
out Outer
v Vapor
w Wall

References

  1. Mahajan, R.; Chiu, C.P.; Chrysler, G. Cooling a microprocessor chip. Proc. IEEE 2006, 94, 1476–1486. [Google Scholar] [CrossRef]
  2. Moore, A.L.; Shi, L. Emerging challenges and materials for thermal management of electronics. Mater. Today 2014, 17, 163–174. [Google Scholar] [CrossRef]
  3. Lu, L.; Han, X.; Li, J.; Hua, J.; Ouyang, M. A review on the key issues for lithium-ion battery management in electric vehicles. J. Power Sources 2013, 226, 272–288. [Google Scholar] [CrossRef]
  4. Pesaran, A.; Santhanagopalan, S.; Kim, G.-H. Addressing the impact of temperature extremes on large format Li-ion batteries for vehicle applications. In Proceedings of the 30th International Battery Seminar, Fort Lauderdale, FL, USA, 11–14 March 2013. [Google Scholar]
  5. Feng, X.; Ouyang, M.; Liu, X.; Lu, L.; Xia, Y.; He, X. Thermal runaway mechanism of lithium ion battery for electric vehicles: A review. Energy Storage Mater. 2018, 10, 246–267. [Google Scholar] [CrossRef]
  6. Xia, G.; Cao, L.; Bi, G. A review on battery thermal management in electric vehicle application. J. Power Sources 2017, 367, 90–105. [Google Scholar] [CrossRef]
  7. Grover, G.M. Evaporation-Condensation Heat Transfer Device. U.S. Patent 3,229,759, 18 January 1966. [Google Scholar]
  8. Faghri, A. Heat pipes: Review, opportunities and challenges. Front. Heat Pipes 2014, 5, 1–48. [Google Scholar] [CrossRef] [Green Version]
  9. Bernagozzi, M.; Georgoulas, A.; Miché, N.; Marengo, M. Heat pipes in battery thermal management systems for electric vehicles: A critical review. Appl. Therm. Eng. 2023, 219, 119495. [Google Scholar] [CrossRef]
  10. Smith, J.; Singh, R.; Hinterberger, M.; Mochizuki, M. Battery thermal management system for electric vehicle using heat pipes. Int. J. Therm. Sci. 2018, 134, 517–529. [Google Scholar] [CrossRef]
  11. Gilmore, D.G. Spacecraft Thermal Control Handbook Volume I: Fundamental Technologies; The Aerospace Cooperation: El Segundo, CA, USA, 2002. [Google Scholar]
  12. Maydanik, Y.F. Loop Heat Pipes. Appl. Therm. Eng. 2005, 25, 635–657. [Google Scholar] [CrossRef]
  13. Iwata, N.; Ogawa, H.; Miyazaki, Y. Oscillating heat pipes with temperature control. Heat Pipe Sci. Tech. Int. J. 2012, 3, 223–231. [Google Scholar] [CrossRef]
  14. Akach, H. Structure of a Heat Pipe. U.S. Patent 4,921,041, 1 May 1990. [Google Scholar]
  15. Akachi, H. Structure of Micro-Heat Pipe. U.S. Patent 5,219,020, 15 June 1993. [Google Scholar]
  16. Han, X.; Wang, X.; Zheng, H.; Xu, X.; Chen, G. Review of the development of pulsating heat pipe for heat dissipation. Renew. Sustain. Energy Rev. 2016, 59, 692–709. [Google Scholar] [CrossRef]
  17. Mameli, M.; Besagni, G.; Bansal, P.K.; Markides, C.N. Innovations in pulsating heat pipes: From origins to future perspectives. Appl. Therm. Eng. 2022, 203, 117921. [Google Scholar] [CrossRef]
  18. Yang, H.; Khandekar, S.; Groll, M. Performance characteristics of pulsating heat pipes as integral thermal spreaders. Int. J. Therm. Sci. 2009, 48, 815–824. [Google Scholar] [CrossRef]
  19. Wang, S.; Nishio, S. Heat transport characteristics in closed loop oscillating heat pipes. In Proceedings of the ASME Summer Heat Transfer Conference, San Francisco, CA, USA, 17–22 July 2005. [Google Scholar]
  20. Charoensawan, P.; Terdtoon, P. Thermal performance of horizontal closed-loop oscillating heat pipes. Appl. Therm. Eng. 2008, 28, 460–466. [Google Scholar] [CrossRef]
  21. Zhang, Y.; Faghri, A. Advances and unsolved issues in pulsating heat pips. Heat Transf. Eng. 2008, 23, 20–44. [Google Scholar] [CrossRef] [Green Version]
  22. Taft, B.S.; Williams, A.D.; Drolen, B. Review of pulsating heat pipe working fluid selsction. J. Thermoph. Heat Transf. 2012, 26, 651–656. [Google Scholar] [CrossRef]
  23. Miyazaki, Y. Cooling of notebook PCs by flexible oscillating heat pipes. In Proceedings of the International Electronic Packaging Technical Conference and Exhibition, San Francisco, CA, USA, 17–22 July 2005; pp. 65–69. [Google Scholar] [CrossRef]
  24. Khandekar, S.; Silwal, V.; Bhatnagar, A.; Sharma, P. Grobal effectiveness of pulsating heat pipe heat exchangers: Modeling and experiments. Heat Pipe Sci. Tech. Int. J. 2010, 1, 279–302. [Google Scholar] [CrossRef] [Green Version]
  25. Rittidech, S.; Wannapakne, S. Experimental study of the performance of a solar collector by closed-end oscillating heat pipe (CEOHP). Appl. Therm. Eng. 2007, 27, 1978–1985. [Google Scholar] [CrossRef]
  26. Cattani, L.; Mangini, D.; Bozzoli, F.; Pietrasanta, L.; Mameli, M.; Filippeschi, S.; Rainieri, S.; Marengo, M. An original look into pulsating heat pipes: Inverse heat conduction approach for assessing the thermal behaviour. Therm. Sci. Eng. Prog. 2019, 10, 317–326. [Google Scholar] [CrossRef]
  27. Pagliarini, L.; Cattani, L.; Bozzoli, F.; Mameli, M.; Filippeschi, S.; Rainieri, S.; Marengo, M. Thermal characterization of a multi-turn pulsating heat pipe in microgravity conditions: Statistical approach to the local wall-to-fluid heat flux. Int. J. Heat Mass Transf. 2021, 169, 120930. [Google Scholar] [CrossRef]
  28. Perna, R.; Abela, M.; Mameli, M.; Mariotti, A.; Pietrasanta, L.; Marengo, M.; Filippeschi, S. Flow characterization of a pulsating heat pipe through the wavelet analysis of pressure signals. Appl. Therm. Eng. 2020, 171, 115128. [Google Scholar] [CrossRef]
  29. Karthikeyan, V.; Khandekar, S.; Pavan, P.; Sharma, K. Infrared thermography of a pulsating heat pipe: Flow regimes and multiple steady states. Appl. Therm. Eng. 2014, 62, 470–480. [Google Scholar] [CrossRef]
  30. Yasuda, Y.; Nabeshima, F.; Horiuchi, K.; Nagai, H. Visualization of the working fluid in a flat-plate pulsating heat pipe by neutron radiography. Int. J. Heat Mass Transf. 2022, 185, 122336. [Google Scholar] [CrossRef]
  31. Ma, H. Maximum. Radius of microchannels in an OHP. In Oscillating Heat Pipe; Springer: New York, NY, USA, 2015; p. 147. [Google Scholar]
  32. Mini-REFPROP—Version 10.0. Available online: https://trc.nist.gov/refprop/MINIREF/MINIREF.HTM (accessed on 11 May 2021).
  33. Cattani, L.; Vocale, P.; Bozzoli, F.; Malavasi, M.; Pagliarini, L.; Iwata, N. Global and local performances of a tubular micro pulsating heat pipe: Experimental investigation. Heat Mass Transf. 2022, 58, 2009–2027. [Google Scholar] [CrossRef]
  34. Beck, J.V.; Blackwell, B.; Clair, C.R.S., Jr. Inverse Heat Conduction: Ill-Posed Problems; A Wiley-Interscience Publication: New York, NY, USA, 1985. [Google Scholar]
  35. Iwata, N.; Bozzoli, F.; Pagliarini, L.; Cattani, L.; Vocale, P.; Malavasi, M.; Rainieri, S. Characterization of thermal behavior of a micro pulsating heat pipe by local heat transfer investigation. Int. J. Heat Mass Transf. 2022, 196, 123203. [Google Scholar] [CrossRef]
  36. Knapp, C.H.; Carter, G.C. The generalized correlation method for estimation of time delay. IEEE Trans. Acoust. Speech Signal Process. 1976, 24, 320–327. [Google Scholar] [CrossRef] [Green Version]
  37. Miyazaki, Y.; Akachi, H. Self excited oscillation of slug flow in a micro channel. In Proceedings of the 3rd International Conference on Multiphase Flow, Lyon, France, 8–12 June 1998; pp. 1–5. [Google Scholar]
  38. Khandekar, S.; Groll, M. An insight into thermos-hydrodynamic coupling in closed loop pulsating heat pipe. Int. J. Therm. Sci. 2004, 43, 13–20. [Google Scholar] [CrossRef]
  39. Kim, J.; Kim, S.J. Experimental investigation on working fluid selection in a micro pulsating heat pipe. Energy Convers. Manag. 2020, 205, 112462. [Google Scholar] [CrossRef]
  40. Spinato, G.; Thome, N.B.J.R. Operational regimes in a closed loop pulsating heat pipe. Int. J. Therm. Sci. 2016, 102, 78–88. [Google Scholar] [CrossRef]
Figure 1. Experimental setup sketch.
Energies 15 08664 g001
Figure 2. Energy balance at the infinitesimal wall section.
Energies 15 08664 g002
Figure 3. Channel numeration.
Energies 15 08664 g003
Figure 4. Heat fluxes at 7a, 7c, and 7d: (a) Qele = 0.5 W, (b) Qele = 2 W, (c) Qele = 3.5 W.
Energies 15 08664 g004
Figure 5. Cross-correlations of heat fluxes at two positions of Ch7 at Qele = 0.5 W, (a) 7a and 7d, (b) 7c and 7d.
Energies 15 08664 g005
Figure 6. Cross-correlations of heat fluxes at two positions of Ch7 at Qele = 2 W, (a) 7a and 7d, (b) 7c and 7d.
Energies 15 08664 g006
Figure 7. Cross-correlations of heat fluxes at two positions of Ch7 at Qele = 3.5 W, (a) 7a and 7d, (b) 7c and 7d.
Energies 15 08664 g007
Figure 8. Cross-correlations of heat fluxes at two positions of Ch1 at Qele = 2 W, (a) 1a and 1d, (b) 1c and 1d.
Energies 15 08664 g008
Figure 9. Cross-correlations of heat fluxes at two positions of Ch1 at Qele = 3.5 W, (a) 1a and 1d, (b) 1c and 1d.
Energies 15 08664 g009
Figure 10. Heat fluxes at 1b and 7b: (a) Qele = 0.5 W, (b) Qele = 2 W, (c) Qele = 3.5 W.
Energies 15 08664 g010
Figure 11. Cross-correlations of heat fluxes at 1b and 7b (a) Qele = 0.5 W, (b) Qele = 2 W, (c) Qele = 3.5 W.
Energies 15 08664 g011
Table 1. Measurements uncertainties.
TemperatureVoltageCurrent
±0.2 °C0.03% full scale + 2 mV0.2% full scale + 1 mA
Publisher’s Note: MDPI stays neutral with regard to jurisdictional claims in published maps and institutional affiliations.

