Article

An Experimental Study on a Wind Turbine Rotor Affected by Pitch Imbalance

by
Francesco Mazzeo
1,*,
Derek Micheletto
2,
Alessandro Talamelli
3 and
Antonio Segalini
4
1
Department of Engineering, University of Modena and Reggio Emilia, 41121 Modena, Italy
2
Department of Engineering Mechanics, KTH—Royal Institute of Technology, 114 28 Stockholm, Sweden
3
Department of Industrial Engineering, University of Bologna, 40126 Bologna, Italy
4
Department of Earth Sciences, Uppsala University, 752 36 Uppsala, Sweden
*
Author to whom correspondence should be addressed.
Energies 2022, 15(22), 8665; https://doi.org/10.3390/en15228665
Submission received: 11 October 2022 / Revised: 11 November 2022 / Accepted: 16 November 2022 / Published: 18 November 2022
(This article belongs to the Section A3: Wind, Wave and Tidal Energy)

Abstract

:
An experimental and numerical investigation about the pitch imbalance effect on a wind turbine model is performed. The characterization of the power losses and loads generated on a small-scale model and the validation of an analytical framework for the performance of unbalanced rotors are proposed. Starting from the optimal collective pitch assessment (performed to identify the condition with the maximum power coefficient), the pitch of just one blade was systematically changed: it is seen that the presence of a pitch misalignment is associated with a degradation of the turbine performance, visible both from experiments and from Blade Element Momentum (BEM) calculations (modified to account for the load asymmetry). Up to 30% power losses and a 15% thrust increase are achievable when an imbalanced rotor operates at tip speed ratios around five, clearly highlighting the importance of avoiding this phenomenon when dealing with industrial applications. The numerical model predicts this result within 5% accuracy. Additional numerical simulations showed that, away from the optimal collective pitch, the blade imbalance can provide a power increase or a power decrease with respect to the balanced case, suggesting how an operator can maximise the production of an unbalanced rotor. An analysis of the axial and lateral forces showed a sensitivity of the loads’ standard deviation when imbalance is present. An increase of the lateral loads was observed in all unbalanced cases.

1. Introduction

The analysis of the performance of modern wind turbines is one of the most important research fields in wind energy as the aerodynamics of wind rotors is affected by several factors. The variability of the external conditions [1], wake influences [2,3], or terrain complexity [4,5,6] are just some of them. The yaw angle is another factor that can substantially reduce the performance of wind rotors and generate power losses [7,8]. All of these factors are usually considered when it comes to designing a wind farm where interactions between the turbines must be taken into account [9,10,11]. On the other hand, designing a single wind turbine requires the optimization of the power production together with the reduction of the axial loads [12,13].
Research efforts aimed at characterizing the behaviour of wind turbines are complicated by the increasingly large dimensions of modern rotors, which make high-fidelity numerical simulations prohibitively expensive and limit most laboratory experiments to reduced Reynolds numbers, with rare exceptions (e.g., [14]). This is an issue because, at low Reynolds numbers, the performance of a wind turbine is Reynolds-number-dependent [15], even after the main flow statistics have reached Reynolds number independence [16], with small-scale turbines generally performing worse than their full-scale counterparts [17,18]. Bastankhah et al. [19,20] recently proposed an new wind turbine design, optimized for small-scale application, which was used to analyse the interaction of turbines with turbulent boundary layers at low Reynolds numbers. Although their investigation produced interesting observations, the pitch angle of the blades was kept fixed throughout the whole experimental campaign, implying that alternative configurations were not examined. Regarding the latter consideration, Costa Rocha et al. [21] performed a study on the effect of collective blade pitch angle on the power production and thrust generated by the turbine. By testing a rotor with a 3.0 m diameter in real conditions and by changing the pitch angle within ± 6 ° with respect to the rotor plane, they observed a dependency between the optimal pitch and the tip speed ratio of the turbine. They concluded that the performance under distinct operating conditions could be optimized by a suitable blade pitch angle controller. Lackner [22] exploited this idea and investigated a method of controlling the blade pitch angle in order to reduce the axial loads of floating offshore wind turbines. In his study, he developed a PID controller to keep the rotor at nominal conditions, while reducing both platform roll motion and tower loads.
Most of the analysed design models were based on the general hypothesis of axisymmetric design and a balanced rotor. It is known that, to operate at its optimal condition, a wind rotor must be perfectly balanced, meaning that the loads have to be equally distributed along each blade and there should not be any asymmetry between them. If this condition is not verified, the rotor is said to be unbalanced. Mass imbalances are the most common, as they originate from a non-homogeneous mass distribution in the rotor design: structural damages, manufacturing inaccuracies, water inclusions, and icing are just some of the main causes [23,24,25]. Another type of imbalance is the aerodynamic one. The latter arises when different aerodynamic forces are generated on each blade, and they are mainly caused by errors in the pitch angle settings (pitch misalignment) or modifications of the blade sections. A fairly simple mathematical model was developed by Niebsch et al. [23] to relate the loads generated by the imbalances to the corresponding turbine vibrations. The study proposed a method to visualize the oscillation of forces and moments when both types of imbalances occur, assuming that their frequency depends on the rotation frequency of the rotor itself. The consequences of such an issue can be very detrimental for the whole structure, causing serious damages and early fatigue degradation. However, vibrations are not the only issue created by imbalances. An aerodynamic study conducted by Castellani et al. [26] showed that the dynamics of the wake is also affected by the aerodynamic imbalance. They analysed how the tip vortices lose strength and disorganise more quickly than in the balanced case, affecting the turbulence intensity and the velocity deficit behind the rotor. From the frequency spectra, they observed that, while the balanced case was dominated by the tip vortex frequency in the near-wake (i.e., the blade passage frequency), the unbalanced case was dominated by the rotor frequency and the tip vortex peak disappeared before one turbine diameter. In all cases, the power coefficient was decreased by the imbalance.
Currently, most of the research efforts on the topic of aerodynamic imbalance are concentrated on detecting and correcting the pitch misalignment. Several examples can be found in the literature on this topic [23,27,28], but none of them conducted a performance analysis of the turbines. The main goal of the present paper is to fill this research gap by providing an experimental methodology for characterizing the power production and loads generated on a wind turbine affected by pitch misalignment. This type of analysis provides information on the sensitivity of wind turbines to aerodynamic imbalances, investigating how detrimental a certain level of pitch imbalance can be for the performance of the rotor. Power losses and axial loads are evaluated for different regimes and rotor designs. In order to achieve these objectives, an experimental methodology is developed and coupled with numerical models based on the Blade Element Momentum (BEM) theory [12,29,30], suitably modified for taking imbalances into account. Finally, an additional experimental study is provided in order to identify a link between lateral and axial vibrations and the pitch misalignment.
The paper is structured as follows. Section 2 presents a theoretical model to describe the behaviour of the wind turbine subjected to pitch imbalance. Numerical evidence is provided to validate the assumptions made in the theory. In Section 3, the experimental setup and rotor used for the analysis are described together with the assessment of the optimal pitch conditions. The numerical code used to compare the results is described in Section 4, together with the numerical simulations performed to characterize the aerodynamic properties of the rotor blades. The results are presented in Section 5: the power production and thrust are measured for different degrees of imbalance, and the experimental data are compared with the BEM code. The validated BEM model is then exploited to investigate the maximum power coefficient obtained for an arbitrary combination of collective pitch and blade imbalance, demonstrating that the pitch imbalance is not always detrimental. Furthermore, the turbine vibrations are measured and scrutinized according to the other works in the literature. Section 6 concludes the work with a result discussion and some final remarks.

2. Unbalanced BEM Theory

The numerical model developed for the prediction and comparison of the experimental results is based on the Blade Element Momentum (BEM) theory and refers to the one described by Burton et al. [12], with a few modifications applied to take into account aerodynamic imbalances. Equations (2)–(6) reported in this section are the adaptation of the above-mentioned approach. The BEM theory is a combination of the general momentum and blade element theories and introduces the computation of the loads (and their dependence on the blade geometry) by assuming two-dimensional aerodynamics at each blade section. From a numerical point of view, the model is implemented as an iterative procedure that solves for an axisymmetric distribution of the axial, a, and tangential, a , induction factors along the blade span. These two terms define the velocity deficit at the rotor disc and are defined as
a = U U d U and a = U θ 2 Ω r ,
where U is the free-stream velocity, U d is the axial velocity at the rotor disc, U θ is the tangential velocity component downwind of the rotor plane, Ω is the angular velocity, and r is the radial position of the blade section. The main parameters of the rotor plane and the turbine are indicated in Figure 1.
The main assumption of the theory implies that an infinite number of blades is present and that a steady axisymmetric flow (both upstream and downstream of the rotor) is established. This assumption introduces some limitations to the theory: one of them is the absence of blades with different designs between each other, namely an unbalanced rotor. In order to overcome this problem and apply the BEM theory to a rotor affected by pitch misalignment, the contribution to the aerodynamic force is split into N b components (with N b indicating the number of blades): therefore, each blade will produce its own contribution to the normal, C n , and tangential, C t , force coefficients. According to the assumption of axisymmetric flow at the rotor disc, the distribution of the inflow angle, ϕ , along the blade span remains the same for all the blades, and the angle of attack can be computed as
α i = ϕ θ i ,
where θ i is the sum of the blade pitch angle and the design twist and α i is the angle of attack of the i th blade. Lift and drag coefficients can be evaluated according to the 2D aerodynamic properties of the airfoil and then combined as
C t i = C L i sin ϕ C D i cos ϕ and C n i = C L i cos ϕ + C D i sin ϕ .
The infinitesimal thrust and torque are computed as the sum of the contributions of each blade, obtaining the expressions that combine the blade element (left-hand side) and general momentum (right-hand side) theories as
d T = i = 1 N b d T i = 1 2 c ρ W 2 d r i = 1 N b C n i = 4 π ρ r U 2 a ( 1 a ) F d r ,
d Q = i = 1 N b d Q i = 1 2 c ρ W 2 r d r i = 1 N b C t i = 4 π ρ r 3 Ω U a ( 1 a ) F d r
where c is the chord, ρ is the air density, F is the tip loss correction [12], and W is the relative velocity [12], computed as W = U ( 1 a ) 2 + Ω r ( 1 + a ) 2 1 / 2 . By rearranging Equations (4) and (5), the axial and tangential induction factor implicit formulas:
a = 4 F sin 2 ϕ σ r i = 1 N b C n i + 1 1 and a = 4 F sin ϕ cos ϕ σ r i = 1 N b C t i 1 1 ,
can be iteratively solved ( σ r = c / 2 π r indicates the rotor local solidity). The performances are evaluated in terms of the thrust and power coefficients, namely
C T = T 1 2 ρ U 2 A and C P = P 1 2 ρ U 3 A ,
where P is the power output obtained by integrating d P = Ω d Q , T is the thrust force (obtained by integrating Equation (4)) and A = π D 2 / 4 is the rotor swept area.
The described procedure introduces a simple modification to the BEM theory that allows taking into account the single contribution of each blade (i.e., different airfoil properties or chord distributions can be introduced) by assuming that the asymmetry influences just the blade load and it does not introduce an asymmetric induced velocity field. However, the hypothesis of the axisymmetric distribution of a and a is not always verified when a rotor is subjected to an aerodynamic imbalance. For instance, Castellani et al. [26] investigated this problem by performing numerical simulations of a + 5 ° unbalanced rotor, computing the velocity deficit Δ U = 1 U / U at one diameter downstream of the rotor plane, and the analysis results are shown in Figure 2. The plots were produced directly from the data obtained by the authors (courtesy of Castellani et al.) who conducted the numerical study. Further details on the turbine parameters can be found in their work.
The unbalanced rotor case shows a larger scatter than the balanced one, in particular close to the blade tip and outside of the rotor disc boundaries. This means that, at a fixed radial location, the value of the velocity deficit depends on the azimuthal angle. Nevertheless, these locations provide a low contribution to the overall aerodynamic force [12], and the amount of scatter can be evaluated by looking at the standard deviation of the data. It is evident from the figure that the standard deviation assumes low values along most of the blade span, where the asymmetry can be neglected. Consequently, the modified BEM model does not perfectly reproduce the real flow field at the rotor disc, but it can be used to provide an equivalent axisymmetric one, which leads to the computation of the performance in terms of the power production and loads of an unbalanced wind rotor.

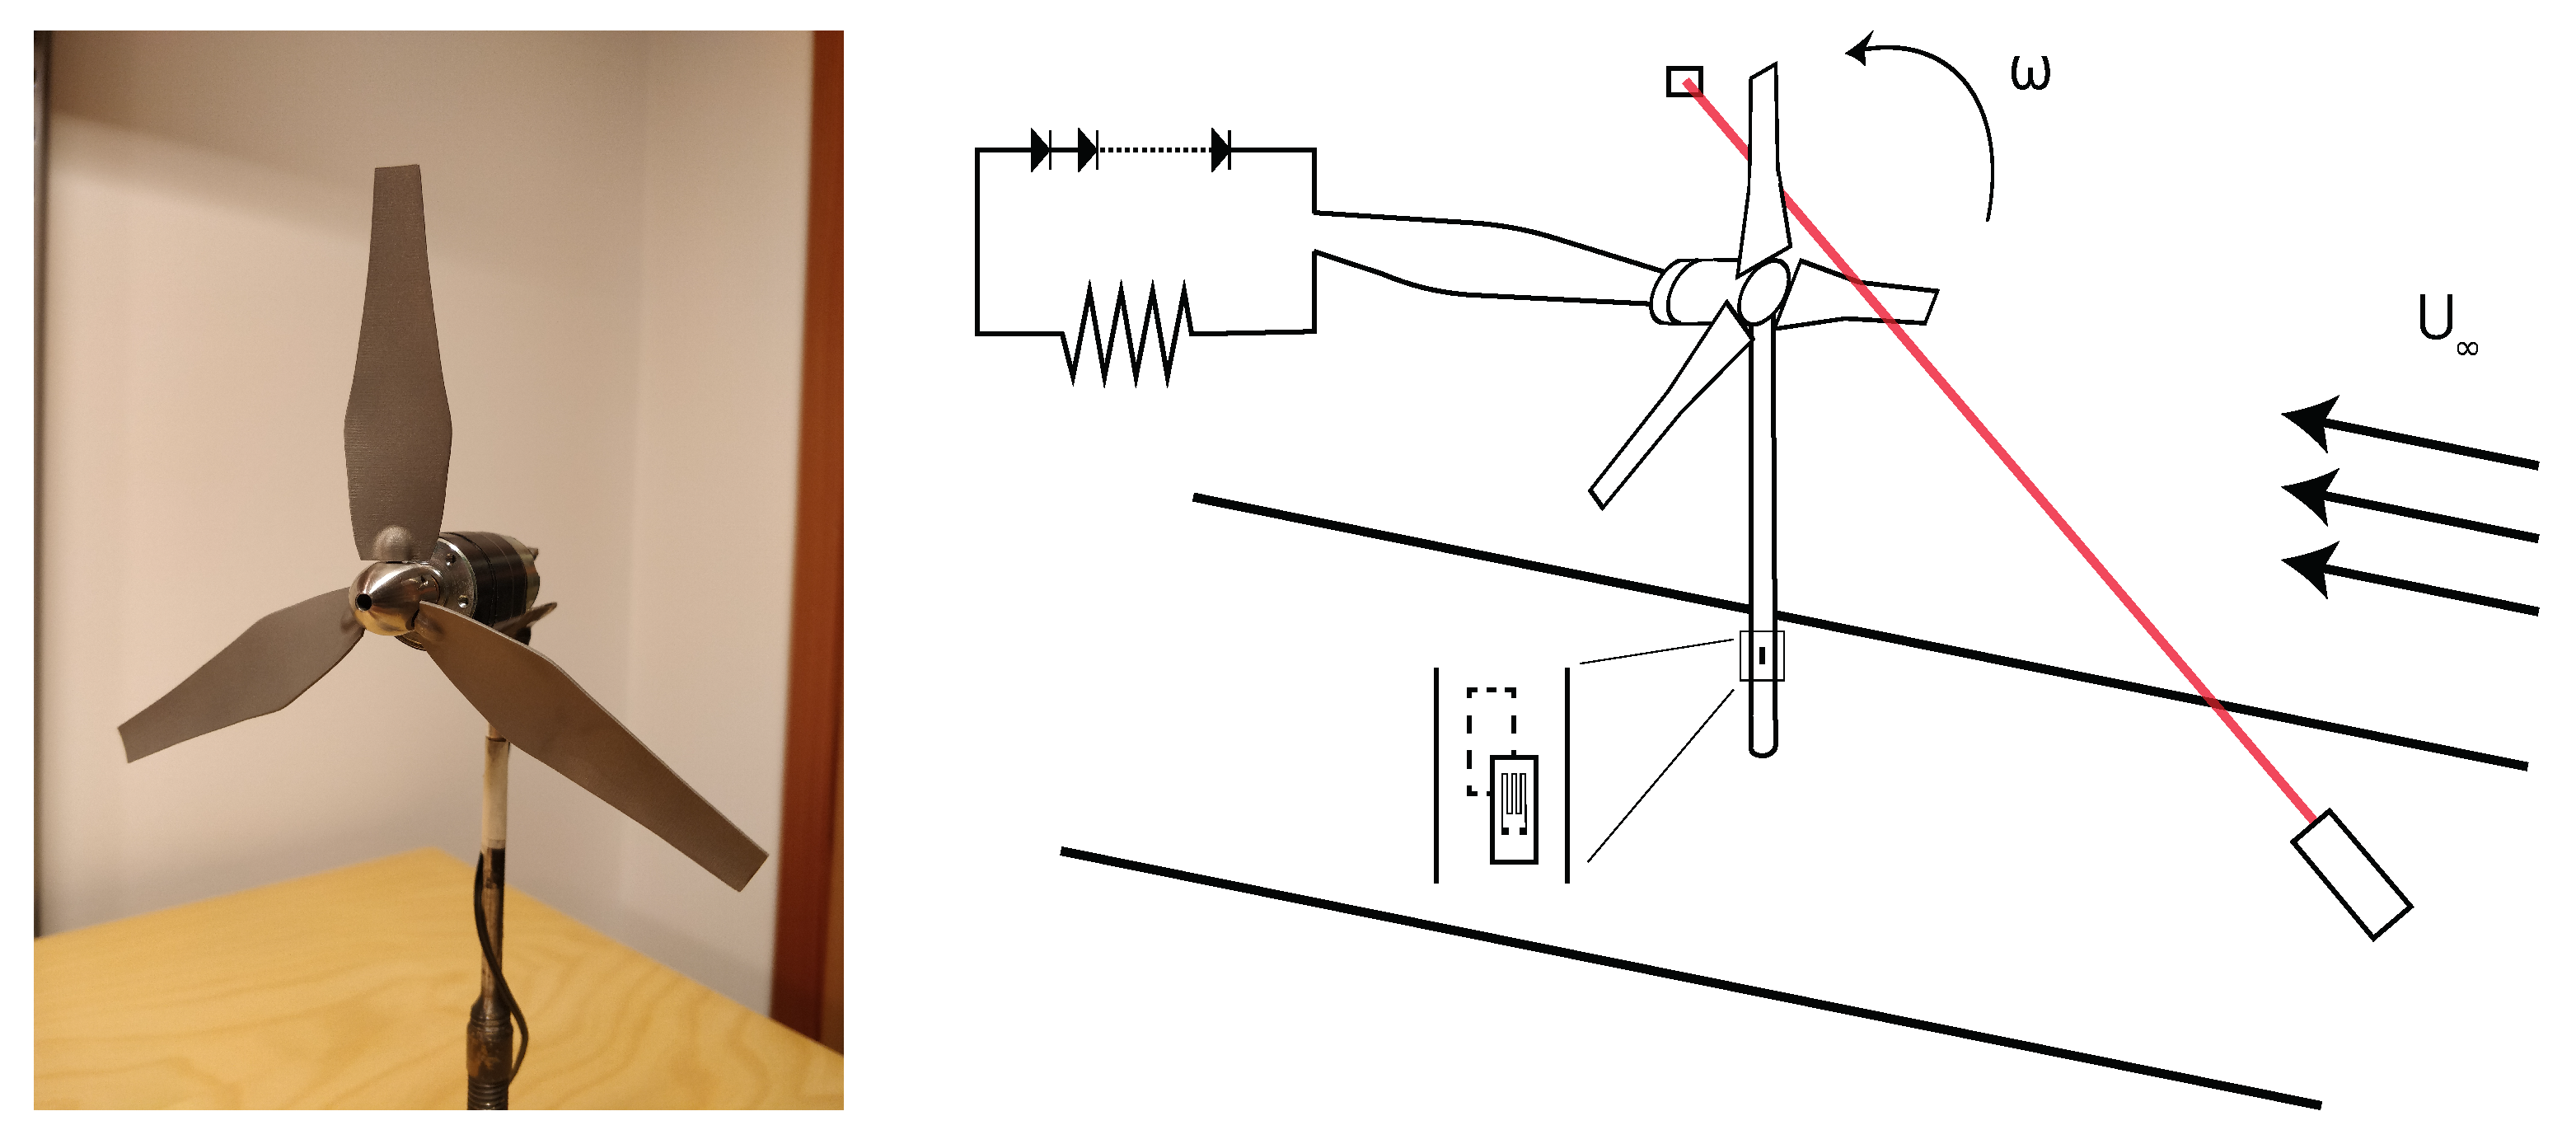
3. Experimental Methods

The wind turbine model used in the experimental campaign is a three-bladed rotor with a diameter D = 15 cm , shown in Figure 3. The blade geometry is designed for small-scale, low-Reynolds-number applications ( R e = D U / ν 40 , 000 ) and follows the recommendations found in Bastankhah et al. [20], where the chord and twist distributions can be found. The blade profile is a flat plate with a 5 % camber and a thickness of 5 % of the chord. The optimal design also requires sharp leading and trailing edges, but due to manufacturing limitations (the blades were 3D-printed in titanium), a minimum thickness of 0.6 mm had to be maintained.
A steel rod mounted at the base of each blade enables the coupling with the hub, and a stop screw serves as a locking mechanism for fixing the pitch angle. The hub was machined in stainless steel and was shaped as a semi-ellipse, with a semi-major axis that is 50 % larger than the semi-minor one.
The rotor is coupled with a Faulhaber 2237S024CXR DC motor, which is used as a generator and is connected to an external circuit consisting of 15 diodes and a known resistor of R = 3.3 Ohm. By short-circuiting an arbitrary number of diodes, the electrical load applied to the generator can be changed, and thus, the angular velocity Ω can be controlled. Furthermore, the current I induced by the generator can be computed by measuring the voltage drop across the known resistor. This current is related to the torque Q that the rotor applies to the generator according to the linear relation Q = k 1 I + k 0 . The calibration constants k 1 and k 0 were obtained by mounting an aluminium disk of known inertia onto the motor, accelerating it to an arbitrary angular velocity, switching the motor to generator mode (by disconnecting it from a power supply), and studying the subsequent deceleration of the disk. The mechanical power produced by the wind turbine is then computed as P = Q Ω . The angular velocity was measured with a photodiode mounted on the back wall of the test section and a laser directed toward it. By placing the turbine in the path of the laser, the latter is interrupted three times per revolution, resulting in three spikes in the photodiode output signal. By computing the frequency of such spikes, it is possible to measure Ω .
The turbine tower has a hub height h h u b = 0.228 m and presents two strain gauges near its base. These are connected to a Wheatstone bridge in a half-bridge configuration and are used to estimate the thrust force. During the analysis of vibrations, the tower was rotated by 90 ° in order to measure either axial or lateral loads.
The experiments were conducted in the NT wind tunnel, at KTH. This open-loop facility has a test section with a cross-sectional area A t s = 0.5 × 0.4 m 2 , resulting in a confinement ratio A / A t s 8.8 % . Such a high value has a non-negligible effect on the turbine thrust and power production [31]. It does not, however, alter the optimal pitch angle, nor does it affect the qualitative behaviour of the rotor in the case of pitch imbalance. For these reasons, the results reported in this paper do not present any confinement correction. The free-stream velocity was measured with a Prandtl tube mounted at the inlet of the test section, whereas the turbine was placed 4 D downstream.
During all experiments, the free-stream velocity was sampled simultaneously with the thrust and power at a sampling frequency of 10 kHz . The photodiode signal was sampled immediately after, at a sampling frequency of 15 kHz .

Blade Pitch Angle and Measurement

As mentioned above, the present rotor design was inspired by Bastankhah et al. [19,20], whose design represented our baseline. Nevertheless, due to manufacturing differences, it was possible that the collective pitch value associated with the best performance of the rotor was different than what was originally planned. Therefore, the pitch of each blade was changed to identify the best operating condition. The pitch angle is defined by θ , and the angle θ = 0 ° is referred to as the initial blade design. The positive direction of the pitch is applied by rotating the leading edge towards the direction of the incoming wind (Figure 4). In order to set and measure the pitch angle, a suitable setup was made by using a digital pitch gauge, a 90 ° bolted iron base, and a 3D-printed device that fits half of the blade surface (Figure 4). The system guarantees a maximum precision of 0.1 ° , but errors due to vibrations and screw tightening can occur. For this reason, the measurements were assumed to have an uncertainty of 0.5 ° .
The optimal pitch angle was found by measuring the power and thrust at variable collective pitches and by selecting the setting that maximizes the former while maintaining the latter within operational limits. The results are plotted in Figure 5 against the tip speed ratio λ = Ω R / U . The maximum C P = 0.38 was reached at λ = 3.9 and θ = + 2 ° , which was found to be the optimal pitch angle. The repeatability of the experiments was determined for the optimal configuration by setting the pitch for every experiment to θ = + 2 ° and monitoring the corresponding power and thrust coefficient. The uncertainty of the results remained at most within 3% (mean–max distance), proving the robustness of the setup.

4. Numerical Methods

The model described in Section 2 was implemented in Python and validated by means of experimental data. The analytical framework was based on the BEM theory, modified according to the unbalanced pitch angle settings. The code includes a set of corrections derived from empirical formulas described by Burton [12]. The Prandtl tip/hub loss correction was used to take into account the loss of momentum generated by the vortices released at the outermost and innermost parts of the blades. Heavily loaded rotor corrections were used to adjust the value of a, where reversal flow and wake mixing occur. In order to take into account the losses due to the surface roughness of the blades, a roughness correction model was developed: the latter was based on a set of numerical simulations performed with ANSYS Fluent, on the same airfoil at different angles of attack, Reynolds numbers, and roughness heights. An additional correction [31] was added to take into account the confinement effects of the wind tunnel and make the results comparable to the experimental ones.
One of the bottlenecks of the BEM approach is the need for the lift and drag coefficients of the blade sections to be treated as two-dimensional airfoils. These data are not available for the used airfoils and for such low Reynolds numbers. In order to cope with this issue, in this analysis, the lift and drag coefficients were computed by means of a set of CFD simulations performed with ANSYS Fluent. The results were used to build look-up tables for C L and C D for variable angles of attack and Reynolds numbers. A C-type mesh topology with structured quadrilateral elements was chosen because of its lower memory consumption and faster convergence rate. The 2D simulations were performed on the airfoil at the mean chord ( c = 0.0143 m), and the corners were smoothed to ensure a more reliable flow attachment on the surface. The mesh properties and boundary conditions are summarised in Table 1.
A Spalart–Allmaras turbulence closure model was chosen as it is a relatively simple one-equation model that solves the transport equation for the eddy viscosity and guarantees a fast convergence rate. The reliability and accuracy of this model were discussed by Douvi et al. [32] by comparing the results of different turbulence models with experimental data. In order to demonstrate the accuracy and independence of the results with respect to the constructed mesh, a grid convergence check was performed (not shown). The model was validated by using a NACA0012 airfoil [33] at similar flow conditions (low R e ) and a structured C-mesh and compared with the experimental datasets collected by Miley [34]. The model differed from the experimental data a maximum of 5%, proving the accuracy of the present simulations. With the above-mentioned setup, a set of CFD simulations was performed for α [ 4 ° ÷ 11 ° ] and R e [ 5000   ÷ 40,000]. The results were fit by using a 2D surface interpolation in order to have continuous C L ( α , R e ) and C D ( α , R e ) when the airfoil was not stalled. Figure 6 reports the obtained lift and drag coefficients for the investigated airfoil: a significant Reynolds number dependence is visible in both coefficients, while the stall angle of attack is between 7.5 ° and 10 ° .
Small-scale wind turbines that operate at very low R e can reach very high angles of attack close to the root of the blades, and the BEM code has to be able to compute lift and drag in that region as well. Therefore, the set of angles of attack was divided into three main regions: the pre-stall, the post-stall, and the flat plate region, where the airfoil was completely stalled and it was assumed to behave like a flat plate. An important parameter to estimate is the stall angle of attack, α s . For the sake of this paper, a simple linear interpolation of α s at maximum lift for different R e was performed. Finally, the above-mentioned surface interpolation was used when α < α s , while, for the sake of continuity, the Viterna equations [35] were implemented for the post-stall and flat plate regions ( α [ α s ÷ 180 ° ] ).

5. Results and Discussion

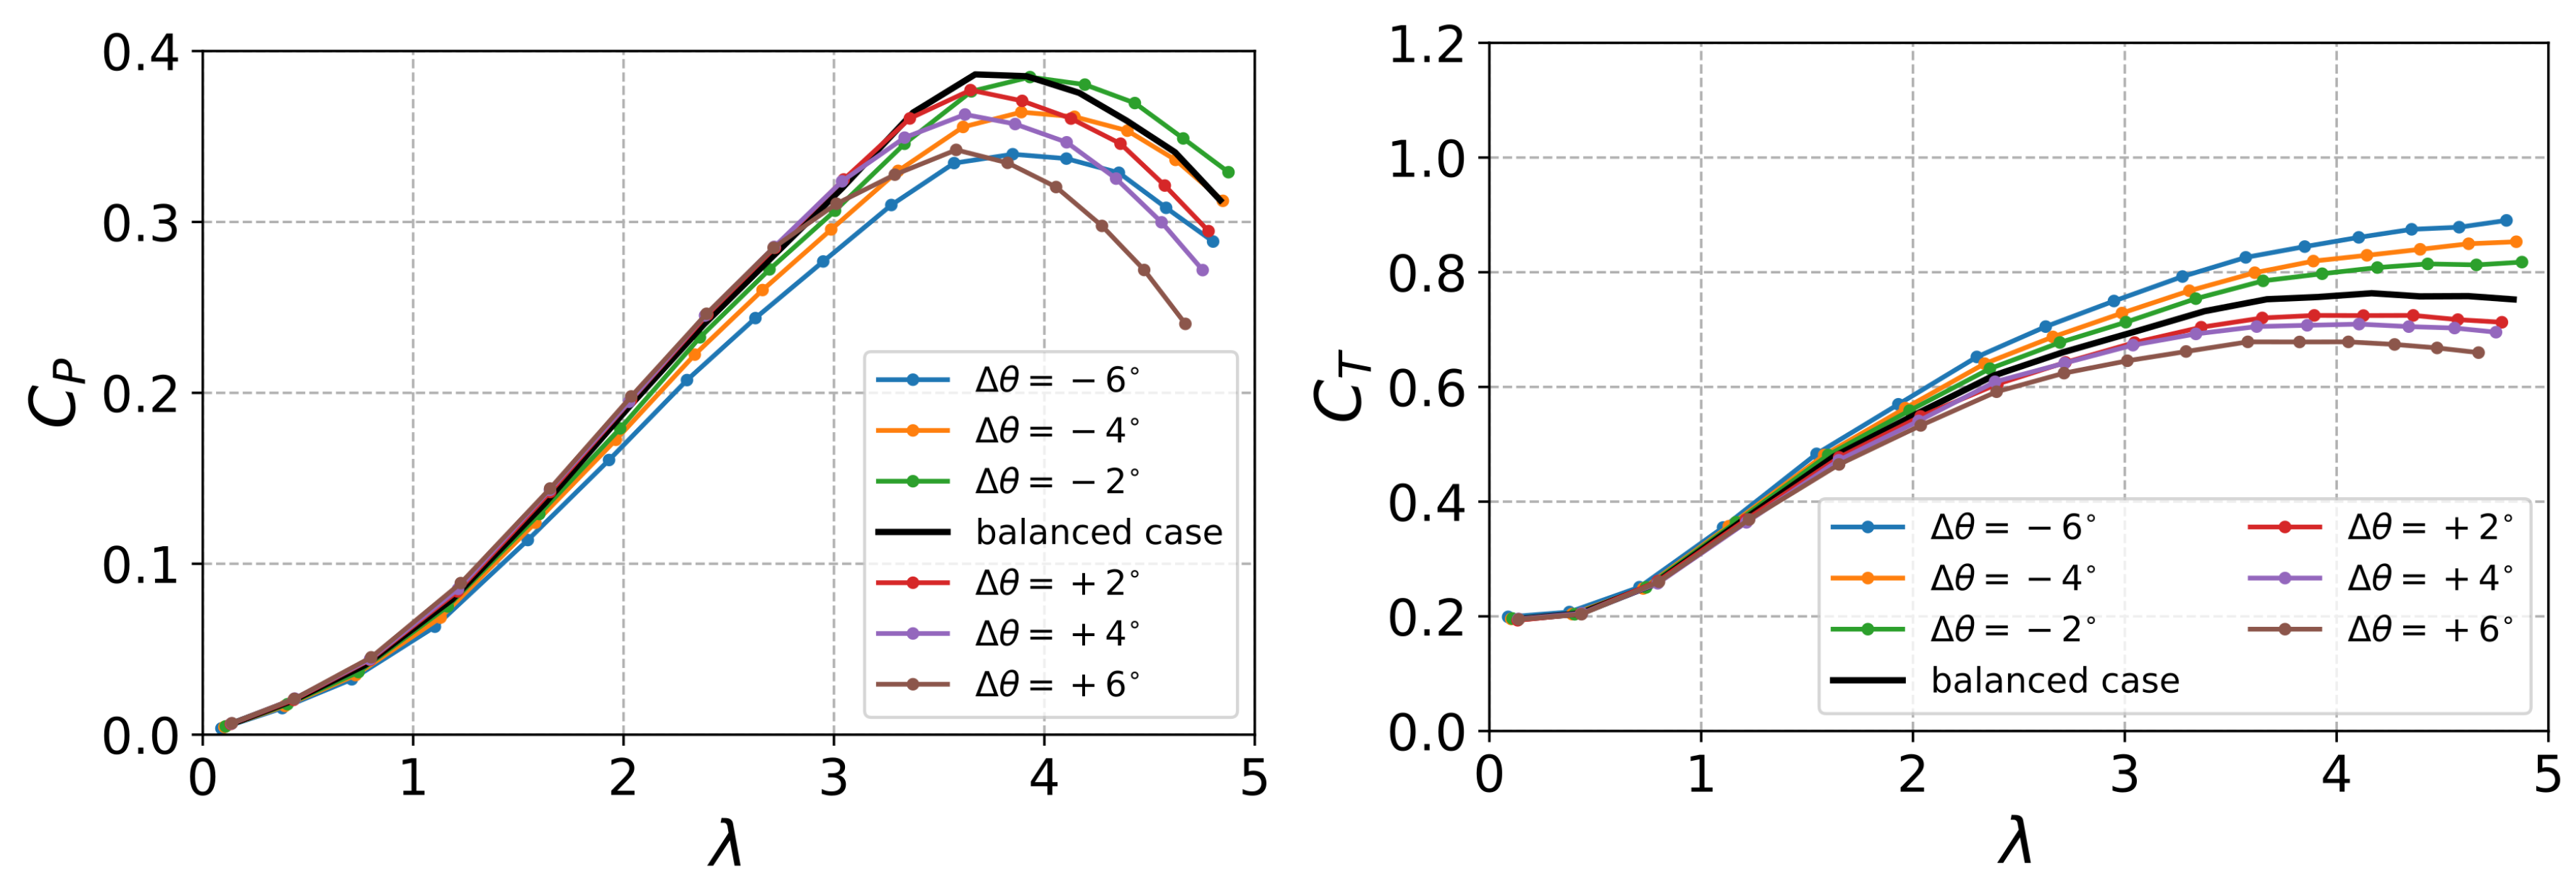
5.1. Variable Unbalanced Pitch
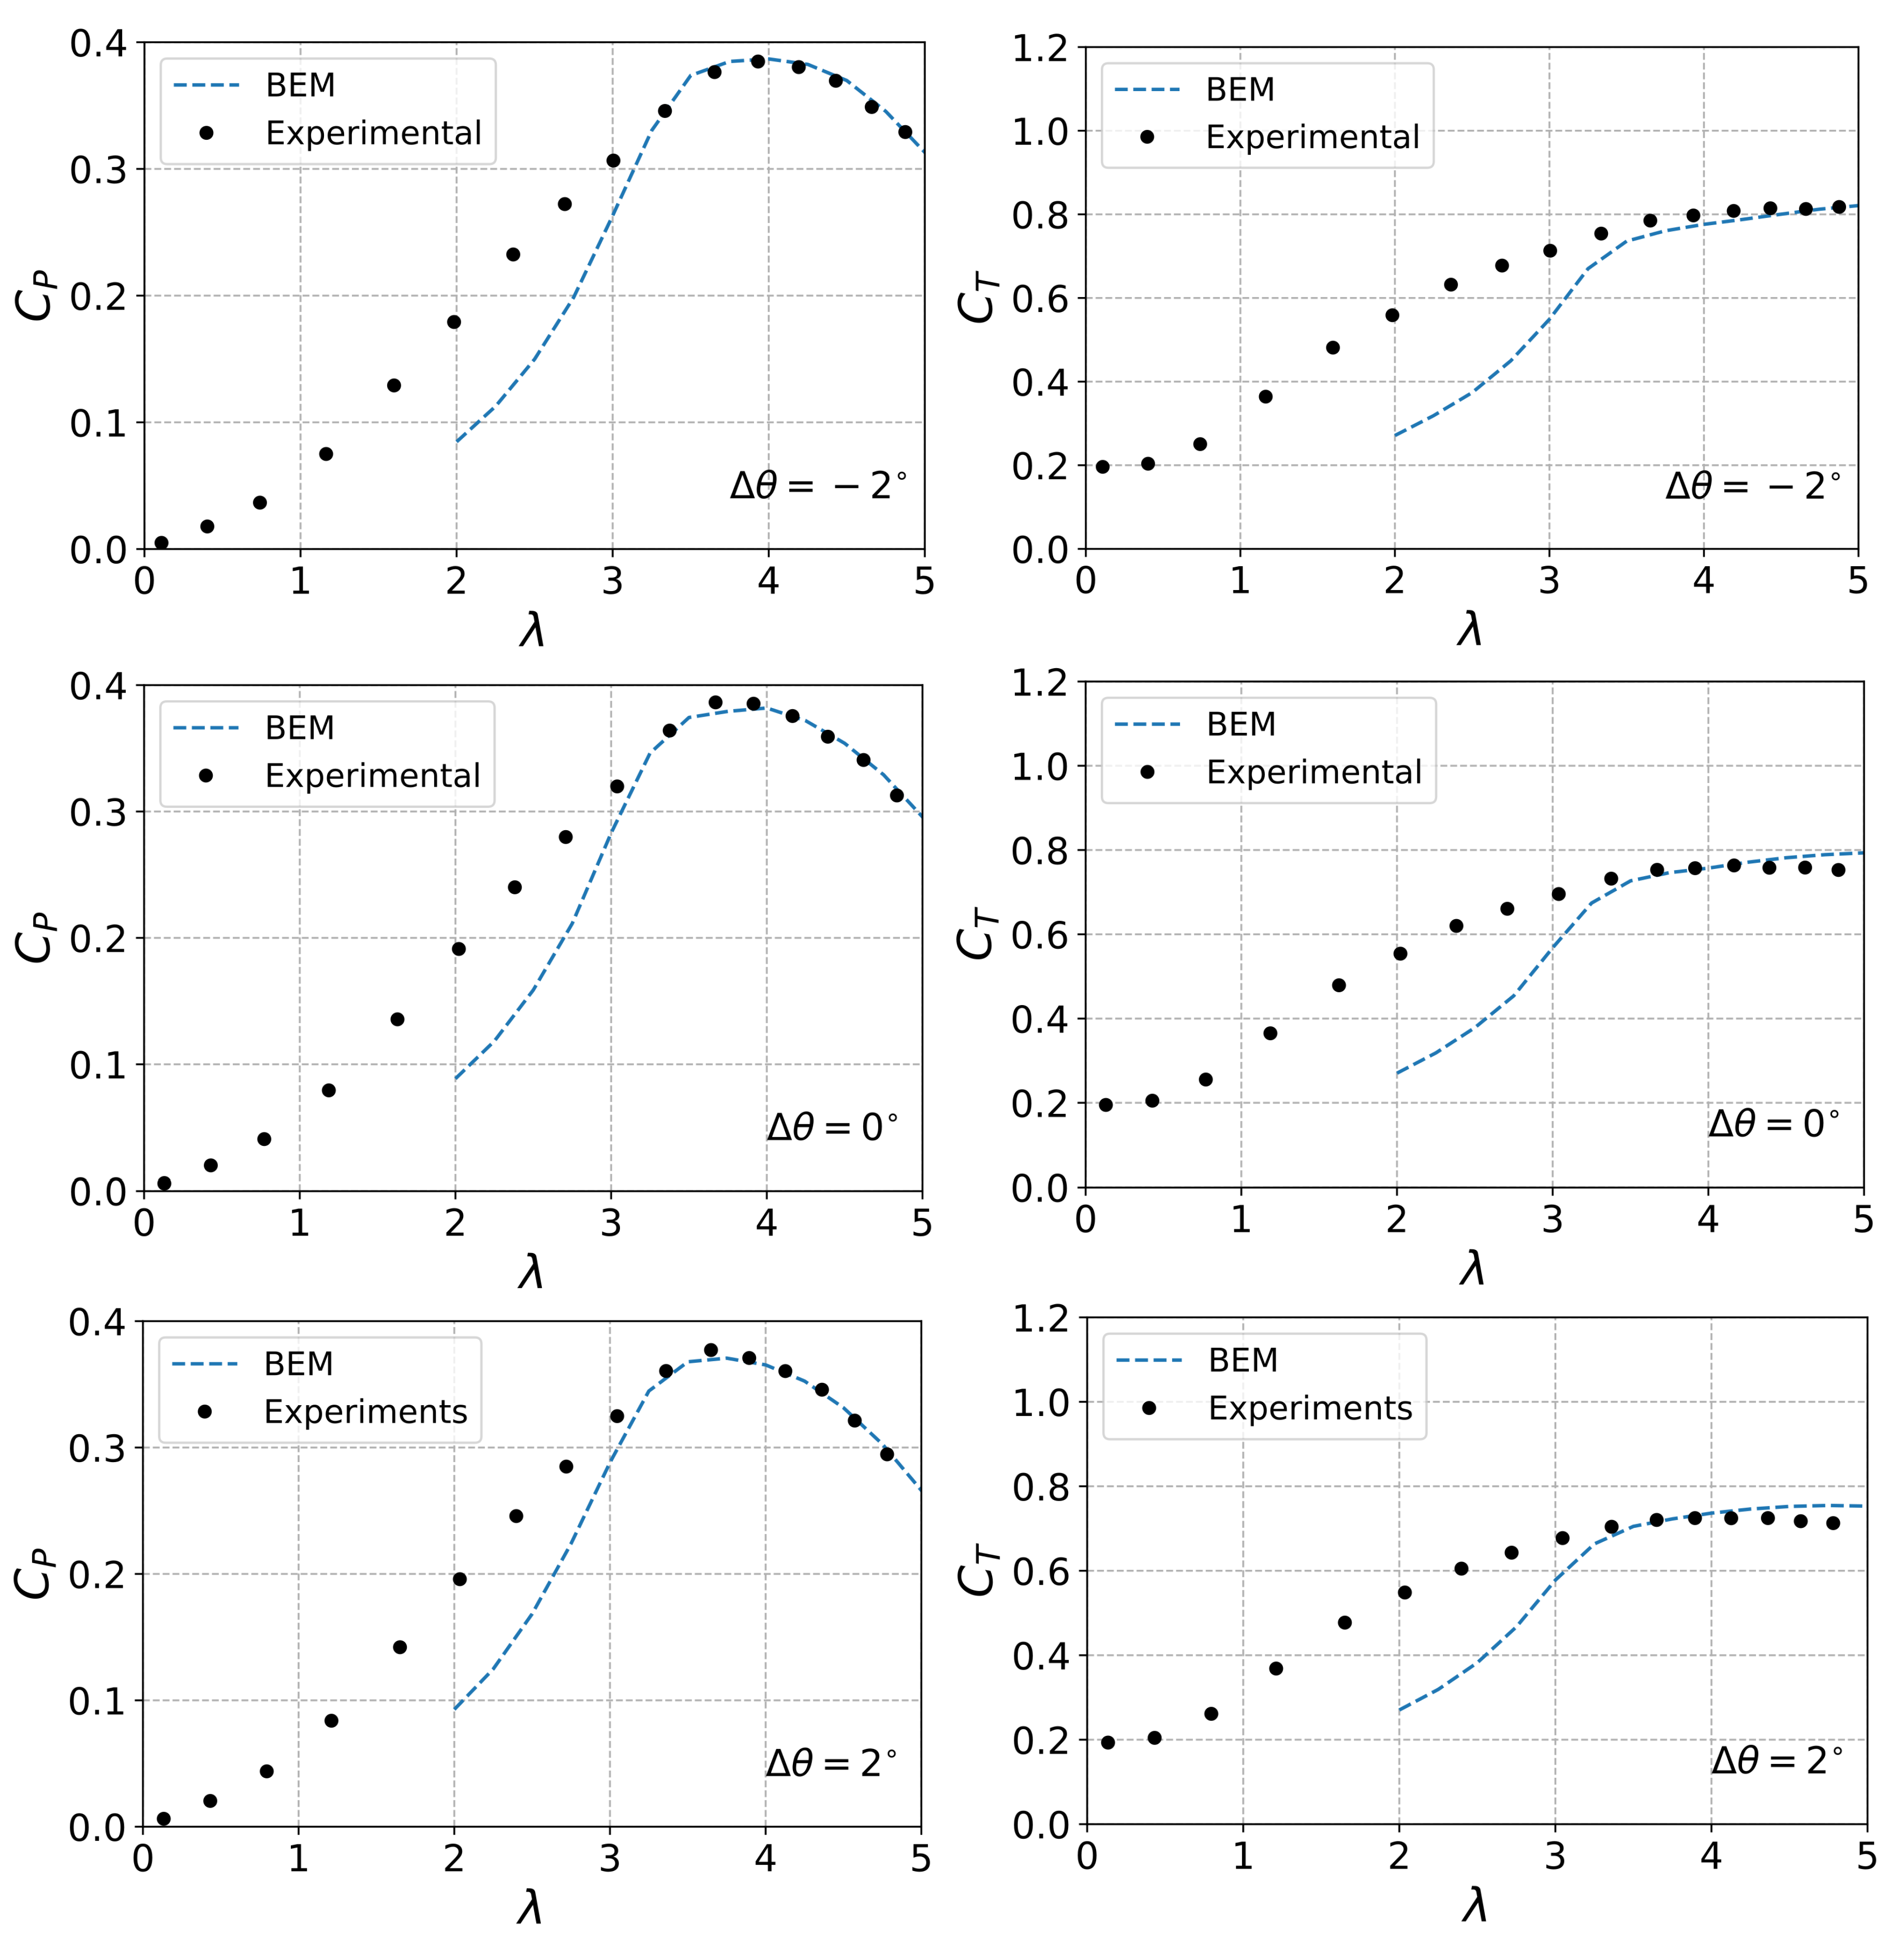
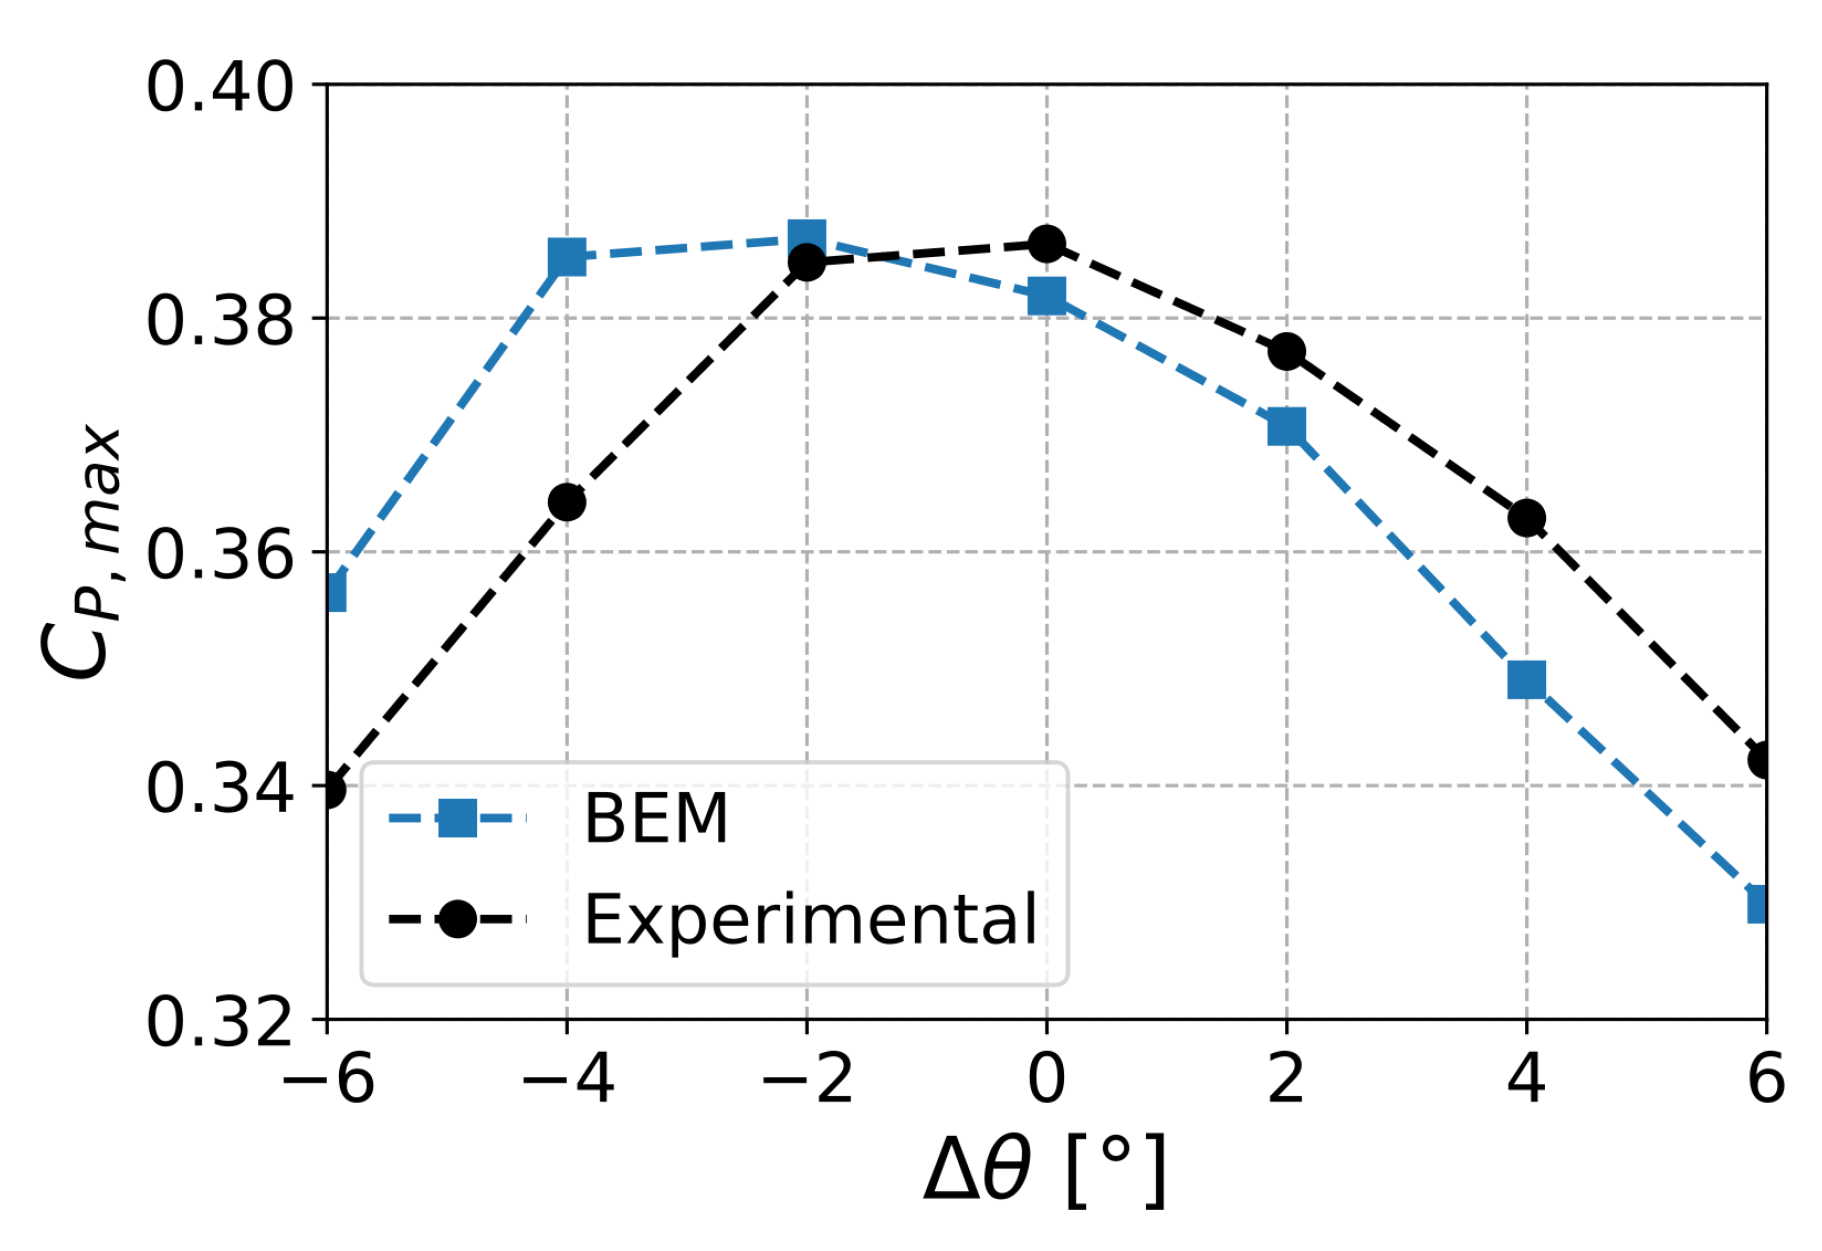
Figure 7 shows the power and thrust coefficients of the wind turbine model for different pitch imbalances. As discussed in Section Figure 5, the optimal balanced configuration had a collective pitch of θ = + 2 ° , which maximized the power coefficient. The pitch imbalance is defined as Δ θ , and it was considered from the baseline optimal condition. As expected, the maximum power production was reached in the balanced rotor case, while any type of imbalance is detrimental for the energy extracted by the rotor at the optimal λ . The balanced case presents also an intermediate level of thrust, and a possible increase of the latter can occur if a negative imbalance is applied. In order to quantify the detrimental effect of the imbalance on the rotor performance, the variation of C P and C T with respect to the balanced values was computed at different regimes. In particular,
Δ C P , % = 100 C P , bal C P , unb C P , bal and Δ C T , % = 100 C T , unb C T , bal C T , bal ,
represent, respectively, the power loss and thrust increase percentages. Positive values of Δ C P , % and Δ C T , % are always detrimental for the turbine because they represent a deficit in the energy produced and an increase of the axial loads (this is why the two factors are defined differently). Δ C P , % and Δ C T , % are plotted in Figure 8. While at the maximum C P condition (obtained around λ = 3.9 ), the power losses are positive for each direction of imbalance, the same cannot be said for all working conditions. At low tip speed ratios, a positive Δ θ leads to an increase of the power production (thus, negative power losses) up to 5%. However, at λ 3 , the power losses increase with a steeper linear trend, reaching values up 30% for a Δ θ = + 6 ° at λ 5 . Negative degrees of imbalance are almost always detrimental, reaching up to 13% of power loss for a Δ θ = 6 ° . The figure on the right shows the values of Δ C T , % against the tip speed ratio, at different degrees of imbalance. It is noticeable that, for a negative Δ θ , the thrust coefficient can increase up to 15 % of the balanced case.
The fact that the pitch imbalance is always detrimental for the power production might be associated with the baseline configuration as the one with the highest power coefficient: in this case, each blade should work at an ideal angle of attack, ensuring the highest performance. It is not surprising indeed that any pitch deviation leads to a power loss. The thrust coefficient was not maximized in the collective pitch analysis, and in fact, it is seen in Figure 8 that the imbalance can both increase or decrease the thrust. It can be speculated that, when starting from a non-ideal condition with a sub-optimal collective pitch, the presence of a pitch imbalance might lead to both an increase and a decrease of the overall power production. This aspect will be investigated further in the next section.

5.2. BEM Validation

By comparing the output of the BEM code with the experimental evidence, the numerical model can be validated. Figure 9 shows the C P and C T curves at Δ θ = 2 ° , 0 ° , and + 2 ° from the experiments and BEM simulations. A good agreement is noticeable within a range of tip speed ratios between 3 and 5, while larger discrepancies can be observed for lower λ . This is not surprising since the BEM analysis is highly dependent on the estimation of the aerodynamic properties of the blades, i.e., the CFD simulations and the lift/drag model implemented. For the sake of this paper, the CFD analysis was performed for the pre-stall regimes, as the reliability of the simulations decreases when the airfoil approaches the stall condition. When the tip speed ratio is very low, most of the flow around the blade, especially close to the root, is completely separated because of the large angles of attack reached, and the BEM code diverges from the experimental results.
An additional consideration can be made on the maximum C P reached in the two datasets. As can be observed in Figure 10, the BEM code predicts that the balanced condition is not the optimal one since the case with Δ θ = 2 ° presents a higher power production. This is due to the fact that the BEM theory is linked to Glauert’s theoretical optimal blade, by which the initial blade design was inspired (so that θ = 0 ° should be the optimal collective pitch). However, the discrepancy between the C P , max computed by the BEM and the experiments remains almost always below 5 % , confirming the reasonable accuracy of the numerical model.
Once the reliability is assessed, the BEM framework can be used for an additional analysis that extends the previous observations. Consider a realistic scenario, where a pitch imbalance is detected by an operator. Assuming a fixed Δ θ , the power production can be maximised by modifying the collective pitch angle θ according to the 2D map reported in Figure 11. This plot presents the value of the maximum C P achievable for several combinations of imbalances and collective pitch angles. A maximum is visible for zero pitch and imbalance. However, the isocontour values are inclined with respect to the horizontal axis, implying that, away from the maximum, the highest power coefficient is obtained for non-zero pitch imbalance. The black dots indicate the maximum C P reached for each Δ θ , while the red dashed line represents their straight linear interpolation. It can be observed that the optimal collective pitch (defined in terms of the maximum C P condition) changes according to the degree of imbalance.

5.3. Vibration Analysis

An additional analysis of the vibrations of the wind turbine was performed in order to investigate the connection between rotor imbalance and structure oscillations. By acquiring the voltage signal of the strain gauge mounted on the tower, the thrust oscillations can be measured. The signal is then represented in the frequency domain by computing the power density spectrum. This procedure is repeated for each angular velocity, Ω , and degree of imbalance. An example case is reported in Figure 12 for the balanced rotor case, where ω / Ω is the ratio between the frequency and the angular velocity. It is worth mentioning that similar spectra were found for all degrees of imbalance. The thrust signal follows a clear sinusoidal trend, which is connected to the main frequency peak in the spectrum. Smaller peaks are present for higher frequencies, mostly connected to noise and disturbances.
From this study, the hypothesis made by Niebsch et al. [23] can be proven, namely that the loads are mostly introduced by the turbine rotation. It is noticeable that each frequency spectrum presents a clear peak at the angular velocity of the rotor (i.e., at ω / Ω = 1 ), meaning that the latter corresponds to the main oscillation frequency of the structure. This observation can be made in both the balanced and the unbalanced cases.
Two different sets of experiments were performed in order to evaluate either the axial and lateral oscillations: the first was carried out with the standard setup (where the strain gauges are mounted to measure the axial turbine load), while the second was performed by rotating the turbine tower of 90 ° in order to put the strain gauge on the lateral side. The intensity of the vibrations was quantified by means of the force standard deviation. Figure 13 reports the results in a logarithmic plot for different angular velocities and Δ θ . σ a and σ l represent the standard deviation of the axial and the lateral vibrations, respectively. It can be noted that a distinct peak of the vibration intensity is observable at Ω 160 rad/s for the lateral vibrations and at Ω 190 rad/s for the axial ones. The position of the peak may be related to the resonance frequency of the structure: the fact that these values are not equal is likely due to the asymmetry of the tower, which has a flat section near its base, where the strain gauges are mounted. Above these values, different trends are followed by the two force components. In particular, no clear dependence with the rotor imbalance is observable in the axial vibrations. The intensity seems to follow the opposite trend of the thrust, being minimum at Δ θ = 6 ° and increasing as the unbalanced blade is rotated towards the direction of the free-stream, thus as C T decreases. On the other hand, lateral vibrations present a clearer dependency with the rotor imbalance, being minimum in the balanced case and increasing with Δ θ .
Figure 14 shows the variation of the intensity of the axial and lateral vibrations with respect to the balanced case. They are computed as
Δ σ % = 100 σ unb σ bal σ bal .
It can be observed that a small misalignment of the pitch angle generates a substantial variation of the turbine oscillations, representing a serious risk for the integrity of the whole structure. An increase of more than 25 % was achieved for a Δ θ = + 4 ° in the lateral force. At frequencies larger than the resonance one, the Δ σ % for each Δ θ tends to stabilize and remain almost constant for increasing Ω .

6. Conclusions

In this work, an experimental and numerical investigation of the effect of pitch imbalance on wind turbine performance was conducted. A simplified BEM framework was proposed, where the effect of rotor imbalance, associated with blade misalignment, was accounted for in the load part of the BEM formulation, leaving the momentum-based part unaffected. This hypothesis was partially supported by independent numerical simulations with an unbalanced rotor.
In order to provide a characterization of the power and thrust at variable unbalanced pitch, a wind tunnel experiment was conducted. where a small-scale rotor was used. The collective pitch of the rotor model was initially adjusted to maximise the power production, obtaining a different optimal condition (with the collective pitch shifted of 2 ° ) compared to what traditional BEM and Glauert optimisation suggested (probably due to the uncertainty in the airfoil lift and drag coefficients). The pitch imbalance was then applied on one blade only by manually changing the blade angle. The results demonstrated that, by starting from the optimal pitch configuration, the pitch imbalance decreases the power coefficient, while it can increase or decrease the thrust coefficient. This trend on the power is due to the already optimal blade orientation in the balanced case, so that every other blade pitch is sub-optimal (the reader is reminded that the optimisation was performed in terms of the power coefficient alone).
Despite of the small size of the model and of the uncertainties in the airfoil lift and drag coefficients, the BEM calculations were able to predict well the peak performance of the turbine rotor both in the balanced and unbalanced cases, although a weak shift in the power coefficient was present. The agreement was best near the design tip speed ratio condition, while too small values of λ showed increasing discrepancies, most likely due to an incorrect post-stall characterisation of the airfoils’ behaviour or due to section-to-section interaction when deep stall is present (as the latter are neglected in the BEM formulation). Despite the simplification made to the BEM to account for the blade imbalance, the latter worked surprisingly well in the present work.
The BEM model was indeed validated in the optimal pitch case by means of experimental data and was thereafter exploited to perform estimations of the maximum power coefficient for different combinations of collective pitch and pitch imbalance: the results demonstrated that, by having another sub-optimal collective pitch, it is possible that the blade imbalance leads to both an increase and a decrease of the power coefficient as well.
A vibration analysis was performed showing that the axial and lateral loads are also weakly influenced by the rotor imbalance with a lock-in between the angular velocity and the peak frequency of the spectrum. Frequencies higher than the natural vibration mode of the turbine model exhibit an opposite sensitivity to the pitch imbalance, where the lateral load is observed to always increase when rotor imbalance is present.

Author Contributions

Conceptualization, F.M., D.M. and A.S.; methodology, F.M., D.M. and A.S.; software, F.M.; validation, F.M.; formal analysis, F.M.; investigation, D.M. and F.M.; resources, A.S.; data curation, D.M. and F.M.; writing—original draft preparation, F.M., D.M. and A.S.; writing—review and editing, A.S. and A.T.; visualization, F.M.; supervision, A.S. and A.T.; project administration, A.S.; funding acquisition, A.S. All authors have read and agreed to the published version of the manuscript.

Funding

This research received no external funding.

Data Availability Statement

Not applicable.

Acknowledgments

Francesco Castellani is acknowledged for providing the simulation results of the unbalanced rotor. The support of STandUP for Wind is also acknowledged.

Conflicts of Interest

The authors declare no conflict of interest.

References

  1. Wagner, R.; Antoniou, I.; Pedersen, S.M.; Courtney, M.S.; Jørgensen, H.E. The influence of the wind speed profile on wind turbine performance measurements. Wind Energy 2009, 12, 348–362. [Google Scholar] [CrossRef]
  2. Adaramola, M.S.; Krogstad, P. Experimental investigation of wake effects on wind turbine performance. Renew. Energy 2011, 36, 2078–2086. [Google Scholar] [CrossRef]
  3. Segalini, A.; Alfredsson, P.H. A simplified vortex model of propeller and wind turbine wakes. J. Fluid Mech. 2013, 725, 91–116. [Google Scholar] [CrossRef]
  4. Hyvärinen, A.; Segalini, A. Effects From Complex Terrain on Wind-Turbine Performance. J. Energy Resour. Technol. 2017, 139. [Google Scholar] [CrossRef]
  5. Hyvärinen, A.; Segalini, A. Qualitative analysis of wind turbine wakes over hilly terrain. J. Phys. Conf. Ser. 2017, 854, 012023. [Google Scholar] [CrossRef] [Green Version]
  6. Hyvärinen, A.; Lacagnina, G.; Segalini, A. A wind-tunnel study of the wake development behind wind turbines over sinusoidal hills. Wind Energy 2018, 21, 605–617. [Google Scholar] [CrossRef] [Green Version]
  7. Shapiro, C.R.; Gayme, D.F.; Meneveau, C. Modelling yawed wind turbine wakes: A lifting line approach. J. Fluid Mech. 2018, 841, R1. [Google Scholar] [CrossRef] [Green Version]
  8. Bastankhah, M.; Porté-Agel, F. Experimental and theoretical study of wind turbine wakes in yawed conditions. J. Fluid Mech. 2016, 806, 506–541. [Google Scholar] [CrossRef]
  9. Segalini, A. An analytical model of wind-farm blockage. J. Renew. Sustain. Energy 2021, 13, 033307. [Google Scholar] [CrossRef]
  10. Segalini, A.; Dahlberg, J. Blockage effects in wind farms. Wind Energy 2020, 23, 120–128. [Google Scholar] [CrossRef]
  11. Stevens, R.J.; Gayme, D.F.; Meneveau, C. Effects of turbine spacing on the power output of extended wind-farms. Wind Energy 2016, 19, 359–370. [Google Scholar] [CrossRef] [Green Version]
  12. Burton, T.; Jenkins, N.; Sharpe, D.; Bossanyi, E. Wind Energy Handbook, 2nd ed.; John Wiley & Sons, Ltd.: Hoboken, NJ, USA, 2011. [Google Scholar]
  13. Anderson, C. Wind Turbines: Theory and Practice; Cambridge University Press: Cambridge, UK, 2020. [Google Scholar]
  14. Piqué, A.; Miller, M.A.; Hultmark, M. Laboratory investigation of the near and intermediate wake of a wind turbine at very high Reynolds numbers. Exp. Fluids 2022, 63, 106. [Google Scholar] [CrossRef]
  15. Miller, M.A.; Kiefer, J.; Westergaard, C.; Hansen, M.O.L.; Hultmark, M. Horizontal axis wind turbine testing at high Reynolds numbers. Phys. Rev. Fluids 2019, 4, 110504. [Google Scholar] [CrossRef]
  16. Chamorro, L.; Arndt, R.; Sotiropoulos, F. Reynolds number dependence of turbulence statistics in the wake of wind turbines. Wind Energy 2012, 15, 733–742. [Google Scholar] [CrossRef]
  17. Odemark, Y.; Fransson, J.H.M. The stability and development of tip and root vortices behind a model wind turbine. Exp. Fluids 2013, 54, 1597. [Google Scholar] [CrossRef]
  18. Medici, D.; Alfredsson, P.H. Measurements on a wind turbine wake: 3D effects and bluff body vortex shedding. Wind Energy 2006, 9, 219–236. [Google Scholar] [CrossRef]
  19. Bastankhah, M.; Porté-Agel, F. A New Miniature Wind Turbine for Wind Tunnel Experiments. Part I: Design and Performance. Energies 2017, 10, 908. [Google Scholar] [CrossRef] [Green Version]
  20. Bastankhah, M.; Porté-Agel, F. A New Miniature Wind Turbine for Wind Tunnel Experiments. Part II: Wake Structure and Flow Dynamics. Energies 2017, 10, 923. [Google Scholar] [CrossRef] [Green Version]
  21. Rocha, P.A.C.; Araujo, J.W.C.d.; Lima, R.J.P.; Silva, M.E.V.d.; Albiero, D.; Andrade, C.F.d.; Carneiro, F.O.M. The effects of blade pitch angle on the performance of small-scale wind turbine in urban environments. Energy 2018, 148, 169–178. [Google Scholar] [CrossRef]
  22. Lackner, M.A. An investigation of variable power collective pitch control for load mitigation of floating offshore wind turbines. Wind Energy 2013, 16, 435–444. [Google Scholar] [CrossRef]
  23. Niebsch, J.; Ramlau, R.; Nguyen, T.T. Mass and Aerodynamic Imbalance Estimates of Wind Turbines. Energies 2010, 3, 696–710. [Google Scholar] [CrossRef] [Green Version]
  24. Jasinski, W.J.; Noe, S.C.; Selig, M.S.; Bragg, M.B. Wind Turbine Performance Under Icing Conditions. J. Sol. Energy Eng. 1998, 120, 60–65. [Google Scholar] [CrossRef] [Green Version]
  25. Lamraoui, F.; Fortin, G.; Benoit, R.; Perron, J.; Masson, C. Atmospheric icing impact on wind turbine production. Cold Reg. Sci. Technol. 2014, 100, 36–49. [Google Scholar] [CrossRef]
  26. Castellani, F.; Eltayesh, A.; Becchetti, M.; Segalini, A. Aerodynamic Analysis of a Wind-Turbine Rotor Affected by Pitch Unbalance. Energies 2021, 14, 745. [Google Scholar] [CrossRef]
  27. Cacciola, S.; Agud, I.M.; Bottasso, C.L. Detection of rotor imbalance, including root cause, severity and location. J. Phys. Conf. Ser. 2016, 753, 072003. [Google Scholar] [CrossRef]
  28. Bertelè, M.; Bottasso, C.L.; Cacciola, S. Automatic detection and correction of pitch misalignment in wind turbine rotors. Wind Energy Sci. 2018, 3, 791–803. [Google Scholar] [CrossRef] [Green Version]
  29. Bai, C.J.; Wang, W.C. Review of computational and experimental approaches to analysis of aerodynamic performance in horizontal-axis wind turbines (HAWTs). Renew. Sustain. Energy Rev. 2016, 63, 506–519. [Google Scholar] [CrossRef]
  30. Yang, H.; Shen, W.; Xu, H.; Hong, Z.; Liu, C. Prediction of the wind turbine performance by using BEM with airfoil data extracted from CFD. Renew. Energy 2014, 70, 107–115. [Google Scholar] [CrossRef]
  31. Segalini, A.; Inghels, P. Confinement effects in wind turbine and propeller measurements. J. Fluid Mech. 2014, 756, 110–129. [Google Scholar] [CrossRef]
  32. Douvi, C.E.; Tsavalos, I.A.; Margaris, P.D. Evaluation of the turbulence models for the simulation of the flow over a National Advisory Committee for Aeronautics (NACA) 0012 airfoil. J. Mech. Eng. Res. 2012, 4, 100–111. [Google Scholar]
  33. Abbot, I.H.; Von Doenhoff, A.E. Theory of Wind Sections, 2nd ed.; Dover Publications, Inc.: Mineola, NY, USA, 1959. [Google Scholar]
  34. Miley, S.J. Catalog of Low-Reynolds-Number Airfoil Data for Wind-Turbine Applications; Rockwell International Corp.: Golden, CO, USA, 1982. [Google Scholar] [CrossRef]
  35. Viterna, L.A.; Janetzke, D.C. Theoretical and Experimental Power from Large Horizontal-Axis Wind Turbines; National Aeronautics and Space Administration: Cleveland, OH, USA, 1982. [CrossRef]
Figure 1. Main parameters of the wind turbine (left) and rotor plane forces and velocities (right).
Energies 15 08665 g001
Figure 2. (a,b) Scatter data of the velocity deficit distribution along the blade radius and variable azimuthal angle, at 1D downstream of the rotor plane. The red curve is the average value. (c,d) The standard deviation of the mean axial velocity deficit. The left panels are associated with a balanced case, while the right panels are associated with the unbalanced case with a pitch imbalance of 5 ° .
Energies 15 08665 g002
Figure 3. Turbine model (left) and schematic of the setup (right). Highlighted here are the external circuit connected to the DC generator, the strain gauges, and the laser diode pair.
Energies 15 08665 g003
Figure 4. Pitch angle definition (left) and setting setup (right).
Energies 15 08665 g004
Figure 5. C P and C T at variable tip speed ratio and collective pitch angle.
Energies 15 08665 g005
Figure 6. C L and C D of the used airfoil at variable Reynolds numbers and angles of attack.
Energies 15 08665 g006
Figure 7. Experimental C P and C T at variable tip speed ratios and pitch imbalances from the optimal collective pitch θ = + 2 ° .
Energies 15 08665 g007
Figure 8. Effect of the pitch imbalance on the C P and C T coefficients, compared to the balanced case.
Energies 15 08665 g008
Figure 9. Comparison between experimental and BEM results for variable unbalanced pitch.
Energies 15 08665 g009
Figure 10. Maximum C P at variable unbalanced pitch for both experiments and BEM simulations for θ = 2 ° .
Energies 15 08665 g010
Figure 11. Maximum C P achievable for each degree of imbalance Δ θ and collective pitch angle θ . Black dots: maximum C P for each Δ θ . Red dashed line: linear interpolation.
Energies 15 08665 g011
Figure 12. Thrust (left) and power density spectrum (right) for a balanced rotor at Ω = 285 rad/s.
Energies 15 08665 g012
Figure 13. Standard deviations of the axial (left) and lateral (right) loads for θ = 2 ° .
Energies 15 08665 g013
Figure 14. Variation of σ a (left) and σ l (right) at different oscillation frequencies and Δ θ for θ = 2 ° .
Energies 15 08665 g014
Table 1. Mesh properties and boundary conditions. The viscous scaled wall distance range ( y + = y u τ / ν ) is intended for the range of Reynolds numbers achievable on the airfoil surface during the experimental tests, that is R e = 4000 ÷ 70 , 000 , based on the mean chord.
ParameterValueRegionBoundary Condition
Chord (c) 0.01439 mSemi-circle inletInlet velocity
Domain height 20 c Side wallsInlet velocity
Domain length 30 c Downstream wallPressure outlet
y + 0.02 ÷ 0.2 Airfoil surfaceNo-slip condition
Number of elements88,320
Number of nodes89,322
Minimum face area 3.9175 · 10 7 m 2
Maximum face area 1.7221 · 10 2 m 2
Publisher’s Note: MDPI stays neutral with regard to jurisdictional claims in published maps and institutional affiliations.

