Article

Real-Time Validation of a Novel IAOA Technique-Based Offset Hysteresis Band Current Controller for Grid-Tied Photovoltaic System

1
Department of Electrical Engineering, ITER, Siksha ‘O’ Anusandhan (Deemed to be University), Odisha 751030, India
2
Department of Electrical Engineering, Graphic Era (Deemed to be University), Dehradun 248002, India
3
ENET Centre, VSB—Technical University of Ostrava, 708 00 Ostrava, Czech Republic
4
Department of Electrical Engineering, College of Engineering, Taif University, P.O. Box 11099, Taif 21944, Saudi Arabia
*
Authors to whom correspondence should be addressed.
Energies 2022, 15(23), 8790; https://doi.org/10.3390/en15238790
Submission received: 16 October 2022 / Revised: 14 November 2022 / Accepted: 17 November 2022 / Published: 22 November 2022
(This article belongs to the Special Issue Challenges and Research Trends of Renewable Energy Power System)

Abstract

:
Renewable energy sources have power quality and stability issues despite having vast benefits when integrated with the utility grid. High currents and voltages are introduced during the disconnection or injection from or into the power system. Due to excessive inverter switching frequencies, distorted voltage waveforms and high distortions in the output current may be observed. Hence, advancing intelligent and robust optimization techniques along with advanced controllers is the need of the hour. Therefore, this article presents an improved arithmetic optimization algorithm and an offset hysteresis band current controller. Conventional hysteresis band current controllers (CHCCs) offer substantial advantages such as fast dynamic response, over-current, and robustness in response to impedance variations, but they suffer from variable switching frequency. The offset hysteresis band current controller utilizes the zero-crossing time of the current error for calculating the lower/upper hysteresis bands after the measurement of half of the error current period. The duty cycle and hysteresis bands are considered as design variables and are optimally designed by minimizing the current error and the switching frequency. It is observed that the proposed controller yields a minimum average switching frequency of 2.33 kHz and minimum average switching losses of 9.07 W in comparison to other suggested controllers. Results are validated using MATLAB/Simulink environment followed by real-time simulator OPAL-RT 4510.

1. Introduction

Global warming and climate issues are considerably increased due to the unfeasible energy consumption of fossil fuel resources. By 2050, the global temperature is expected to increase around 2 0 Celsius because of the emissions by non-renewable energy sources [1,2]. Economical and renewable energy sources (RESs) must be explored to reduce the worse environmental impacts through effective actions. Various research works have been carried out on RES methods in the last few decades to improve overall efficiency. According to the International Renewable Energy Agency (IRENA) report, the cost of energy from renewables has gradually decreased in the previous few years [3]. Many countries are installing RESs in their power systems due to reduced power energy costs. The increase in urbanization and growth of world industry has made power generation by RESs widespread.
The solar energy available for trapping changes throughout the day. The weather parameters play a crucial part in the reliability of solar energy trapping [4]. The reliability of renewable energy technologies, reduction in carbon emissions, reduction in costs of energy generation, and competitive nature of the market are the different reasons to adopt the RESs in large proportions. The yearly consumption of natural gas and oil used in power production will double by 2050 if world consumption increases linearly [5,6,7]. In 2017, approximately 77% of new installations were based on the extraction of electric energy from wind and solar energies [8]. In the period between 2010 and 2017, the cost of energy from PVs was reduced by three-quarters due to technological advancement [9]. The cost of wind energy generation has decreased by about half due to the reduction in wind turbine prices.
The advancement of PV technology throughout the globe is represented in two stages: improvement in research and development and growth of PV projects [10]. The contribution of research papers has increased considerably relating to the optimization techniques in PV systems in the last few years. PV installation has improved due to the evolution of scientific research articles. Thus, optimization techniques have a crucial role in the effectiveness and reliability of photovoltaic systems.
Wind speed, solar radiation, and ambient temperature are the weather factors strongly related to the PV optimization technique. Various mathematical models of PV technologies are illustrated in [11]. The PSO technique is the most reliable and efficient algorithm for trapping maximum PV performance and higher power outputs [12]. In terms of speed and ability, the PSO algorithm reached positive impressions in the optimization method [13]. The key points of optimization of photovoltaic systems are varying convergence rates, optimal scheduling operations, computational complexity, and accurate performance. Compared to the conventional technique, the intelligent technique has proven more accurate and robust because of precise convergence speed and calculation and the exploitation and exploration to reach the global optimal solutions [14].
The deployment of different optimization techniques in photovoltaic systems and wind turbines has increased the production capacity of RESs to meet the rise in energy demand in the world market. In 2020, the total power-delivering capacity increased by 9% compared to 2016 [15]. Since 2017, the renewable energy power production cost has significantly decreased [16]. However, the deployment and development of RES technologies need additional investment and policies that must be examined thoroughly [17]. In addition, more awareness must be created about the quality and efficiency of using renewable energy. Renewable energy is estimated as 70% of the whole world’s power generation capacity as per the Global Report of 2019. A huge investment is being made worldwide for research and development to improve the efficiency of PV systems. The intermittent nature of renewable energy sources is the main drawback, but renewable energy proves more reliable in operational parameters [18].
Metaheuristic optimization algorithms (MOAs) have been very popular in engineering applications. The reasons for this increasing demand are (i) avoidance of local optima, (ii) simple and effective hardware implementation, (iii) derivation-free mechanisms, (iv) flexible and simple structure and concepts, etc. The optimization problems are solved by nature-inspired MOAs simulating physical or biological phenomena [19]. For the achievement of the global optimum solution, various nature-inspired algorithms such as particle swarm optimization (PSO) [20], grey wolf optimizer (GWO) [21], gravitational search algorithm (GSA), teaching–learning-based optimization (TLBO) [22], and artificial bee colony (ABC) algorithm [23] are applied in different areas of research. A mathematics-based model known as the arithmetic optimization algorithm (AOA) technique [24] was recently proposed to solve optimization problems. In some cases, the original AOA technique has some drawbacks such as local optima and premature coverage. The main goal of this paper is to find the optimal values of the hysteresis bands and duty cycle. A hybrid algorithm technique, i.e., an improved arithmetic optimization algorithm (IAOA) technique, is proposed by combining the arithmetic optimization algorithm with particle swarm optimization in this article. The drawbacks such as being trapped in fast convergence and local optima of the traditional AOA technique are addressed by IAOA. Thus, IAOA may be used to improve the performance of AOA. In this article, some popular benchmark functions are considered to prove the efficacy of the proposed IAOA technique over the AOA technique.
There are different current control techniques proposed for grid-tied inverter systems. Still, the hysteresis band current controller is easy to implement and has faster current controllability compared to other current control methods. The interval between the two consecutive switching actions varies within the power frequency cycle in most PWM applications. Therefore, the switching frequency varies in time with conditions and operation points. The increasing switching frequency causes an increase in switching losses, EMF-related problems, and audible noise. An extra offset hysteresis band is added over the existing two-level hysteresis band to develop an offset hysteresis band current controller, which reduces the switching frequency to a lower value. The stress on inverter switching is reduced, as this strategy uses the zero switching condition of the inverter. Conventional hysteresis band current controllers do not consider the inverter zero switching condition [25]. The merits of the OFHCC over the conventional HCC are shown in Figure 1. The performance characteristics of grid-tied inverters basically depend on the controller strategy [26]. The methods proposed in [27] are centered on the current control strategies which include linear and nonlinear controllers. The linear controllers include repetitive current (RC), proportional-integral (PI), and proportional-resonant (PR) controllers. On the other hand, the nonlinear techniques include hysteresis current controllers, predictive controllers, and dead-beat (DB) controllers [28].
The contributions and key highlights of the paper are as follows:
  • Design of a novel IAOA optimization technique for a microgrid-connected PV system.
  • Application of conventional and offset hysteresis band current controller in a PV-based microgrid.
  • Realization of enhanced performance with an IAOA-based offset hysteresis band current controller.
  • Establishment of the effectiveness of the proposed control algorithm in mitigating harmonics from the grid current.
  • Comparative analysis of novel metaheuristic algorithm-based conventional and offset hysteresis band current controllers with MATLAB/Simulink and OPAL-RT simulator with linear and nonlinear loads.
The architecture of the article is as follows: Section 2 describes the system modeling i.e., PV module, single-phase PWM-VSI, proposed methodology, and reference current technique. An analysis of different hysteresis current controllers is presented in Section 3. Common benchmark functions are depicted in Section 4. A detailed analysis of the algorithms along with respective pseudocodes is presented in Section 5. Finally, Section 6 demonstrates the features and validity of the proposed methodology through simulation and experimental results.

2. System Modelling

2.1. PV Module Model

Various I-V characteristics are obtained for photovoltaic panels under fluctuating solar irradiance and temperature. PV cells are generally modeled using the single and double-diode models [29,30]. Due to its wide applicability and simplicity, the single diode is used in various PV cell modeling applications [31]. The development of simulation strategies requires precise details of power generation and behavior. The five unknown parameters IPH, α, RP, RS, and IS can be illustrated as I = f(V, I) as shown in Equation (1). PV cell modeling follows the circuit-based depiction of the PV module [32].
The quality of current flow in the PV panel is as follows:
I PV =   I PH I S e q V PV   +   I PV R S KT 1 V PV + I PV   R S R P
where IPV = output current of PV module (a), IPH = irradiance produced current (a), IS = reverse saturation current (a), VPV = output of PV module (V), RS = series resistance (Ω), RP = parallel resistance (Ω), q = charge of electron, K = Boltzmann constant, T = operating temperature of PV module (K), and α = diode ideality parameter.

2.2. Modeling of Single-Phase PWM-VSI

Distributed power generation based on PV energy systems and wind mostly uses grid-integrated VSIs as a fragment of conversion systems. The performance evaluation of power electronic devices can be performed by analyzing the total harmonic distortion (THD), switching losses, transient response, and energy efficiency. In addition, power electronic devices are used to convert DC into AC form [33,34,35,36,37,38].
Wavelet analysis is utilized to calculate the high distortions in the output voltage [39]. THD estimates the static load variations of the output voltage. The desired quality of VSI output voltage is challenging to obtain in the present scenario. For dynamic load variations, advanced controllers such as CHCCs and OFHCCs reduce the output voltage distortions [40].
V DC = L f di o dt + V g
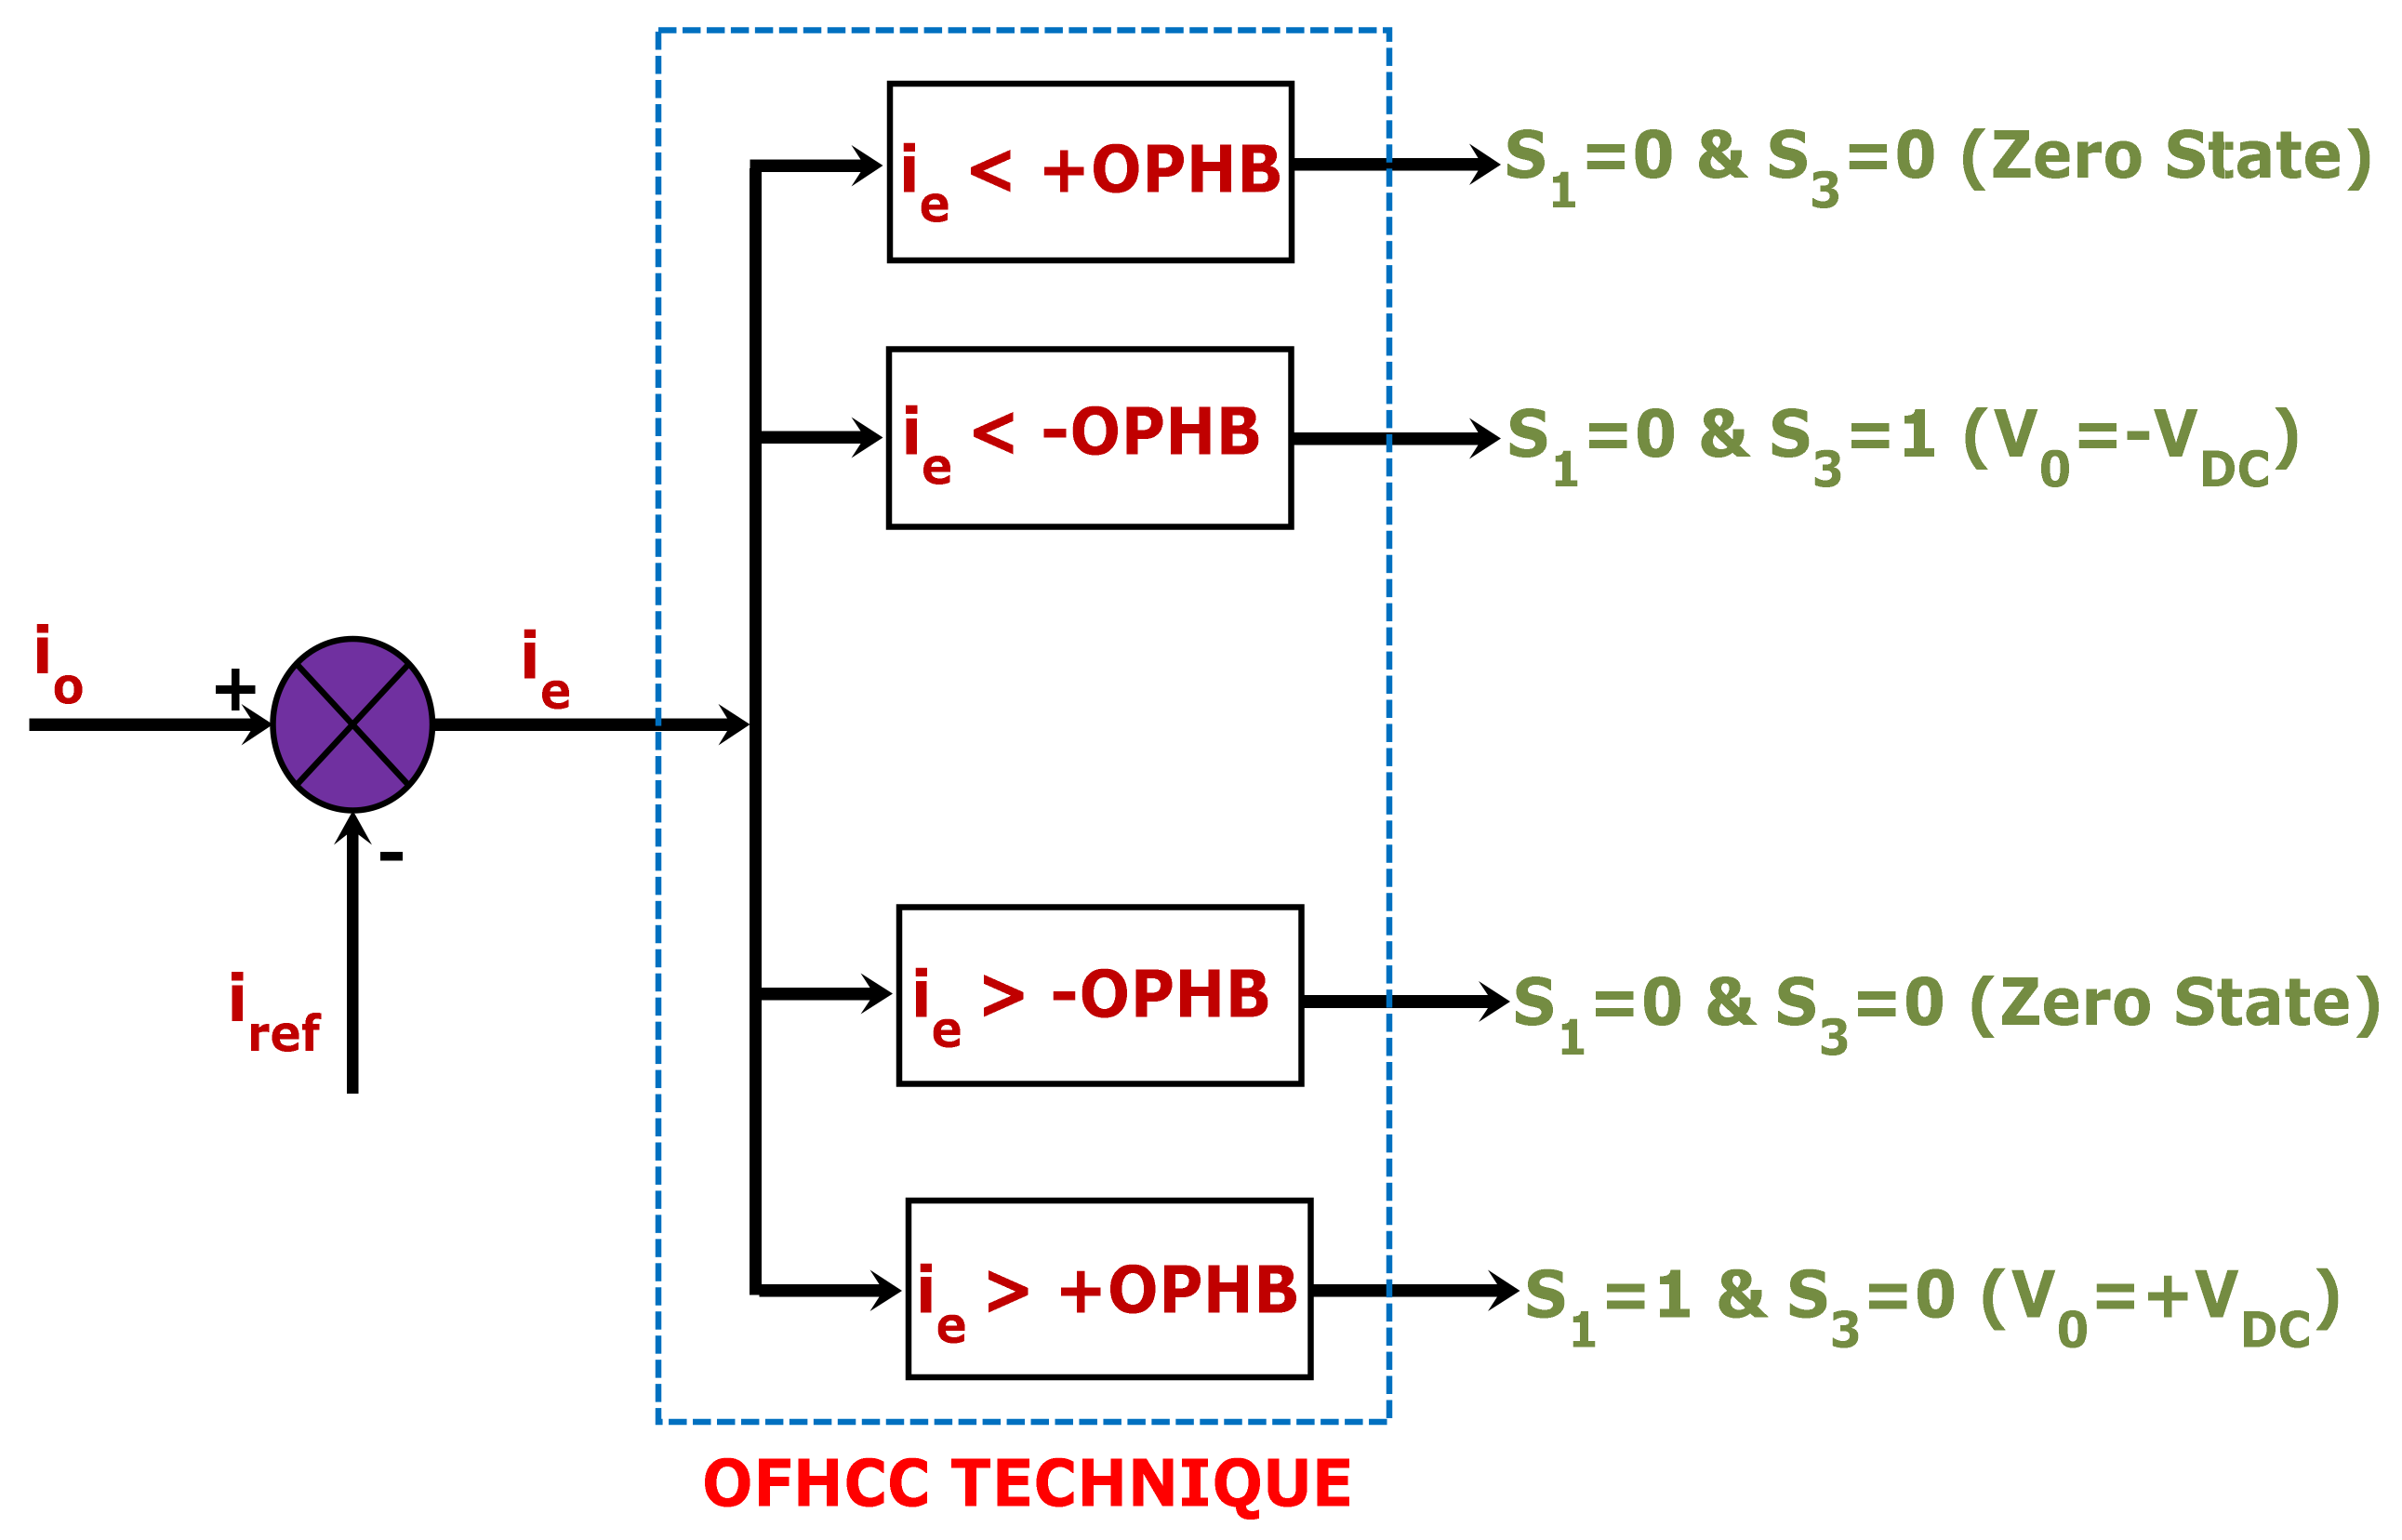
i o i ref = i e
V DC = L f d i ref + i e dt +   V g
Taking into account the dynamic conditions of the system,
V DC   V g =   L f di e dt
di e dt = V DC   V g L f
where io is the actual current of the inverter, ie is the error current, and iref is the reference current.

2.3. Proposed Methodology

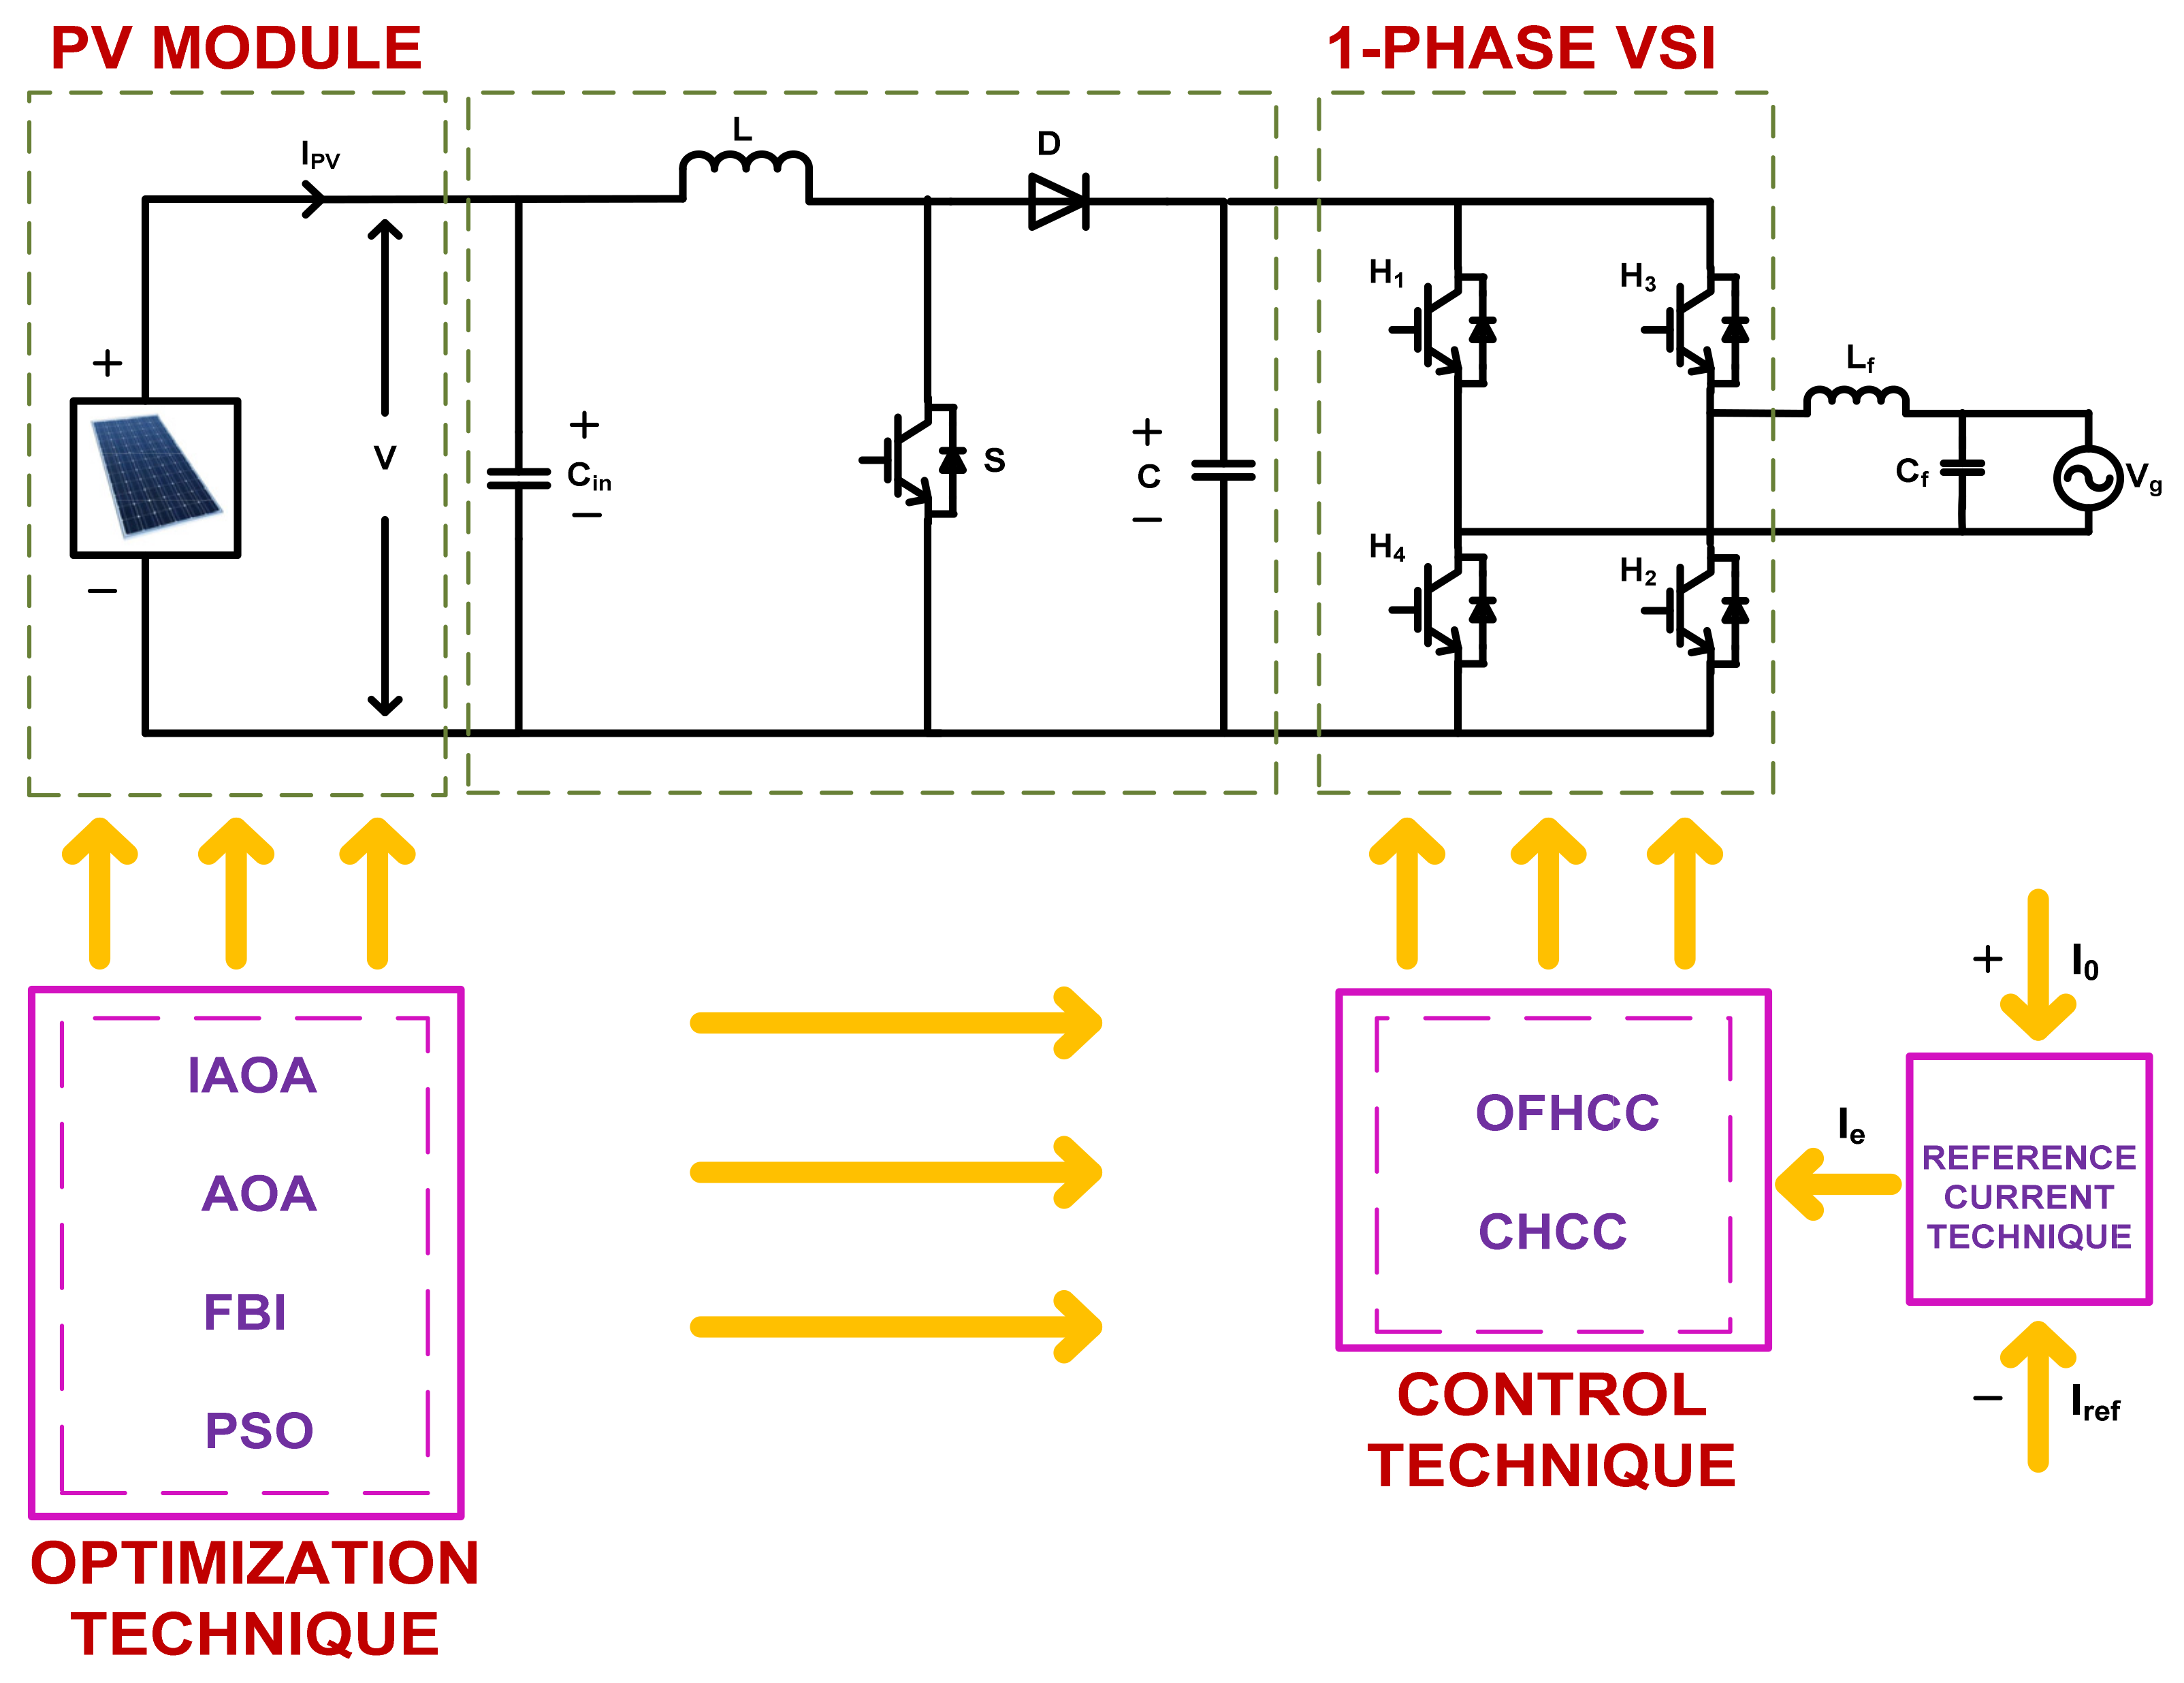
The proposed methodology is the integration of IAOA-OFHCC and IAOA-CHCC with a grid PV system. There are basically seven components: (1) PV array, (2) boost converter with optimized duty cycle, (3) algorithms for optimization of hysteresis bands and duty cycle, (4) conventional hysteresis band current controller, (5) offset hysteresis band current controller, (6) utility grid, and (7) reference current technique. Figure 2 presents the schematic diagram of the grid-tied PV system. The voltage of PV is increased to a higher level through the optimized duty cycle of the boost converter. The boost converter’s output is fed to a single-phase inverter where DC power is converted into AC power, making it suitable with reduced current rippling for feeding to the utility grid. CHCC and OFHCC control the single-phase inverter’s switching. The error current is passed through both the controllers between the optimized bands. The proposed schemes are compared with the PSO-CHCC, FBI-CHCC, AOA-CHCC, PSO-OFHCC, FBI-OFHCC, and AOA-OFHCC.

2.4. Reference Current Technique

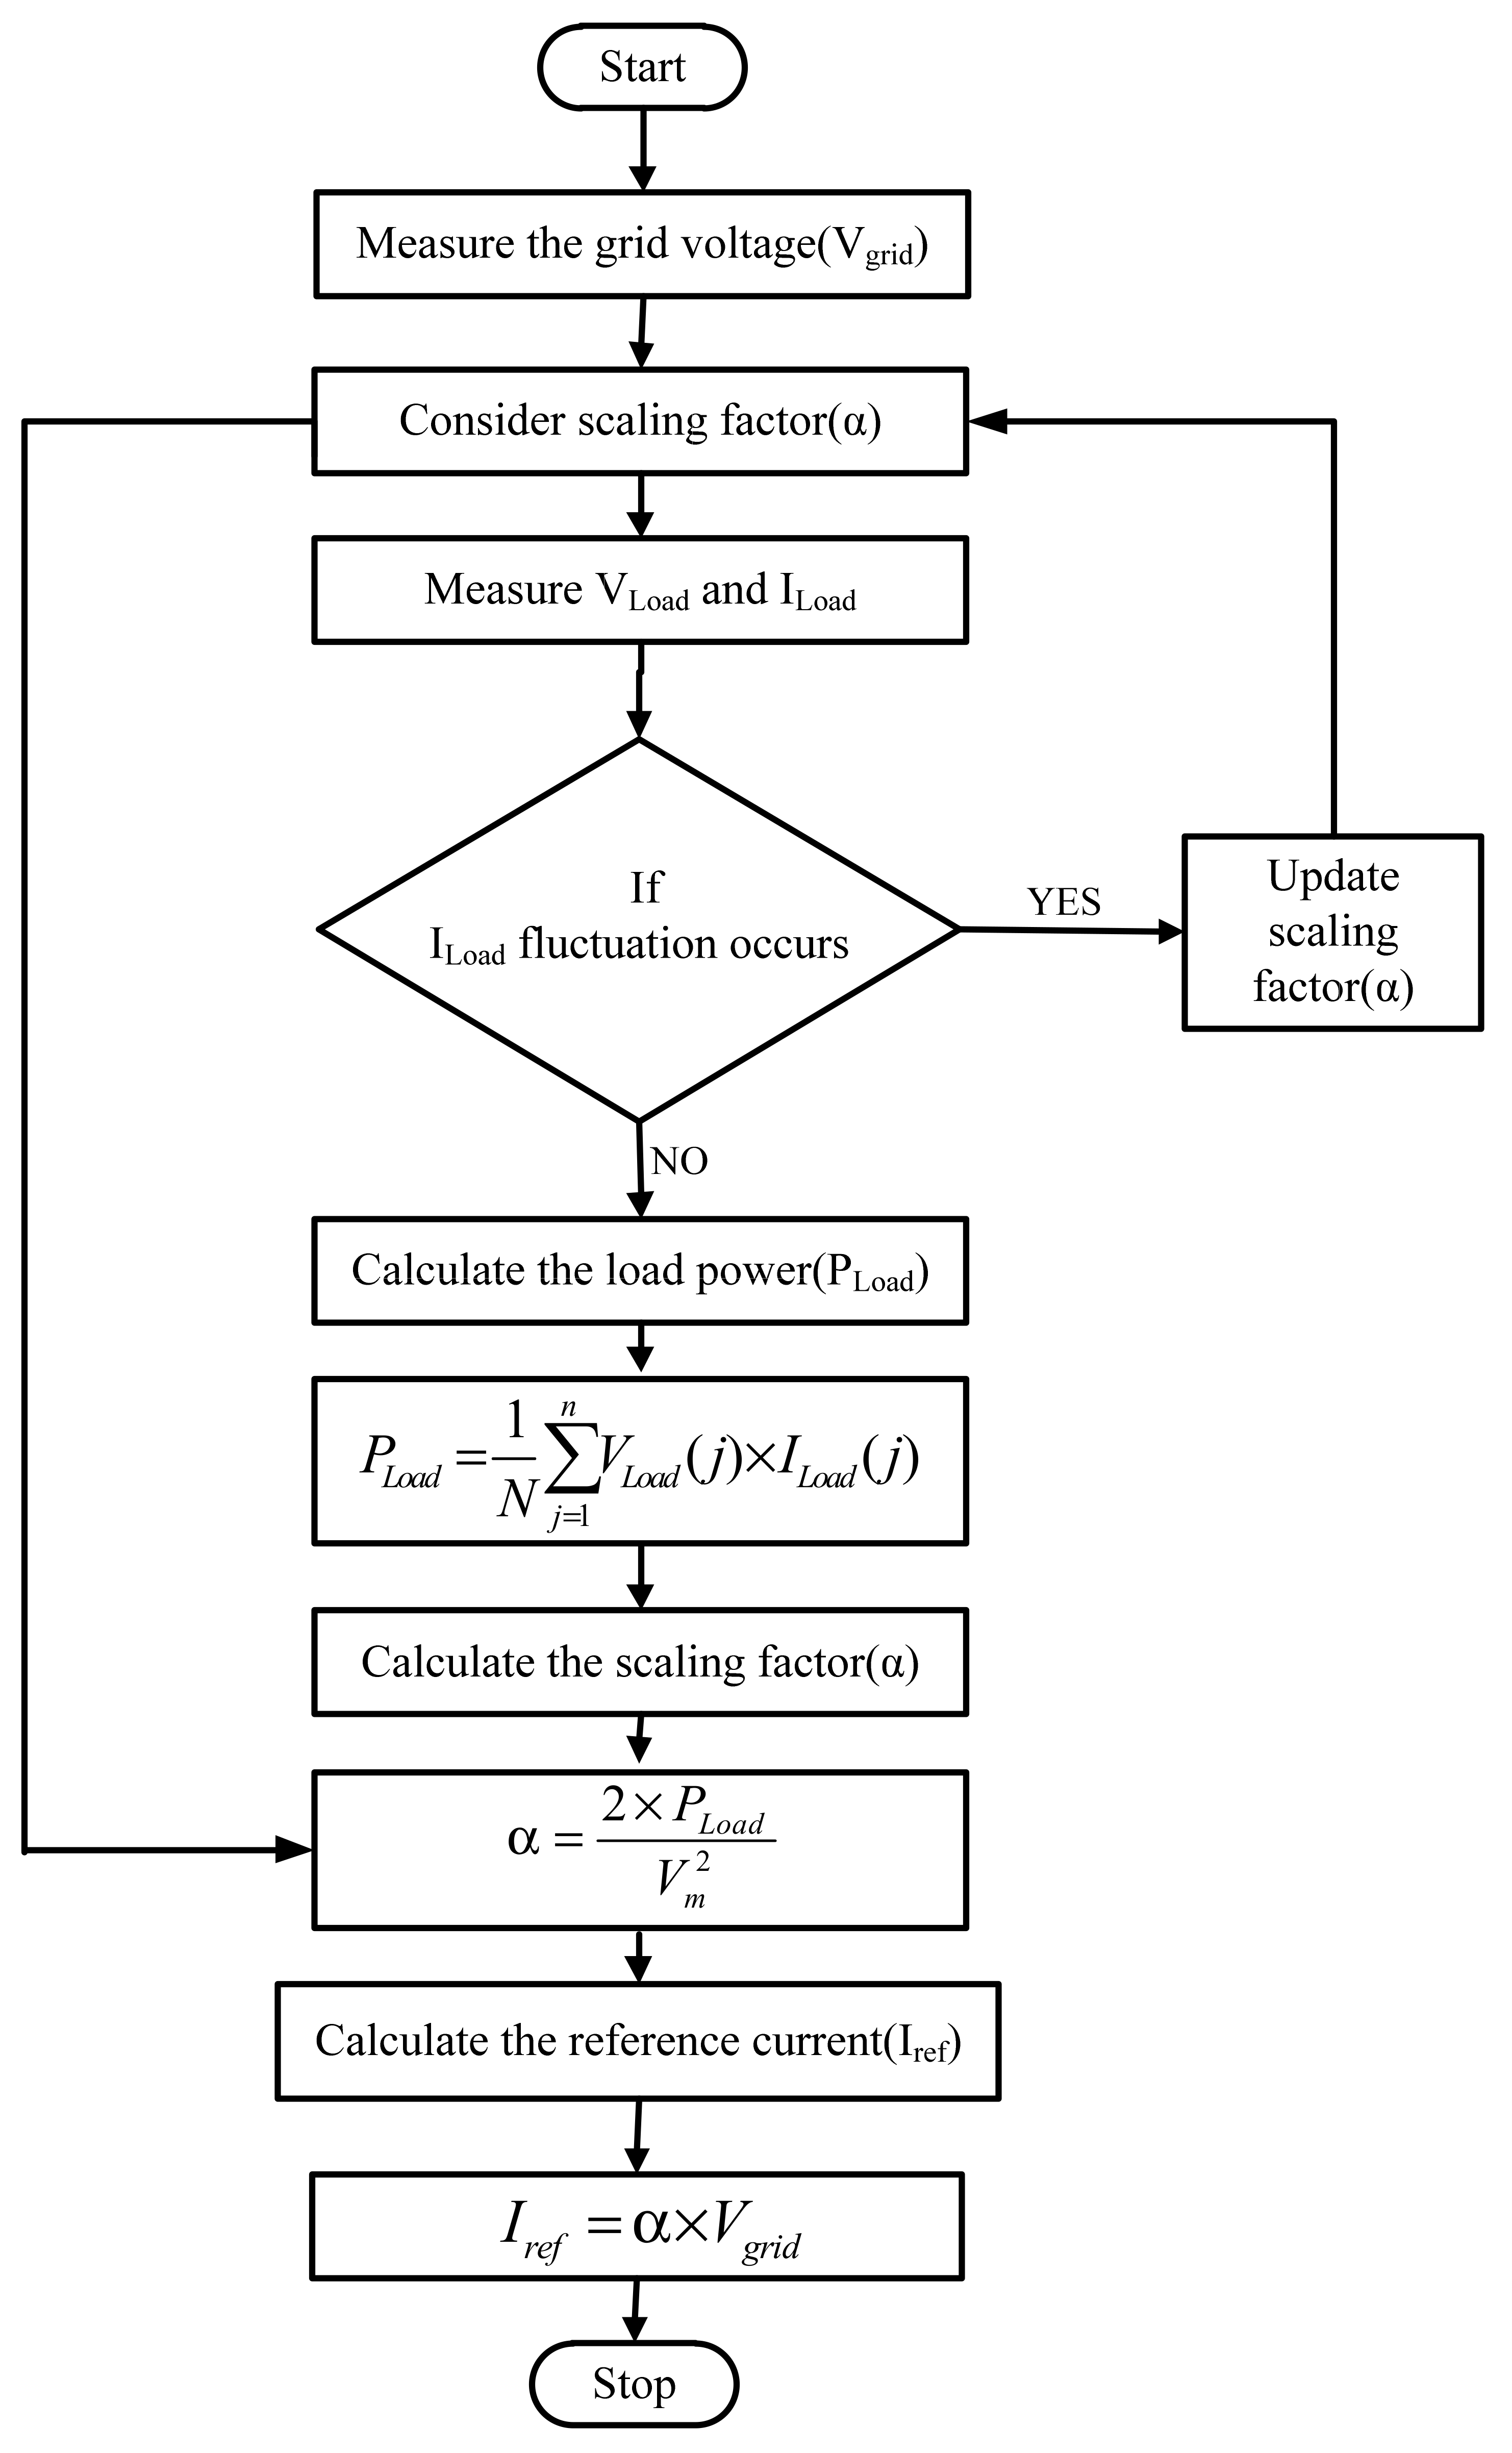
The reference current method in [41] is implemented in this paper. After the measurement of the grid voltage, the manipulation is carried out to calculate the reference current. The scaling factor (α) is regularly updated with the load variation. The grid-connected reference current technique is shown in Figure 3.

3. Analysis of Advanced Controllers

3.1. Conventional Hysteresis Band Current Controller (CHCC)

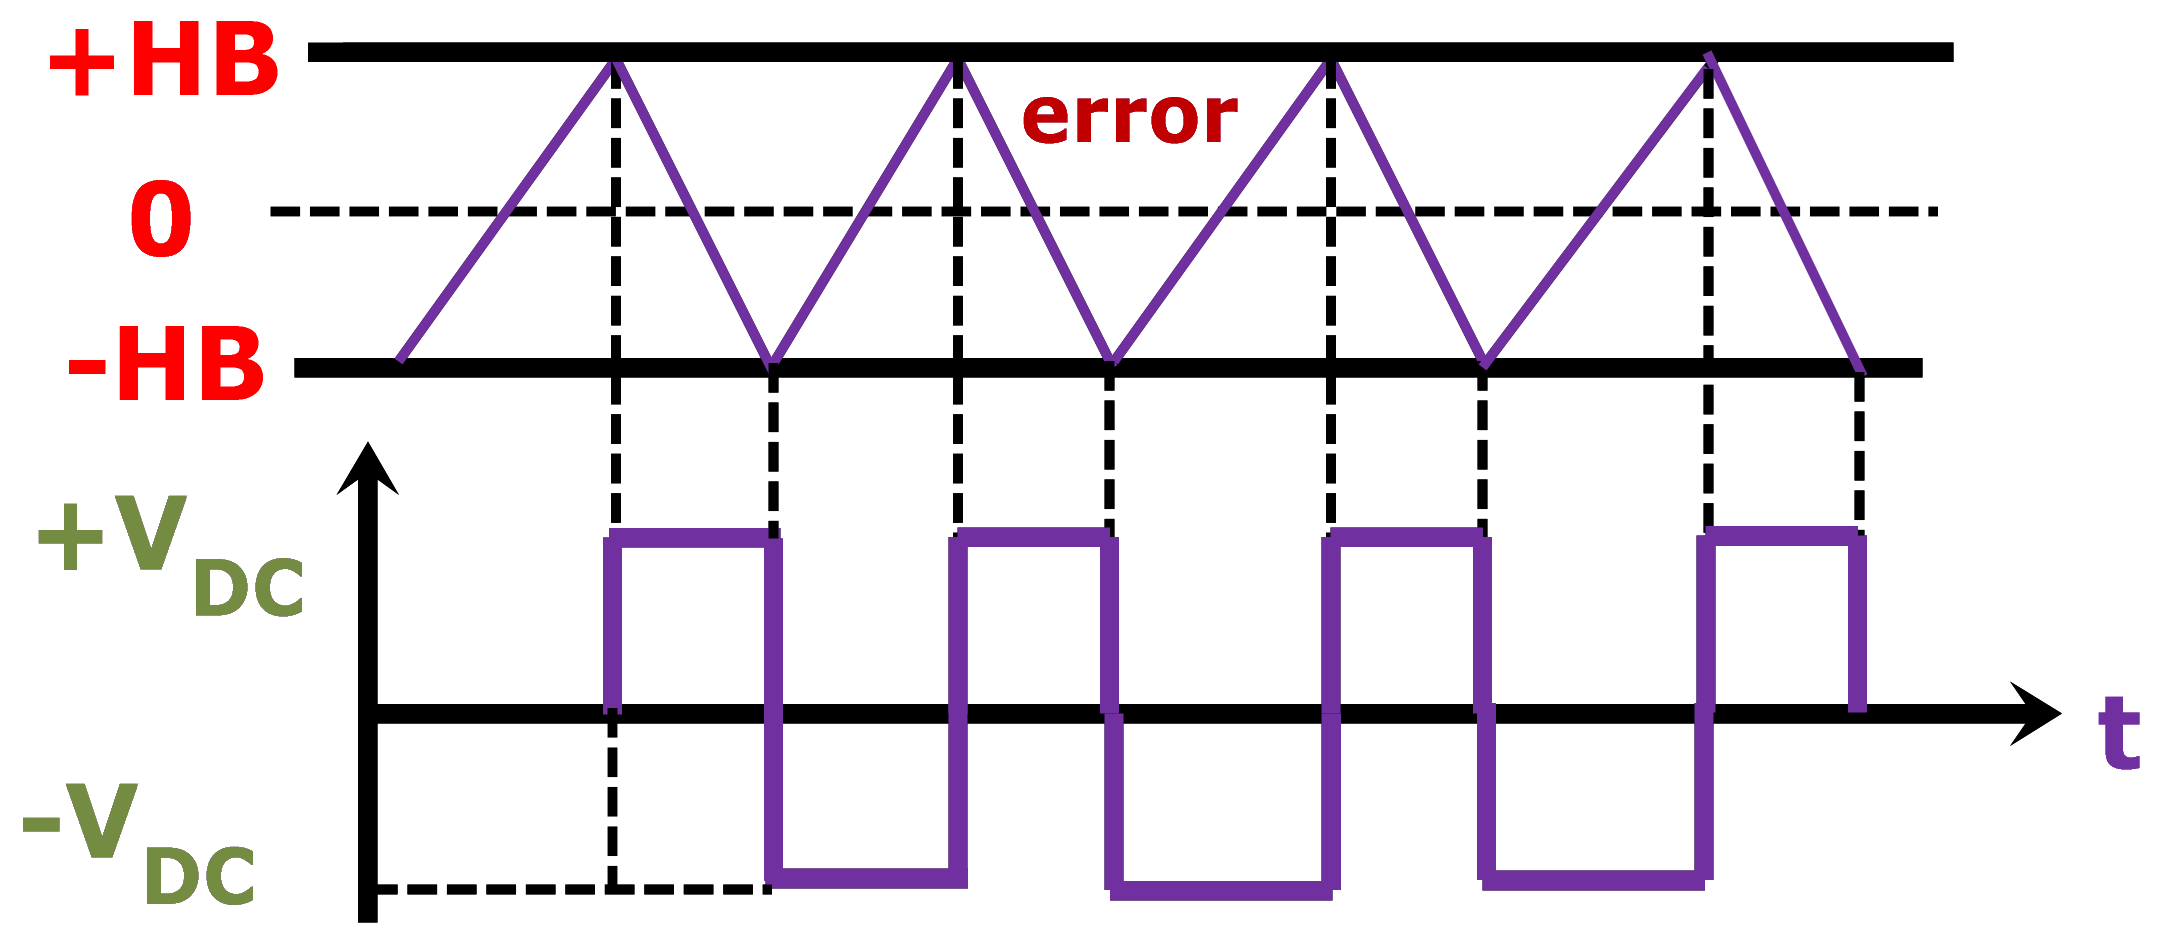
The conventional hysteresis current controller is very well regarded due to its unconditioned stability and excellent transient response for grid-connected inverters [42,43,44,45,46]. The actual output of the inverter is compared with the current reference to generate the current error. The current error generated by the actual and reference current difference is restricted within the optimized hysteresis bands. When the current error reaches the lower band, the inverter switches S2 and S3 are turned on, and inverter switches S1 and S4 are turned on when the error touches the upper band. The switching signals of the IGBTs are generated by restricting the error current within the fixed hysteresis bands. The bandwidth of the hysteresis current controller is calculated in [42]. With decreased hysteresis bandwidth, the error is minimized, but the average switching frequency will increase, resulting in increased average switching losses in the system [47]. The operation of the conventional hysteresis band current controller is explained in Figure 4.

3.2. Offset Hysteresis Band Current Controller (OFHCC)

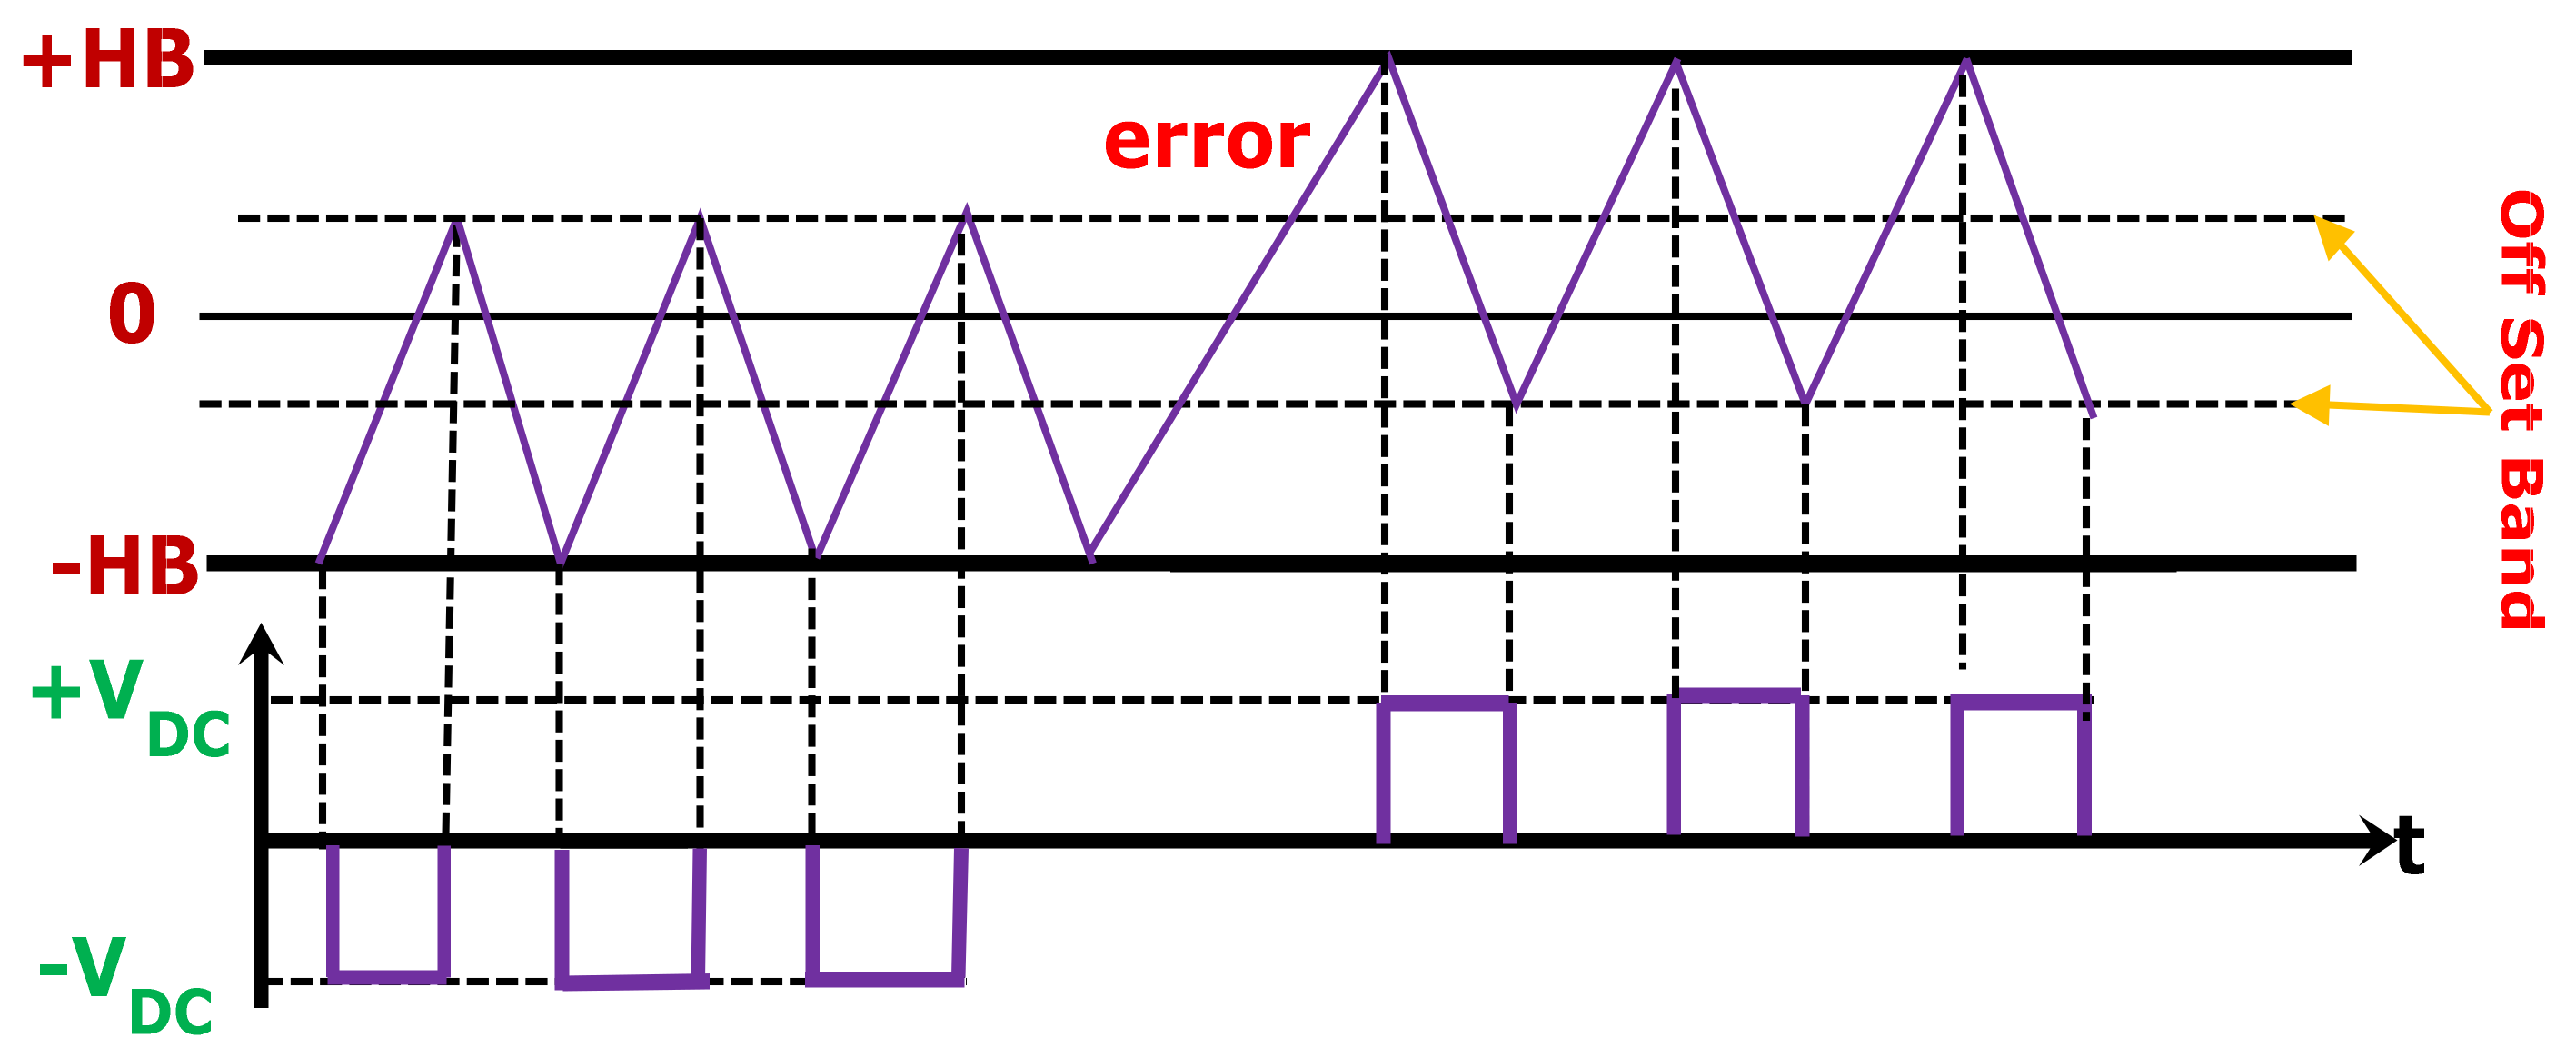
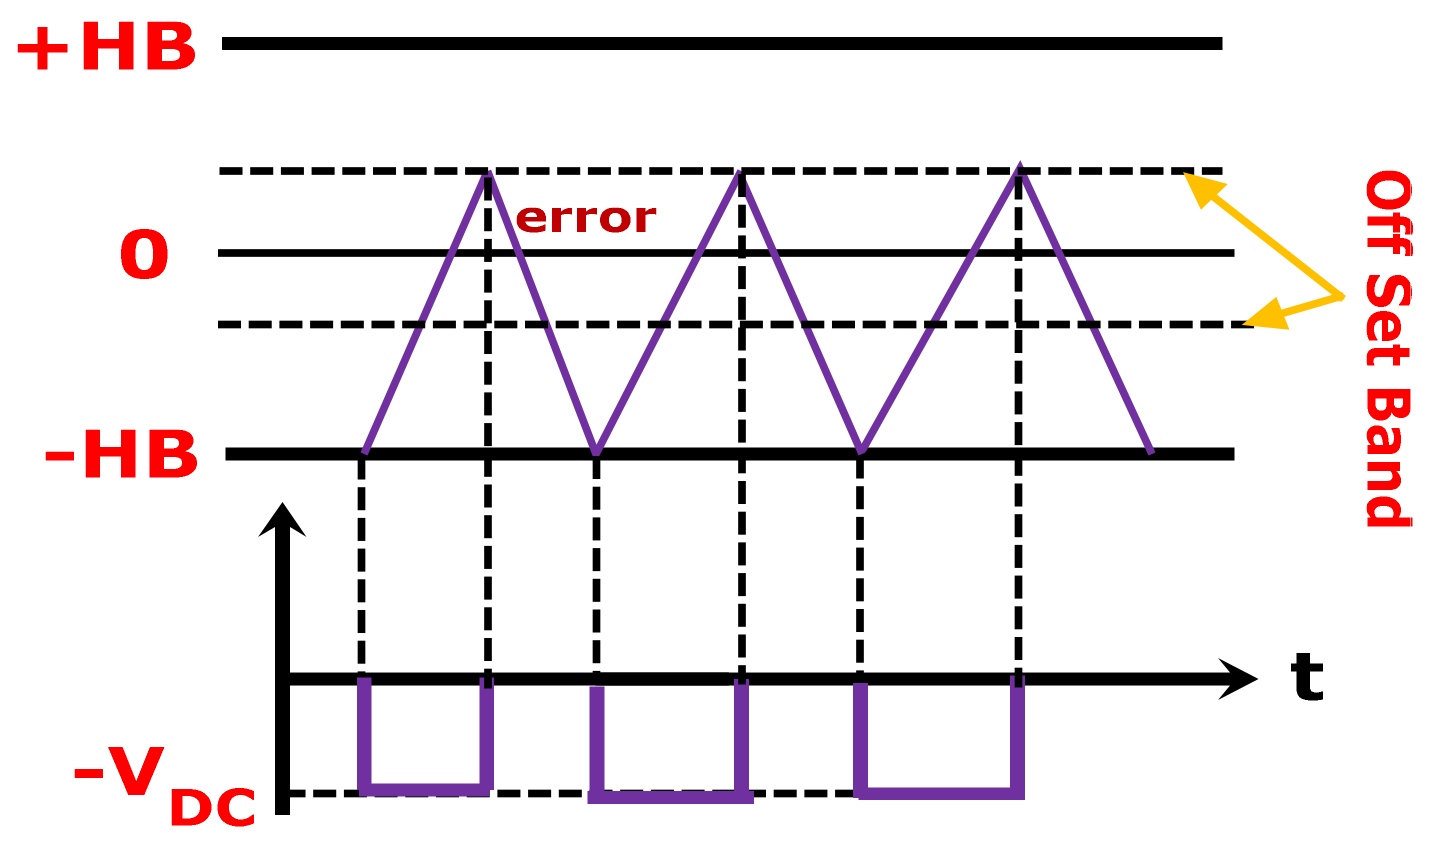
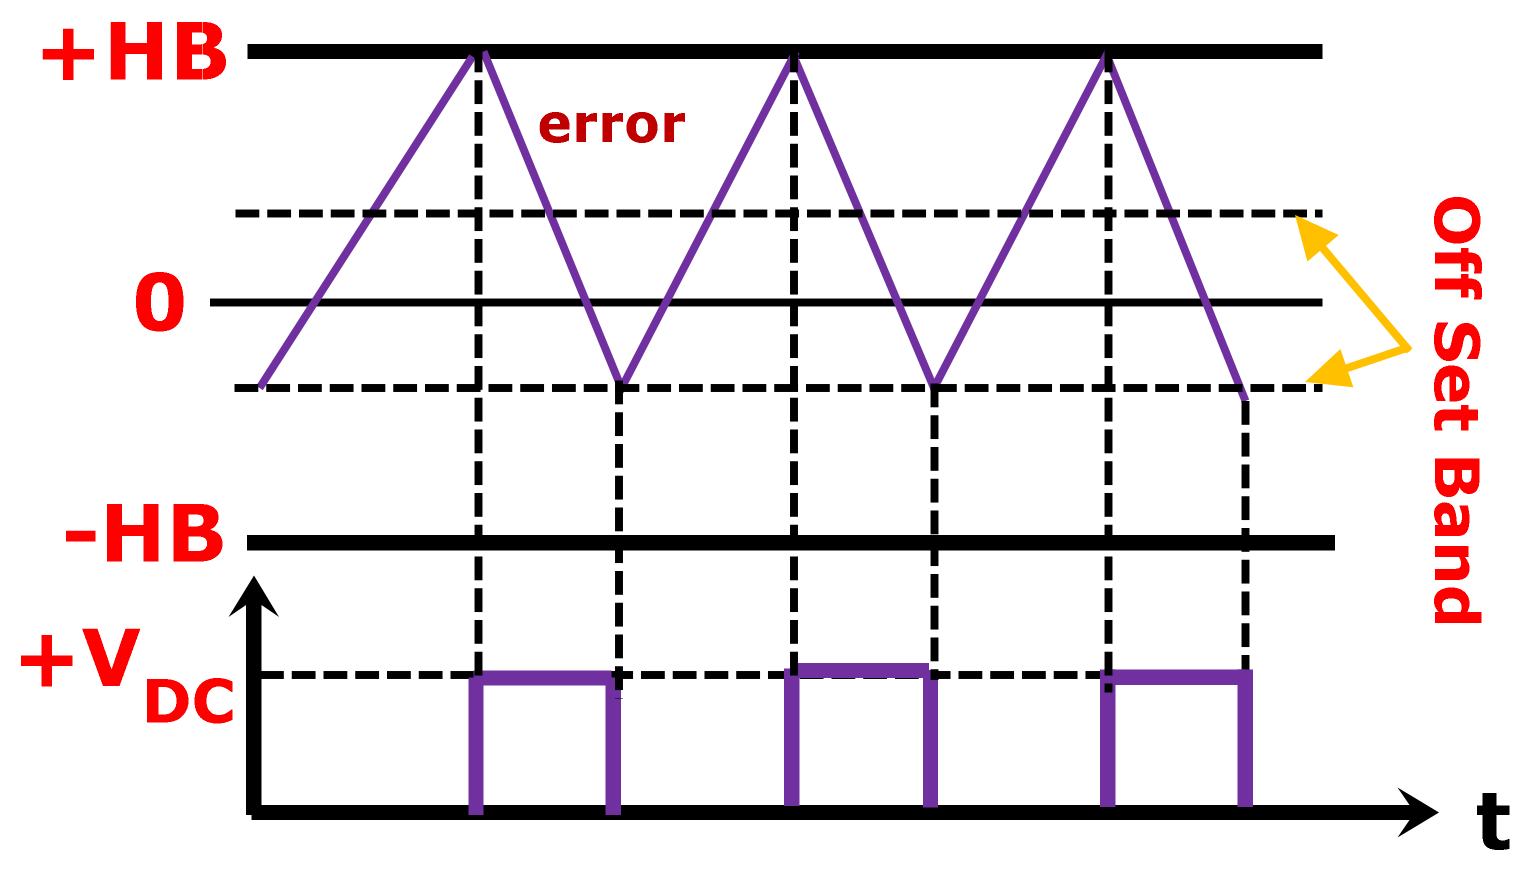
The conventional hysteresis band current controller does not utilize the zero output condition of the inverter, which leads to a high average switching frequency deviation. The offset hysteresis band current controller is implemented by using an extra hysteresis band and considering the inverter zero output condition which results in a reduction in current error, average switching frequency, and average switching losses. An optimized hysteresis band is proposed which overlaps the existing upper and lower hysteresis bands. When the error current reaches the inner hysteresis band, the inverter output is set to zero condition. Similarly, reversal of the error current occurs when the error current passes an outer hysteresis band, making the inverter output either positively or negatively active. The error current will continue through the inner band to the next outer band, and the error current will reverse. The operating strategy of OFHCC is depicted in Figure 5.
A new inverter switching process introduces the output current with either positive or negative DC offset error depending on the active output voltage. The error current is restricted between the upper–outer and lower–inner hysteresis bands for a negative inverter output, and the error current is restricted between the lower–outer and upper–inner hysteresis bands for a positive inverter output, as shown in Figure 6 and Figure 7, respectively [49].
In an offset hysteresis band current controller, the average switching frequency is reduced by a factor of 4.4, and thus the switching losses are reduced by a factor of 4.4 compared to those of a conventional hysteresis band current controller. Thus, the performance of the OFHCC is improved.
The switching cycle of the offset hysteresis band current controller is as follows: 0 t 1   T 2 .
For Cycle 0 t 1 ,
Δ I = 1.1 HB   ,   V DC = 0   ,   Δ t = t 1  
and thus,
t 1 =   T ON = 1.1 L f   HB   V g
For Cycle t 1 T 2 ,
Δ I = 1.1 HB ,   V DC = + V DC   ,   Δ t = T 2 t 1
and thus,
T 2 t 1 = T OFF = 1.1 L f   HB V DC     V g
The summation of Equations (7) and (8) gives the average switching frequency of the OFHCC:
T = 2.2   V DC   L f   HB V g V DC   V g
f s , av OFHCC = 1 T = V g V DC   V g 4.4 V DC L f   HB
The switching strategy is illustrated in Figure 8.
The average switching frequency is time-varying and is a function of the inductor (Lf) and hysteresis band (HB), which can be observed from Equation (10). The selection of the inductor (Lf) value is made in such a way that it compromises between the ripple current and the average switching frequency. The reasonable harmonics and average switching frequency are achieved by choosing an optimum value for the hysteresis band.

4. Common Benchmark Functions Used in the Study

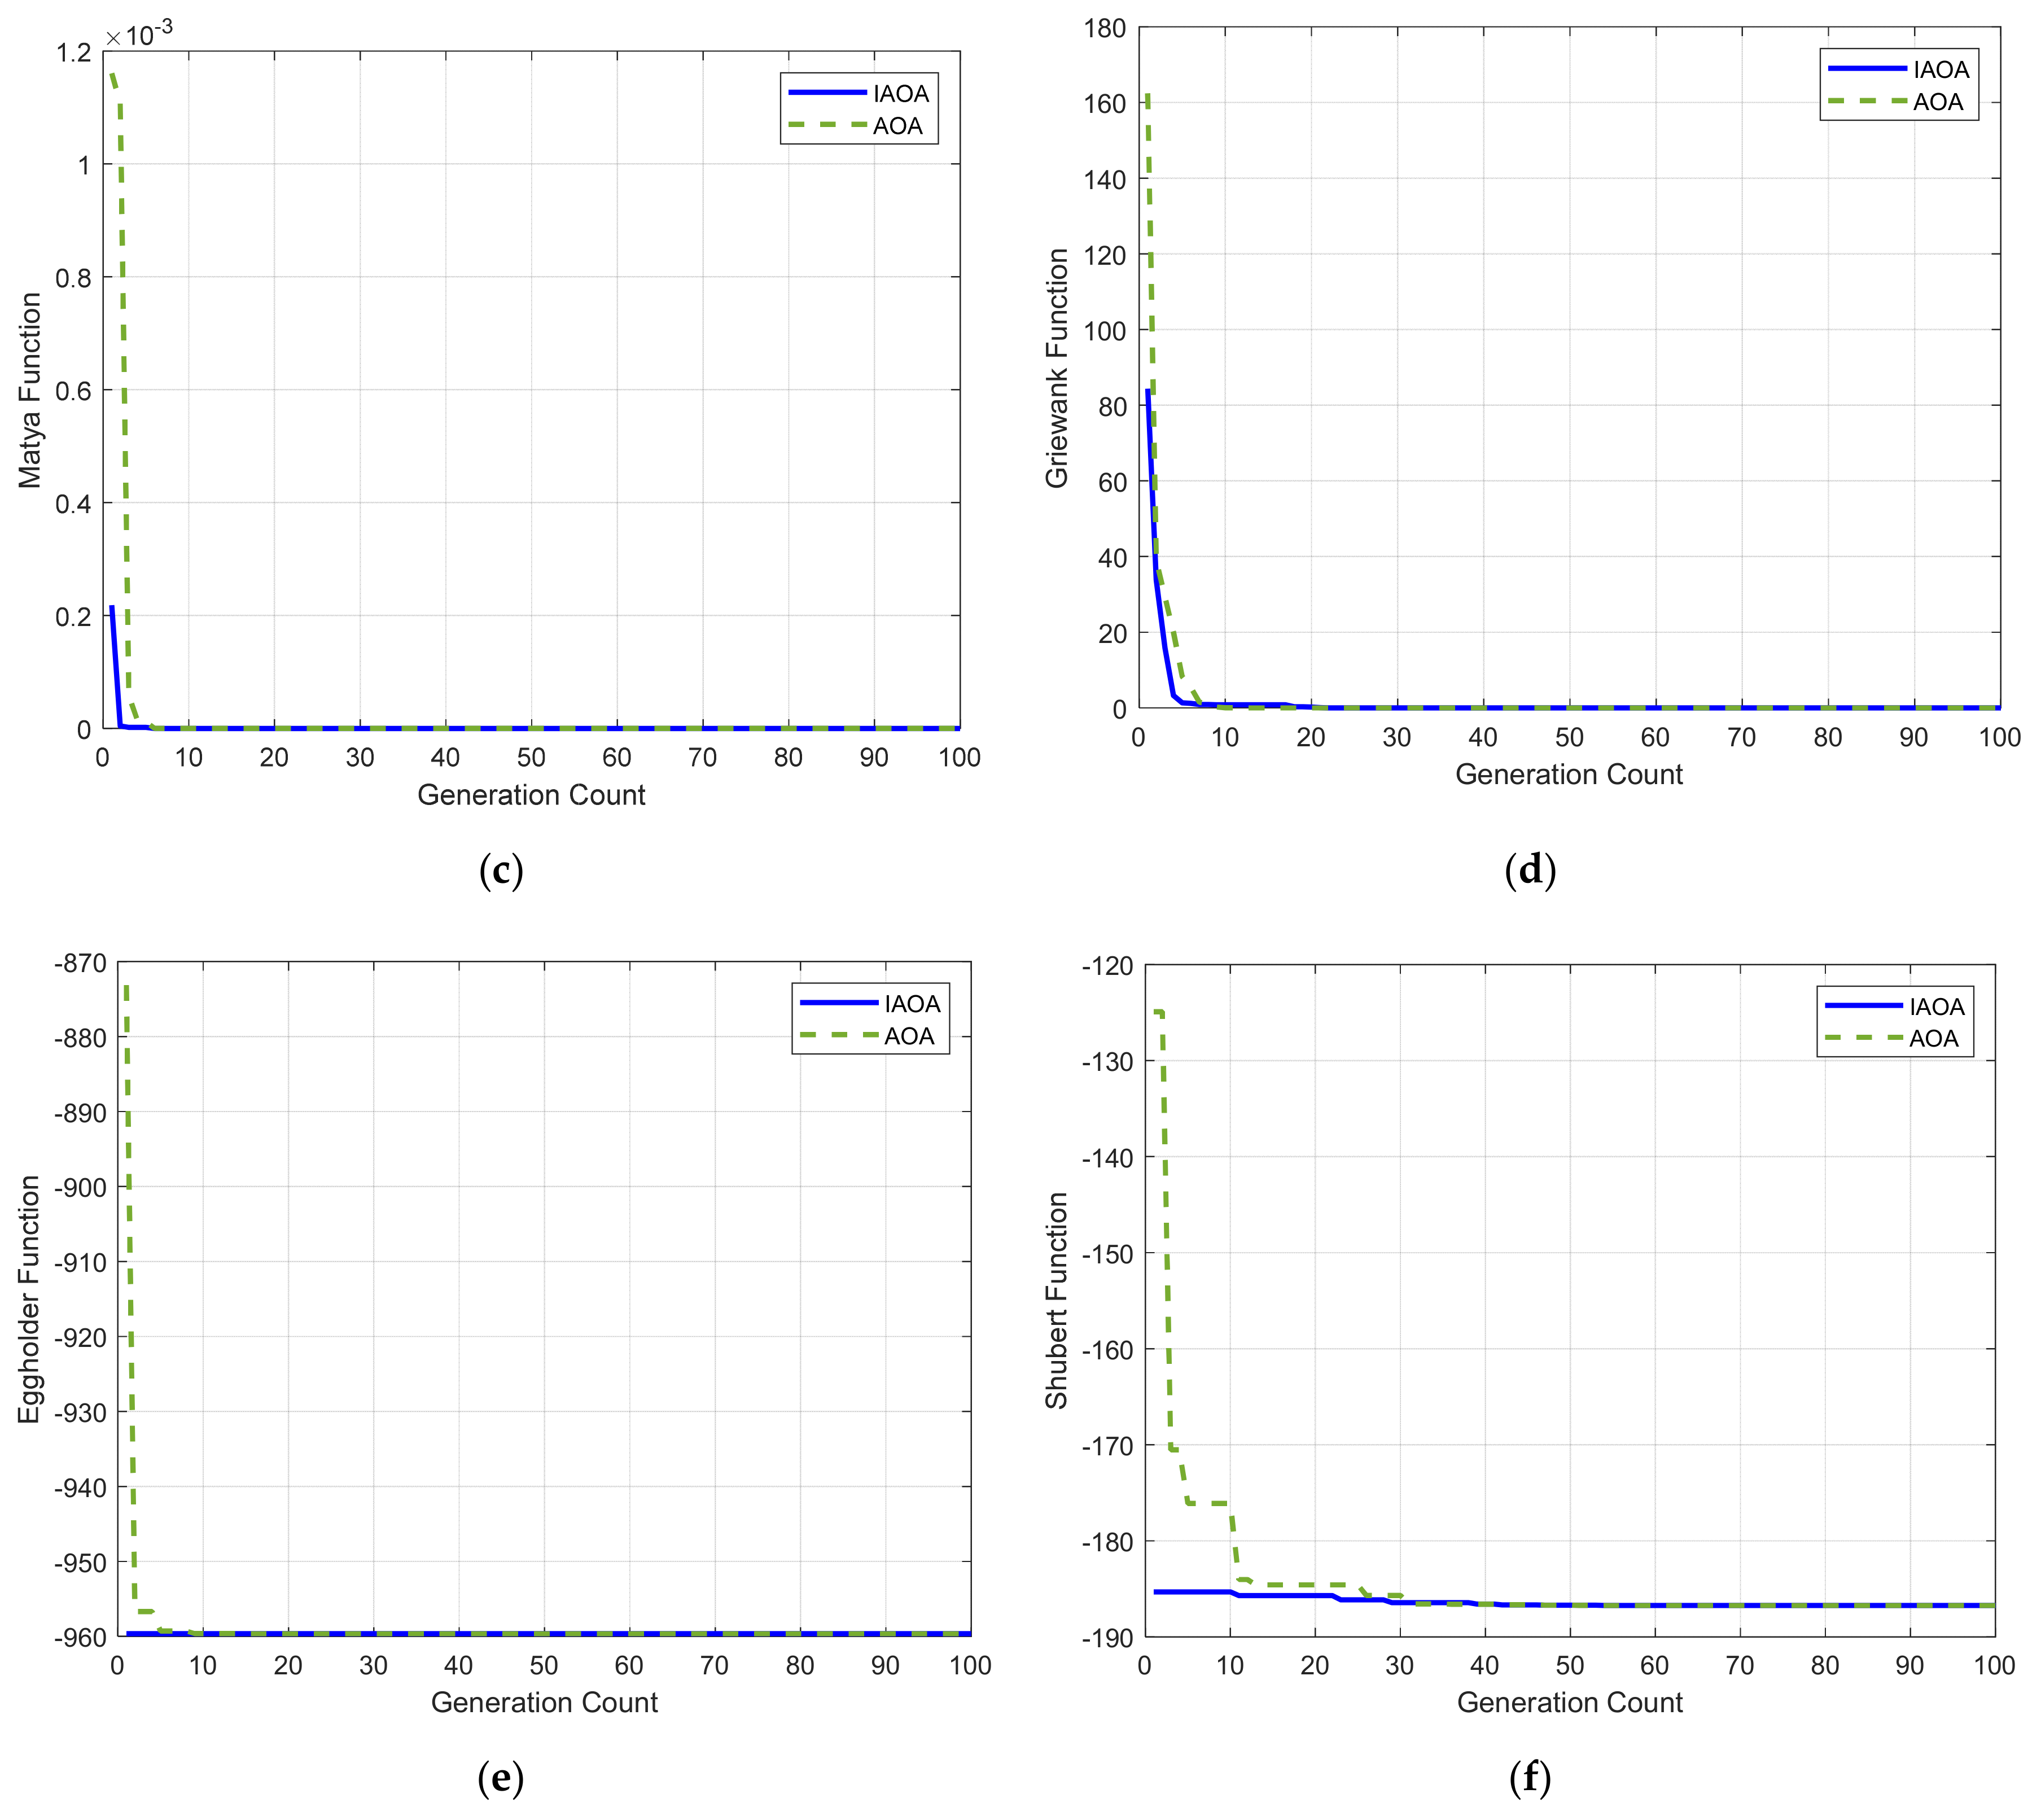
This article analyzes six benchmark functions, namely Beale, Powell, Matyas, Griewank, Eggholder, and Shubert, to show the superiority of the IAOA over the traditional AOA [50]. For each function, the expression, the range of search space, and the dimension are presented in Table 1. IAOA and AOA were coded in MATLAB and run 30 times by taking the maximum number of population and number of iterations as 100. The performance parameters, such as mean, maximum, minimum, and standard deviation, are presented in Table 2 to prove the supremacy of the IAOA technique. Table 2 shows that mean, maximum, minimum, and standard deviation values are less for IAOA than for AOA. The number of iterations needed for convergence to the global optimum value is lower for the IAOA technique, but due to the inclusion of an additional update phase, the computation time is slightly longer in the case of the IAOA algorithm. Figure 9 depicts the convergence plots of different benchmark functions.

5. Analysis of Algorithms

The performance of any metaheuristic algorithm mainly depends on the balance between two phases: exploitation and exploration. In the exploration phase, the algorithm finds new areas of solution time, and the exploitation phase extracts valuable information related to neighborhood regions of the search space [51]. Initially, in this work, PSO, FBI, and AOA techniques are used to determine the optimal values of the design parameters of the grid-tied PV system. However, some of the optimization algorithms fail to converge to global minima as they tend to become stuck in local minima. Algorithms are modified or hybridized and tested on many benchmark functions [52]. In this work, an IAOA optimization technique, where the PSO algorithm is implemented to find the values of some parameters of AOA optimally, is presented and tested on six popular benchmark functions. Finally, the IAOA technique is implemented to design the same parameters to obtain better results.

5.1. Forensic-Based Investigation (FBI) Algorithm

Chou and Nguyen proposed a metaheuristic optimization technique known as the forensic-based investigation algorithm (FBI) [53]. Location, suspected investigation, and stalking are the important ideas of the FBI. Opening the case, analysis of discoveries, examination of directions, actions, and trials are the five steps involved in a large-scale forensic investigation process [54]. In the beginning, the facts about the crime are gathered by the police team, and then this evidence helps the police team to begin the investigation. The inquiry team analyzes the crime position, probable suspects, target, and data about the crime. The team interprets the knowledge and correlates it with the impressions gained during the investigation to assess the probable suspects [55].
The steps involved in the FBI algorithm are as follows:
Step A1: Interpretation of findings:
X A ij = X A ij + rand   1 a 1 X A aj a 1  
X A ij =   X A ij +   rand   X A ij X A kj +   X A hj 2
Step A2: Direction of inquiry:
Prob   X A ij = p A i   p min / p max   p min  
X A ij = X min + 1 a 2 α X A bj
X A ij = X min +   X A dj +   rand X A kj   X A hj
Step B1: Action taken after receiving the reports:
X B ij =   rand 1 X B ij +   rand 2 X min   X B ij
Step B2: Extension of process of action:
X B ij =   X B rj +   rand 3 X B rj   X B ij +   rand 4 X min   X B rj
X B ij =   X B ij +   rand 3 X B ij   X B rj +   rand 4 X min   X B ij
where,
α = effectiveness coefficient, i.e., [−1, 1]; p max = lowest possibility value corresponding to the worst objective value;
j = 1, 2, …, D, and D is the number of dimensions; p min = highest possibility position corresponding to the best objective value;
a 1   and   a 2 are the numbers of individuals that affect the movement of X A ij assumed to be 2 and 3; p A i = possibility that the suspect is at location X A i ;
d, k, h, and i are four suspected locations; {d, k, h, i} ε {1, 2, …, NP}; d, k, and h are chosen randomly; and NP is the number of suspected locations; X min =   highest possibility position corresponding to the best solution;
X A ij = suspected location;rand is a random number in the range [−1, 1];
X A ij = new suspected location;rand1, rand2, rand3, and rand4 are random numbers in the range [0, 1].

5.2. Particle Swarm Optimization (PSO) Algorithm

Eberhart and Kennedy proposed a stochastic optimization algorithm based on swarming in 1995. The social behavior of animals such as birds, fishes, and insects is simulated in the PSO algorithm. Each member in the swarm changes its search pattern and confirms a cooperative pattern to find food under the gained experiences of other members and its own experience. PSO mainly operates on two basic ideas: one is based on artificial life, which provides the artificial structures with life features, and the other is the swarm mode, in which the swarm searches for the prey in a large section in the solution space of the optimized objective functions [56].
PSO involves the following steps:
1.
Initialization: Within the specific search range, the initial population and initial size velocity [NP × D] are generated. Here, ‘D’ is the dimension of the problem and ‘NP’ is the number of the population.
2.
Velocity update: Equation (19) is utilized to update the velocity in this step.
V new = w × v old + C 1 × rand 1 × p best x + C 2 × rand 2 × g best x
where ‘C1′ and ‘C2′ are acceleration constants generally taken as 2.05; pbest is the local best, i.e., the best solution so far achieved by a particle; gbest is the global best i.e., the best solution in the population; rand1 and rand2 are random numbers within the range [0, 1]; and ‘w’ is called the inertia weight, which is decreased from 0.9 to 0.4 with iterations.
3.
Position update: The newly generated velocity is combined with the initial population to update the initial population.
x new = x old + v new

5.3. Arithmetic Optimization Algorithm (AOA)

Abualigah et al. developed a new mathematical optimization technique known as the arithmetic optimization algorithm (AOA) based on addition, subtraction, multiplication, and division. Two essential phases for achieving global optimum solutions are the exploitation and exploration stages.
The exploitation phase achieves a nearer optimal solution as it provides low dispersion in search space utilizing the addition and subtraction operators.
In the exploration stage, the search space is explored in various regions and trends to achieve a better optimal solution using the multiplication and division operators [24].
The various stages in the AOA technique are as follows:
1.
Initialization: The initial population size [NP × D] is developed randomly within the predefined search space. Equation (21) evaluates the math optimizer acceleration (MOA).
MOA = min a + iter × max a min a iter max
where ‘iter’ and ‘itermax’ are the iteration count and the maximum number of iterations; ‘mina’ and ‘maxa’ are the minimum and maximum values of the acceleration function taken as 0.2 and 0.9, respectively.
2.
Update phase: Using Equation (22), the math optimizer probability (MOP) is generated.
MOP = 1 iter 1 α iter max 1 α
where the solution is updated by generating three random numbers, r1, r2, and r3, and ‘α’ is taken as 5.
if r1 < MOA
 if r2 > 0.5
x new = g best MOP + ε × U l L l × μ + L l
 else
x new = g best × MOP × U l L l × μ + L l
 end
 else
   if r3 < 0.5
x new = g best MOP × U l L l × μ + L l
   else
x new = g best + MOP × U l L l × μ + L l
end
where ‘ U l ’ and ‘ L l ’are the upper and lower limits of the variables to be designed and ‘ μ ’ is taken as 0.5.

5.4. Improved Arithmetic Optimization Algorithm (IAOA)

The traditional AOA technique attracts attention due to the exploration of search spaces. Conversely, in the non-optimal solutions, the traditional AOA technique suffers from premature stagnation. The poor exploration capability of the traditional AOA technique in the early stages causes the quick loss of population diversity. The exploration and exploitation stages are clearly shown in the previous section. In order to overcome the inadequacy of the traditional AOA, an improved variant of traditional AOA known as the improved arithmetic optimization algorithm (IAOA) is proposed and then employed for the optimization of the hysteresis band and duty cycle for the PV microgrid system. The robustness and efficiency of the improved arithmetic optimization algorithm technique are investigated through six standard benchmark functions.
In the suggested IAOA technique, two important parameters ‘ α and μ ’ of the AOA technique are optimally designed with the help of the PSO algorithm. The upper and lower limits of ‘ α and μ ’ are 5.0 and 0.5, respectively. Figure 10 depicts the intuitive and detailed process of the IAOA technique. The IAOA pseudocode is elaborated as follows:
  • Generate the initial population for design variables and the constants ‘ α and μ ’ of the AOA technique.
  • Evaluate the objective function and identify the best-performing solution (gbest).
  • Update the solution with the AOA technique using Equations (21)–(26).
  • Update the values of ‘ α and μ ’ with the PSO algorithm using Equations (19) and (20).
  • Repeat the previous two steps until the stopping criterion is met.
The switching frequency and current error are multiplied with suitable weighing factors and combined as a single objective function that is to be optimized with different optimization techniques. The objective function expression is given as follows:
  f = w 1 × e i + w 2 × f s
The average switching losses are calculated in [57] as shown in Equation (28):
P sl =   f s mean   E on +   E off
where fs is the switching frequency; ei is the current error; and w1 and w2 are the weighting factors taken as 0.85 and 0.15. respectively.

6. Results and Discussion

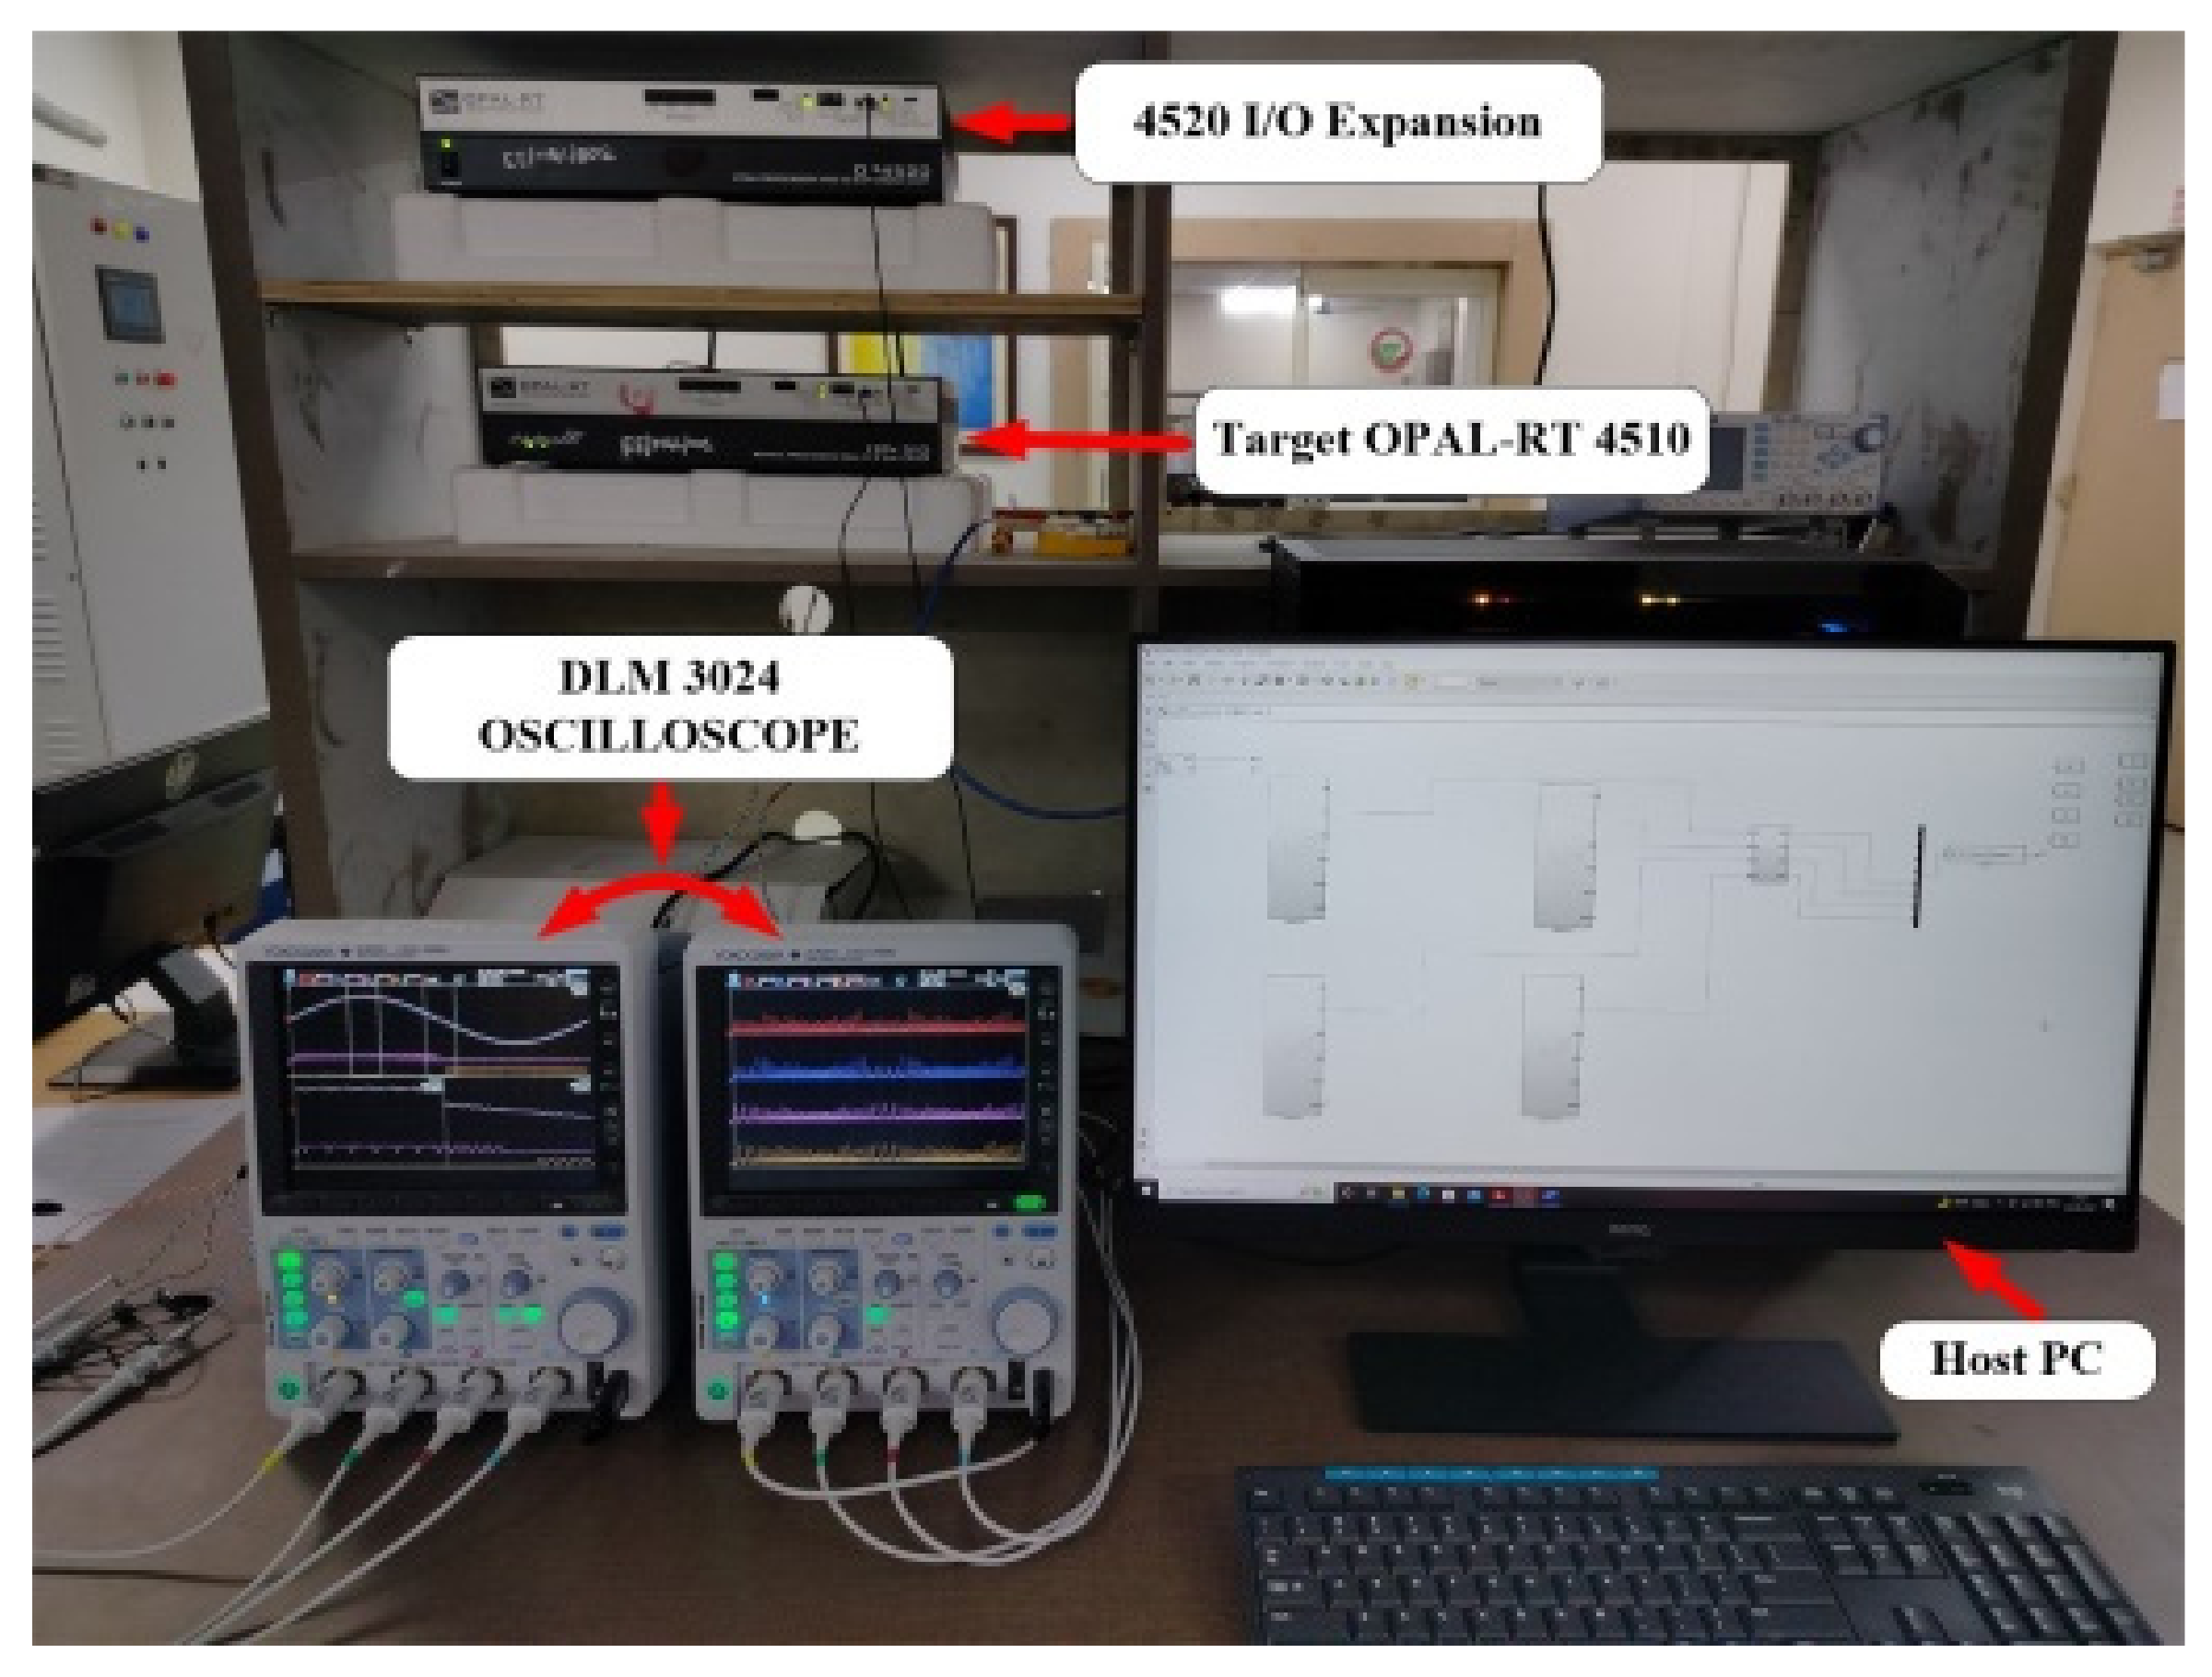
The lower and upper bands of the CHCC and OFHCC and the duty cycle of the converter were optimally tuned using the PSO, FBI, AOA, and IAOA techniques to improve the dynamic performance of the grid-tied PV system. Various parameters of the grid-tied system are presented in Table 3. Comparative performance analysis of different controllers was performed by taking various performance indicators such as average switching frequency (AvgSF), average switching losses (AvgSFL), maximum switching frequency (MaxSF), minimum switching frequency (MinSF), zero-crossing switching frequency (ZSF), and %THD. Optimal hysteresis bands, duty cycles, and various performance indicators are indicated in Table 4. The optimized values of hysteresis bands and duty cycles obtained from the MATLAB/Simulink environment were input into the OPAL-RT 4510 real-time simulator for experimental verification of power quality profiles. The obtained results are compared with different hysteresis band current controller techniques for rooftop microgrid systems at a constant hysteresis band of 0.5, as reported in [58].
The microgrid-connected dynamic simulation model was developed using real-time simulation OPAL-RT 4510 with Xilinx Kintex-7 FPGA software. The real-time simulation was realized in RT-LAB using the Simulink models on multi-core CPU computers. RT-LAB builds the parallel tasks from the original models, and each task is assigned to one CPU to enhance the overall simulation time. In addition, the RT-LAB toolbox and power system solver were used to improve the accuracy and simulation time of the grid-connected system. A snapshot of the proposed schemes, along with the other techniques in OPAL-RT 4510, is shown in Figure 11.
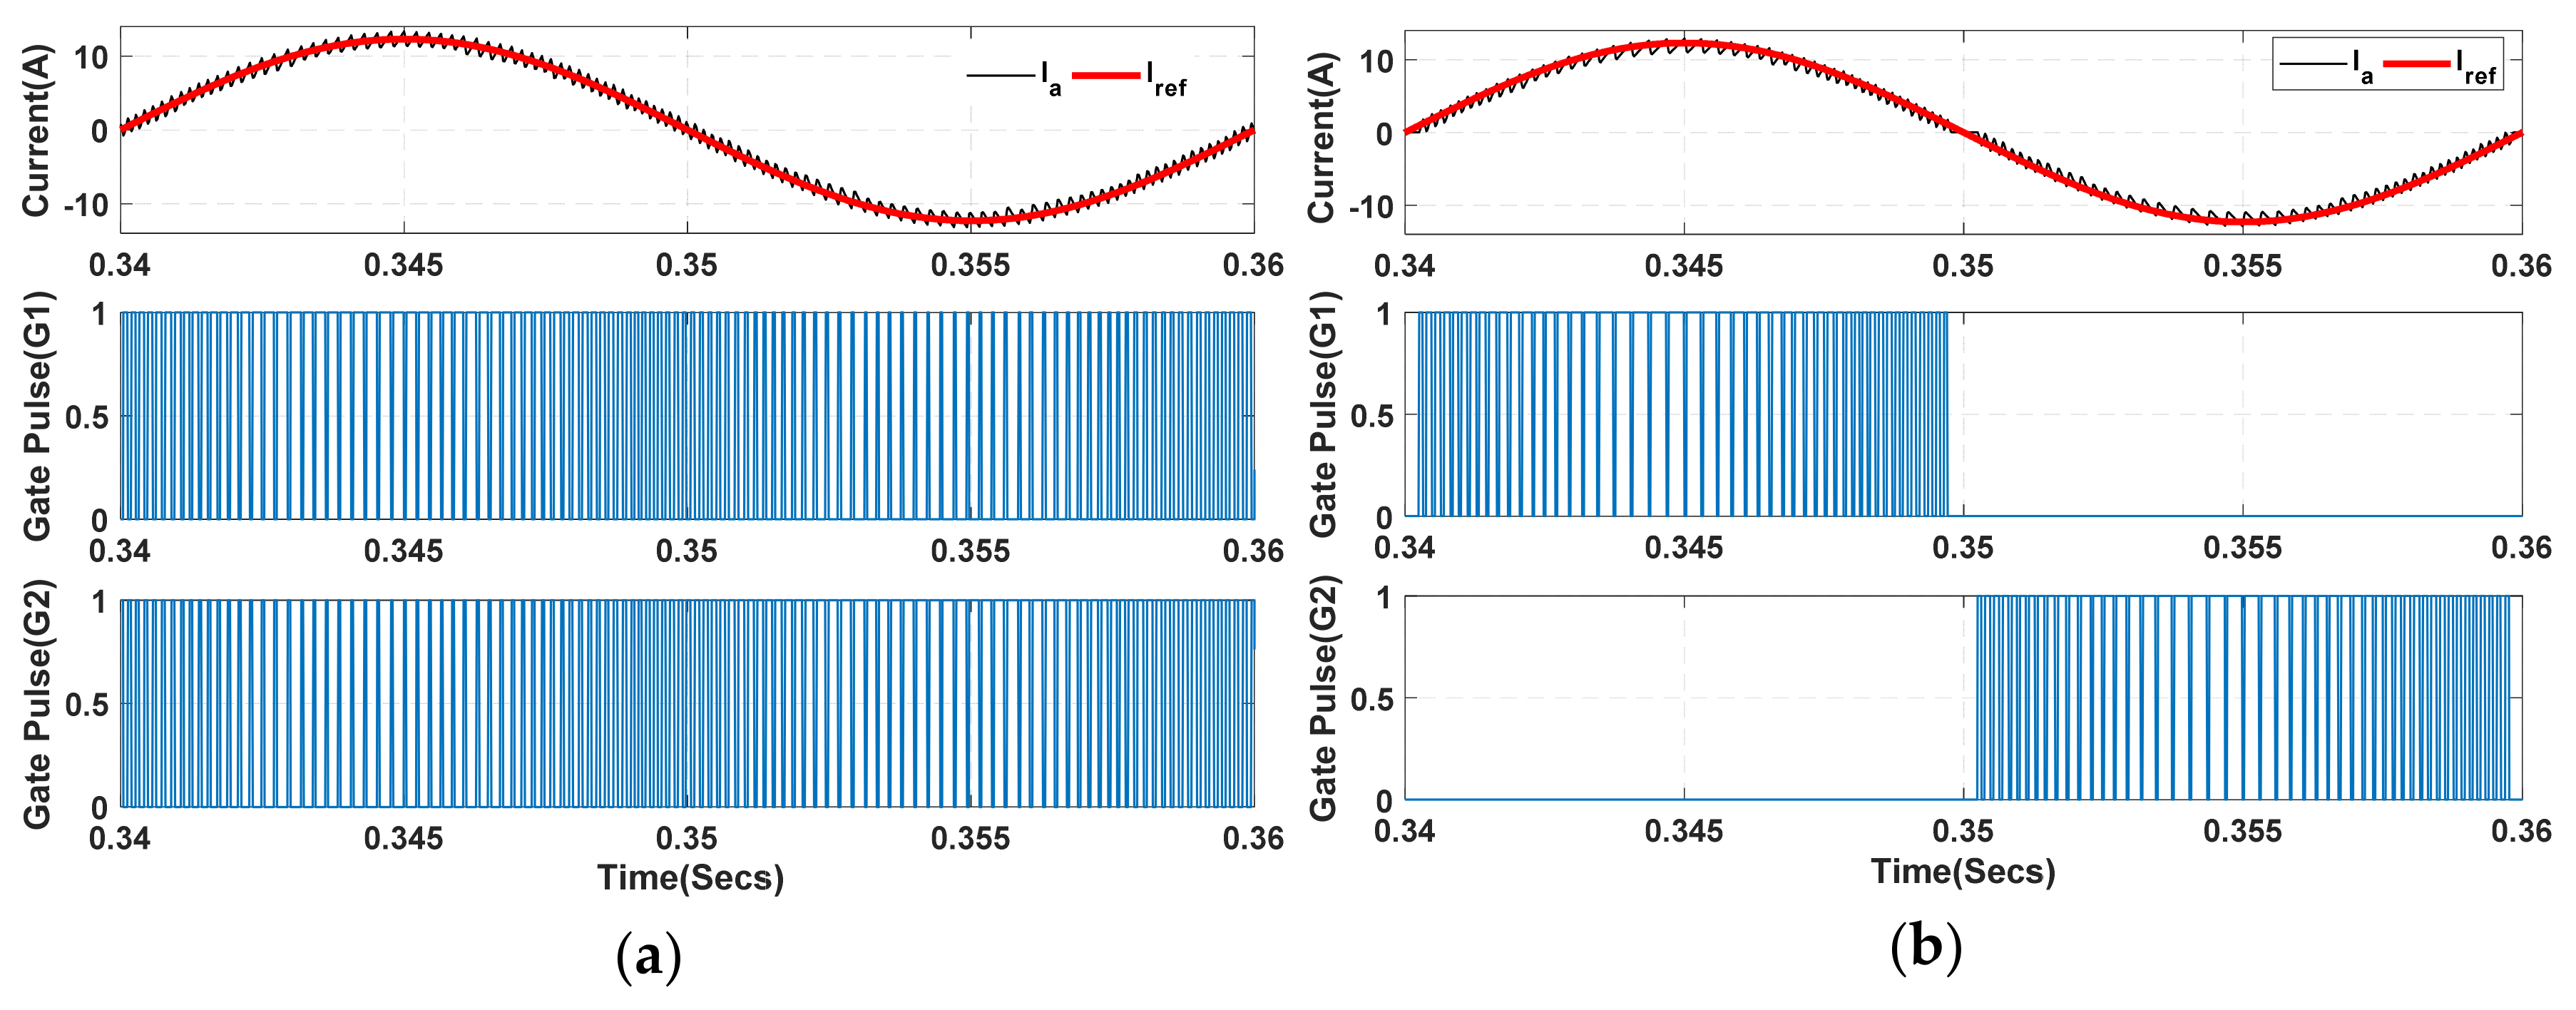
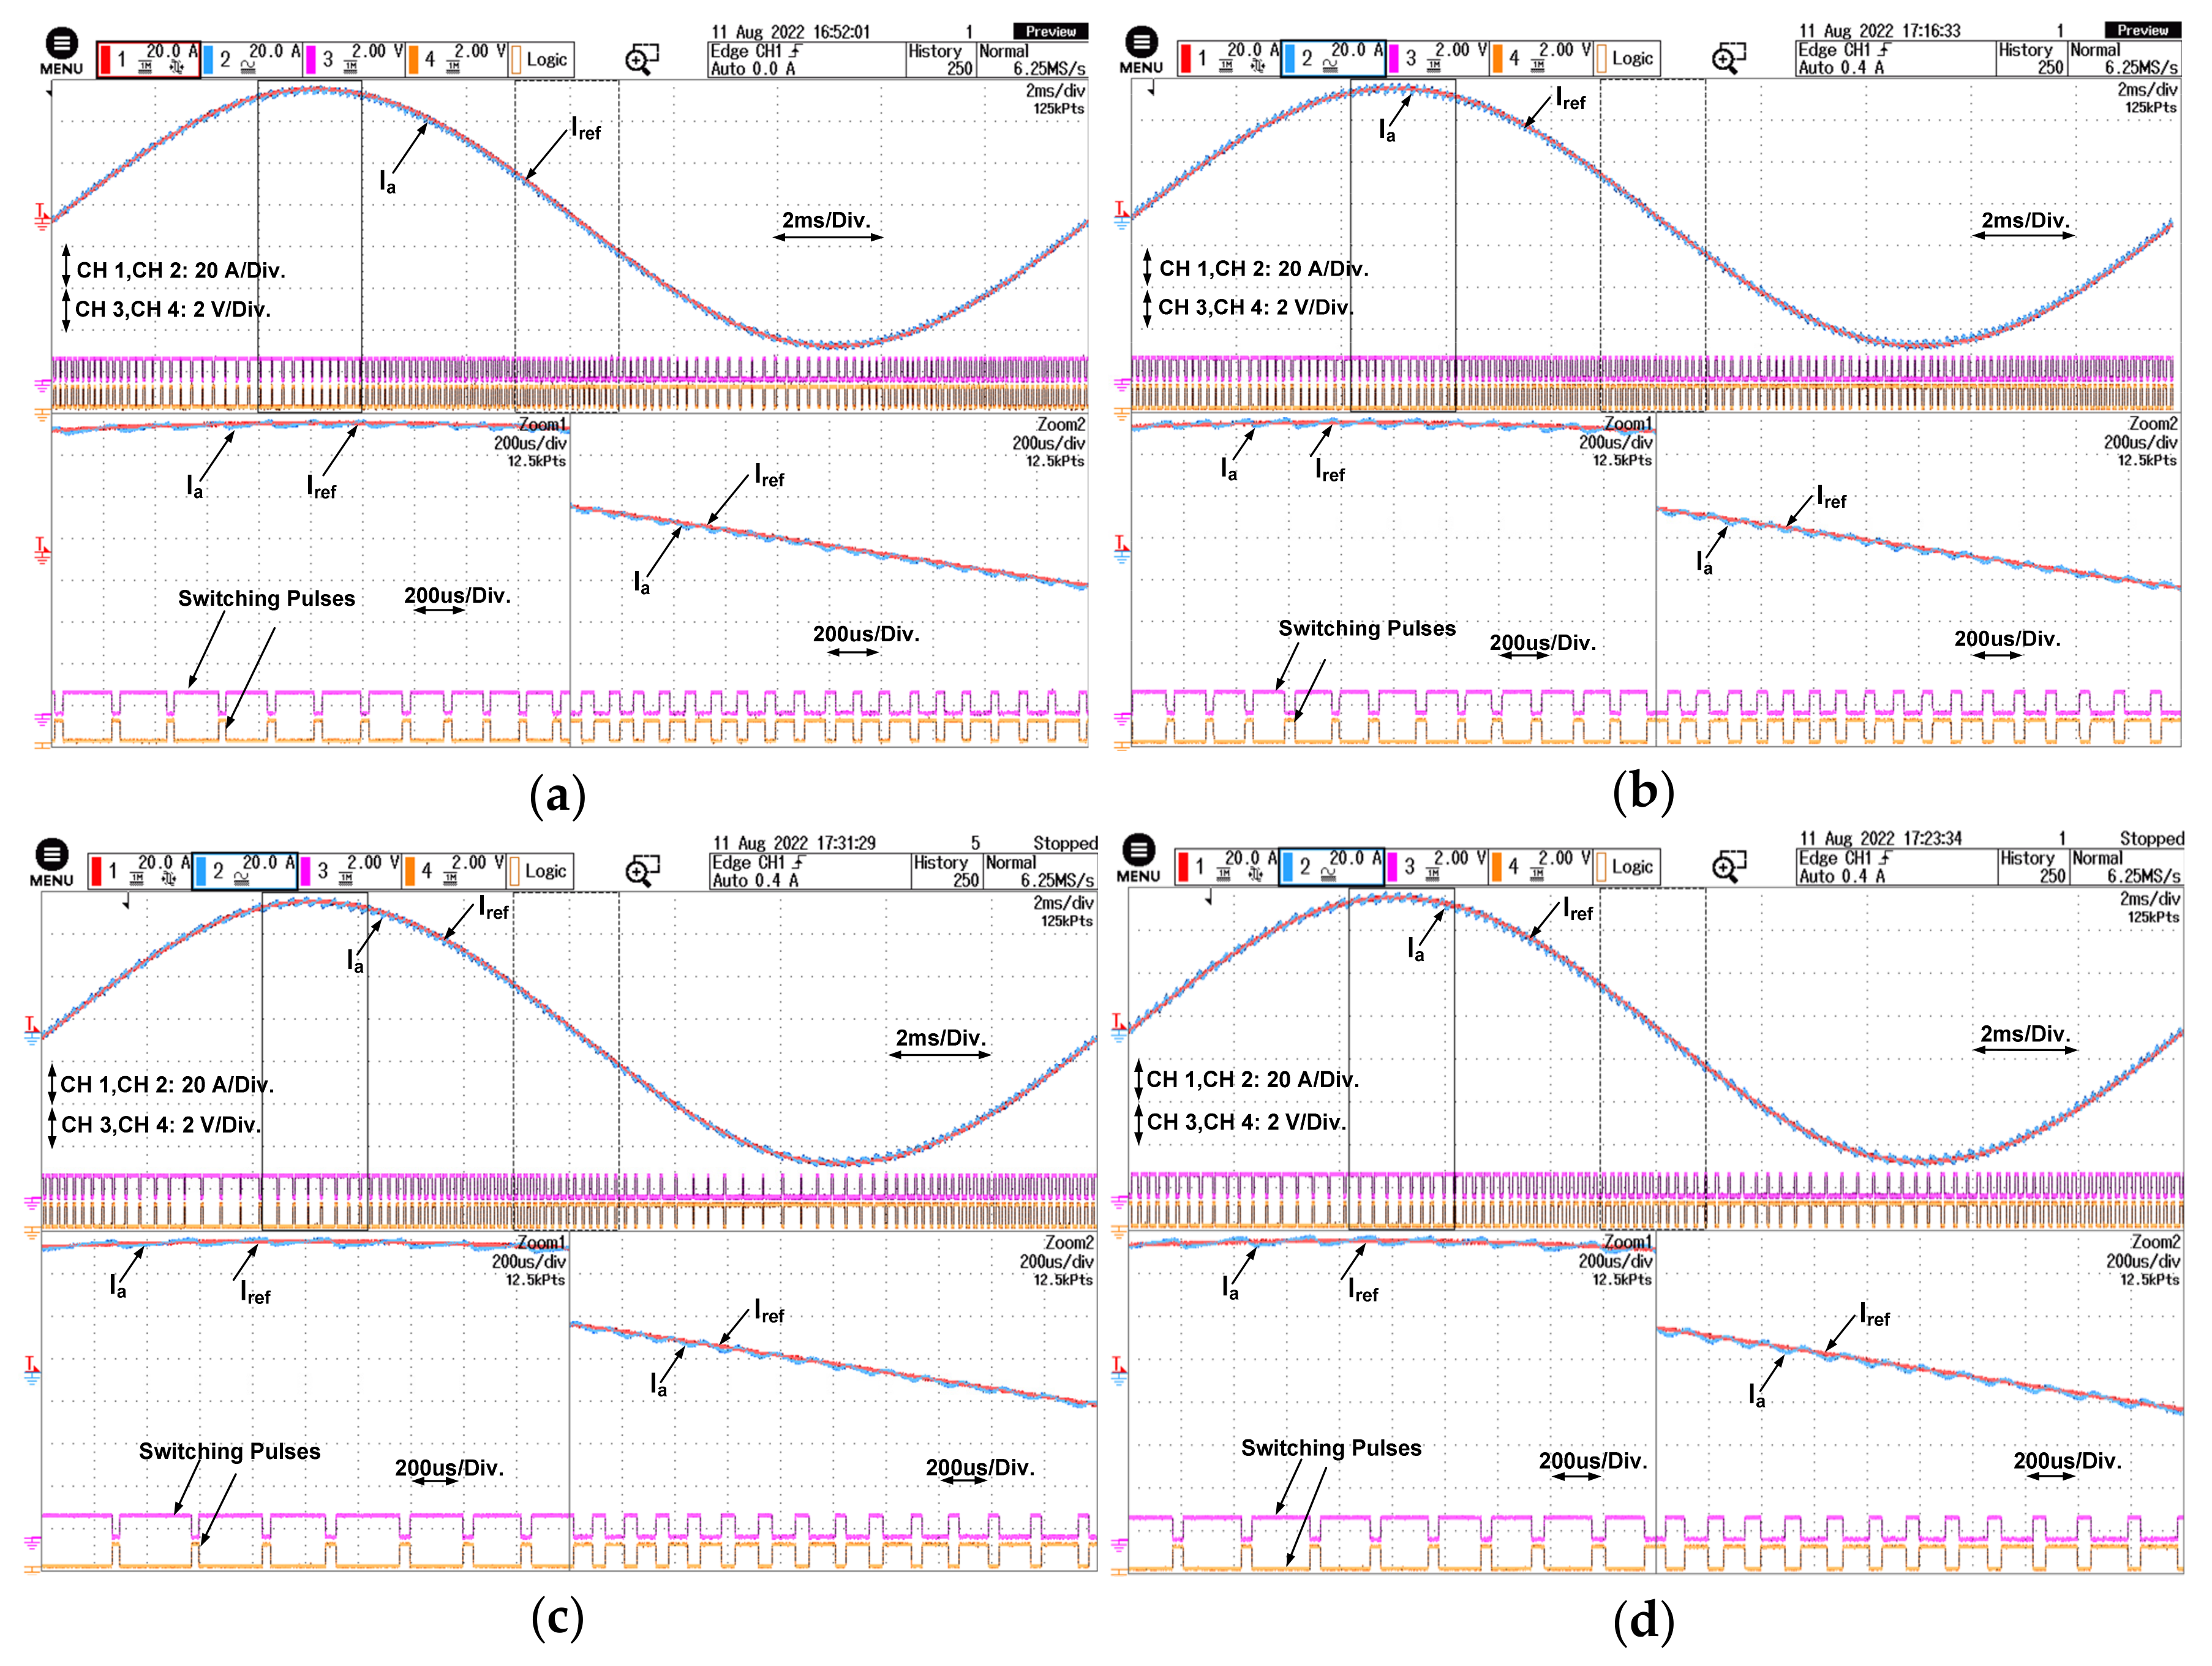
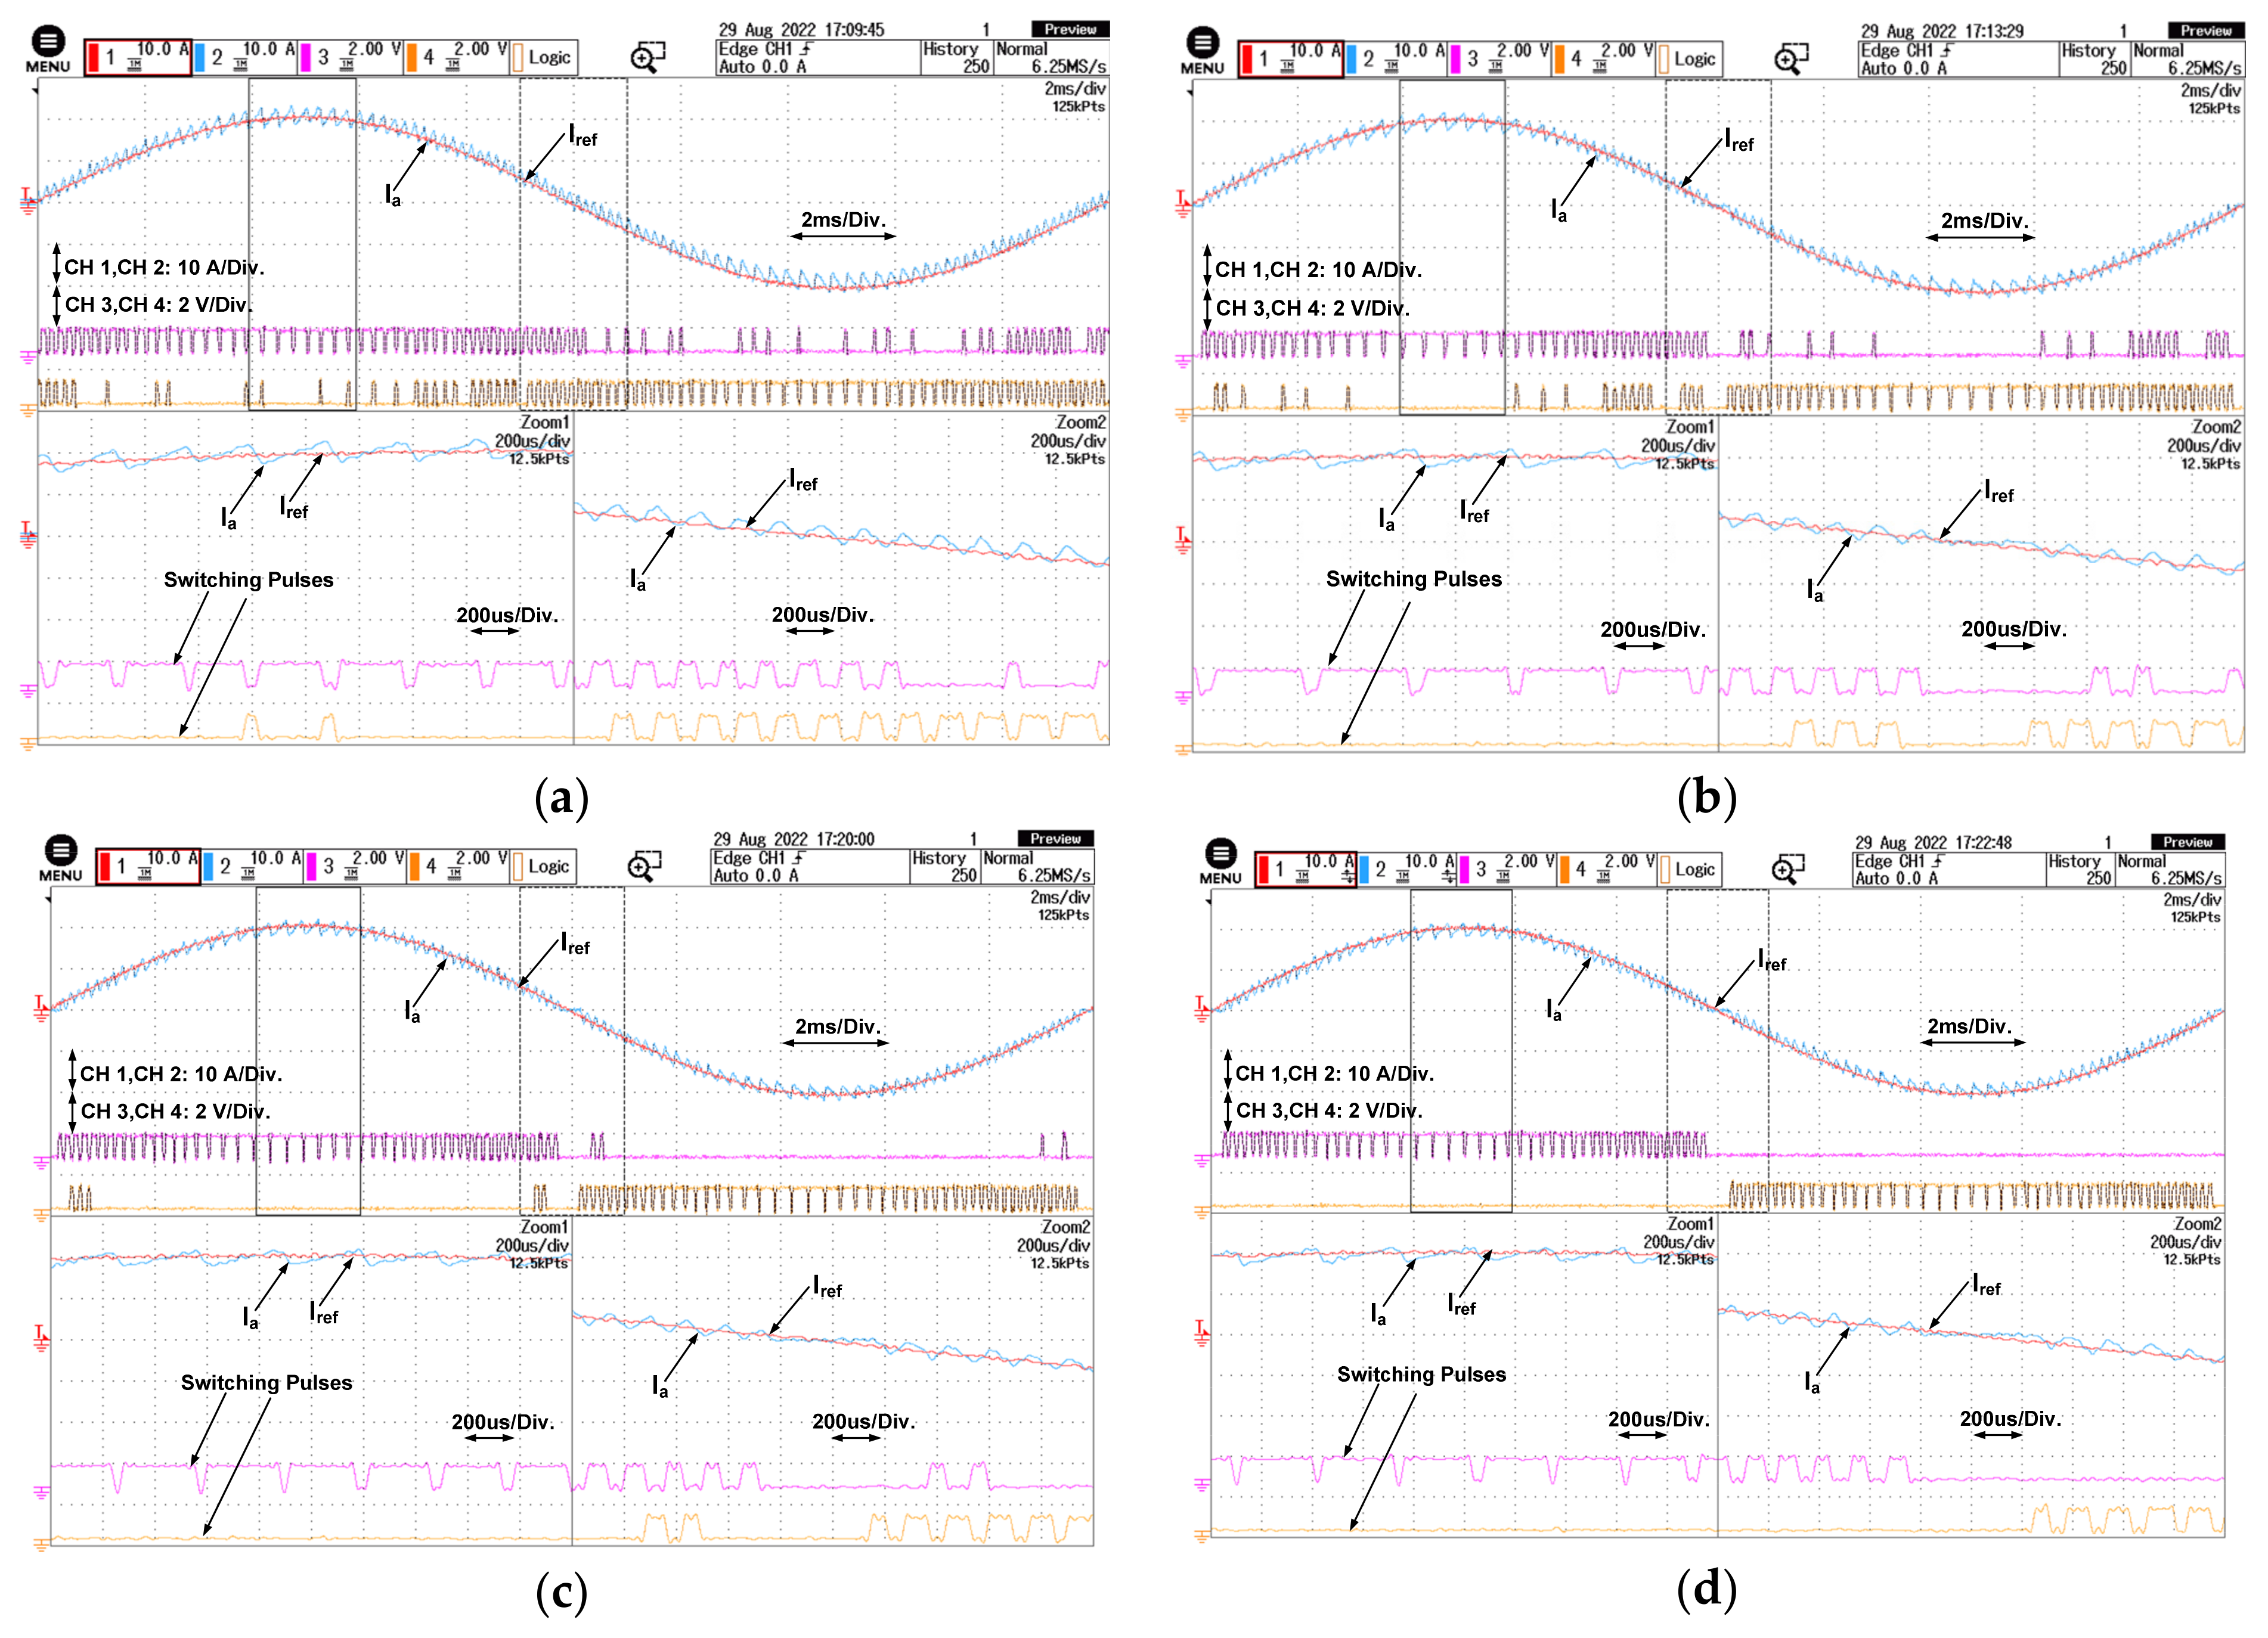
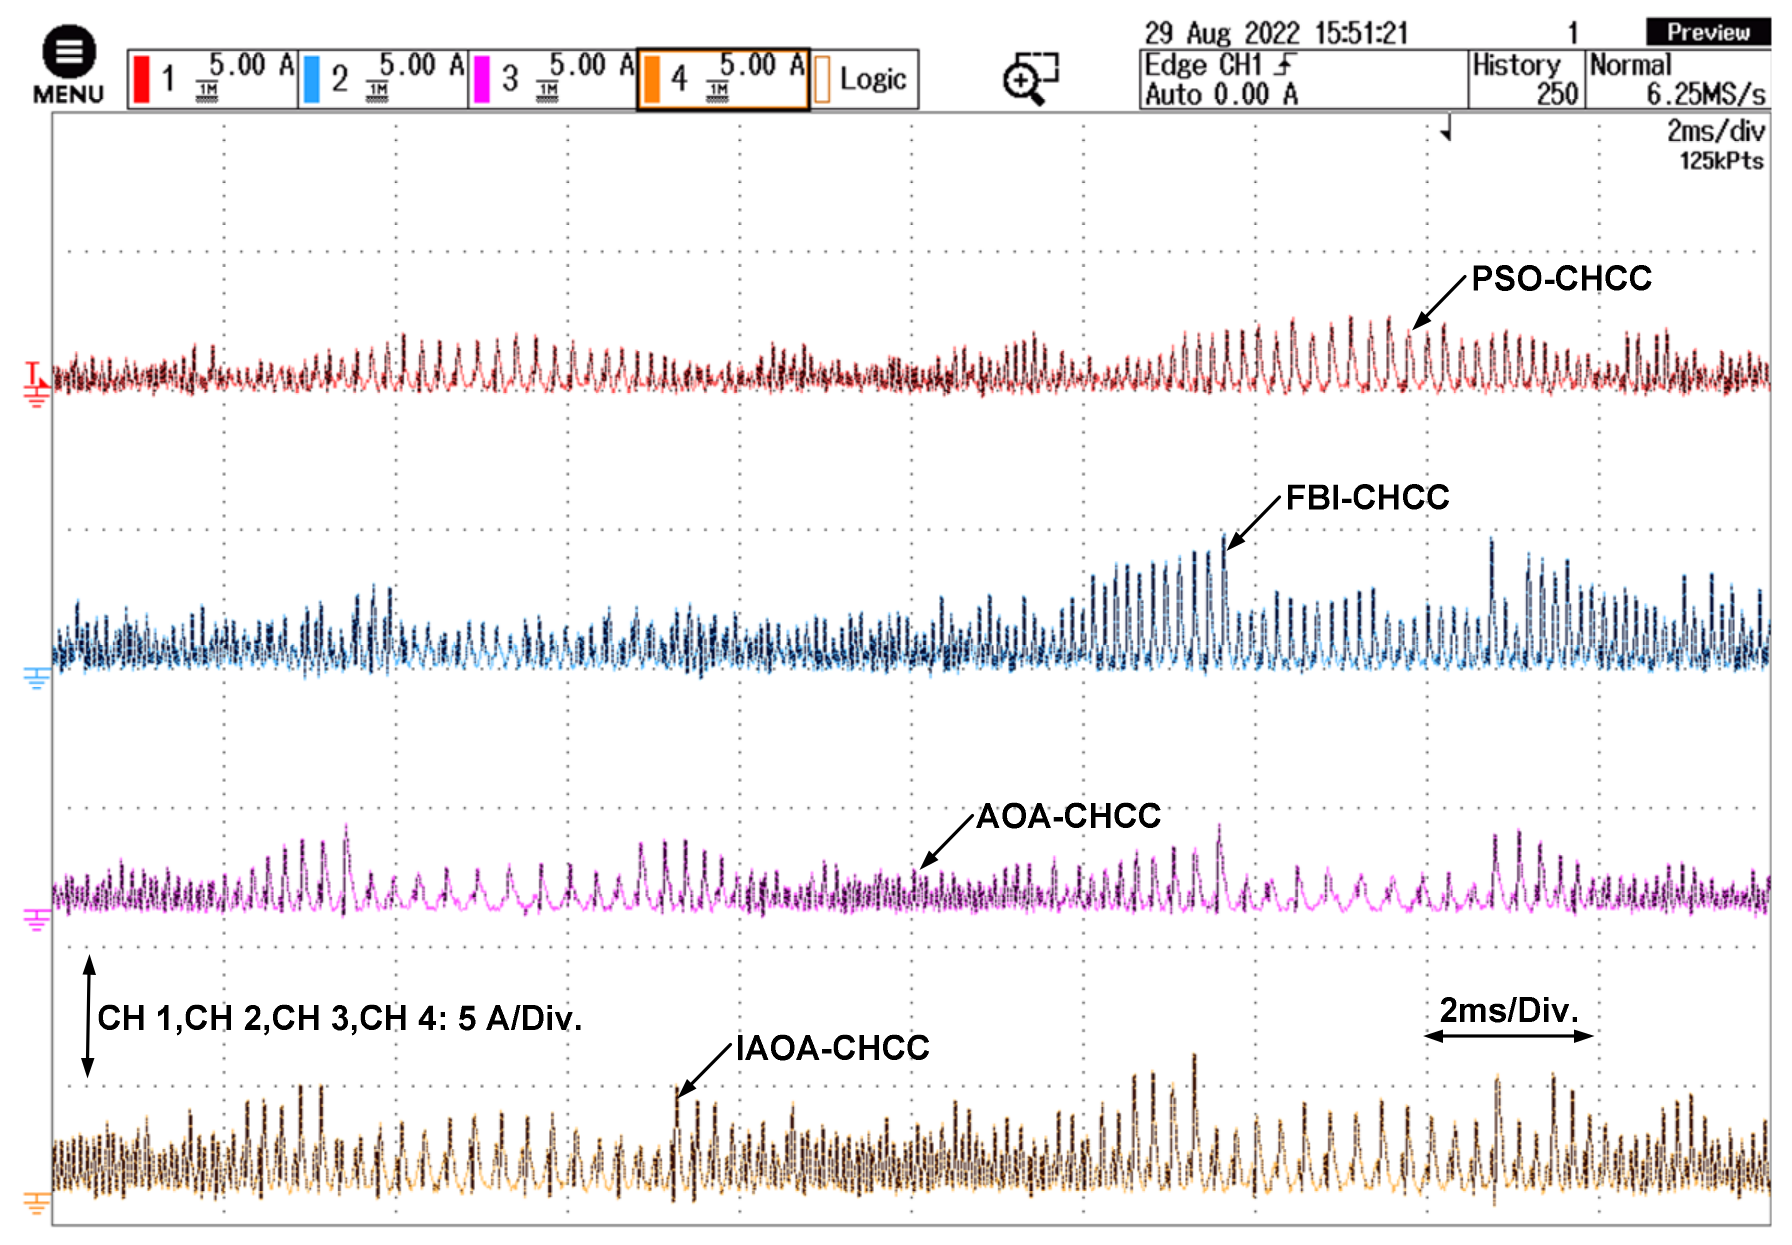
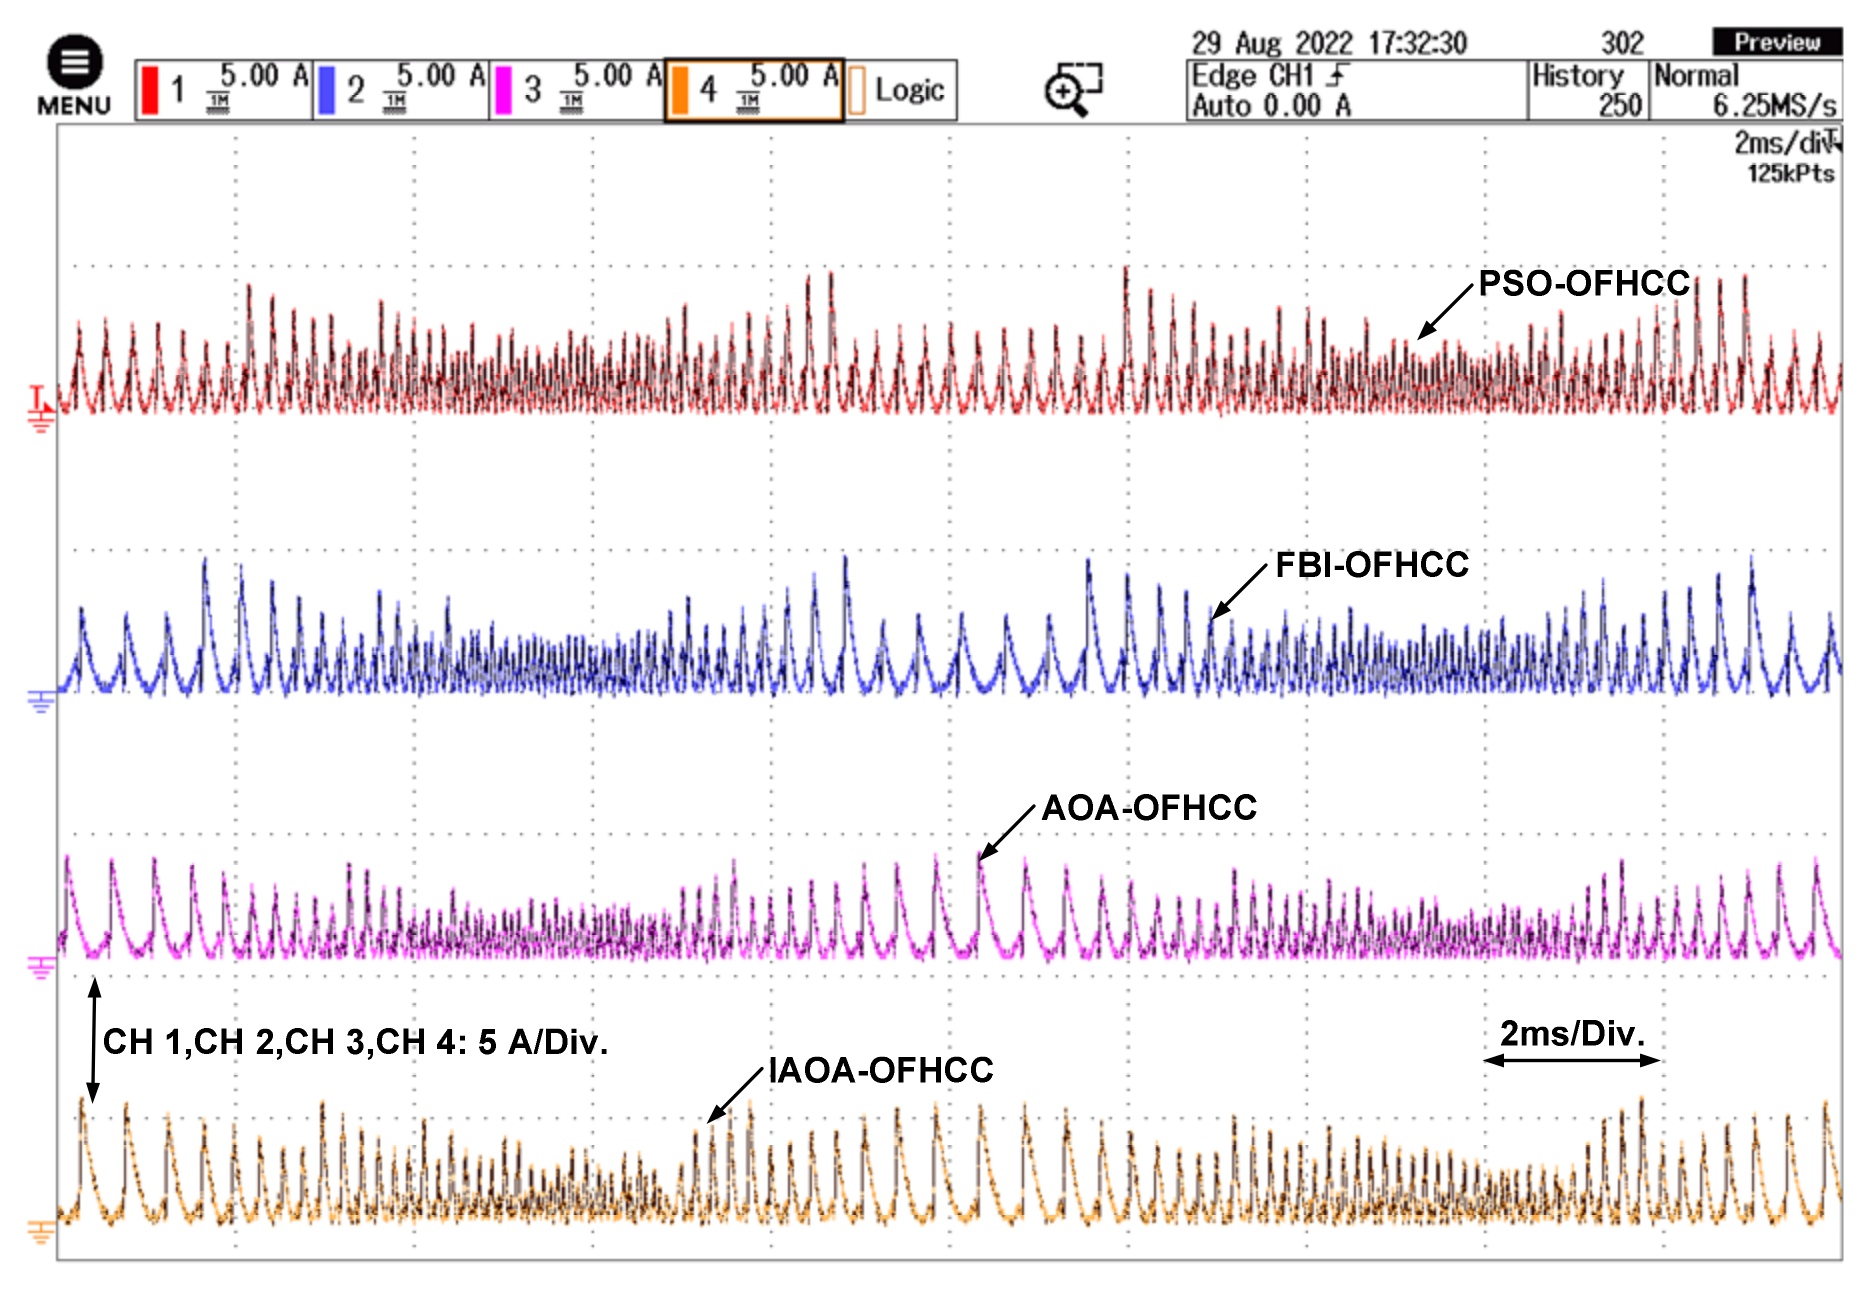
The reference current, actual current, and switching pulse simulations for one cycle of IAOA-CHCC and IAOA-OFHCC are shown in Figure 12. The experimental results for corresponding profiles are shown in Figure 13 and Figure 14 for PSO-CHCC, FBI-CHCC, AOA-CHCC, IAOA-CHCC, PSO-OFHCC, FBI-OFHCC, AOA-OFHCC, and IAOA-OFHCC. The switching frequencies are calculated from the inverter switching pulses. The proposed IAOA-OFHCC technique due to the optimum utilization of inverter switches has reduced switching frequency and the lowest switching losses, resulting in high efficiency compared to other techniques.
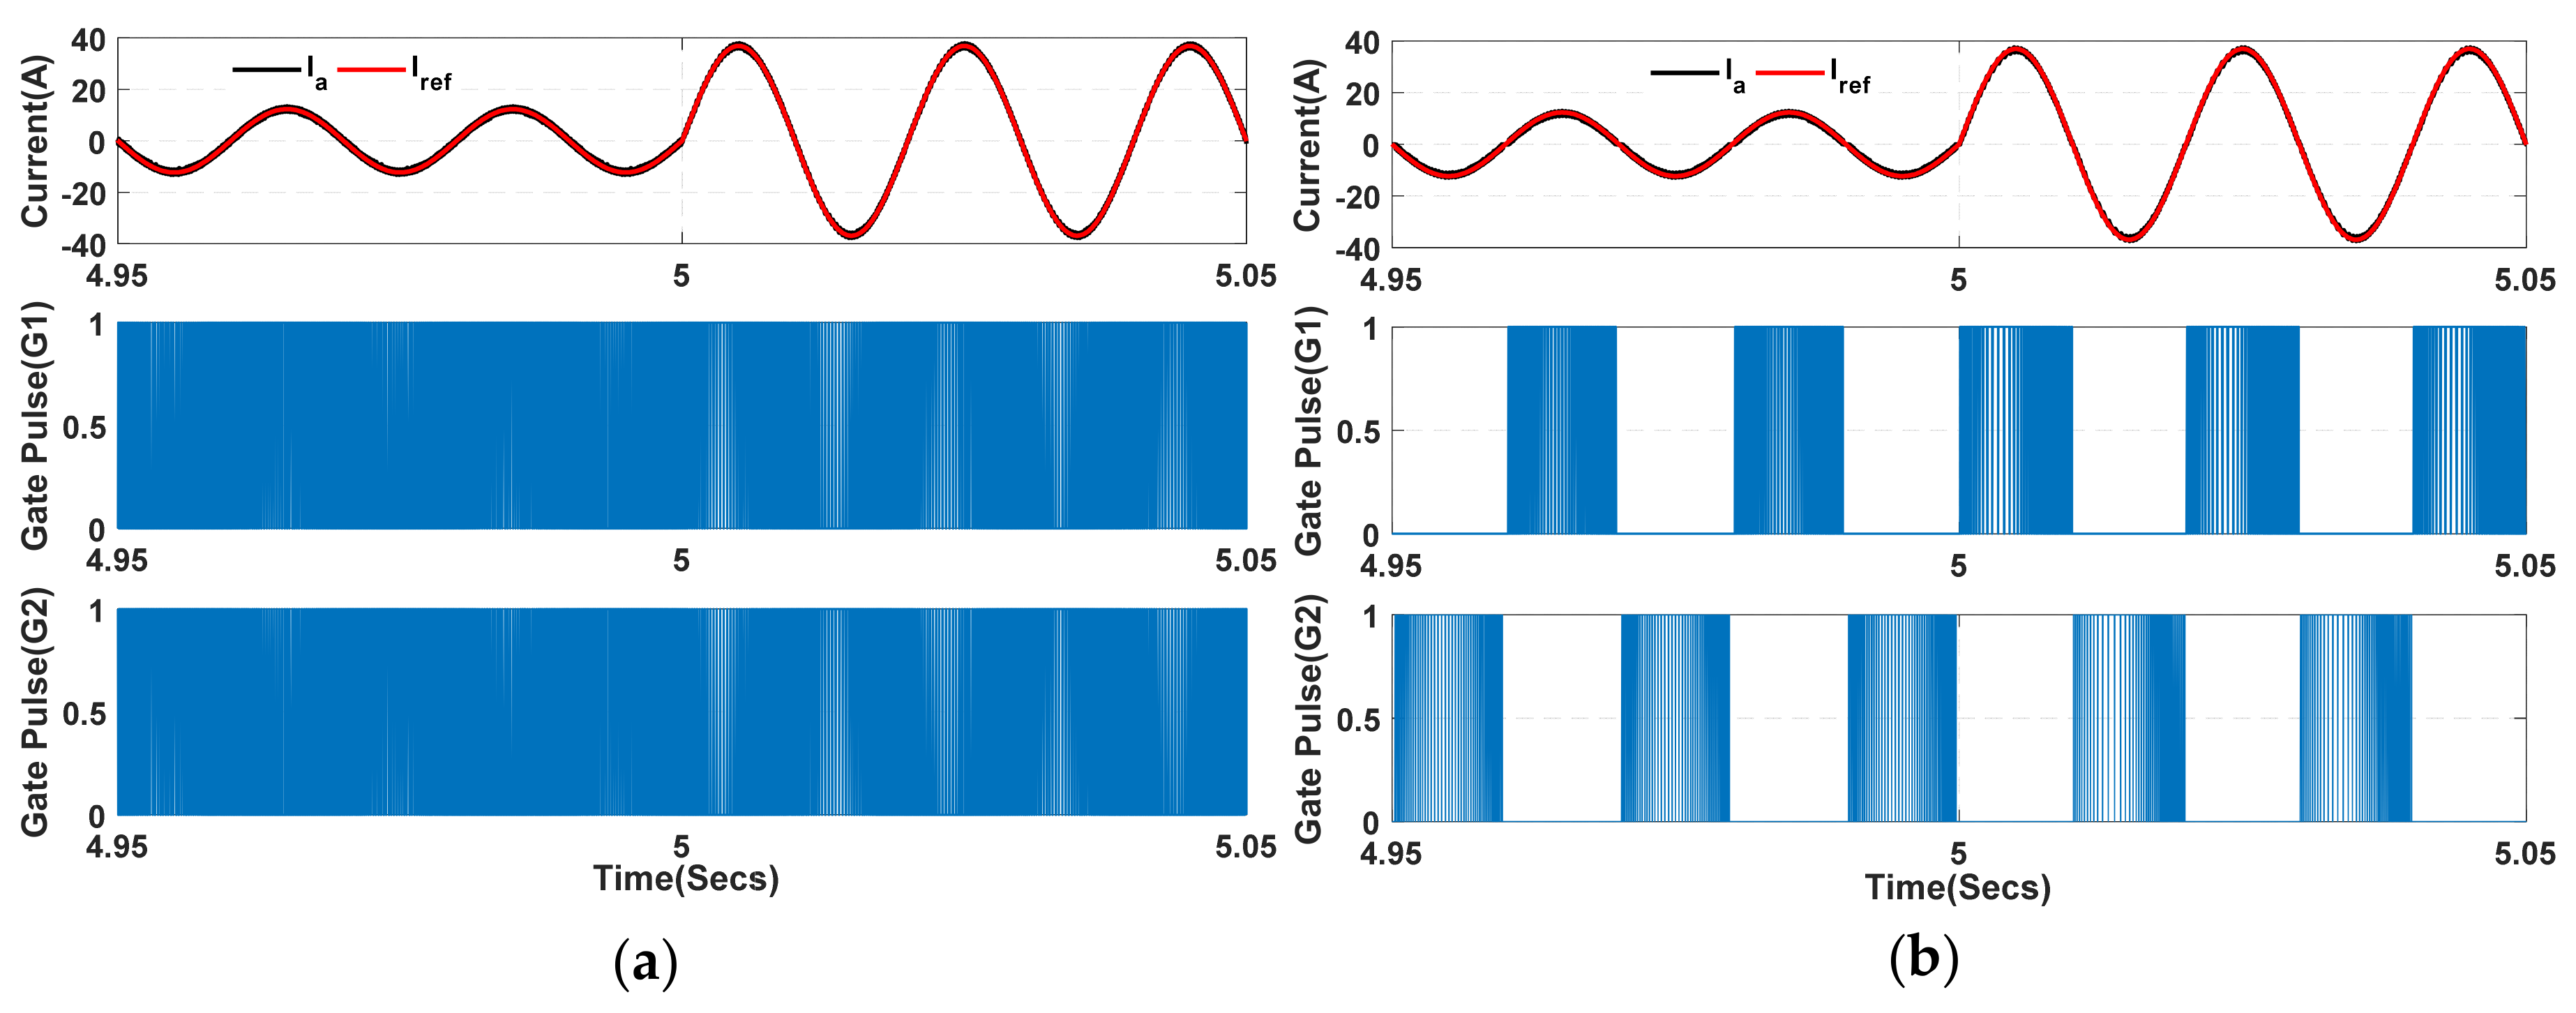
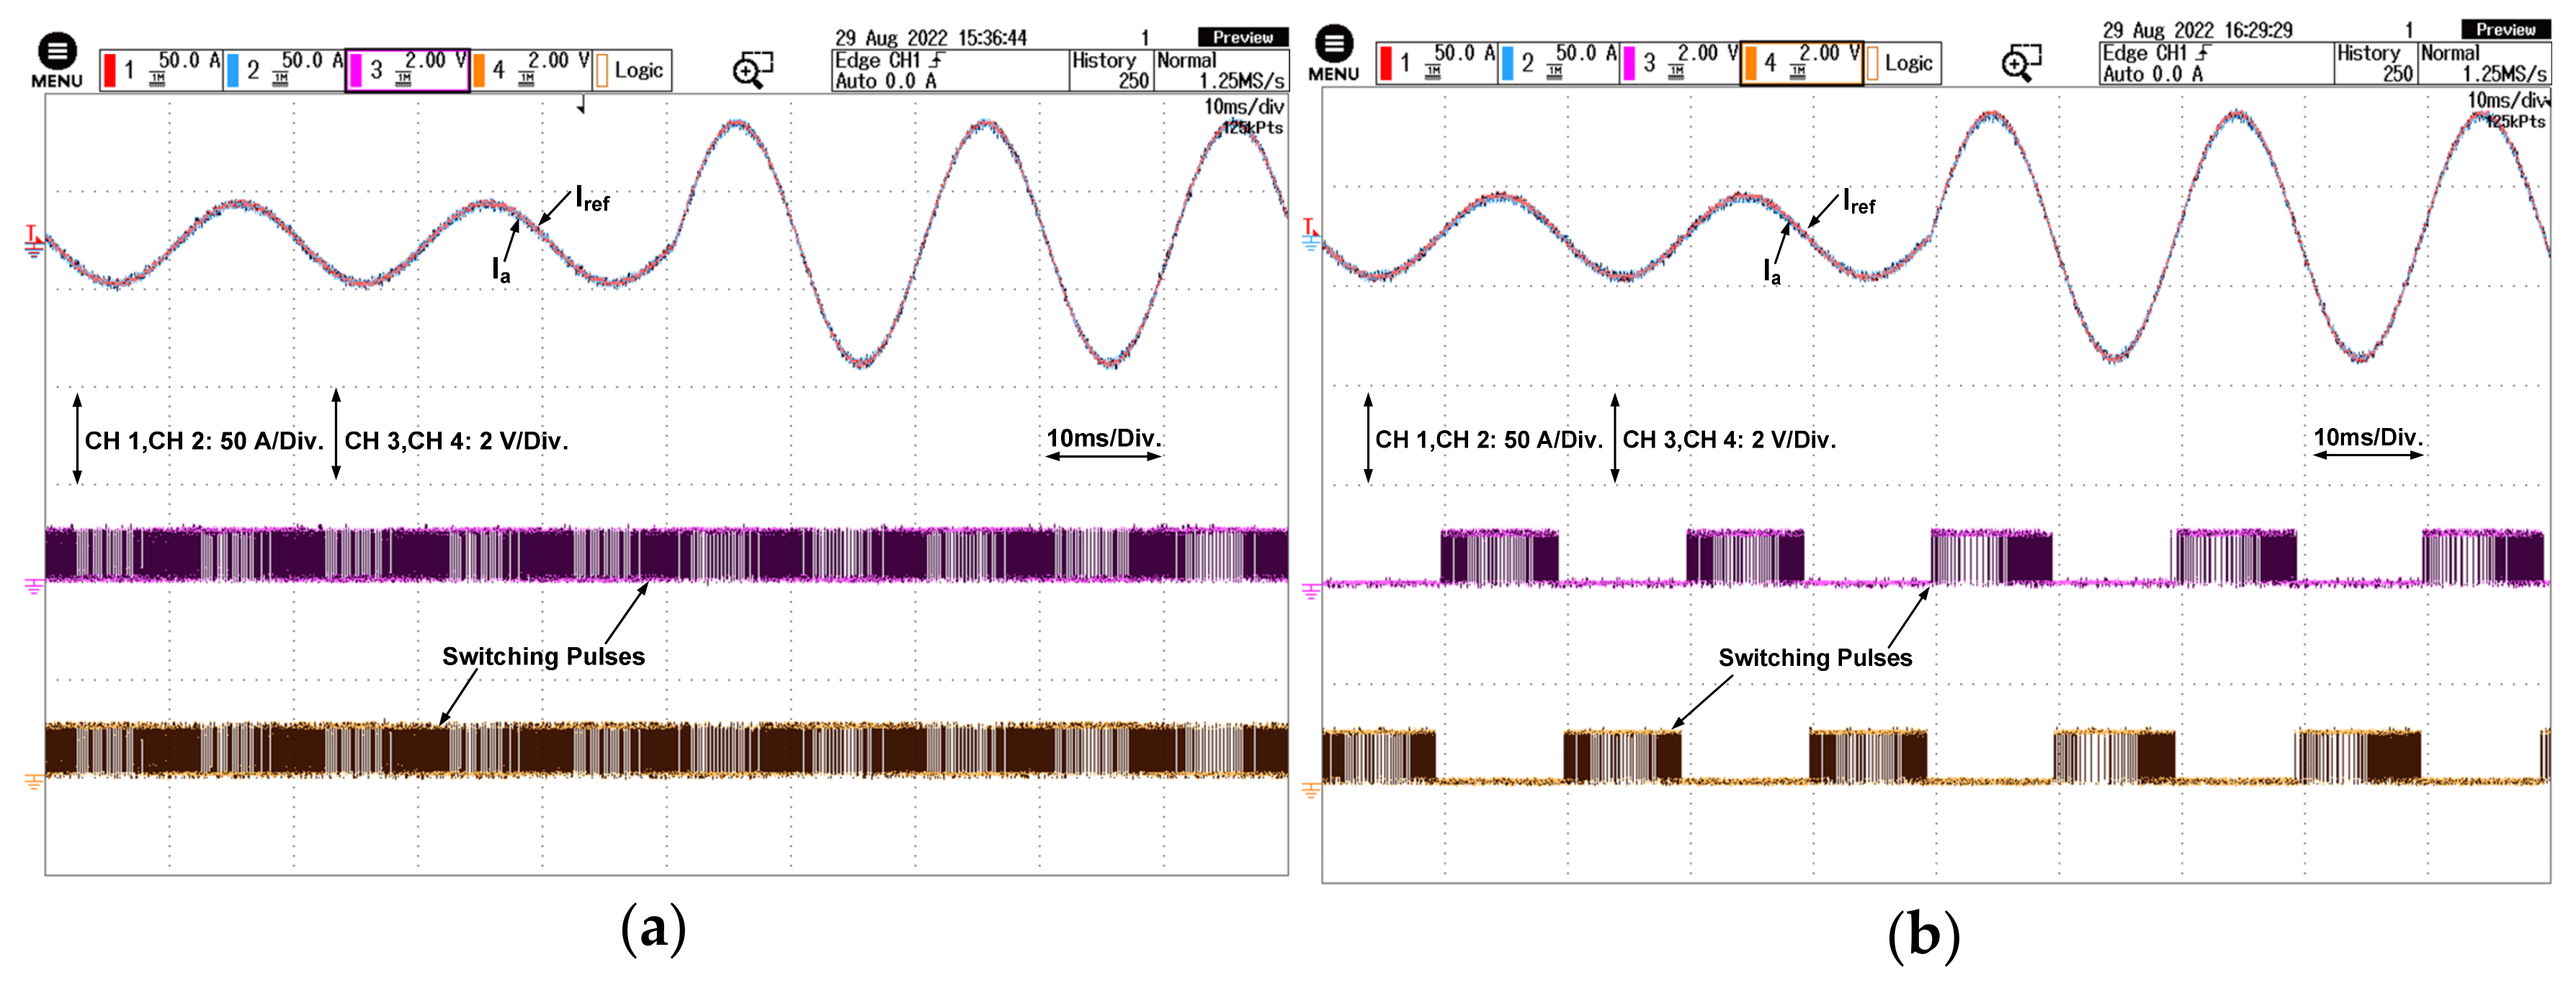
The simulation and experimental results for the dynamic state performance of Ia and Iref under load change from 1000 W to 2000 W at 4.95 s to 5.05 s are shown in Figure 15 and Figure 16, respectively. The shape of the current waveform is not distorted during the transient and maintains a sinusoidal shape, indicating that both the actual current and reference current are in-phase. The proposed algorithm with controllers has a fast dynamic response with variation in load. In addition, the proposed scheme has the lowest average switching frequency, which makes the IGBT device operate under a safe operating range.
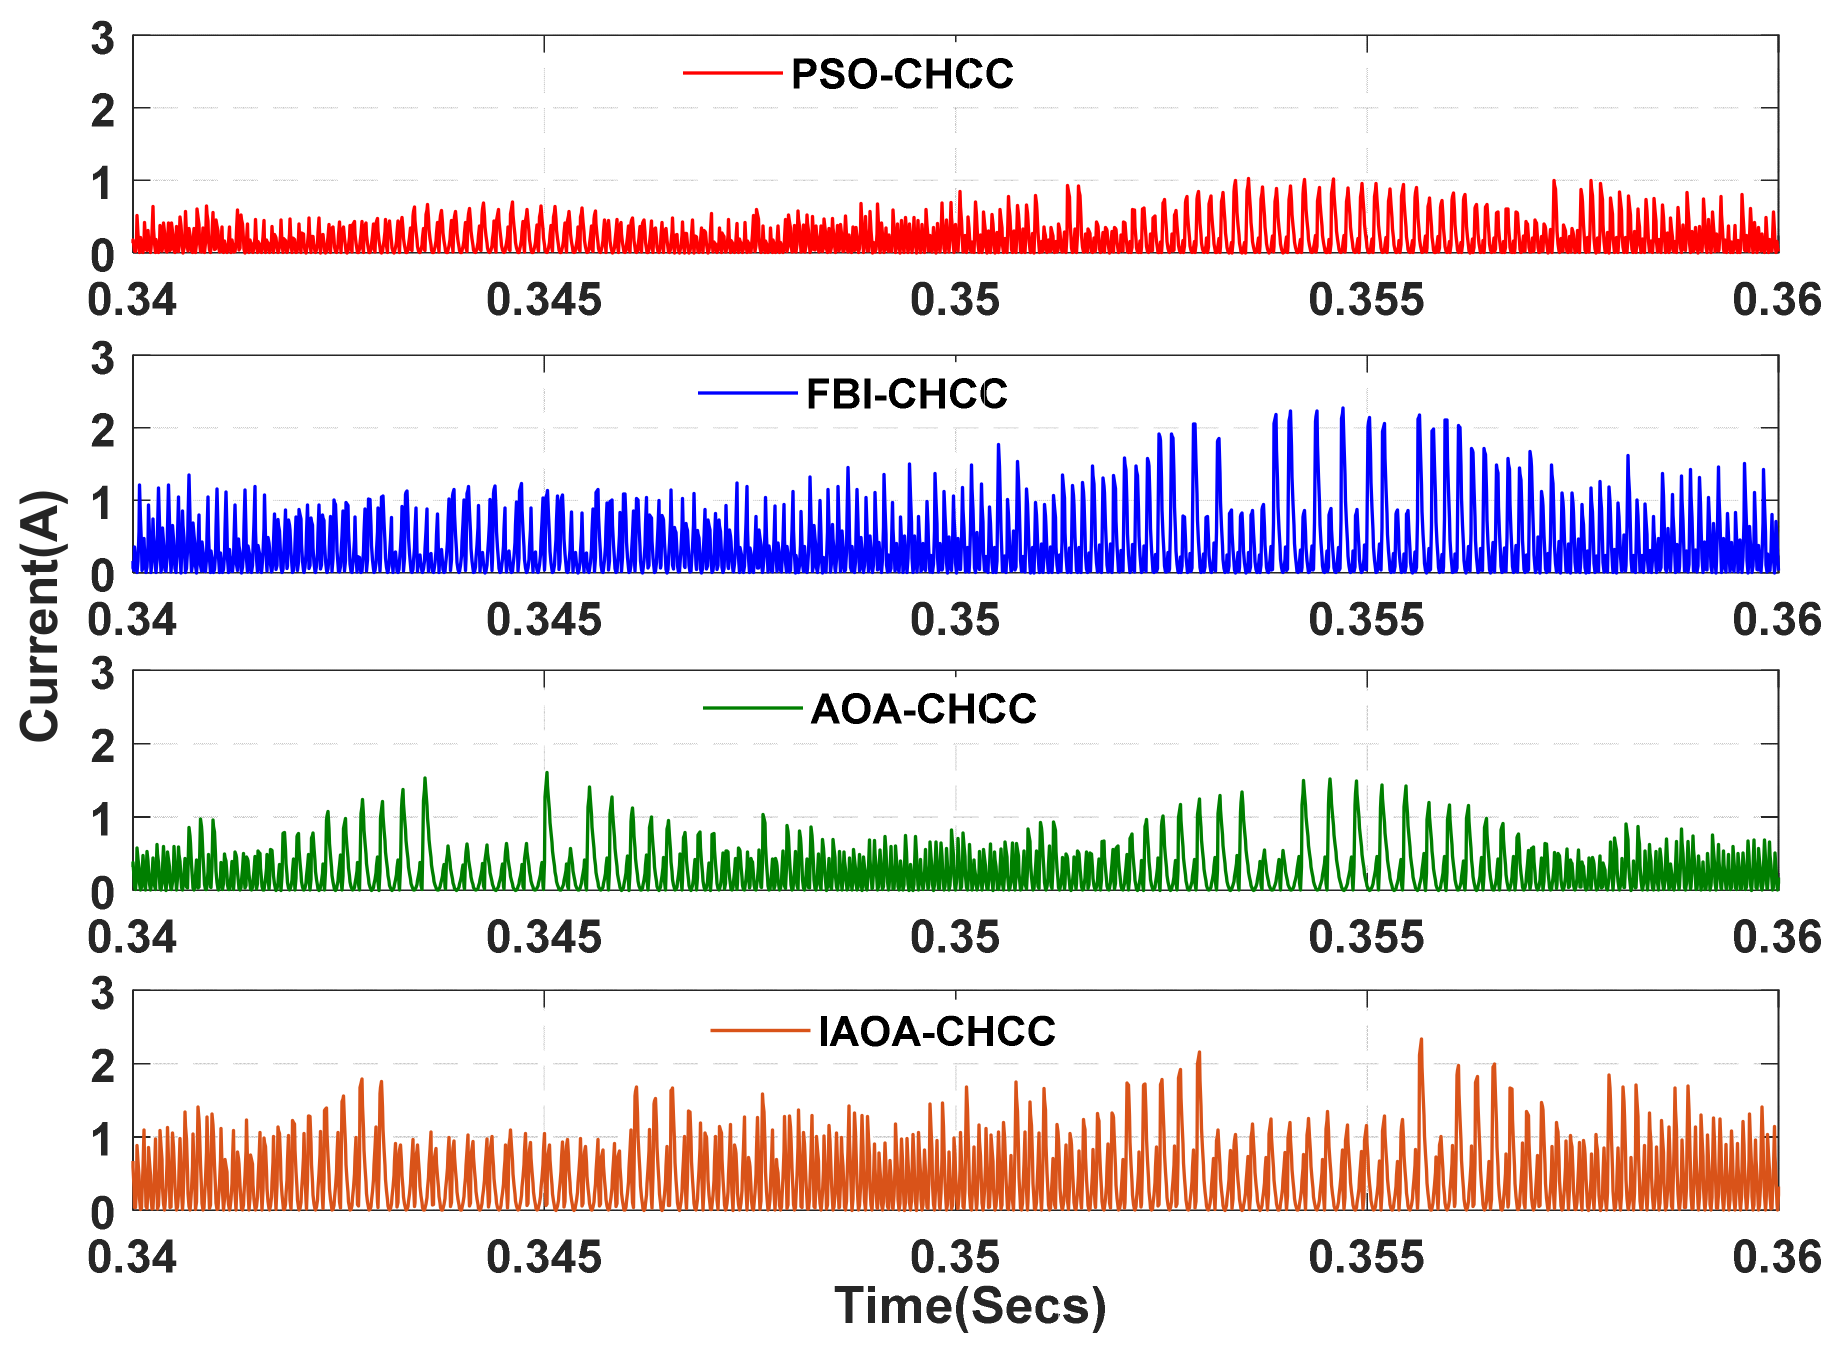
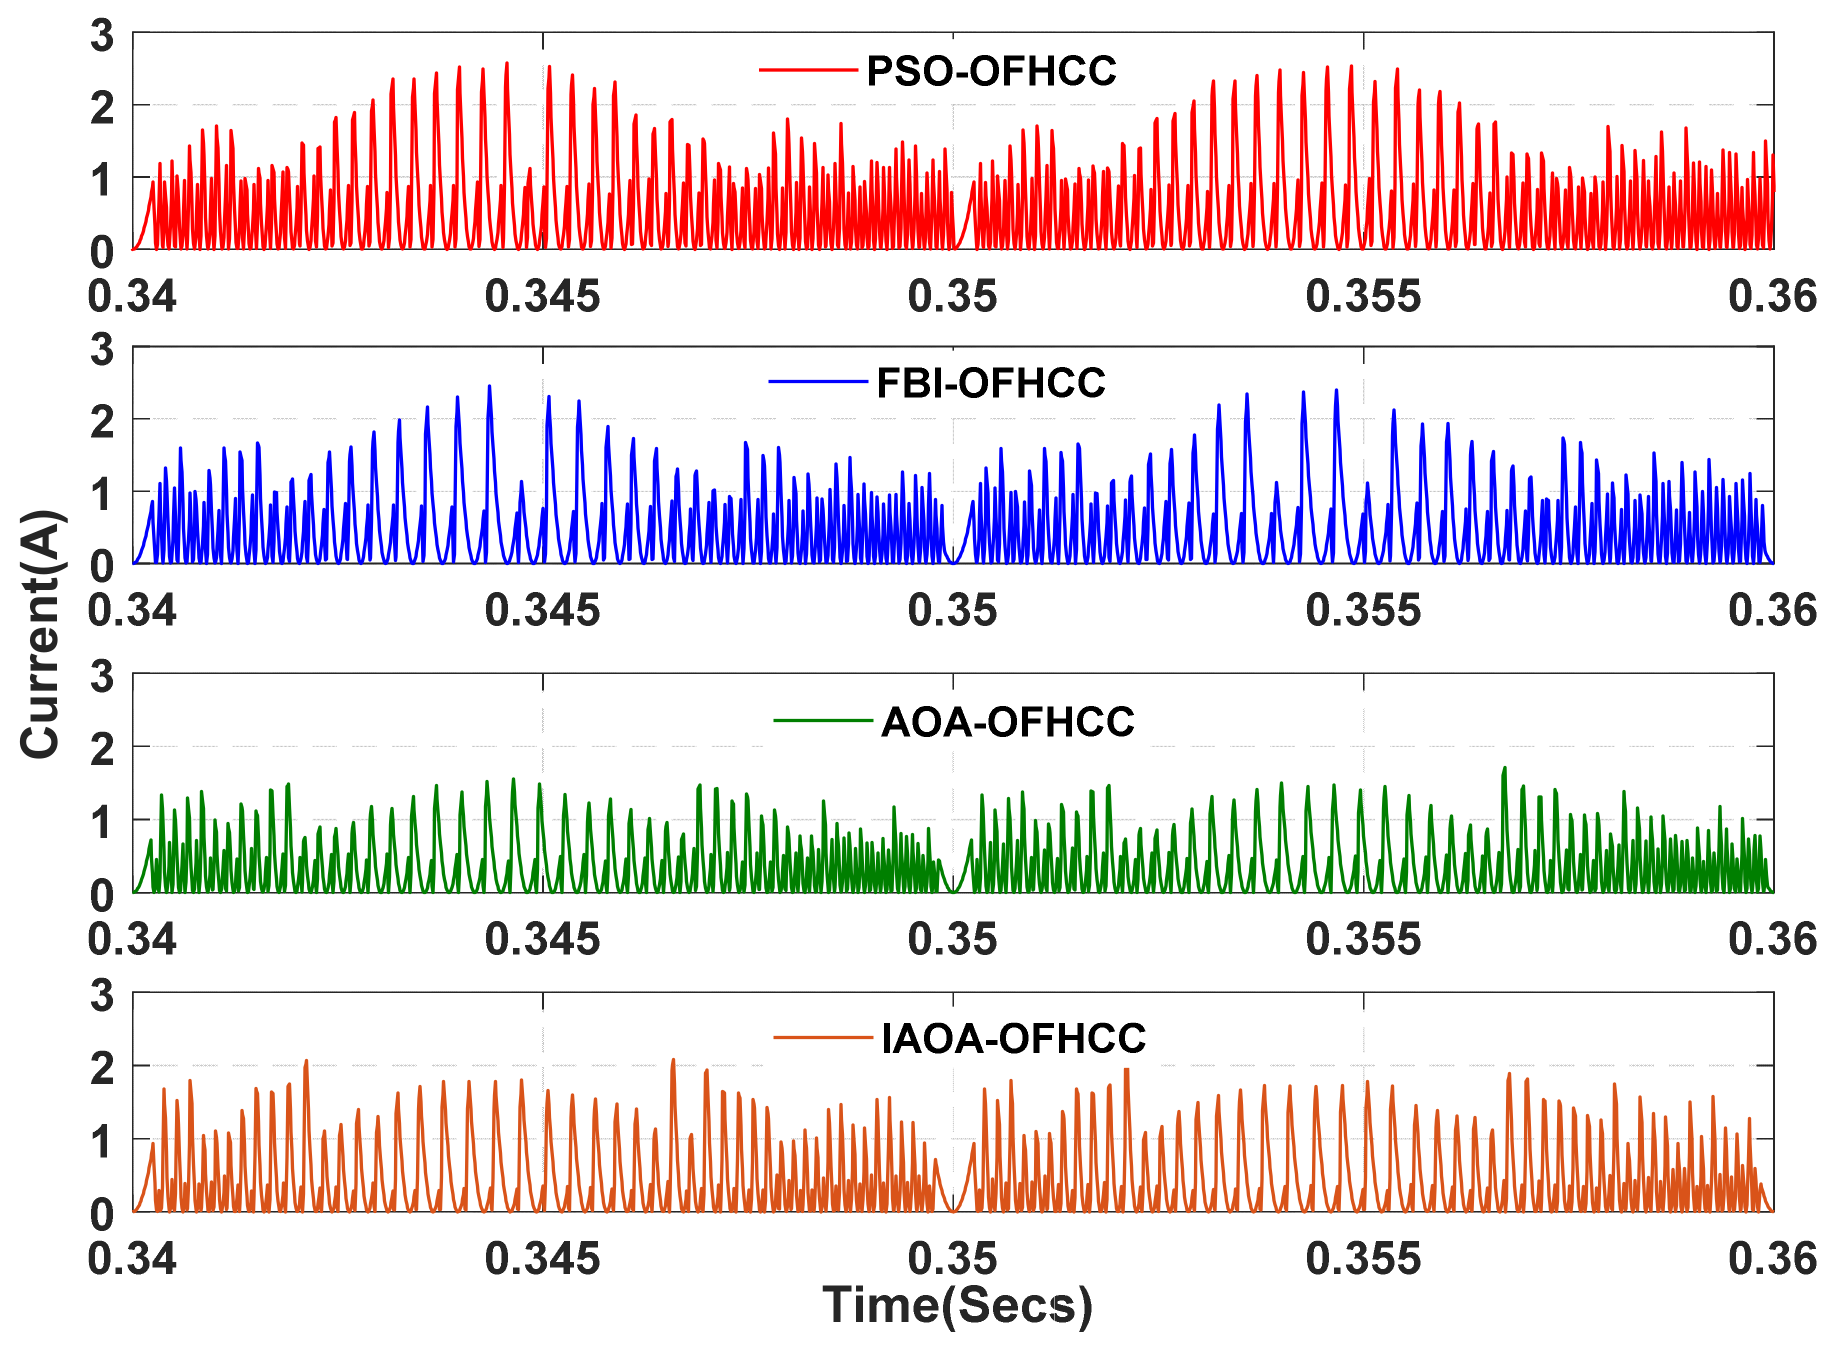
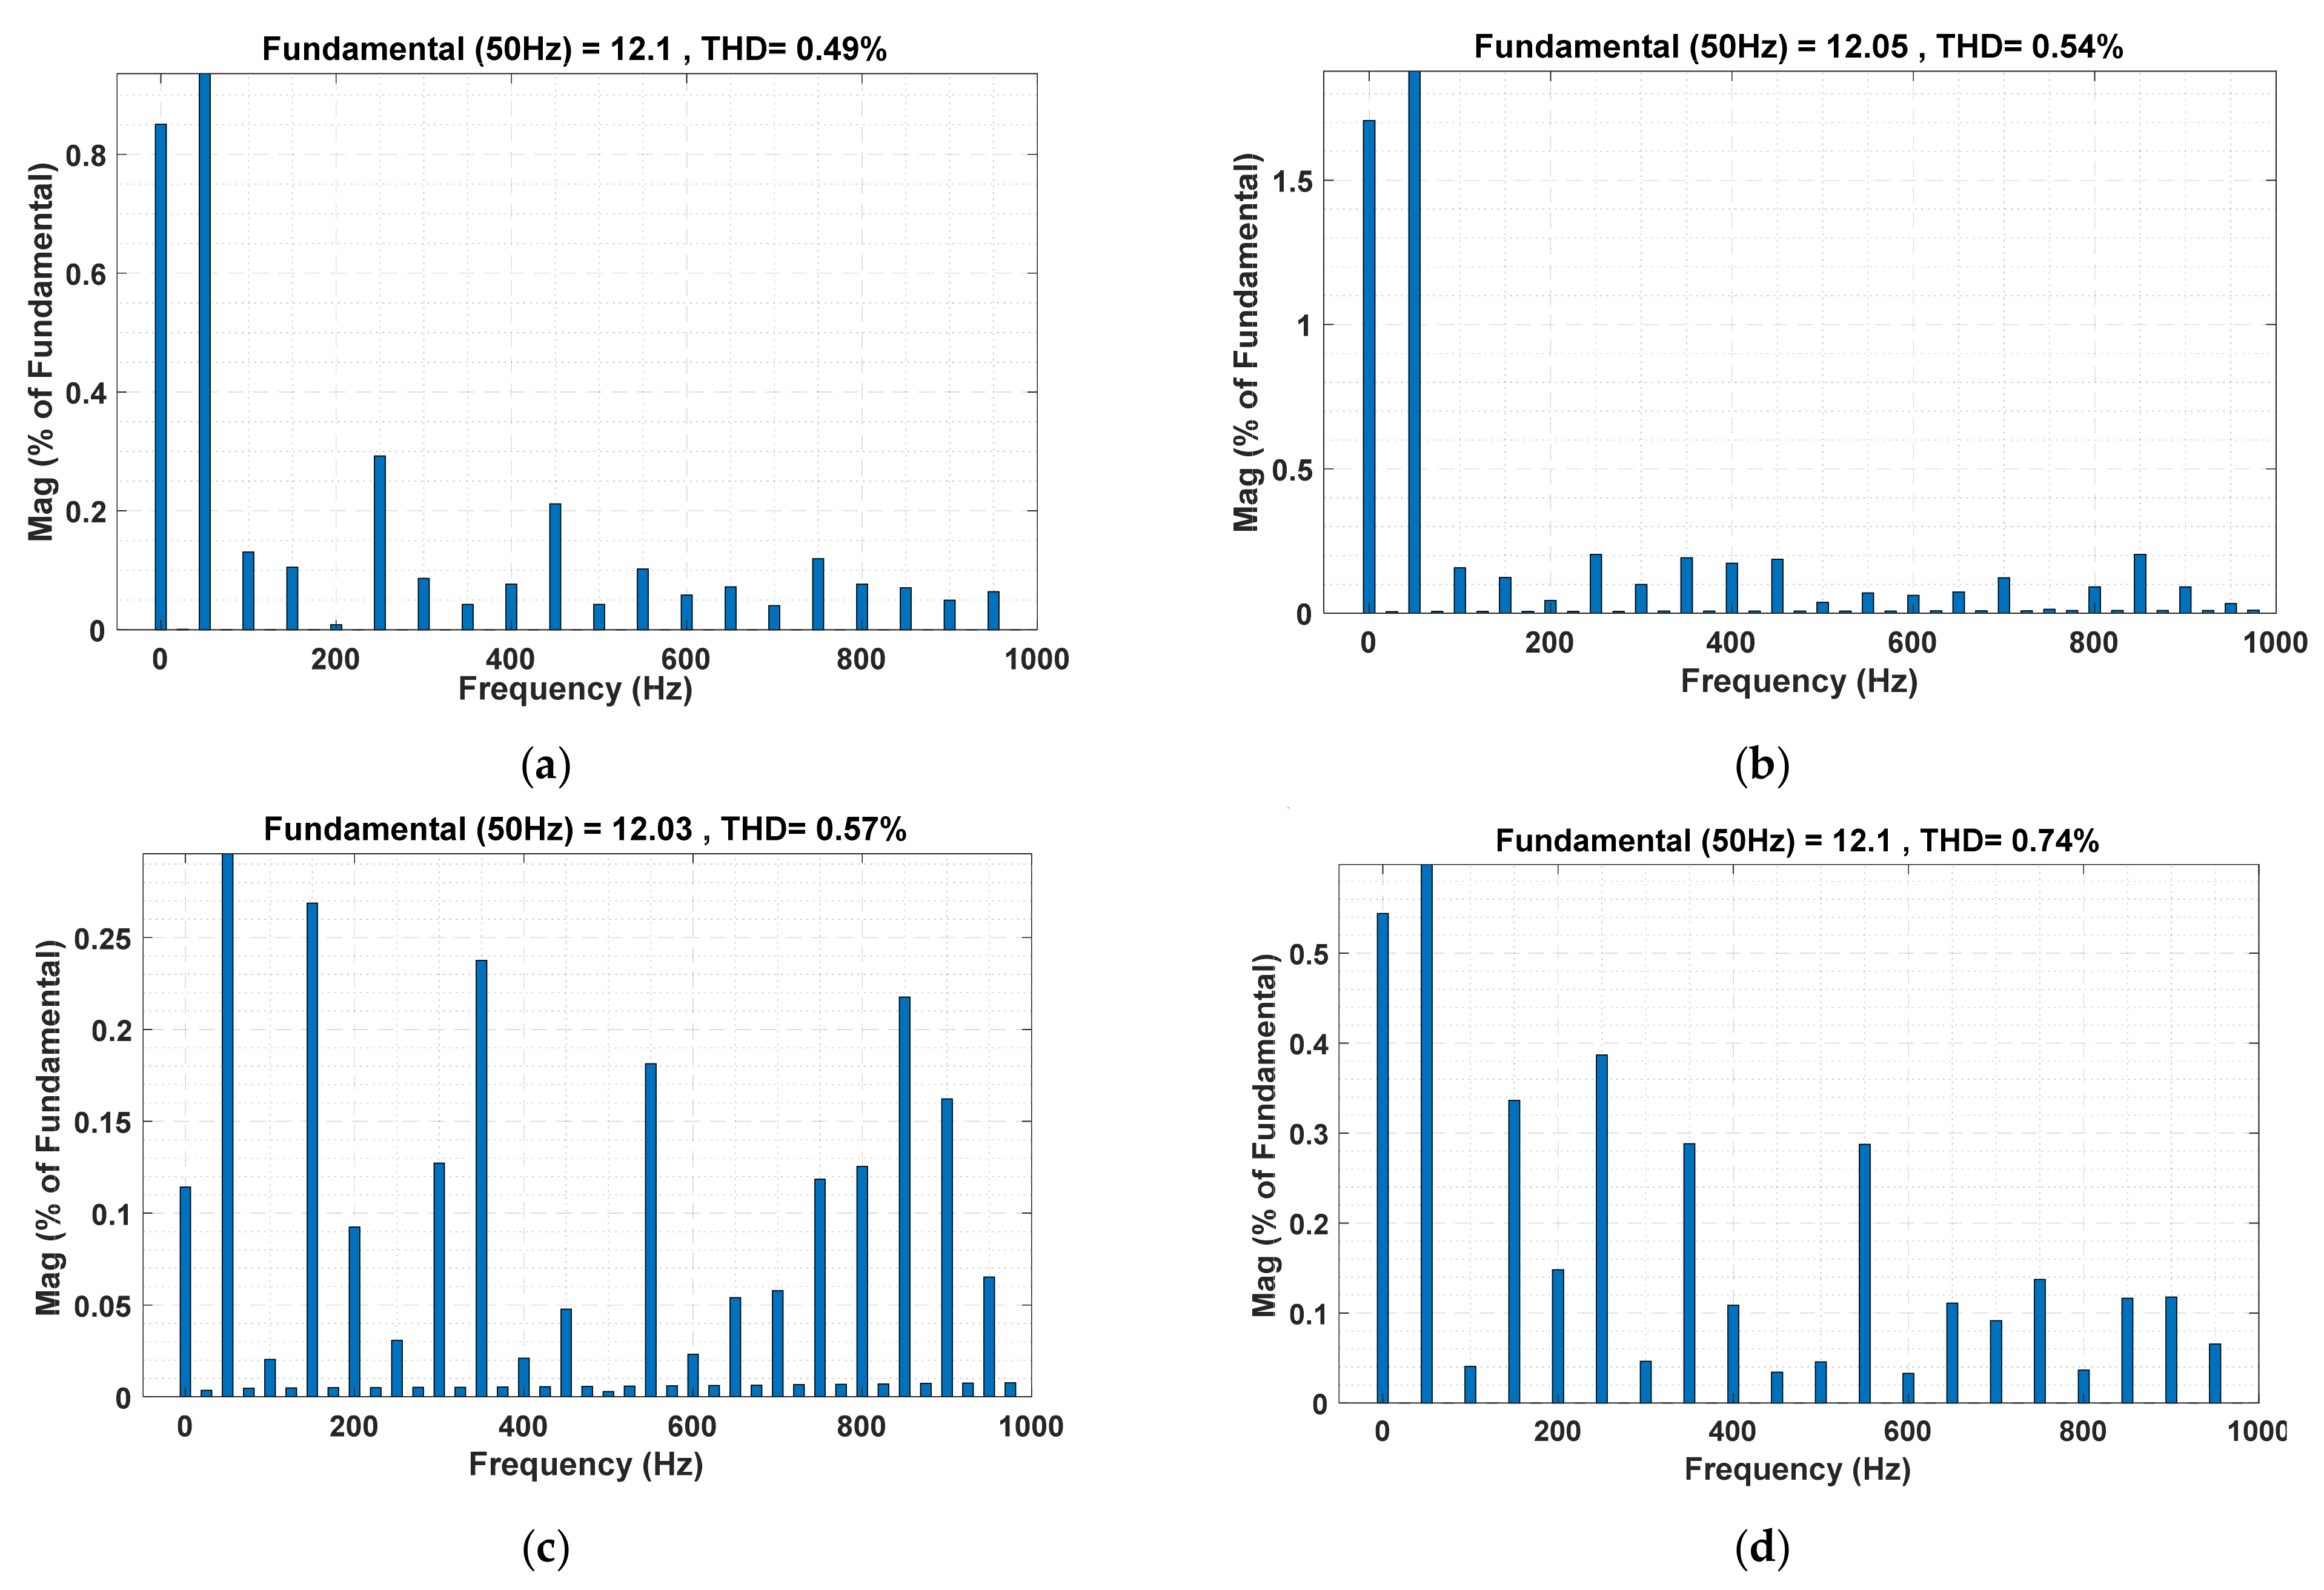
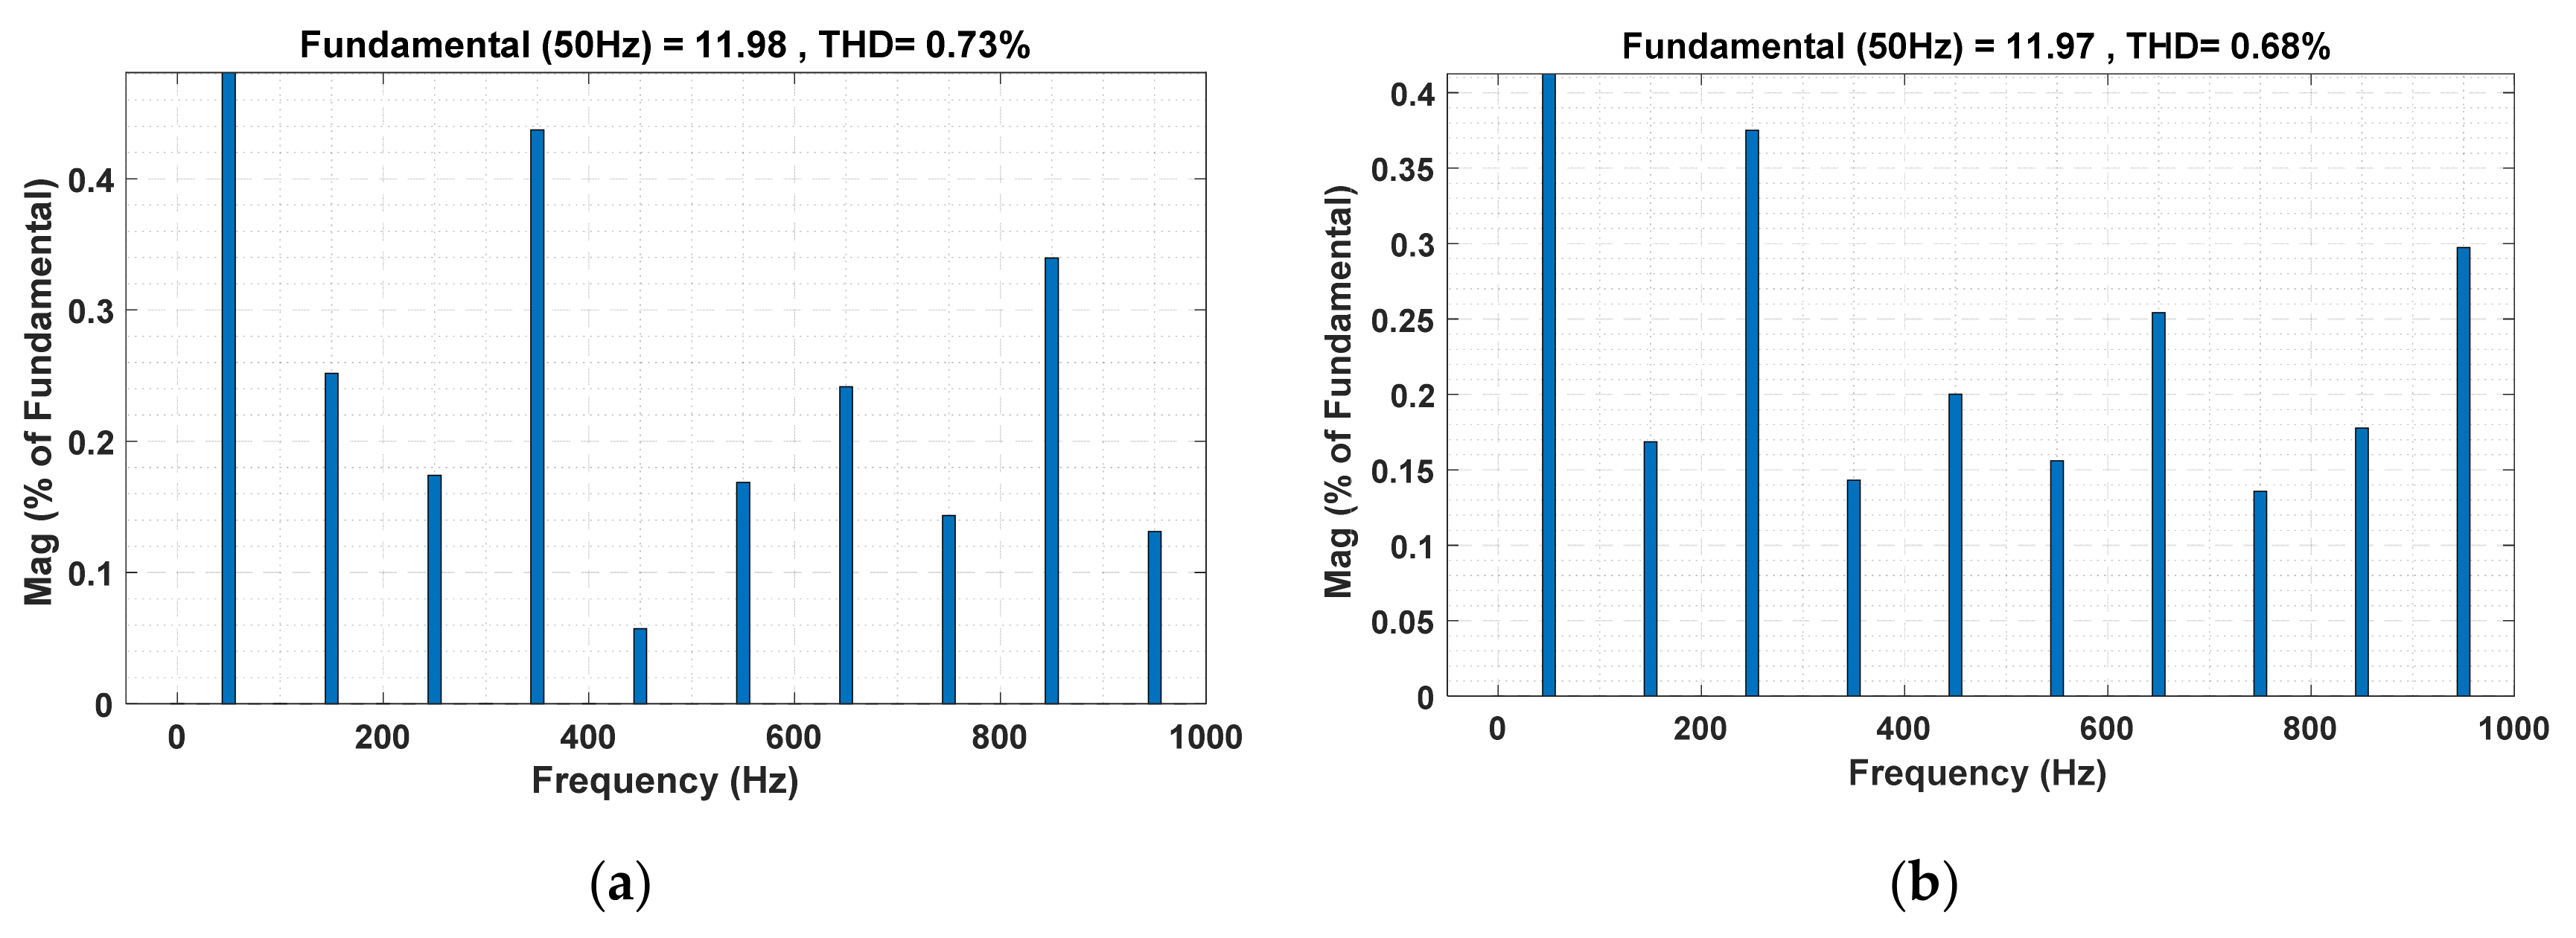
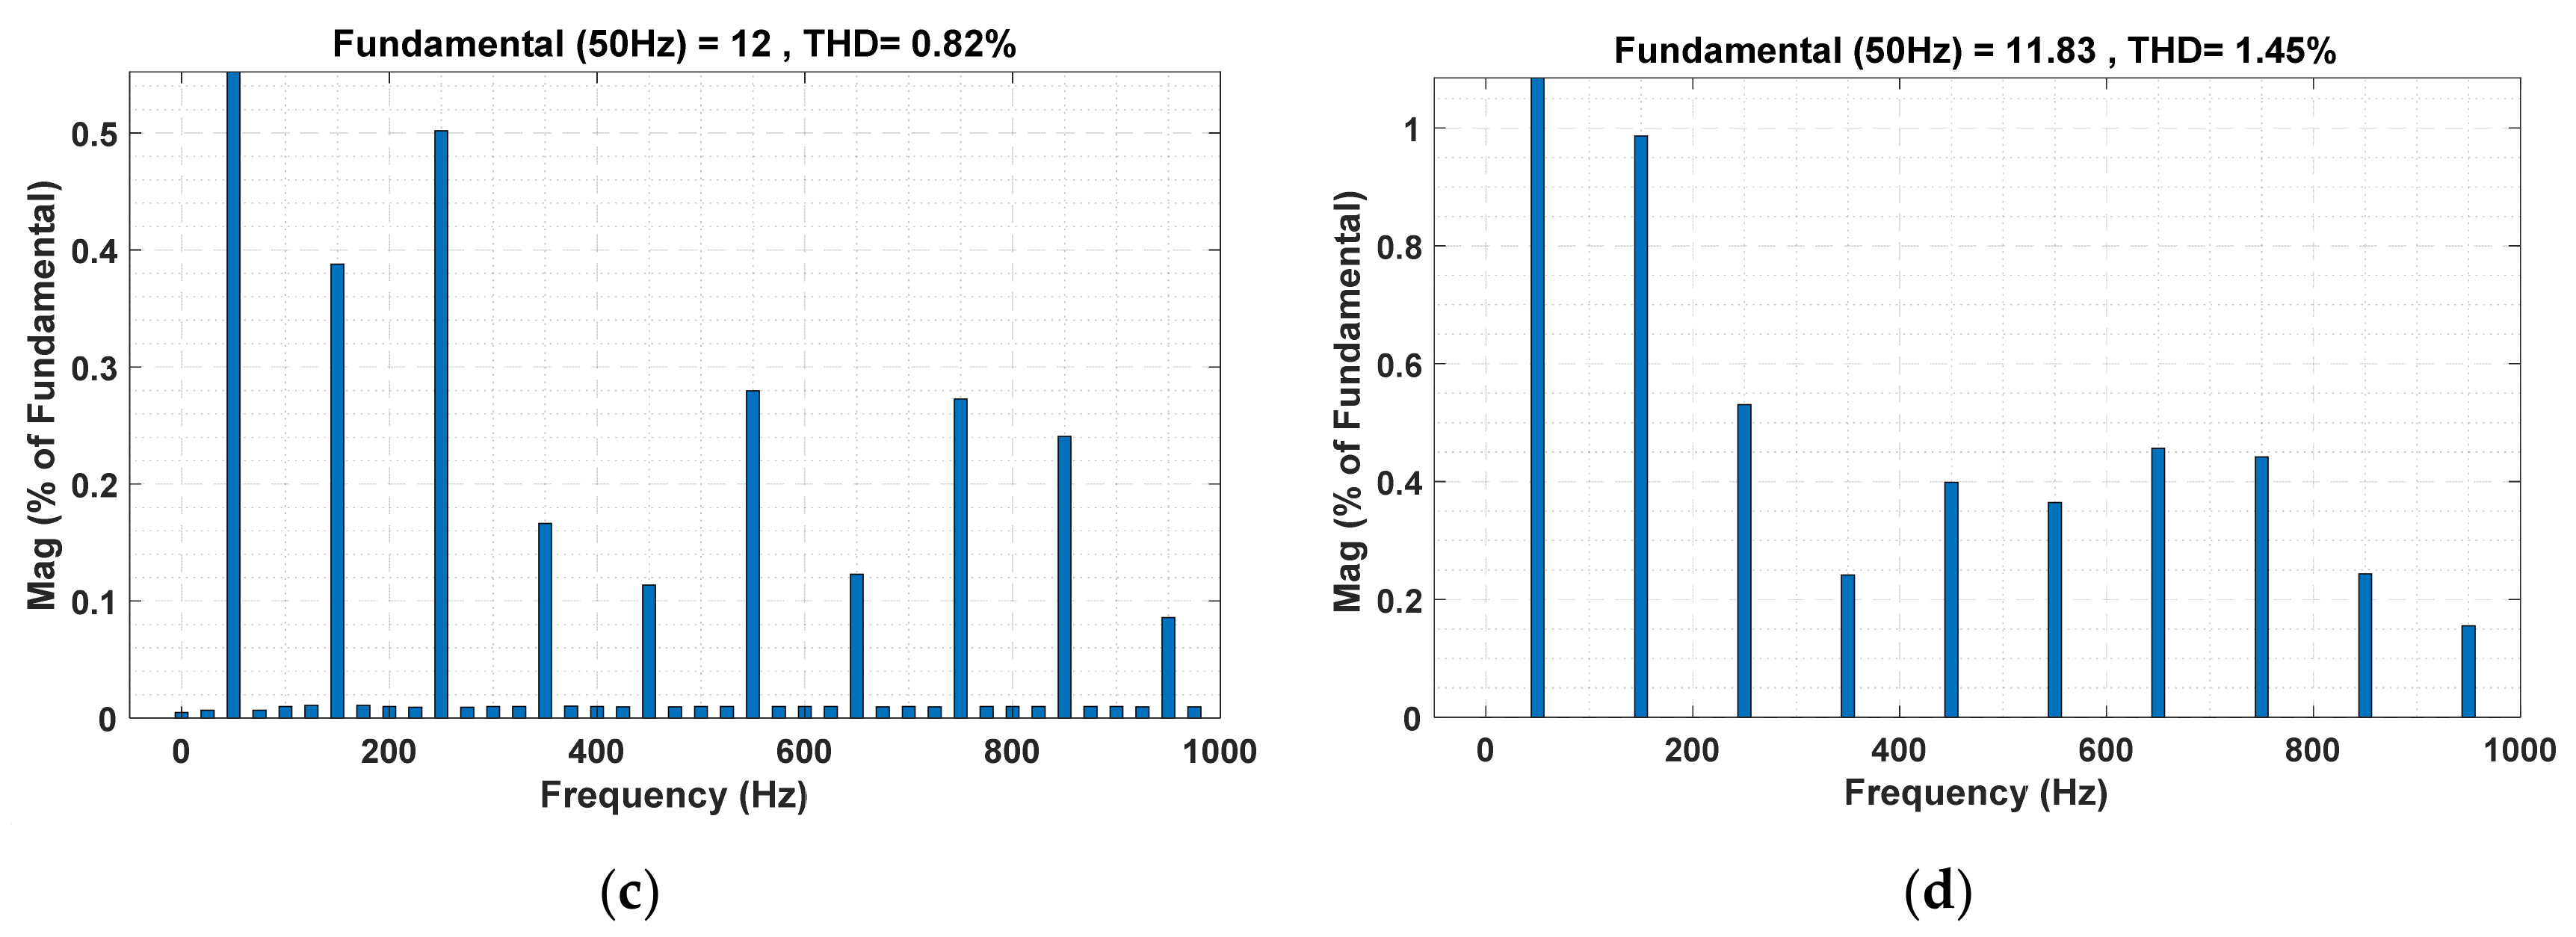
The error current of the proposed algorithm with offset hysteresis band and other algorithms and controllers are shown in Figure 17, Figure 18, Figure 19 and Figure 20 with simulation and experimental results. It can be observed that the error current remains within the hysteresis bands in both cases. The inverter current spectrum for the grid-tied system is shown in Figure 21 and Figure 22 for CHCC and OFHCC with respective algorithms for the PV microgrid. It can be observed that PSO-CHCC has the lowest %THD of 0.49 but has the average switching frequency and average switching losses of 7.85 kHz and 30.60 W, respectively, so the proposed IAOA-OFHCC technique dominates all other control algorithms with minimum average switching frequency and minimum average switching losses of 2.33 kHz and 9.07 W, respectively.
Figure 23 represents the performance indices of different controllers. The proposed IAOA-OFHCC technique addresses the problems of the high variations in average switching frequency and average switching losses. The proposed method’s low average switching losses are indicative of a more efficient system. For step change in load feeding to the grid, all the techniques dynamic and steady-state characteristics were experimentally verified using the digital simulator OPAL-RT 4510. As a result, power can be delivered to the microgrid at higher efficiency, mitigating the power quality problems.

Behavior of the Proposed Control Algorithm under Partial Shading Condition

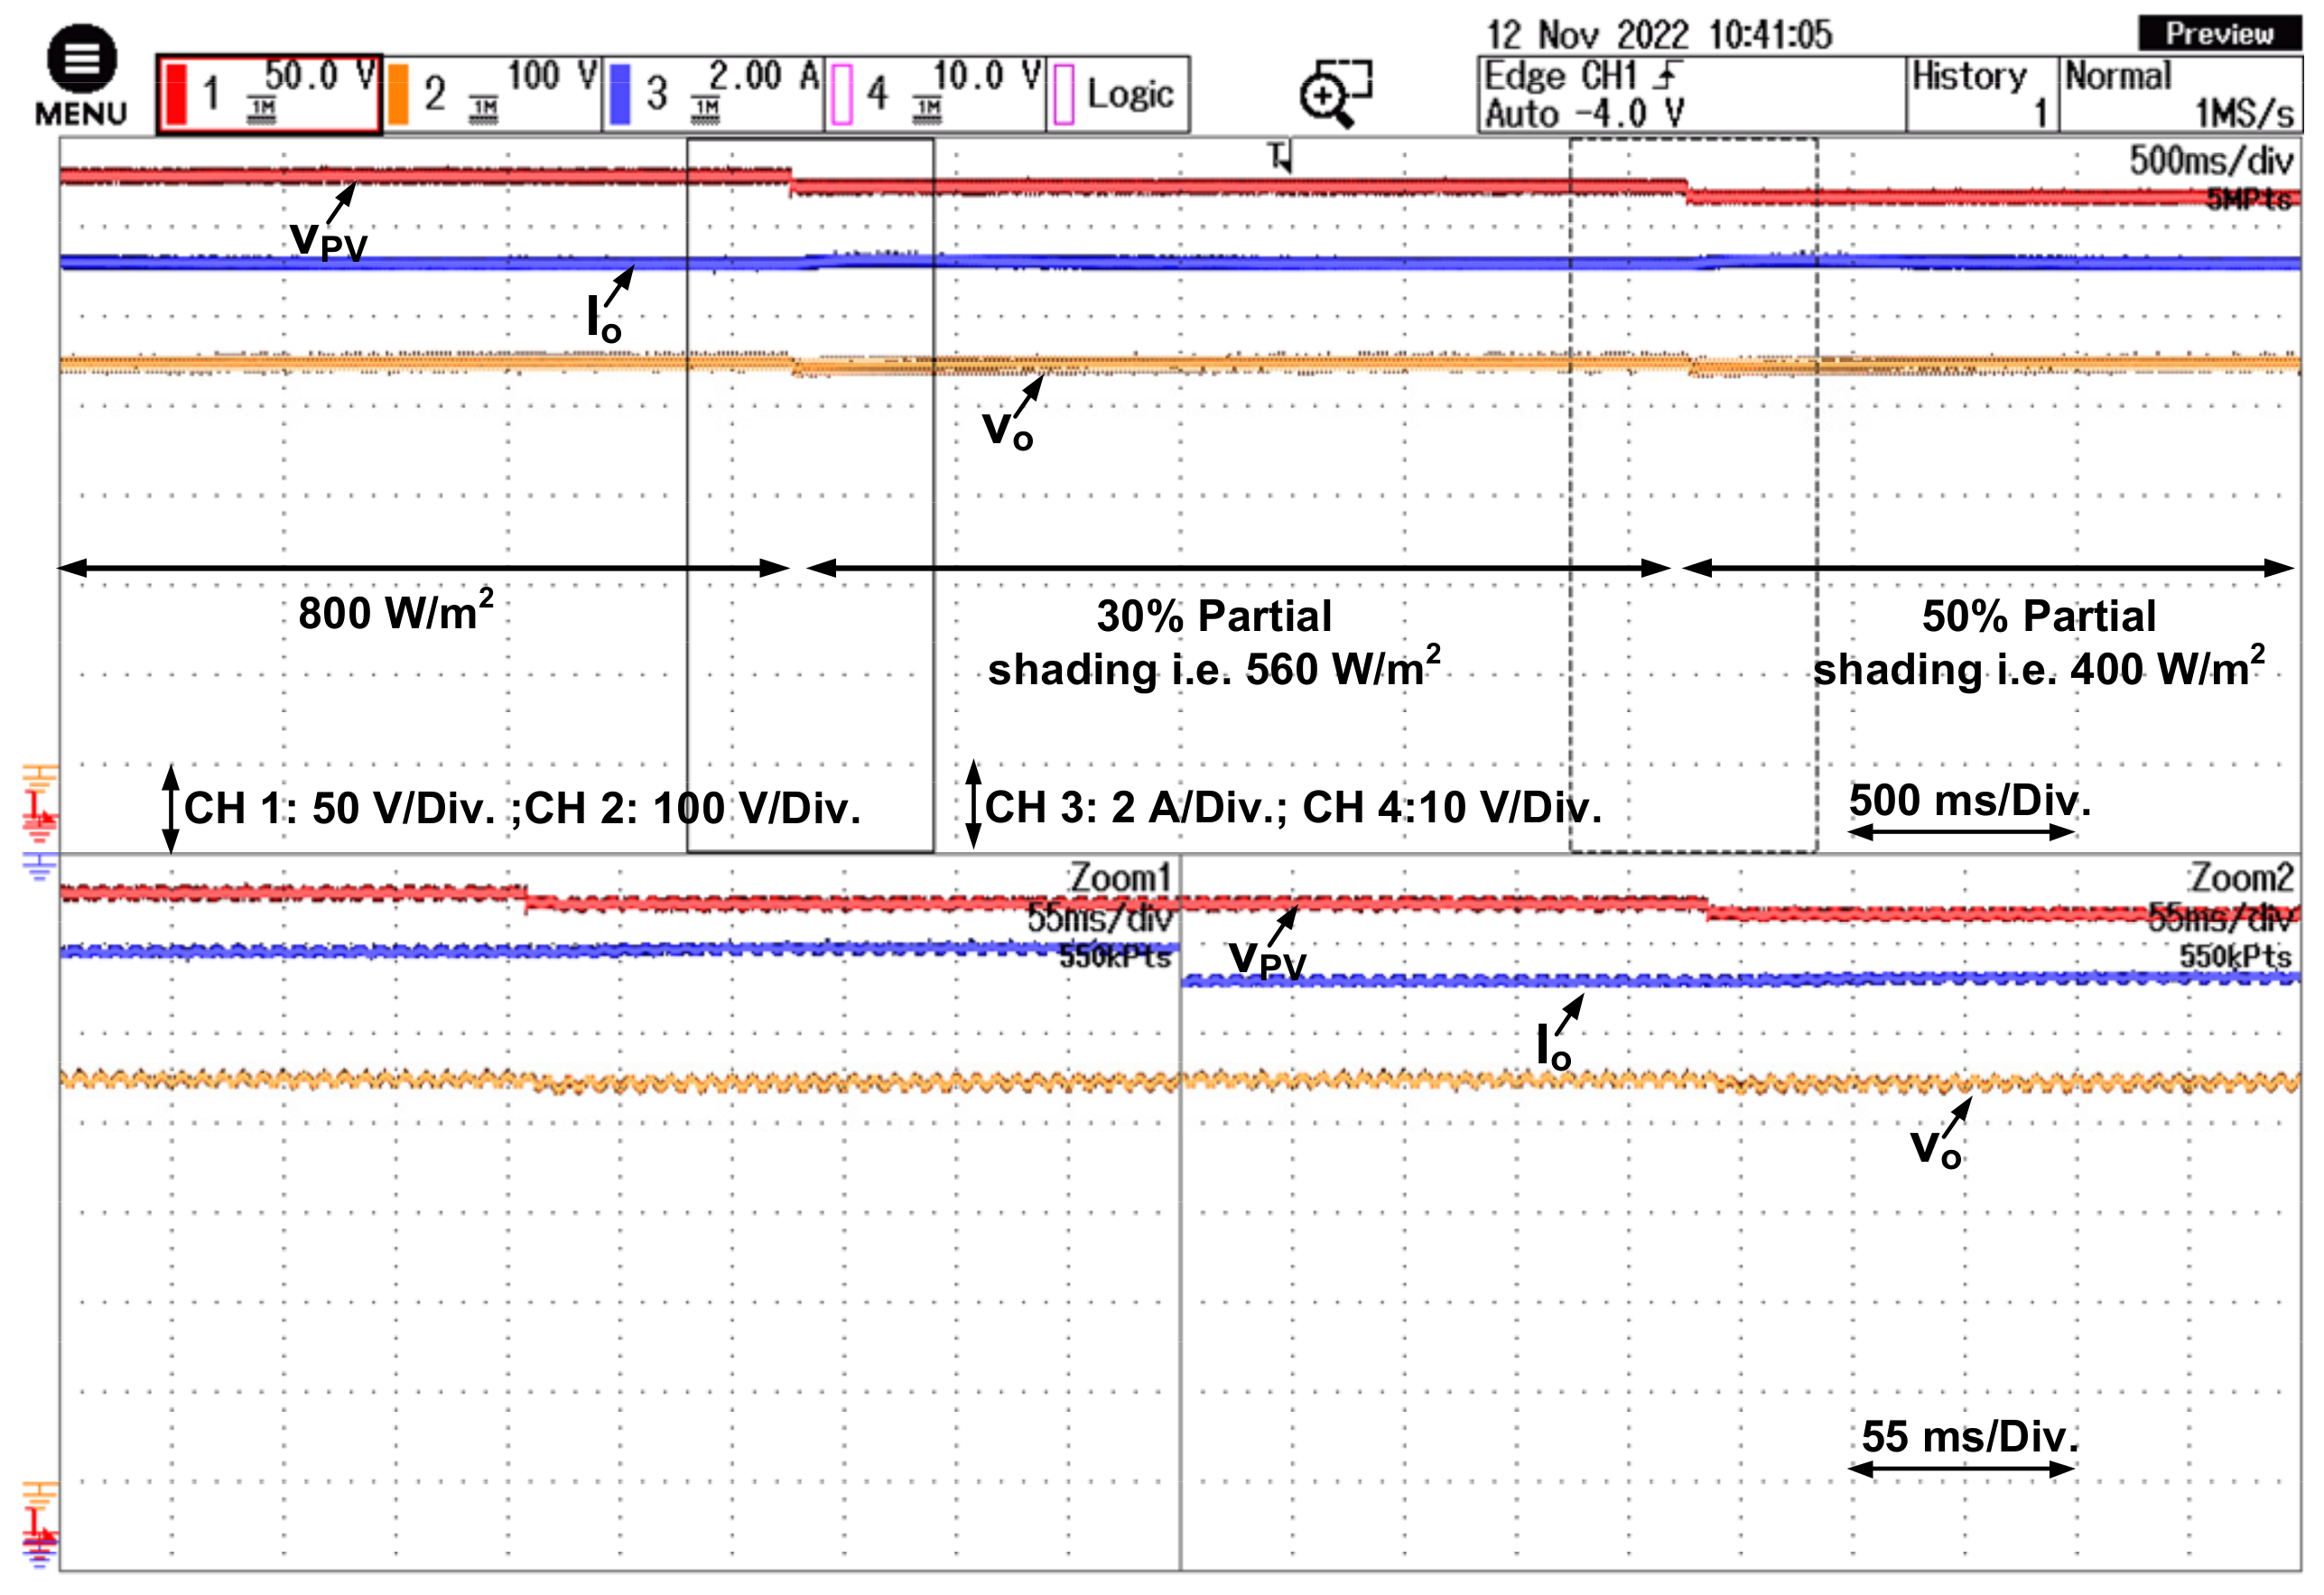
During the day, it is crucial to extract the maximum quantity of power without a change in irradiance level. However, due to the partial shading effect, the PV output power is reduced, the cost increases, and thus the efficiency decreases. Many conventional techniques fail to extract the maximum power point due to the formation of multiple hot spots in PV strings. In order to handle this drawback, the proposed IAOA-based OFHCC control algorithm has been studied. Initially, it is assumed that the PV module receives an insolation of 800 W/m2. The system is then subjected to two different percentages of partial shading, i.e., 30% and 50%. The load power is considered to be constant throughout the partial shading operation. The variations in converter input voltage (Vpv), converter output voltage (Vo), and converter output current (Io) due to partial shading are shown in Figure 24. It can be clearly seen from Figure 24 that as the shading increases, it causes a reduction in the PV array output voltage. The boost converter efficiently maintains the DC voltage at 450 V, as shown in Figure 24.
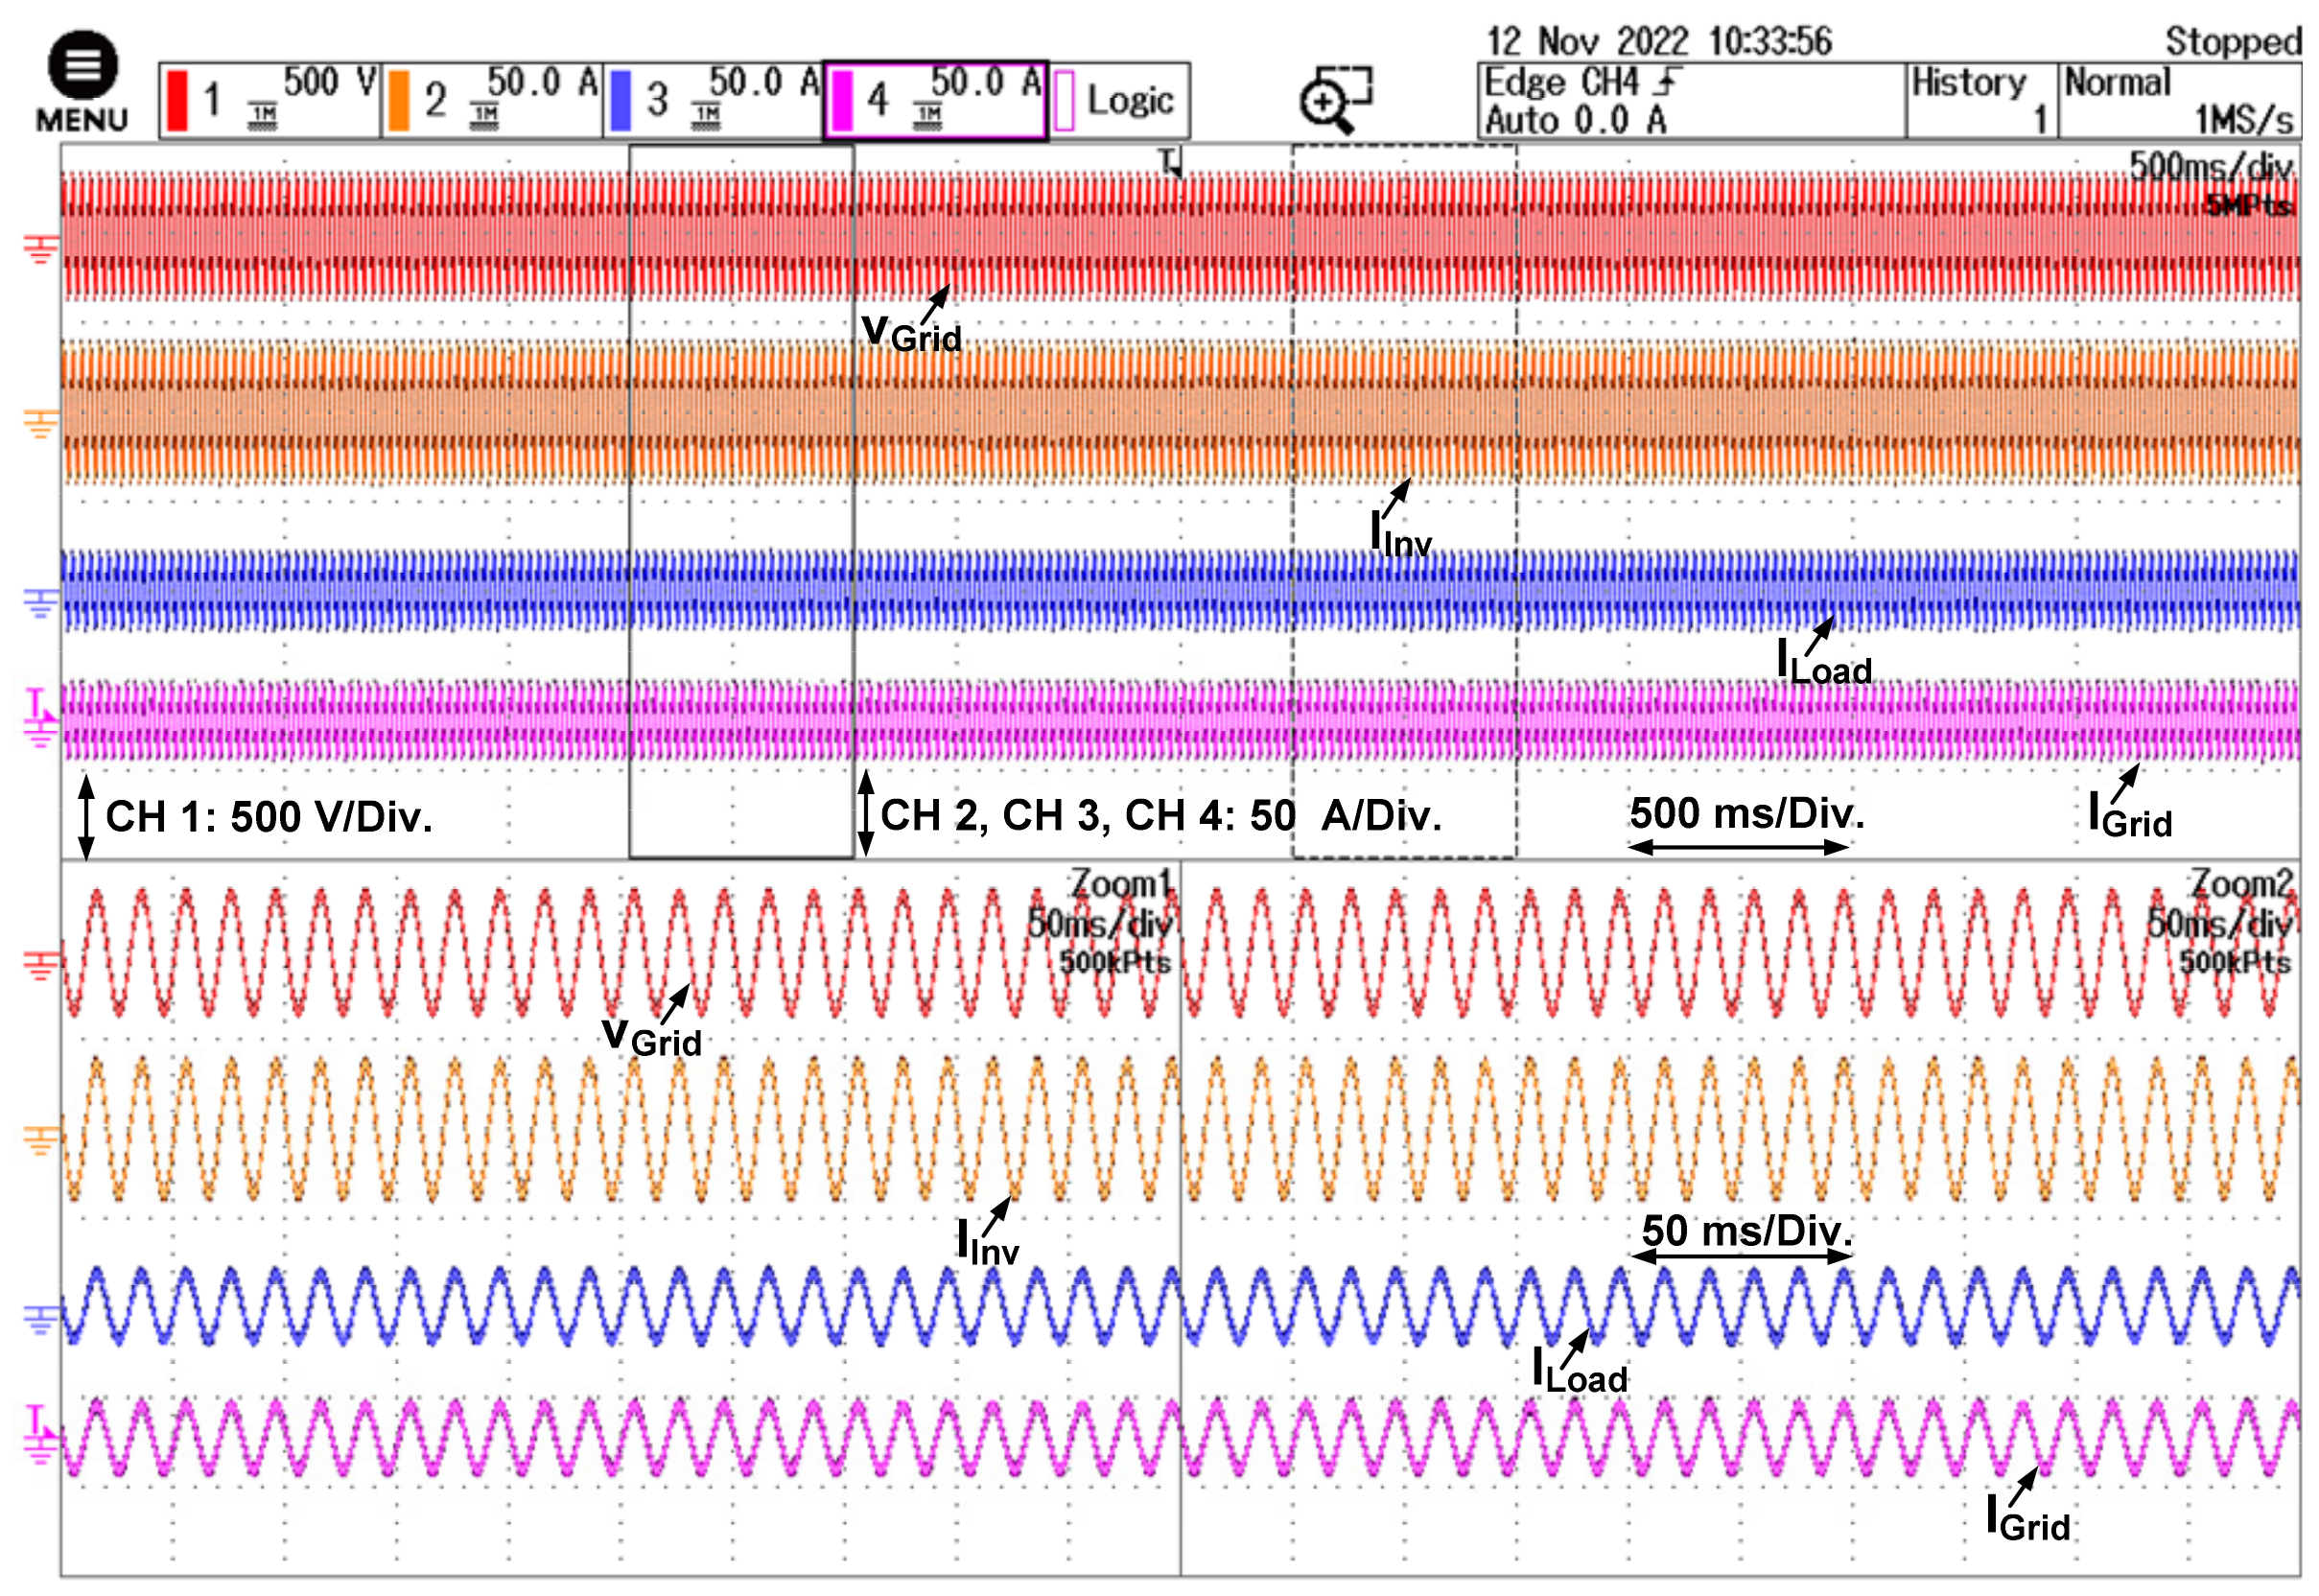
The grid voltage (VGrid), inverter current (IInv), load current (ILoad), and grid current (IGrid) responses are shown in Figure 25. From Figure 25, it can be clearly noticed that the inverter currents, grid currents, and load currents remain unaltered even after partial shading. Due to the robustness of the proposed control algorithm, the boost converter is capable of maintaining a constant DC voltage. The boost converter maintains a fairly constant voltage at the DC side, which nullifies the effect of partial shading on the AC side of the proposed system.

7. Conclusions

In this article, experimental validation of IAOA-OFHCC and IAOA-CHCC inverter control has been provided to achieve better power quality at reduced switching frequency so that sinusoidal current is injected into the grid. Compared to the switching frequency obtained by PSO, FBI, and AOA, the novel IAOA technique with an OFHCC controller has reduced switching frequency which justifies the acceptance of grid-connected IAOA-OFHCC design. The offset hysteresis band current controller, in addition to preserving the benefits of the conventional hysteresis band current controller, also delivers extra benefits such as fast dynamic response, reduced average switching frequency and losses, and higher accuracy and makes the microgrid robust. According to the mathematical presentation, IAOA has a straightforward implementation for addressing new optimization difficulties in microgrids. It does not need numerous constraints, only requiring a stopping criterion, a population size, and the standard parameters for optimizing hysteresis bands and duty cycles. The current fed from the inverter is sinusoidal with low total harmonic distortion (THD) following the IEEE 519 standard. The single-phase inverter provides a reduced ripple output using the proposed hybrid methodology. The performance of the novel method was assessed under load variation and proved robust in reference current tracking.

Author Contributions

Conceptualization, B.M., B.K.S. and S.P.; methodology, B.M., B.K.S., M.A. and S.P.; software, S.P., M.A. and M.B.; validation, S.P. and M.B.; formal analysis, B.M.; investigation, V.B. and S.M.; resources, V.B. and S.M.; data curation, M.B. and M.A.; writing—original draft preparation, V.B. and S.M.; writing—review and editing, V.B. and S.M.; visualization, M.B.; supervision, B.K.S. and S.P.; project administration, M.B.; funding acquisition, M.B., V.B., S.M. and L.P. All authors have read and agreed to the published version of the manuscript.

Funding

This paper was supported by the following projects: the doctoral grant competition VSB—the Technical University of Ostrava, reg. No. CZ.02.2.69/0.0/0.0/19 073/0016945 within the Operational Programme Research, Development, and Education, under project DGS/TEAM/2020-017 “Smart Control System for Energy Flow Optimization and Management in a Microgrid with V2H/V2G Technology”; FV40411 Optimization of process intelligence of parking system for Smart City, project TN01000007, National Centre for Energy; and Taif University Researchers Supporting Project TURSP 2020/122, Taif University, Taif, Saudi Arabia.

Data Availability Statement

Not applicable.

Acknowledgments

The authors appreciate the doctoral grant competition VSB—the Technical University of Ostrava, reg. No. CZ.02.2.69/0.0/0.0/19 073/0016945 within the Operational Programme Research, Development, and Education, under project DGS/TEAM/2020-017 “Smart Control System for Energy Flow Optimization and Management in a Microgrid with V2H/V2G Technology”; FV40411 Optimization of process intelligence of parking system for Smart City, project TN01000007, National Centre for Energy; and Taif University Researchers Supporting Project TURSP 2020/122, Taif University, Taif, Saudi Arabia for supporting this work.

Conflicts of Interest

The authors declare no conflict of interest.

References

  1. Bastida, L.; Cohen, J.J.; Kollmann, A.; Moya, A.; Reichl, J. Exploring the role of ICT on household behavioural energy efficiency to mitigate global warming. Renew. Sustain. Energy Rev. 2019, 103, 455–462. [Google Scholar] [CrossRef] [Green Version]
  2. Al-Shetwi, A.Q.; Hannan, M.A.; Jern, K.P.; Mansur, M.; Mahlia, T.M. Grid-connected renewable energy sources: Review of the recent integration requirements and control methods. J. Clean. Prod. 2020, 253, 119831. [Google Scholar] [CrossRef]
  3. Irena, I. Renewable Power Generation Costs in 2017; Report; International Renewable Energy Agency: Abu Dhabi, United Arab Emirates, 2018. [Google Scholar]
  4. Bhandari, B.; Lee, K.T.; Lee, G.Y.; Cho, Y.M.; Ahn, S.H. Optimization of hybrid renewable energy power systems: A review. Int. J. Precis. Eng. Manuf.-Green Technol. 2015, 2, 99–112. [Google Scholar] [CrossRef]
  5. Lund, H.; Mathiesen, B.V. Energy system analysis of 100% renewable energy systems—The case of Denmark in years 2030 and 2050. Energy 2009, 34, 524–531. [Google Scholar] [CrossRef]
  6. Harrouz, A.; Abbes, M.; Colak, I.; Kayisli, K. Smart grid and renewable energy in Algeria. In Proceedings of the IEEE 6th International Conference on Renewable Energy Research and Applications (ICRERA), San Diego, CA, USA, 5–8 November 2017; pp. 1166–1171. [Google Scholar]
  7. Qazi, A.; Hussain, F.; Rahim, N.A.; Hardaker, G.; Alghazzawi, D.; Shaban, K.; Haruna, K. Towards sustainable energy: A systematic review of renewable energy sources, technologies, and public opinions. IEEE Access 2019, 7, 63837–63851. [Google Scholar] [CrossRef]
  8. Al Maamary, H.M.; Kazem, H.A.; Chaichan, M.T. Renewable energy and GCC States energy challenges in the 21st century: A review. Int. J. Comput. Appl. Sci. IJOCAAS 2017, 2, 11–18. [Google Scholar]
  9. Hannan, M.A.; Ghani, Z.A.; Hoque, M.M.; Hossain Lipu, M.S. A fuzzy-rule-based PV inverter controller to enhance the quality of solar power supply: Experimental test and validation. Electronics 2019, 8, 1335. [Google Scholar] [CrossRef] [Green Version]
  10. Gul, M.; Kotak, Y.; Muneer, T. Review on recent trend of solar photovoltaic technology. Energy Explor. Exploit. 2016, 34, 485–526. [Google Scholar] [CrossRef] [Green Version]
  11. Sathishkumar, R.; Malathi, V.; Premka, V. Optimization and design of PV-wind hybrid system for DC micro grid using NSGA II. Circuits Syst. 2016, 7, 1106. [Google Scholar] [CrossRef] [Green Version]
  12. Sawant, P.T.; Bhattar, C.L. Optimization of PV system using particle swarm algorithm under dynamic weather conditions. In Proceedings of the IEEE 6th International Conference on Advanced Computing (IACC), Bhimavaram, India, 27–28 February 2016; pp. 208–213. [Google Scholar]
  13. Ram, J.P.; Babu, T.S.; Rajasekar, N. A comprehensive review on solar PV maximum power point tracking techniques. Renew. Sustain. Energy Rev. 2017, 67, 826–847. [Google Scholar] [CrossRef]
  14. Zakaria, A.; Ismail, F.B.; Lipu, M.H.; Hannan, M.A. Uncertainty models for stochastic optimization in renewable energy applications. Renew. Energy 2020, 145, 1543–1571. [Google Scholar] [CrossRef]
  15. Hannan, M.A.; Tan, S.Y.; Al-Shetwi, A.Q.; Jern, K.P.; Begum, R.A. Optimized controller for renewable energy sources integration into micro-grid: Functions, constraints and suggestions. J. Clean. Prod. 2020, 256, 120419. [Google Scholar] [CrossRef]
  16. Ilas, A.; Ralon, P.; Rodriguez, A.; Taylor, M. Renewable Power Generation Costs; International Renewable Energy Agency: Abu Dhabi, United Arab Emirates, 2017. [Google Scholar]
  17. Gooding, P.A.; Makram, E.; Hadidi, R. Probability analysis of distributed generation for island scenarios utilizing Carolinas data. Electr. Power Syst. Res. 2014, 107, 125–132. [Google Scholar] [CrossRef]
  18. Blondeau, J.; Mertens, J. Impact of intermittent renewable energy production on specific CO2 and NOx emissions from large scale gas-fired combined cycles. J. Clean. Prod. 2019, 221, 261–270. [Google Scholar] [CrossRef]
  19. Khishe, M.; Mosavi, M.R. Chimp optimization algorithm. Expert Syst. Appl. 2020, 149, 113338. [Google Scholar] [CrossRef]
  20. Eberhat, R.; Kennedy, J. A new optimizer using particle swarm theory. In Proceedings of the Sixth International Symposium on Micro Machine and Human Science, Piscataway, NJ, USA, 4–6 October 1995; pp. 39–43. [Google Scholar]
  21. Mirjalili, S.; Mirjalili, S.M.; Lewis, A. Grey Wolf Optimizer. Adv. Eng. Softw. 2014, 69, 46–61. [Google Scholar] [CrossRef] [Green Version]
  22. Rao, R.V.; Savsani, V.J.; Vakharia, D.P. Teaching–learning-based optimization: A novel method for constrained mechanical design optimization problems. Comput.-Aided Des. 2011, 43, 303–315. [Google Scholar] [CrossRef]
  23. Xiang, W.L.; An, M.Q. An efficient and robust artificial bee colony algorithm for numerical optimization. Comput. Oper. Res. 2013, 40, 1256–1265. [Google Scholar] [CrossRef]
  24. Abualigah, L.; Diabat, A.; Mirjalili, S.; Abd Elaziz, M.; Gandomi, A.H. The arithmetic optimization algorithm. Comput. Methods Appl. Mech. Eng. 2021, 376, 113609. [Google Scholar] [CrossRef]
  25. Varaprasad, O.V.; Sarma, D.S. An improved three level Hysteresis Current Controller for single phase shunt active power filter. In Proceedings of the IEEE 6th India International Conference on Power Electronics, Kurukshetra, India, 8–10 December 2014; pp. 1–5. [Google Scholar]
  26. Zeb, K.; Uddin, W.; Adil Khan, M.; Ali, Z.; Umair Ali, M.; Christofides, N.; Kim, H.J. A comprehensive review on inverter topologies and control strategies for grid connected photovoltaic system. Renew. Sustain. Energy Rev. 2018, 94, 1120–1141. [Google Scholar] [CrossRef]
  27. Parvez, M.; Elias, M.F.M.; Rahim, N.A.; Osman, N. Current control techniques for three-phase grid interconnection of renewable power generation systems: A review. Sol. Energy 2016, 135, 29–42. [Google Scholar] [CrossRef]
  28. Hassan, Z.; Amir, A.; Selvaraj, J.; Rahim, N.A. A review on current injection techniques for low-voltage ride-through and grid fault conditions in grid-connected photovoltaic system. Sol. Energy 2020, 207, 851–873. [Google Scholar] [CrossRef]
  29. Tian, H.; Mancilla David, F.; Ellis, K.; Muljadi, E.; Jenkins, P.A. Cell-to-module-to-array detailed model for photovoltaic panels. Sol. Energy 2012, 86, 2695–2706. [Google Scholar] [CrossRef]
  30. Vengatesh, R.P.; Rajan, S.E. Investigation of cloudless solar radiation with PV module employing Matlab-Simulink. In Proceedings of the International Conference on Emerging Trends in Electrical and Computer Technology, Nagercoil, India, 23–24 March 2011; pp. 141–147. [Google Scholar]
  31. Zhang, Y.; Gao, S.; Gu, T. Prediction of IV characteristics for a PV panel by combining single diode model and explicit analytical model. Sol. Energy 2017, 144, 349–355. [Google Scholar] [CrossRef]
  32. Jalil, M.F.; Khatoon, S.; Nasiruddin, I.; Bansal, R.C. Review of PV array modelling, configuration and MPPT techniques. Int. J. Model. Simul. 2022, 42, 533–550. [Google Scholar] [CrossRef]
  33. Koutroulis, E.; Blaabjerg, F. Methodology for the optimal design of transformer less grid-connected PV inverters. IET Power Electron. 2012, 5, 1491–1499. [Google Scholar] [CrossRef] [Green Version]
  34. Reddak, M. An improved control strategy using RSC of the wind turbine based on DFIG for grid harmonic currents mitigation. Int. J. Renew. Energy Res. (IJRER) 2018, 8, 266–273. [Google Scholar]
  35. Sharma, S.; Singh, B. Control of permanent magnet synchronous generator-based stand-alone wind energy conversion system. IET Power Electron. 2012, 5, 1519–1526. [Google Scholar] [CrossRef]
  36. Kean, Y.W.; Ramasamy, A.; Sukumar, S.; Marsadek, M. Adaptive controllers for enhancement of stand-alone hybrid system performance. Int. J. Power Electron. Drive Syst. 2018, 9, 979. [Google Scholar] [CrossRef]
  37. Panda, A.; Pathak, M.K.; Srivastava, S.P. A single phase photovoltaic inverter control for grid connected system. Sadhana 2016, 41, 15–30. [Google Scholar] [CrossRef] [Green Version]
  38. Reddak, M.; Mesbahi, A.; Nouaiti, A.; Berdai, A. Design and implementation of nonlinear integral back stepping control strategy for single-phase grid-connected VSI. Int. J. Power Electron. Drive Syst. 2019, 10, 19. [Google Scholar]
  39. Dyga, Ł.; Rymarski, Z.; Bernacki, K. The wavelet-aided methods for evaluating the output signal that is designated for uninterruptible power supply systems. Przegląd Elektrotechniczny 2020, 96, 50–54. [Google Scholar] [CrossRef]
  40. Rymarski, Z.; Bernacki, K. Different Features of Control Systems for Single-Phase Voltage Source Inverters. Energies 2020, 13, 4100. [Google Scholar] [CrossRef]
  41. Torrey, D.; Al-Zamel, A. Single-phase active power filters for multiple nonlinear loads. IEEE Trans. Power Electron. 1995, 10, 263–272. [Google Scholar] [CrossRef]
  42. Abd Rahim, N.; Selvaraj, J. Implementation of hysteresis current control for single-phase grid connected inverter. In Proceedings of the International Conference on Power Electronics and Drive Systems, Bangkok, Thailand, 27–30 November 2007; pp. 1097–1101. [Google Scholar]
  43. Dahono, P.A. New hysteresis current controller for single-phase full-bridge inverters. IET Power Electron. 2009, 2, 585–594. [Google Scholar] [CrossRef]
  44. Yao, Z.; Xiao, L. Control of single-phase grid-connected inverters with nonlinear loads. IEEE Trans. Ind. Electron. 2011, 60, 1384–1389. [Google Scholar] [CrossRef]
  45. Elsaharty, M.A.; Hamad, M.S.; Ashour, H.A. Digital hysteresis current control for grid-connected converters with LCL filter. In Proceedings of the 37th Annual Conference of the IEEE Industrial Electronics Society, Melbourne, Australia, 7–10 November 2011; pp. 4685–4690. [Google Scholar]
  46. Ichikawa, R.; Funato, H.; Nemoto, K. Experimental verification of single phase utility interface inverter based on digital hysteresis current controller. In Proceedings of the International Conference on Electrical Machines and Systems, Beijing, China, 20–23 August 2011; pp. 1–6. [Google Scholar]
  47. Chatterjee, A.; Mohanty, K.B. Current control strategies for single phase grid integrated inverters for photovoltaic applications-a review. Renew. Sustain. Energy Rev. 2018, 92, 554–569. [Google Scholar] [CrossRef]
  48. Jena, S.; Mohapatra, B.; Panigrahi, C.K.; Mohanty, S.K. Power quality improvement of 1-φ grid integrated pulse width modulated voltage source inverter using hysteresis Current Controller with offset band. In Proceedings of the 3rd International Conference on Advanced Computing and Communication Systems (ICACCS), Coimbatore, India, 22–23 January 2016; pp. 1–7. [Google Scholar] [CrossRef]
  49. Karuppanan, P.; Ram, S.K.; Mahapatra, K. Three level hysteresis current controller based active power filter for harmonic compensation. In Proceedings of the International Conference on Emerging Trends in Electrical and Computer Technology, Nagercoil, India, 23–24 March 2011; pp. 407–412. [Google Scholar]
  50. Yang, X.S. Nature-Inspired Optimization Algorithms; Academic Press: Cambridge, MA, USA, 2020. [Google Scholar]
  51. Gupta, S.; Deep, K.; Mirjalili, S. An efficient equilibrium optimizer with mutation strategy for numerical optimization. Appl. Soft Comput. 2020, 96, 106542. [Google Scholar] [CrossRef]
  52. Chauhan, S.; Vashishtha, G. Mutation-based arithmetic optimization algorithm for global optimization. In Proceedings of the International Conference on Intelligent Technologies (CONIT), Hubli, India, 25–27 June 2021; pp. 1–6. [Google Scholar]
  53. Chou, J.S.; Nguyen, N.M. FBI inspired meta-optimization. Appl. Soft Comput. 2020, 93, 106339. [Google Scholar] [CrossRef]
  54. Salet, R. Framing in criminal investigation: How police officers (re) construct a crime. Police J. 2017, 90, 128–142. [Google Scholar] [CrossRef] [Green Version]
  55. Fathy, A.; Rezk, H.; Alanazi, T.M. Recent approach of forensic-based investigation algorithm for optimizing fractional order PID-based MPPT with proton exchange membrane fuel cell. IEEE Access 2021, 9, 18974–18992. [Google Scholar] [CrossRef]
  56. Wang, D.; Tan, D.; Liu, L. Particle swarm optimization algorithm: An overview. Soft Comput. 2018, 22, 387–408. [Google Scholar] [CrossRef]
  57. Hasari, S.A.; Salemnia, A.; Hamzeh, M. Applicable method for average switching loss calculation in power electronic converters. J. Power Electron. 2017, 17, 1097–1108. [Google Scholar]
  58. Singh, J.K.; Behera, R.K. Hysteresis current controllers for grid connected inverter: Review and experimental implementation. In Proceedings of the IEEE International Conference on Power Electronics, Drives and Energy Systems (PEDES), Chennai, India, 18–21 December 2018; pp. 1–6. [Google Scholar]
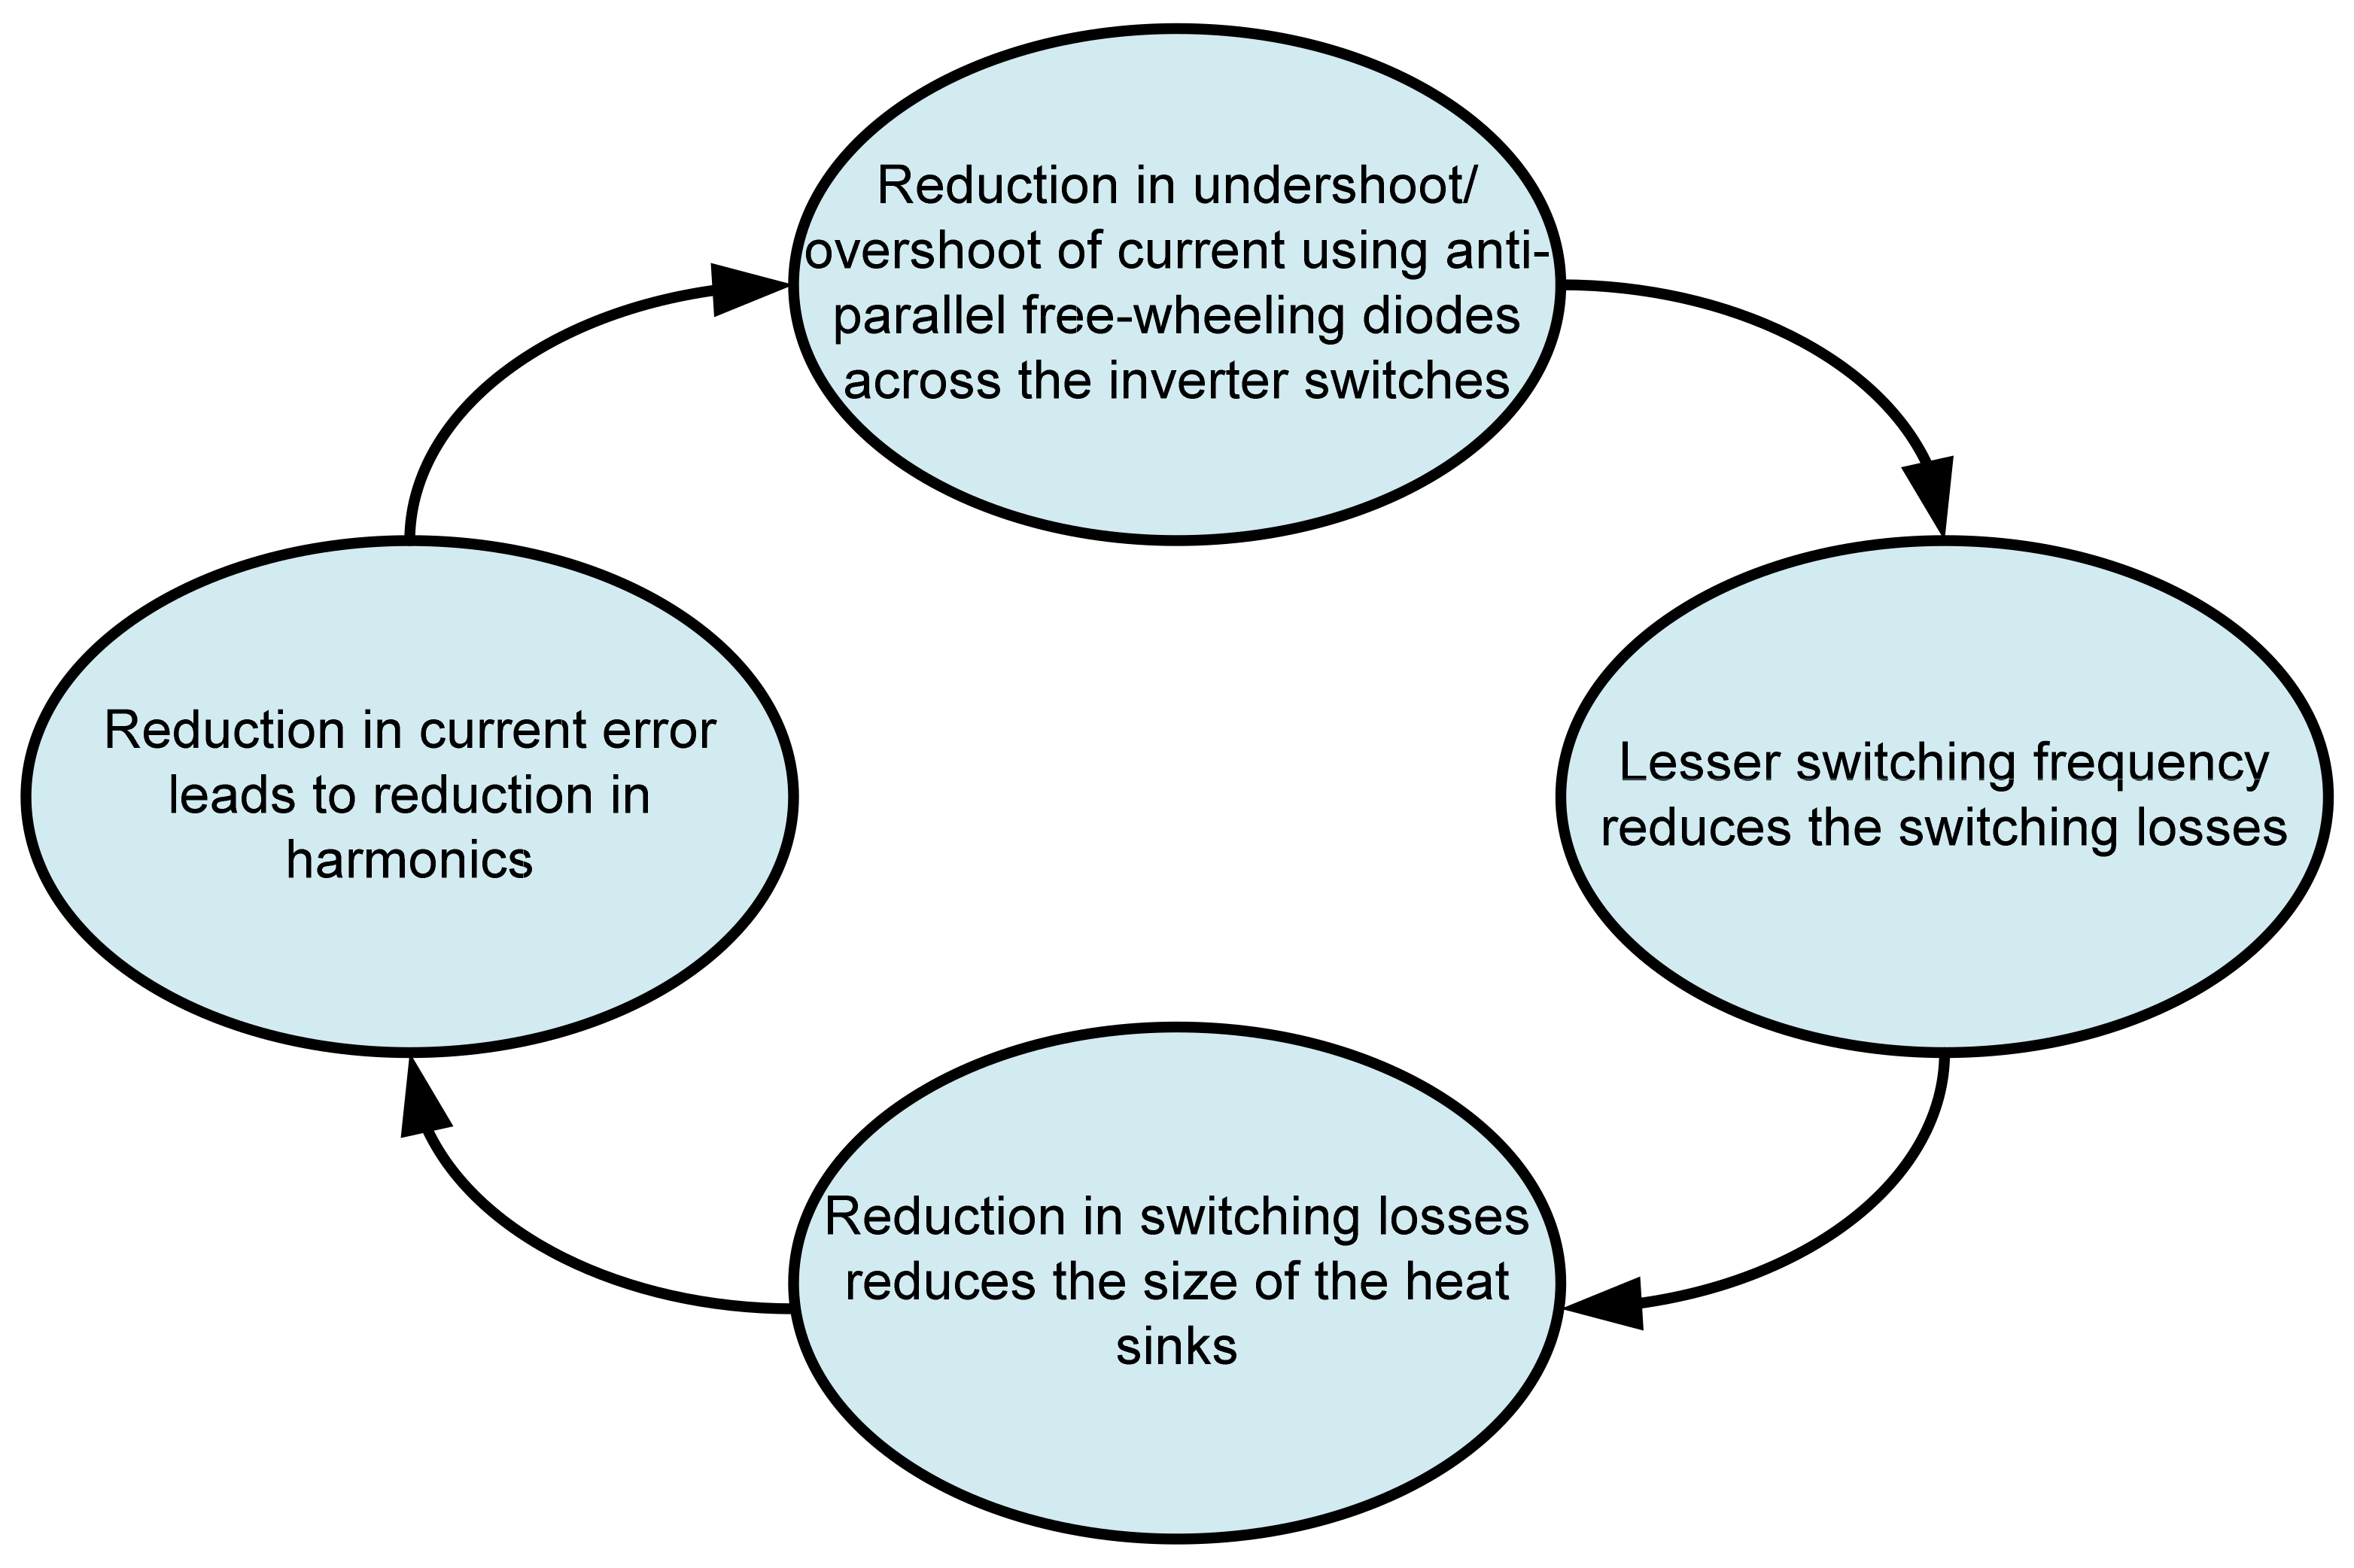
Figure 1. Advantages of offset hysteresis band current controller (OFHCC).
Energies 15 08790 g001
Figure 2. System block diagram.
Energies 15 08790 g002
Figure 3. Reference current technique algorithm.
Energies 15 08790 g003
Figure 4. Analysis of conventional hysteresis band current controller [48].
Energies 15 08790 g004
Figure 5. Analysis of offset hysteresis band current controller [48].
Energies 15 08790 g005
Figure 6. Analysis of offset hysteresis band current controller with negative inverter output [48].
Energies 15 08790 g006
Figure 7. Analysis of offset hysteresis band current controller with positive inverter output [48].
Energies 15 08790 g007
Figure 8. Switching strategy of offset hysteresis band current controller [48].
Energies 15 08790 g008
Figure 9. Convergence plots of benchmark functions. (a) Convergence characteristics of Beale function. (b) Convergence characteristics of Powell function. (c) Convergence characteristics of Matyas function. (d) Convergence characteristics of Griewank function. (e) Convergence characteristics of Eggholder function. (f) Convergence characteristics of Shubert function.
Energies 15 08790 g009aEnergies 15 08790 g009b
Figure 10. Flowchart of IAOA.
Energies 15 08790 g010
Figure 11. Experimental set-up using OPAL-RT 4510.
Energies 15 08790 g011
Figure 12. Simulation results showing Iref, Ia, and switching pulses for (a) IAOA-CHCC and (b) IAOA-OFHCC.
Energies 15 08790 g012
Figure 13. Experimental results showing Iref, Ia, and switching pulses for (a) PSO-CHCC, (b) FBI-CHCC, (c) AOA-CHCC, and (d) IAOA-CHCC.
Energies 15 08790 g013
Figure 14. Experimental results showing Iref, Ia, and switching pulses for (a) PSO-OFHCC, (b) FBI-OFHCC, (c) AOA-OFHCC, and (d) IAOA-OFHCC.
Energies 15 08790 g014
Figure 15. Simulation results showing Iref, Ia, and switching pulses under load change for (a) IAOA-CHCC and (b) IAOA-OFHCC.
Energies 15 08790 g015
Figure 16. Experimental results showing Iref, Ia, and switching pulses under load change for (a) IAOA-CHCC and (b) IAOA-OFHCC.
Energies 15 08790 g016
Figure 17. Simulation results showing current error for PSO-CHCC, FBI-CHCC, AOA-CHCC, and IAOA-CHCC.
Energies 15 08790 g017
Figure 18. Simulation results showing current error for PSO-OFHCC, FBI-OFHCC, AOA-OFHCC, and IAOA-OFHCC.
Energies 15 08790 g018
Figure 19. Experimental results showing current error for PSO-CHCC, FBI-CHCC, AOA-CHCC, and IAOA-CHCC.
Energies 15 08790 g019
Figure 20. Experimental results showing current error for PSO-OFHCC, FBI-OFHCC, AOA-OFHCC, and IAOA-OFHCC.
Energies 15 08790 g020
Figure 21. Harmonic spectra for (a) PSO-CHCC, (b) FBI-CHCC, (c) AOA-CHCC, and (d) IAOA-CHCC.
Energies 15 08790 g021
Figure 22. Harmonic spectra for (a) PSO-OFHCC, (b) FBI-OFHCC, (c) AOA-OFHCC, and (d) IAOA-OFHCC.
Energies 15 08790 g022aEnergies 15 08790 g022b
Figure 23. Bar plot of various performance indices for different controllers.
Energies 15 08790 g023
Figure 24. Experimental waveforms under partial shading of VPV, VO, and IO curves.
Energies 15 08790 g024
Figure 25. Experimental waveforms under partial shading of VGrid, IInv, ILoad, and IGrid curves.
Energies 15 08790 g025
Table 1. Description of benchmark functions used in the study.
FunctionFunction’s ExpressionDimensionRange
Beale (F1) f x = 1.5   x 1 + x 1 x 2 2 + 2.25   x 1 + x 1 x 2 2 2 + 2.625   x 1 + x 1 x 2 3 2 2[−4.5, 4.5]
Powell (F2) f x = i = 1 d 4 x 4 i 3 + 10 x 4 i 2 2 + 5 x 4 i 1 + x 4 i 2 + x 4 i 2 2 x 4 i 1 4 + 10 x 4 i 3 x 4 i 4 10[−4, 5]
Matyas (F3) f x = 0.26 x 1 2 + x 2 2 0.48 x 1 x 2 2[−10, 10]
Griewank (F4) f x = i = 1 d x i 2 4000 i = 1 d cos x i i + 1 30[−600, 600]
Eggholder (F5) f x = x 2 + 47 sin x 2 + x 1 2 + 47 x 1 sin x 1 x 2 + 47 2[−512, 512]
Shubert (F6) f x = i = 1 5 i cos i + 1 x 1 + i i = 1 5 i cos i + 1 x 2 + i 2[−5.12, 5.12]
Table 2. Performance analysis for AOA and IAOA algorithms.
AlgorithmFunctionOptimum ValueMinimumMaximumMeanStandard DeviationComputational Time (s)
IAOAF103.5828 × 10−161.9598 × 10−134.2215 × 10−144.9633 × 10−140.0834
AOA1.0785 × 10−157.7380 × 10−138.6741 × 10−141.7924 × 10−130.0595
IAOAF2002.6215 × 10−208.7385 × 10−224.7863 × 10−210.0766
AOA06.5352 × 10−182.2641 × 10−191.1925 × 10−180.0563
IAOAF3001.1962 × 10−633.9877 × 10−652.1840 × 10−640.0542
AOA05.6773 × 10−631.8930 × 10−641.0365 × 10−630.0423
IAOAF4000000.6315
AOA00000.5263
IAOAF5−959.640−959.4607−959.4607−959.46071.0283 × 10−120.0457
AOA−959.4607−959.4607−959.46072.0283 × 10−120.0133
IAOAF6−186.731−186.7309−186.7309−186.73011.4597 × 10−90.0958
AOA−186.7309−186.7305−186.73098.2884 × 10−40.0757
Table 3. System parameters.
ParameterNumerical Value
Grid frequency50 Hz
Line inductance15 mH
Irradiance500 W/m2
E on 2.2 mJ
E off   1.7 mJ
Cell temperature25 °C
Load variation1000 W to 2000 W
Table 4. Performance analysis of various controllers.
ControllerDHB1HB2HB3HB4MaxSF
(in kHz)
MinSF
(in kHz)
AvgSF
(in kHz)
AvgSFL
(in W)
ZSF
(in kHz)
%THD
PSO-CHCC0.2150.375−0.572--9.258.757.8530.608.500.49
FBI-CHCC0.3190.462−0.868--8.756.257.5829.568.000.54
AOA-CHCC0.1690.620−0.587--7.253.255.5021.486.500.57
IAOA-CHCC0.2450.809−0.932--6.253.755.3020.675.750.74
PSO-OFHCC0.2790.953−0.8740.874−0.95363.503.8715.094.250.73
FBI-OFHCC0.1120.913−0.8270.827−0.9135.52.502.8911.263.250.68
AOA-OFHCC0.1410.817−0.6450.645−0.81762.752.6810.463.750.82
IAOA-OFHCC0.1170.964−0.5320.532−0.9646.252.752.339.073.501.45
SBHCC [58]-0.5−0.5--20----4.42
DBHCC−1 [58]-0.5−0.5--10----4.33
DBHCC−2 [58]-0.5−0.5--20----2.65
MDBHCC [58]-0.5−0.5--5.5----4.33
VBHCC [58]-0.5−0.5--15----4.17
Publisher’s Note: MDPI stays neutral with regard to jurisdictional claims in published maps and institutional affiliations.