Abstract
In recent years, numerous projects for floating PV systems have been developed. These plants of various sizes have mainly been installed on enclosed lakes or basins characterised by the absence of external forcing related to waves and currents. However, offshore installation would allow the development of such plants in areas where land is not available, such as islands. This paper analyses the state of the art of floating PV, describes the design of a floating PV platform and the development of a numerical model to evaluate the system performance in an offshore environment. The case study of the island of Lampedusa is then analyzed: starting from a single floating foundation with its mooring system, a floating PV system is designed to meet the island’s electricity needs. In order to provide the competitiveness of the system, a techno-economic analysis is carried out, evaluating the main cost items of Capex, Opex and LCOE. Although the LCOE obtained is significantly higher than a traditional solar plant installed on land, this technology is competitive compared to other offshore marine technologies such as offshore wind and wave energy.
1. Introduction
The Paris Agreement, signed by 190 countries on 12 December 2015, represented the first-ever global climate change agreement to pursue climate neutrality before the end of the century. The primary long-term goals are to keep the global average temperature above 2 °C compared to pre-industrial levels, limiting the increase to 1.5 °C [1]. This would significantly moderate the risks and impacts of climate change.
In line with the commitment to global climate action under the Paris Agreement and to reduce greenhouse gas emissions, renewable energy sources are necessary.
Wind and solar power are renewable sources with the most remarkable growth in the last decade. At the end of 2020, the global installed capacity of solar PV power reached 843 GW, representing 18.7% year-on-year growth compared to 2019 (710 GW) [2]. The main reasons for this considerable development are the abundant resource, the market in continuous and rapid expansion and the cost reduction. Consequentially, solar PV is expected to continue growing, reaching a global cumulative capacity of 2840 GW by 2030 and reaching 8519 GW by 2050 [3].
In 2020, the global solar market was dominated by Asian countries, accounting for over half of the world’s additional solar capacity [4]. According to the International Energy Agency (IEA) Renewable 2021 report [5], the installed capacity reached 434 GW, of which 253.4 GW in China. The European Union, with 136.8 GW of cumulative installed power, and North America with 103.6 GW, of which the United States accounted for 90%, are respectively the second and third world’s largest solar PV market.
Currently, forecasts see China dominating solar PV installations, where installed capacity is projected to reach around 603 GW in 2025 and 1412 GW by 2030, followed by North America, led by the United States with 229 GW in 2025 and 437 GW by 2030 [3,5]. Europe, with 291 GW of solar PV capacity installed, would represent the third-highest region by 2030 [3]. Furthermore, market growth seems to emerge in South America and Africa.
Along with capacity additions, the repowering process, which consists of replacing solar panels at the end of their life, plays a key role. The growth of global PV market will increase the volume of decommissioned PV panels. According to the report by IRENA [6], cumulative global PV waste streams had reached 43,500-250,000 metric tonnes in 2016: annual capacity additions are expected to double by 2030 compared to today and specific waste regulations are urgent.
1.1. Cost Reduction
Solar PV is emerging as one of the most competitive renewable sources thanks to considerable cost declines. According to the IRENA report “Renewable Power Generation Costs in 2020” [7], the Levelized Cost Of Energy (LCOE) of large scale PV plants decreased by 85%, from USD 0.381/kWh in 2010 to USD 0.057/kWh in 2020. Based on this consolidated trend, in 2050 solar PV is expected to be among the cheapest renewable sources, in the range of USD 0.014–0.05/kWh [3]. The reduction in solar PV modules have driven costs: between 2009 and 2020, modules prices fell between 89% and 95% for crystalline silicon modules [7].
At the same time, utility-scale plant productivity has grown: the global weighted-average capacity factor increased from 13.8% to 16.1% between 2010 and 2020, due to technological improvements, such as the combined effect of evolving inverter load ratios, a shift in average market irradiance, the use of trackers, and the adoption of bifacial technologies [7].
1.2. Floating PV
However, these analyses do not consider floating PV technology, which remains negligible as regards the global production of electricity but constantly rising.
The term floating PV (FPV) may refer to any PV system installed on water bodies, such as lakes, reservoirs, hydroelectric dams, industrial and irrigation ponds. Global FPV deployment has increased over the past decade, reaching a cumulative global capacity of 2.6 GW in 2020 [8], with a large part of the installed power located in China, Taiwan and Japan.
The first FPV system, with 20 kW of nominal power, was built in 2007 in Aichi, Japan [9]. Since then, many such projects have been installed, primarily for research and demonstration purposes, and then moved on to pre-commercial purposes. Beginning in 2013, FPV installations more significant than 1 MWp emerged. Large FPV plants, from tens and hundreds of megawatts, are being installed or planned especially in China, Southeast Asia, and India [10].
FPV plants open up new opportunities thanks to several advantages that would lead floating solar to become the third pillar of solar PV, integrating ground-mounted plants and rooftop PV.
The main advantages are summarized in [10,11,12,13]:
- No land occupancy: using water surfaces to install photovoltaic solar systems allows two significant benefits. First is an economic issue since installing photovoltaic systems in water basins avoids the higher costs of buying or renting the land. A second reason is the limited impact on the landscape due to reduced surface occupancy. The savings in land consumption are more evident for small states with a high population density, especially in east Asia.
- Use of hardly accessible land: ground-mounted PV are onerous to deploy in mountainous regions where floating systems can be set up on lakes or reservoirs.
- Water saving: a non-negligible aspect for an FPV system is the reduction of the evaporation phenomenon. It allows for saving many thousands of cubic meters of water per year [14,15]. Moreover, in a hydroelectric power plant or in a reservoir, the coverage provided by floating panels reduces the solar radiation reaching the water and limits the evaporation process.
- Water quality: the partial coverage of the basins induces a reduction of light on biological fouling below the surface and may solve the problem of algae blooms, while reducing the cost of treating water [16]. However, the covered surface by floating panels should be limited in natural lakes with an ecosystem consisting of fish and marine flora, to avoid adverse environmental impacts of blocking sunlight.
- Increased energy production efficiency: deploying PV on water surfaces gives essential advantages in performance [17]. The operating temperatures of PV modules can be lowered by the evaporative cooling effect from water. Since elevated module temperatures constitute a significant loss for PV systems, the energy yield of a PV system could increase significantly due to a temperature reduction [18].
- Tracking systems: implementing a tracking system would allow to increase the productivity of the panel with a gain in energy yield from 15 to 25%.
- Radiation balance: land-based PV plants modify the land albedo. The water albedo is about 5%, while land albedo ranges significantly (20% for grassland, 20–30% for roofs and 40–50% for desert land). Since PV modules are built to reduce the radiation reflection, the PV modules albedo is similar to the water albedo, around 5% [19].
- Installation and decommissioning: the infrastructure of a floating solar PV system has a lower impact than the traditional solar plants installed on the ground because it is easy to install and equally easy to dismantle. Typical floating platforms are modular, typically small floats interconnected with each other, easily assembled on land and then installed. The lack of fixed structures and the reversibility of the mooring are significant benefits, unlike the land-based foundations, more invasive and permanent.
- Coupling with hydroelectric power plants: dry seasons with less water flow usually correspond to periods of high solar insolation. A hybrid system would reduce seasonal variations in power production [20,21].
In order to encourage the development of FPV technology and to make preliminary assessments for installation sites, it is essential to achieve improvement of accurate, precise and computationally fast numerical models.
The aim of the study is to describe a numerical model of a floating PV system, developed in the Matlab-Simulink environment, to evaluate the dynamics and simulate the system displacements. The model considers different types of floating platforms, implements mooring systems according to the installation site and considers specific weather and sea conditions associated with wind and wave motion. The numerical model is used for the preliminary design of a floating PV system to be installed near the island of Lampedusa: the platform behaviour is evaluated for the three most common combinations of wave height, period and wind speed.
Subsequently, a floating PV system is sized to meet the electricity requirements of the island and to investigate its competitiveness, a techno-economic analysis is carried out, considering the main cost items of the Capex, the Opex and evaluating the LCOE.
The paper is organized as follows: in Section 2, the state of the art of floating PV is reported, describing the main parts of a FPV system, such as the floaters and the mooring system and focusing on the main challenges for offshore applications. In particular, Section 2.1 describes the main floating PV structures; Section 2.2 the mooring system layouts; Section 2.3 the marine applications of floating PV systems and commercial projects; Section 2.4 design considerations for offshore projects; Section 2.5 loads and limit states for design procedure; Section 2.6 risk and challenges in offshore applications. In Section 3, the numerical model of a floating PV system is illustrated: in Section 3.1, the hydrodynamics is described, while in Section 3.2, the aerodynamics; in Section 3.3, the mooring design is considered for simulations. Section 4 is related to the Lampedusa case study: in Section 4.1, there is the geographical context and the definition of three main sites considered; in Section 4.2, the design procedure of the floating support structure is reported, while in Section 4.3, the mooring layouts for the installation sites are described; in Section 4.4 the environmental loads used for simulations; in Section 4.5 the dynamic response of a single floating platform is reported. The techno-economic analysis of a FPV plant is illustrated in Section 5: in particular, the platform material cost is analyzed in Section 5.1, the photovoltaic panel cost in Section 5.2; the power output of the plant is provided in Section 5.3, while Capex and Opex are reported in Section 5.4; Section 5.5 shows the LCOE of the power plant. Finally, Section 6 provides the discussion while Section 7 presents the conclusion and further works.
2. State of the Art in Floating PV Applications
An FPV system consists of different floats or pontoons that support solar panels and are rigidly fixed with a mooring and anchoring system.
Figure 1 shows a configuration with the infrastructure needed for a utility-scale FPV system and the connection to the power grid.
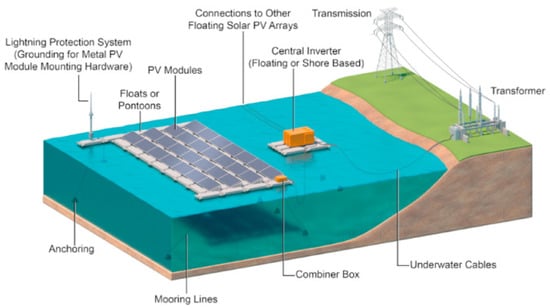
Figure 1.
Representation of an FPV system, adapted from [22].
In a PV modules the solar radiation is converted into electricity through the photovoltaic effect. Floating modules are similar to land-based modules and can be crystalline or glass–glass modules, with a lower permeability of water that protects the panels from internal corrosion [23].
PV panels are mounted on a support structure, typically with a fixed tilt: however, variable tilt angle solutions have been developed due to a sun tracking system to maximize productivity. Photovoltaic panels are installed on floating platforms, made of plastic (usually high-density polyethylene, HDPE, for freshwater applications), stainless or galvanized steel. These modular platforms can be connected with pathways for operation and maintenance operations.
In order to keep the floating structure in a fixed position, the platforms are anchored to the shore or to the seabed with mooring lines. The number of moorings and the layout is strictly connected to the installation site and meteomarine conditions for offshore installations. The design depends on the subsea conditions of the site, especially on the type of seabed, whether rocky or sandy, that strongly influence the type of anchor. Moorings can be made of steel chains, steel wires or synthetic ropes (nylon or polyester), while anchors are made of concrete ballasts or piles.
The system is connected to one or more inverters depending on size and design. FPV installations of larger capacities can be developed in different layouts: they can be centralized or divided into sub-PV arrays. In the first case, centralized inverters with a relatively high capacity, typically 1 MW, are required. In the second configuration, each sub-PV array is connected to single inverters, called string inverters, with a capacity of about 10 kW. The inverters, used to convert the direct current, DC, from the modules to grid-compatible alternating current, AC, can be installed on a floating platform or inland, but since electricity transmission is much less efficient in DC form, it is convenient to have inverters installed directly on the floating platforms.
Underwater cables connect the system to the transformers depending on the installation site. Transformers usually reside onshore for more accessible O&M activities [22].
2.1. Floating PV Structures Classification
Numerous projects over the last few years have led to the development of different floating structures characterized by different designs and materials based on the installation destination. In order to provide standardization, in 2021, DNV published the recommended practice DNV-RP-0584 [24], where the floating structure are classified into three main types:
- Pure floats, where PV modules are mounted directly on the floats;
- Modular rafts, where the panel is supported by a structural framework connected with the floater;
- Membranes, where panels are attached to a reinforced membrane, are supported by a tubular ring providing buoyancy.
In Figure 2, the three main types of FPV structures are reported.
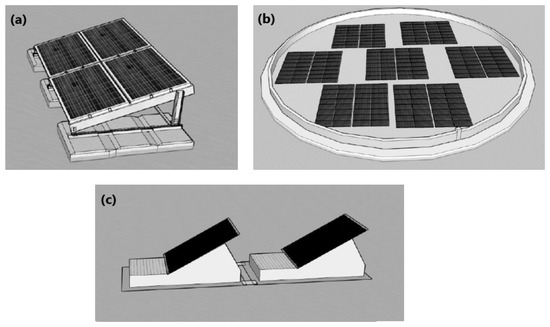
Figure 2.
Classification of FPV structures: (a) Modular raft, (b) Membranes, (c) Pure float. Adapted from [24].
However, other classifications are possible. In [25,26], the authors identify three classes:
- Class 1: Large-dimension rafts made of high-density polyethene (HDPE) pipes plus steel, aluminium or composite components;
- Class 2: Full HDPE rafts, mono-modules of small dimensions connected by suitable hooks;
- Class 3: Floating pontoons.
The following sections will consider some significant projects for each class type.
2.1.1. Class 1
An example of an application with the Class 1 technology is the platforms installed at Buksin Bay, Korea, in December 2009 [27]. The system is made of 16 PV panels installed on a structure composed of two parts: a structural element that supports the PV panels, made of pultruded FRP members, connected throw the stainless steel bolts. The use of stainless steel for bolts, nuts and washers aims to prevent from corrosion due to salty water. The second part is the floating platform, which supports the structural part and the panels. The floater is made of polyester plastic pipes reinforced with filament winding E-glass, while the inside of the pipe is not empty but filled with Styrofoam to prevent the loss of buoyancy in case of damage [28].
Another example is the Suvereto project by Terra Moretti and Koin’e, a 200 kWp plan grid connected since 2011, which was installed for 9 years [11]. In 2013 a tracking system was added, increasing the energy yielded, and since the structure is still in excellent condition, it is planned to increase the plant’s capacity to 450 kWp using the new panels now available. Again, HDPE pipes have been used that run along the entire structure, and transversely, walkways are attached that provide access to the various parts of the facility for O&M activities.
A representation of a class 1 structure is shown in Figure 3.
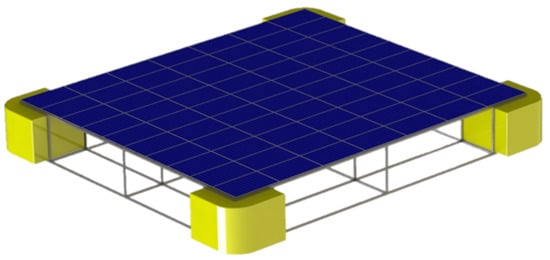
Figure 3.
Schematic of a FPV panel from class 1.
2.1.2. Class 2
The second class was proposed by Ciel & Terre, which is suitable for freshwater applications [9]. This solution, made of small HDPE rafts, has been highly appreciated by the market: in 2016–18, several hundreds of MWp were installed in China and South-East Asia.
The major limit of this technology is the floater lightness: being so light and having the mechanical connections between the various rafts made of HDPE, the stress to which the structures are subjected could be excessive even in conditions of little wind or waves, with the risk of damaging the individual rafts or the entire structure [29].
Another problem with these structures is that the contact between water and plastic is very high, about 50% of the entire surface of the plant: that leads to possible problems related to long-term plastic defoliation. Moreover, due to the reduced structure stiffness, the design of the mooring system is highly complex: to fix the platform many cables are required, not only along the perimeter but also under the structure area. However, the advantage of class 2 structures is the reduced overall cost.
Among the most significant projects completed is the 70 MWp FPV system in the province of Anhui, China, located in a former coal-mining area. The FPV system has been connected to the national grid and is expected to generate up to 77,693 MWh per year [15].
2.1.3. Class 3
One example of class 3 structures is the platform developed by the German company BayWa r.e. [30]. The design aims to maximize the strength of the structure while minimizing cost and environmental impact [11]: the floats are made of plastic material that complies with environmental regulations to avoid the risk of releasing microplastics into the water. They have been designed to minimize the surface area in contact with the water to avoid excessive algae growth and allow free water passage so as not to accumulate debris.
The floats are connected to a stainless steel structure, which keeps material costs low by ensuring mechanical and corrosion resistance, while photovoltaic panels are installed on the structure, 12 per platform. Along one of the front sides of the platform, between the two floats, is a gangway used for O&M activities. These platforms are designed to be modular, and by connecting several platforms in sequence, the walkways form long paths that allow each array panel to be worked on easily.
The first plant was completed in Weperpolder, The Netherlands, in December 2018. It covers an area of 1.45 ha with 5752 photovoltaic panels (365 Wp) and a capacity of 2.1 MWp [31]. Other projects have been developed subsequently, including the Sekdoorn project, in the Netherlands, built in six weeks, from August to October 2019. This project has a nameplate capacity of 14.5 MWp, with an annual output of 13,330 MWh, making it the largest floating PV plant outside of China for a short time. The latest installation, completed in March 2020, has a nameplate capacity of 27.4 MWp, with an annual production of 24,770 MWh. It is one of Europe’s largest floating photovoltaic parks [32].
2.2. Mooring System
A mooring system keeps the FPV system in position with an acceptable range of movement and contrasts the action of wind, waves and currents [33]. The aim is to prevent the risk of damage to the structure itself or surrounding structures without causing excessive stress to the structure itself. Moreover, the mooring system should prevent potential damage to the electrical connection.
The mooring design should also consider transmitting the loads from the floating structure to the ground. The best mooring system strictly depends on the design of the FPV plant: to minimize the loads on the mooring system, it would be possible to connect each platform to the mooring system, but the system would increase in complexity and thus cost. Conversely, a few mooring points would require high stiffness and robust mooring systems, increasing the load transferred throughout the floating structure [34].
As mentioned above, in addition to keeping the plant in position, the mooring system must also ensure that the structure can move vertically along heave, due to changes in the water level. The optimal number of moorings for each floating platform design will be the one that provides the best stability and the lowest cost of energy production: this depends on the type of floating structure, the plant dimensions, the water depth, and the environmental loads.
A general classification of mooring systems is rigid, taut, catenary and compliant [35] and it is reported in Figure 4.
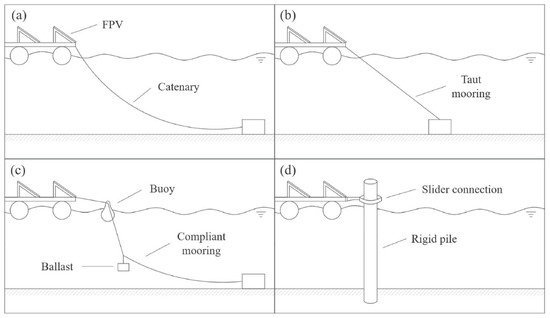
Figure 4.
Mooring layouts: catenary (a), taut (b), compliant (c) and rigid (d) mooring, adapted from [25].
2.2.1. Catenary Mooring
This mooring configuration exploits the self-weight of the catenary to provide a variable vertical and horizontal spring rate to the float [36]. Because catenary mooring allows horizontal loads on the float, the choice of anchor can be influenced by the size of the loads. The design of a catenary mooring, length and weight, depends on the site depth and the environmental conditions.
2.2.2. Taut Mooring
It consists of cables, which are kept in continuous tension by exploiting excess buoyancy of the floating platforms: the cables are fixed to the ground throw anchors such as piles or clump weights. In this configuration, the cables are usually placed vertically underneath the plant, which has the advantage that it allows a slight horizontal movement of the structure. Moreover, the restrained cost of cable makes it suitable deep water installations. The disadvantage concerns the vertical movement: in case of significant variations along the heave, the cables become loose, and the structure can drift. However, by varying the inclination of taut moorings, the relative constraint between the vertical and horizontal motions of the floats can be changed [36]. Using polymer fibre cords instead of traditional steel cables makes it possible to take advantage of a small amount of material elasticity to avoid resonant frequencies and to mitigate structural loads [37].
2.2.3. Compliant Mooring
It consists of weights or floats attached to the mooring cables between the floating platform and the anchorage point on the bed [35]. Compliant mooring systems are usually made of catenaries but can generally be deployed with a shorter length: they require the use of weights to reduce disturbances to the bottom of the floater due to more fixed mooring lines.
2.2.4. Rigid Mooring
In this configuration, the heave motion is allowed by the rotation of one or more connecting arms or translation along a vertical column [36]. These solutions are standard for pontoons and used in case of small motion. Moreover, it is also possible to connect the floating system directly to the shore through rigid systems: however, this is not always possible because the loads acting on the installation are often parallel to the coast, and this would cause an excessive bending moment on the anchor due to the long distance between the plant and the coast. Another rigid mooring can be achieved by the installation of piles: in this way, the FPV system can rotate around it to track the sun [36]. This type of mooring is only used in shallow water basins due to the significant pitch and roll moments that can be generated in deeper water [25].
2.3. Floating PV: Marine Applications
Due to the rapid spread of floating PV, the market is looking for new development sectors, including the marine environment. The transition of FPV systems from closed lakes, dams and reservoirs to marine contests will be carried out first for sheltered nearshore locations and moving then for offshore installations. However, the proximity to the coast might imply severe conditions for the structure: specific morphological conditions of the coast may increase the size of incoming waves, for example, due to reflected waves [36].
Moreover, the presence of waves may generate excessive loads on the system, increasing costs by requiring more resilient design of the materials and moorings. In addition, the corrosion generated by saltwater on electrical structures and components must be taken into account. For these reasons, it is not possible to directly use technologies developed for systems installed in fresh water for marine applications. However, due to the vast potential to exploit, many commercial projects are emerging, with numerous companies becoming interested in marine PV.
Swimsol, a pioneer in the study of FPV applications in the marine environment, has developed the Solarsea platform [38]. It has an aluminium structure and floats thanks to a semi-submersible styrofoam floater. In the Solarsea 1500 model, the photovoltaic panels are installed with a 10° tilt angle. Swimsol has developed these technologies in collaboration with Wien University of Technology and has already completed several projects on the Maldives islands [39]. In 2016, the first modular solar plant, with a capacity of 96 kWp, provided cheap, clean energy to a residential island.
DNV has developed a concept named Sunday [40], with a hexagonal shape, which floats on the ocean’s surface. Each platform has a rated capacity of 2 MW and can be arranged individually or coupled with others to form a multi-MW facility. The Sunday concept consists of 560 W solar panels: the use of thin-film panels, more flexible and lighter than the glass-based modules, allow them to undulate with the ocean’s surface, while contributing to minimize wave-induced loads. In order to moor this kind of structure, a tension-only mooring design is necessary: the spider-web structure is able to oppose high external loads acting upon it, and the hexagonal geometry of cables minimizes the number of anchors. Below the surface, the island’s shape is maintained by the use of spread mooring [41].
In February 2018, a Consortium made of Energy Research Center of the Netherlands, Maritime Research Institute Netherlands (MARIN), the Netherlands Organization for Applied Scientific Research and Oceans of Energy, a spin-off of Delft University of Technology, launched together another FPV offshore project of an 8.5 kW pilot installation. The modular FPV system operated since 2019, and has already withstood several storms, including the “Ciara” storm with maximum wind speeds up to 62 knots, 5 m waves and 2 knots sea currents in February 2020 [42]. The plant doubled in size in January 2020 with additional modules, from 28 to 56 modules reaching a nominal power of 17 kW.
Heliofloat [43], a spin-off of the TU Wien, has developed a novel concept of a marine platform, where the buoyancy is guaranteed by cushions filled with air, which make the structure float on the water. The air cushions are built in lightweight material to increase buoyancy. The flexible membrane and the air cushion also reduce wave excitation, which, coupled with a light structure, maximizes the stability against waves and weather. Once the platform is pulled out into its final destination, the supporting air chambers are filled with a blower to lift the platform 10 to 15 m above sea level. The Heliofloat platform is scalable and can reach a side length of 300 m. This concept was designed to minimize the impact on the local fauna and flora life, as the sunlight is not blocked from passing through the water due to the transparent material used.
The Norwegian company Ocean Sun [44] has developed a system made of a circular structure: the outer circular structure is composed of a floating ring made of HDPE, which reduces problems that could otherwise occur if unfavourable winds and repeated waves hit the broadside of rectangular structures. A mat is placed in the centre, a disk-shaped floating membrane used by Ocean Sun to enhance the structural integrity. On the mat, the PV modules are attached. The membrane thickness is about 1 mm, so the panels and the water are in direct contact, which contributes significantly to heat dissipation and increases efficiency [45].
Recently, Saipem and Equinor signed a cooperation agreement to develop a technological solution for a fleet of floating solar panels suitable to be installed near the coast. The floating technology, developed by Moss Maritime, has been recently tested by Sintef Ocean [46].
2.4. Design Considerations for Marine Applications
Since these systems will be located in a hostile environment, the design for marine applications is a complex process because the correct operation should be guarantee throughout the system’s lifecycle under extreme conditions (waves, winds, currents, salinity). The main aspects that need to be considered to ensure the proper long-term operation are summarized below:
- Resistance: due to significant interactions between the floaters and moorings caused by the environment loads, the system stability should be guaranteed. Additionally, oil and gas know-how and offshore wind experience indicate that large floating structures could be damaged due to extreme events [23].
- Reliability and maintainability: FPV installations are subjected to cyclic loads that can weaken the structure due to fatigue. The most stressed points are the connection points between the various platforms and the mooring lines. Moreover, it is necessary to consider the degradation due to the corrosive action of salt water, which tends to weaken the structure and shorten the average life of the system. Therefore, it is essential to ensure easy access to the system and place the most critical parts in an appropriate position for inspection [26,47].
- Overall power performance: the FPV movement should be taken into account, to avoid energy losses due to uneven sunlight reaching modules on the exact string [23]. Low-capacity inverters could be installed on each platform to limit this problem, where it is assumed that all panels receive the same amount of solar radiation.
- Modularity: to become economically viable, a marine FPV must produce as much power per square meter as possible, and this means optimizing space to accommodate more panels on the platform, as well as using panels with a higher power rating per unit area. Moreover, FPV design should consider the system’s scalability by implementing a platform modularity concept, which allows a multi-MW system to be customized as needed [48].
- Environmental footprint: the significant extension of FPV systems can potentially cause adverse effects on marine life: accurate environmental impact needs to be performed.
2.5. Loads and Limit States for Design
Marine structures are subjected to different loads throughout their life: permanent, operational, environmental, installation and accidental. Most of these loads are generated by environmental conditions and can be predicted by historical data from public databases such as ECMWF ERA5 [49]. The main elements to consider are the following: wind, waves and currents, temperature and solar irradiation [26,50]:
- Wind: it is the predominant external factor, generates lift and drag forces on the FPV system, as well as dynamic loads.
- Waves: waves are intrinsically related with wind: when the wind blows, it perturbs the sea surface by friction and pressure variations, generating waves. In case of a large FPV system, due to the many interconnected floaters, the hydrodynamic interaction between individual floaters must be considered.
- Currents: currents are associated to lateral loads or drag forces, which can give rise to vortex-induced vibrations.
- Solar irradiation: the energy production can be classified into two primary forms: global horizontal irradiation (GHI) and direct normal irradiance (DNI), measured in kWh/m2 [51]. Starting from these data and considering the panel’s efficiency, it is possible to estimate the annual energy produced.
- Temperature: the temperature of the surrounding environment influences the loss transmissions due to heat generated.
2.6. Risk and Challenges
Despite the strong interest in marine FPV, many gaps should be filled to become a cost-effective source of Marine Renewable Energy (MRE): among the most urgent there are the mooring and the anchor layout, the logistics and the marine operations, the efficiency of the solar modules, the materials and durability, the resource intermittency and the competition with other MRE, such as offshore wind and wave energy.
Mooring systems counter the wave, wind and current loads, keeping the floating PV systems stationary [26]: balancing the exigence of robust mooring systems and reducing Capex and O&M costs is critical. Traditional mooring layouts have proved their reliability for O&G, offshore wind and WECs applications, but with a high-cost investment. Given the different nature of FPV systems and the fact that the number of mooring lines and platforms is much higher, the implementation of new materials and technological solutions plays a crucial role in improving the effectiveness cost ratio of the configurations.
The assembly and installation of structures in open sea environments involve complex offshore activities such as towing, maneuvering and positioning heavy structures. The FPV sector can take advantage from offshore sectors in order to define the most appropriate solutions in terms of safety and savings in operations: to existing regulations on the planning and execution of marine operations, such as DNV-OS-H101 [40], as well to specific FPV standard, such as DNV-RP-0584 [24].
Another challenge is related to the design of the structure and materials: the materials must satisfy structural requirements throughout the proper lifecycle of the plant, such as resistance to salt water, humidity, and environmental stress cracking. Furthermore, the presence of salt could increase the corrosion of the system and compromise its efficiency.
The theoretical tilt angle is related with the site’s latitude but can be influenced by parameters such as soiling and shading [23,40]. Higher tilted angles determines minor soiling but increased self-shading. However, a lower inclination of the panels would lower the wind loads, as the force of the wind is directly related to the angle between the wind direction and the exposed area. The mass construction of these platforms would be very cost-effective in reducing manufacturing costs, even if they would not be optimized for each location.
FPV systems need to compete with other MRE, so the technologies must develop to be cost-competitive: it will therefore be necessary to develop marine FPV technology to reduce LCOE to values comparable to those of other marine renewable sources.
3. Numerical Model
To study the behaviour of MRE technologies, it is essential to resort to numerical models reliable, robust and computationally fast as possible. Numerous numerical models have been developed for offshore wind, as reported in [52,53,54], and similarly for wave energy [55,56,57].
Several studies on floating PV systems have been conducted in recent years and have concerned important aspects to allow their development: in [17], the influence of floating-tracking PV is considered in order to implement the system efficiency; in [58], the cooling effect is investigated, showing an annual energy increase up to 6% of a FPV system; in [59], the CFD is used to quantify the cooling effect achieved by PV modules deployed on a water body.
One of the most relevant aspects concerns determining the environmental loads acting on floating platforms in offshore conditions: most studies use CFD analyses or analytical formulation. In [60], wind loads acting on floating PV platforms have been simulated using two codes, PLUTO and Flow Simulation; in [61], wind loads on FPV arrays were measured by experiments, showing that the first and last rows of panels present the highest drag and lift coefficients, due to the fact that they were the first to encounter the wind. These coefficients gradually decreased due to the sheltering effect in subsequent rows; in [62], the dynamic response of the mooring lines and the displacement of a 2.14 MW FPV array is investigated; in [63], the dynamic response of a FPV system with a vertical pontoon was studied through Orcaflex software, with an accurate analysis to the mooring system; in [50] a methodology is presented to calculate wind, waves and current loads using analytical formulas.
The use of simplified numerical models, based on Boundary Element Momentum theory, characterized by reduced computational times, unlike CFD models, allows to make preliminary assessments on the feasibility of installation sites.
In this study time-domain simulations are performed with an in-house model developed in Matlab-Simulink and WEC-Sim [64], an NREL open-source tool which is used to simulate the floater hydrodynamic and mooring loads. As shown in Figure 5, the numerical model is made of several blocks, which simulate:
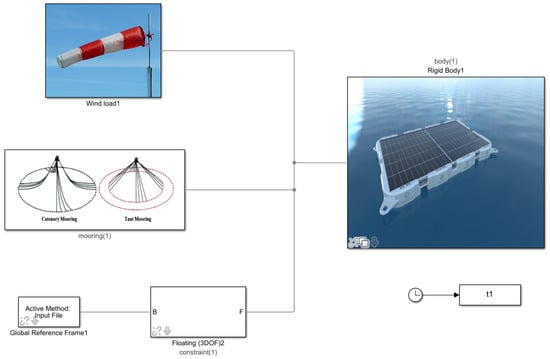
Figure 5.
Numerical model of FPV system.
- Hydrodynamics: Each timestep provides the loads acting on the platform and derived from waves in the three DOFs along surge, heave and pitch. Hydrodynamic loads in three DOFs are calculated for each time step. WEC-Sim performs the numerical simulations to calculate the platform displacements and to verify the hydrodynamic stability.
- Aerodynamics: the components from the wind speed for each timestep are provided.
- Moorings: three-DOF loads acting on the platform due to moorings for station-keeping purposes are performed. Moorings block outputs depend on the platform’s three-DOFs position.
The hydrodynamics parameters (added mass and damping) are calculated from Nemoh [65], providing a mesh created with Salome-Meca [66].
3.1. Hydrodynamics
WEC-Sim software is used to evaluate the hydrodynamics of the floating platform is evaluated: starting from a frequency-domain boundary element method, WEC-Sim solves the floating bodies dynamics in time domain. Linear hydrostatic, added mass, radiation damping, wave excitation coefficients and other hydrodynamic properties were previously computed with the open-source software Nemoh [65].
Nemoh software theory is based on a boundary element method (BEM) and a linear potential flow. The hypothesis consist of the fluid assumed is irrotational (without vorticity), incompressible (with a constant density), and inviscid (without viscosity). By integrating the hydrodynamic pressure on the floating body surface, hydrodynamic forces, such as radiation, excitation and hydrostatic restoring forces, can be calculated [67]. These forces are related to the body’s shape and the incoming waves’ frequency and amplitude.
A three-DOF motion of a hydrodynamic body in the frequency domain can be expressed as follows [54]:
where is the added mass, M is the body mass, is the hydrodynamic damping, C is the restoring force coefficient, is the excitation force, and is the complex amplitude of the incident wave, is the body motion [54]. The added-mass , radiation-damping and hydrostatic stiffness matrices, along with the Froude–Krylov coefficient vector are performed by Nemoh in the frequency domain for a specific direction of the incident wave.
Waves are induced by winds blowing on the sea water surface. Swells are long-crested waves, nearly unidirectional and sinusoidal because are generated by the wind in a previous space or time; however, local winds, by affecting the sea surface, produces short-crested and multi-directional irregular waves [68]. Consequently, the sea surface can be expressed throw a Fourier series of regular waves with different heights, frequencies, wavelengths and phases. Considering a single direction, this can be expressed as:
where the subscripts n indicate that wave parameters relative to the n-th component of the summation along N. While increasing the frequencies, the contribution of the n-th wave becomes less significant: consequently, this summation is finite. In Figure 6 it is reported a representation of the overlap of different regular waves.
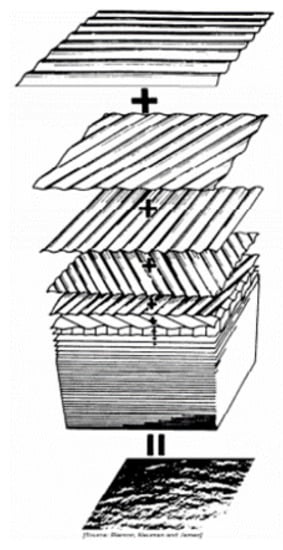
Figure 6.
Regular waves superposition, adapted from [69].
The standard wave spectra used in this work is the JONSWAP (Joint North Sea Wave Project) spectrum [70], developed for the North Sea coastal wind-generated waves.
3.2. Aerodynamics
For the wind, loads acting on the PV panel and the freeboard area of the platform are considered. According to DNV’s Recommended Practice DNVGL-RP-0584 [24], in order to establish wind force and pressure coefficients, the following methods should be used based on the accuracy and shape complexity:
- Analytical formulas, referring to DNVGL-RP-C205 [71];
- CFD;
- Wind tunnel tests.
In [71], the wind load acting on a floater and aligned with the wind direction are expressed using the following formula:
with the air density, A the area exposed to the wind, V the wind velocity, the sheltering coefficient and the drag coefficient. The drag coefficients can be obtained from standards such as DNVGLRP-C205: although they are not referred to solar panels, they can be applied since the theory applies to all structures in presence of steady wind [50]. Drag coefficients depend on the object’s shape and the attack’s wind angle.
A second aspect, taken into consideration by the coefficient, is the sheltering effect: by considering a structure made of different rows and columns of panels, the first row of panels is the most exposed to the wind and acts as a shelter for the other rows by reducing the wind load. This study uses sheltering coefficients derived from [72]. If these values can be useful for a preliminary evaluation, more detailed CFD analysis and experimental tests need to be performed to conform these coefficients to the real structure geometry.
3.3. Moorings
Two options are considered for the mooring: the first one, computationally faster, consists of quasi-static mooring look-up tables implemented by solving the catenary equations in the numerical model.
The second one provides the use of Moordyn [73], a WEC-Sim built-in module that considers also the contributions of inertia and the viscous friction of the chains. The approach used consists of a lumped mass that discretizes the mooring line length by dividing into small segments. Each mooring segment is characterized by specific properties such as unstretched length, diameter, density, and modulus of elasticity.
4. Case Study: Lampedusa
The island of Lampedusa is located along the Strait of Sicily, about 167 km from Tunisia and 205 km from Sicily. With an area of 20.2 km2, it is the largest island of the Italian Pelagie Islands.
Lampedusa is characterized by a great abundance of renewable energy sources (RES): an annual global tilted irradiation exceeding 1965 kWh/m per year [74], an average wind speed equal to 7.35 m/s at 100 m [75], a wave motion greater than 6 kW/m of the wavefront [76].
Due to its position, the island is non-interconnected with the Italian electricity grid, and all utilities, including desalination plants, are powered by a diesel power plant with an installed power of 22.5 MW, owned by Selis Lampedusa Spa [77].
However, given the small surface area, the only way to exploit the great potential through renewables is to go offshore. This chapter aims to define a preliminary FPV system for marine applications to be installed next to the island.
4.1. Geographical Context
The annual electricity production in Lampedusa is about 36.2 GWh (data of 2015), characterized by a significant variability due to tourist flows: the production peak is concentrated mainly in the summer season [78,79]. Figure 7 shows the monthly electrical production in the island.
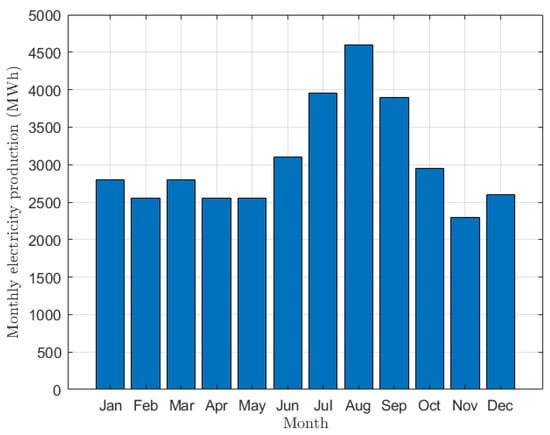
Figure 7.
Monthly electricity production in Lampedusa.
To identify suitable areas for the installation of a FPV system in the waters surrounding Lampedusa, two main tools were used: the Global Solar Atlas [74], especially for the analysis of the solar radiation, and EMODnet Bathymetry [80], for seabed depth information, in order to provide a suitable mooring layout. In addition, considerations such as distance from the coast, distance from sea routes and fishing areas were made to identify sites.
The three sites considered are reported in Figure 8, while main characteristic are summarized in Table 1.
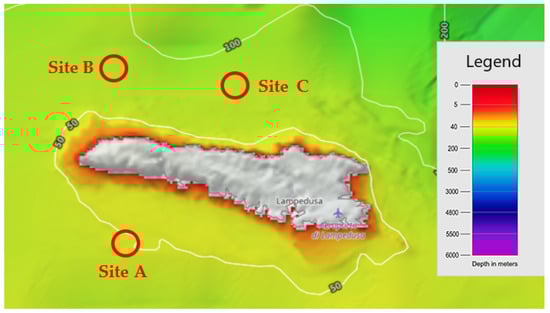
Figure 8.
The three sites considered near Lampedusa, adapted from [80].

Table 1.
Characteristics of selected sites.
4.2. Support Structure Design
The platform considered in this study, rectangular in shape, is inspired by most of the floating photovoltaic platforms currently in use, consisting of steel or aluminium structures lying on floats arranged in a rectangular configuration. This platform guarantees much lower weight and greater simplicity of assembly since no welding is required to lock the floats in position but mechanical locking systems. The steel that makes up the structural part should resist seawater corrosion. For this reason, beam locking systems such as screws and bolts should be preferred since welds locally modify the material properties causing a weakening of saltwater corrosion.
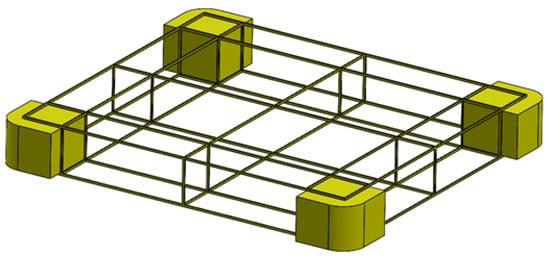
Figure 9.
Floating foundation design.
Table 2.
Rectangular platform with polymeric floats data.
Hydrostatic Analysis
According to DNVGL-RP-0584 [24], “the stability requirements for floats are based on righting moment curves with acceptance criteria expressed in terms of requirements for the area of the righting moment curve relative to the area of the wind heeling moment curve and, in special cases, in terms of a simple requirement for the location of the metacentric height, GM”.
As for preliminary analysis, the design was made considering the metacentric height higher than 1 m and the righting moment curve similar to what is expected for other offshore structures, such as floating offshore wind platforms [81].
The metacentric height can be calculated as [82]:
where represents the distance from the metacentre to the COB, from the keel to the COG, and from the keel to COB.
, also called the metacentric radius, is calculated as:
where I is the transverse moment of inertia of the platform water plane about its centerline, and V is the platform’s submerged volume.
When the platform suffers a heel, it is brought out of balance because the centre of gravity COG and the centre of buoyancy COB are no longer on the same vertical line above one another. The distance created between the vertical line that expresses the platform’s weight through the centre of gravity and the vertical line that expresses the platform buoyancy through the current centre of buoyancy is called righting arm GZ. The GZ curve gives a quick impression of platform stability.
In Figure 10, the intact stability curve, obtained through an in-house code and previously compared with the commercial software Orca-3D in [54,83], is reported.
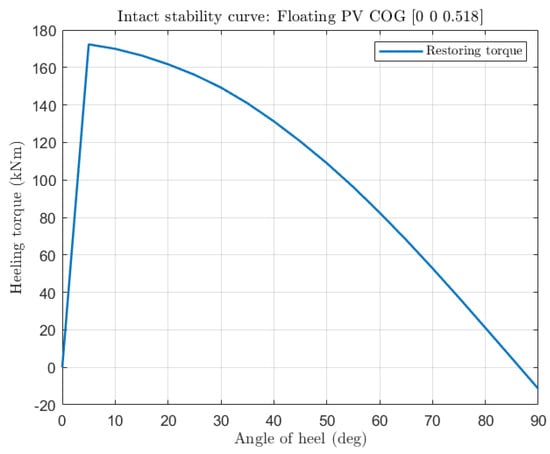
Figure 10.
Intact stability curve of the floating foundation.
Platform motions in waves can be defined by displacement RAOs (Response Amplitude Operators), which define the platform response for this degree of freedom for a specific wave direction and frequency (period).
Figure 11 shows the RAOs amplitude displacement for pitch, roll and heave, respectively, of the structure platform, considering the wave from 0°, 30° and 60°. The RAOs were obtained from Ansys Aqwa tool.
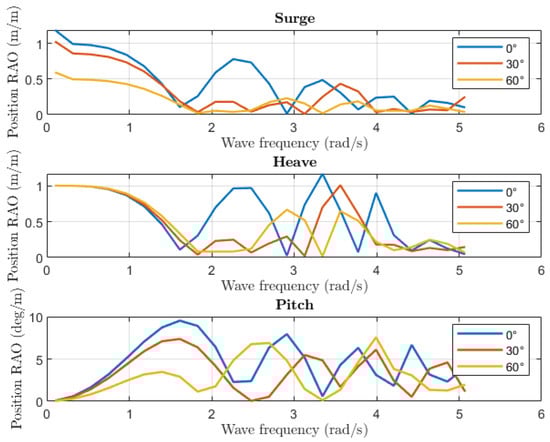
Figure 11.
RAOs along surge, heave and pitch.
4.3. Mooring Design
Mooring lines would stabilize the floating platform, preventing excessive movement of the platform. In this study, the catenary type of mooring line was adopted: a studless R3 grade chain was considered, with a diameter of 0.03 m.
The mooring layout chosen for each of the three sites consists of four catenary lines connected with four drag-embedded anchors. The total length of the line is site-specific, as it depends on the sea depth: the chosen length does not make the line taut and allows the platform freedom of movement to limit the forces acting on the mooring.
The detailed information is shown in Table 3.
Table 3.
Properties of the mooring system.
4.4. Environmental Loads
The main loads acting on a floating structure at sea are those due to waves, wind and sea currents. Figure 12 shows the type of waves present: on the left, the occurrences matrix and on the right, the energy matrix is reported.
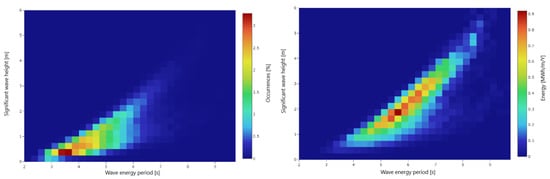
Figure 12.
Occurrence matrix (left) and energy matrix (right) for Lampedusa.
The first one relates the wave period and the wave height as a function of the number of hours they are present in a year, while the second evaluates the energy transported by the waves as the wave height and period vary. The most frequent waves have periods and heights between 3 and 6.5 seconds and between 0.3 and 1.5 m, while the most energetic waves vary between 5 and 7 s and 1 to 4 m.
The Global Wind Atlas reports an average wind speed of 5.7 m/s at 10 m. To take into account even more severe conditions, such as the presence of winds at much higher speeds or the presence of gusts, in the simulations will be used a higher wind speed, but still constant, equal to 8 m/s. As for the currents, since the floater draft is small, their contribution has been neglected.
Table 4 shows the data for the loads considered. The simulations were made considering a single floating structure.
Table 4.
Summary of the environmental conditions considered during the simulations.
4.5. Platform Dynamic Response
The following Figure 13, Figure 14 and Figure 15 show the trends of the surge, heave and pitch as the environmental conditions previously reported vary. The simulations were made considering a single floating structure located in Site 1, with an average sea depth of 50 m and a mooring length of 70 m.
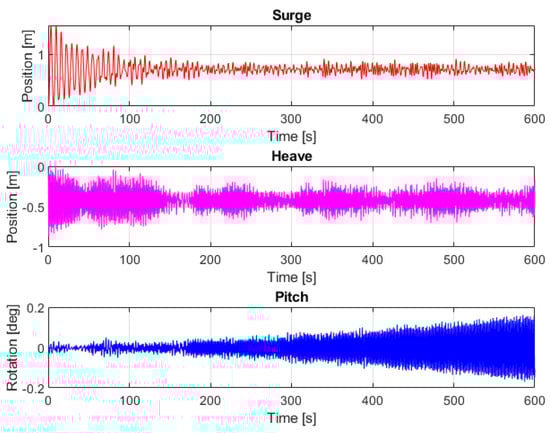
Figure 13.
Surge, heave and pitch for Hs = 0.375 m, Te = 3.625 s and V = 8 m/s.
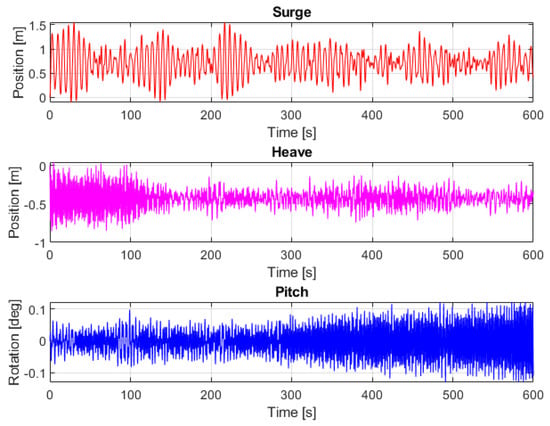
Figure 14.
Surge, heave and pitch for Hs = 0.625 m, Te = 4.625 s and V = 8 m/s.
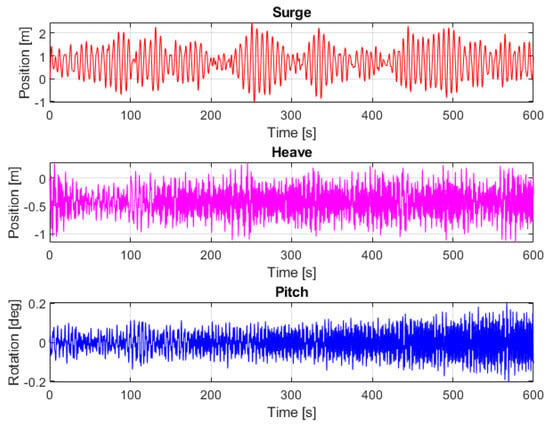
Figure 15.
Surge, heave and pitch for Hs = 1.125 m, Te = 5.375 s and V = 8 m/s.
In condition n.1, it is observed how the rigidity of the mooring reduces the displacement along the surge, almost cancelling it after 200 s. Similar behaviour is found for the heave, while the pitch fluctuates in amplitude but remaining below 0.1°. As the wave variables Hs and Te increase, it is observed how the displacement associated with the surge increases, passing from a few dm to almost 2 m in the condition n. 3. Analogous behaviour is related to the degree of freedom of the heave, while in the case of the pitch, it is observed how the amplitude of oscillation increases.
5. Techno-Economic Analysis
In order to calculate the Capex, Opex and LCOE, it is necessary to make some initial considerations regarding the cost of the floating module and the annual solar energy production. First, the cost of the single floating module, consisting of the platform and the photovoltaic panels, will be analyzed, and then the costs of the mooring and the marine cable will be considered.
5.1. Platform Material Selection
The support structure is divided into three main parts:
- Floaters, whose function is to guarantee the buoyancy of the system;
- Frame on which the photovoltaic panels are located;
- Support structure that connects the floaters to the frame.
For the support structure, the material chosen is steel AISI 205, with excellent technical properties and high resistance to corrosion by many chemical agents, including the salinity of the sea.
In Table 5 steel cost estimation is reported.
Table 5.
Steel structure cost estimation.
The choice to separate the frame from the support structure is linked to the forces acting on the system: in fact, the frame does not act with intense forces as in the supporting structure, so it is possible to choose a lighter material, less expensive and more resistant to corrosion due to the marine environment, such as aluminium.
In Table 6 aluminium cost estimation is reported.
Table 6.
Aluminium frame cost estimation.
As for the floaters, the choice fell on a High-Density Poly Ethylene (HDPE), which had excellent properties of resistance to corrosion by UV rays and salt and which had, at the same time, good mechanical strength at a low cost. In Table 7 HDPE cost estimation is reported.
Table 7.
HDPE float cost estimation.
5.2. Photovoltaics Panel Choice
The choice of the photovoltaic panel aims to minimize the platform cost and maximize the panel power output, preferring the highest possible efficiency. The panel chosen in this study is the SunPower Maxeon 3, with efficiencies greater than 22% and excellent resistance certifications for various tests, such as Salt Spray Test (IEC 61701, maximum severity) and the Desert Test (IEC 60068-2-68, MIL-STD-810G).
In Table 8 the main dimensions of the solar panel are reported.
Table 8.
Photovoltaic panel “SunPower Maxeon” data.
5.3. Power Output Calculation
The energy yield of a single panel takes into account its efficiency and the global tilted irradiation by multiplying the area of the panel. Subsequently, a second efficiency is also considered, which takes into account the efficiency of transformation of the current from DC to AC and which also takes into account the losses due to inefficiencies in the transport of energy.
The equation describing the energy yield calculation is then as follows [84]:
where A is the panel area, r is the efficiency or solar panel yield, H is the global tilted irradiation, and is the performance ratio, indicating losses overall effect on the PV system output due to the temperature, system inefficiencies or failures.
The energy supplied by a single panel in a day is then multiplied by the number of panels on the platform to obtain the actual energy yield.
In order to design the floating PV plant, reference is made to the energy needs of Lampedusa in August, the period of maximum demand due to the influx of tourism, when the energy consumption is around 4600 MWh. However, to be more conservative, the system has been oversized by 15%, considering 5300 MWh as nominal consumption.
For the analysis, the average irradiance considered, referred to the month of August, has been derived from the Global Solar Atlas. The solar panel efficiency considered is 22.6% and the PR is 75%.
Table 9 summarized the number of platforms of the floating PV system to meet the electricity needs of Lampedusa. In the first two rows, the actual energy yield of a platform for a day and a month are referred to the month of August.
Table 9.
Estimation of the number of platforms required based on the data for August.
The number of platforms required is 1150 elements, which is a large number and would occupy an extensive maritime area, since each single platform has an area of about 124 m2 but it also is necessary to consider the size of the moorings. However, in the hypothesis of considering a shared mooring system between the platforms, the required surface area could be equal to that occupied only by the platforms.
Finally, Table 10 shows the calculation of the actual annual energy yield of the plant: it is observed that the amount of energy produced in a year is slightly higher than the needs of the Lampedusa in 2013.
Table 10.
Estimation of the annual energy produced.
The energy yield of the FPV system, preliminary estimated, was then verified through simulations made with the Global Solar Atlas. The Global Solar Atlas provides interactive maps to visualize the solar resource potential worldwide. Moreover, a PV yield calculator estimates the energy yield in different time scales for different solutions, such as small residential rooftops, medium size commercial, ground-mounted large scale and floating large scale systems.
According Global Solar Atlas methodology [74], three different models are provided:
- Solar radiation model;
- Air temperature model;
- PV power simulation model.
While solar radiation and air temperature modelling consist of pre-calculated data layers that have been computed for any location available on the map, the PV power simulation model is implemented using Solargis algorithms and databases based on several conversion steps, as reported in [74]. Among the most significant losses of the system considered due to DC to AC conversion losses are soiling, cables, mismatch and transformer.
The simulation considers a floating large-scale PV system of 32.2 MWp installed capacity, with a 10° tilt angle and 180° azimuth angle. As outputs, the system calculates the energy produced annually and monthly, estimating the average hourly profiles for each month.
The annual energy production for each site is reported in Table 11.
Table 11.
Annual energy production from Global Solar Atlas.
5.4. Capex and Opex
In order to estimate the Levelized Cost Of Energy and to compare this type of plant with other renewable sources, it is necessary to consider the main cost items. Regarding the floating support structure, the material cost of the various components has been increased by 20% to consider all the manufacturing work, such as beam lamination and welding, to obtain the supporting structure.
Table 12 summarises these items: the total cost of the complete platform is EUR 11,366.
Table 12.
Overall cost of a single floating platform.
As for the cost of photovoltaic panels, according to IRENA [7], the cost of solar PV was equal to USD 781/kW for utility-scale projects in Italy.
Subsequently, the cost of the main systems necessary for the proper operation of the photovoltaic plant was estimated: mooring and anchoring systems, submarine cables for transporting the electricity produced and installation and decommissioning costs. These costs are challenging to evaluate due to the absence of projects of this size in a marine environment and the lack of public data: preliminary estimation data from offshore wind and ocean engineering were considered.
As for the mooring lines, a simple catenary system was used, connected with drag-embedded anchors. As reported in [85], the cost of the mooring lines was obtained by multiplying the weight by the cost of the steel (EUR 2.75/kg):
While for drag-embedded anchors, the cost depends on MBL as reported in [86]:
Regarding the costs related to the electrical system, two main items were considered: the balance of the system, which includes cabling, safety and security system, grid connection, and monitoring system, estimated at around USD 500/kW [87], and the marine cable, connecting the power plant to the coast, equal to EUR 600/m [82].
Finally, for installation and decommissioning costs, fixed percentages have been used concerning the total Capex: given the absence of specific data for floating PV systems, offshore wind percentages were considered indicatively from the Carbon Trust, which suggests values of 5% and 2%, respectively.
In the following Figure 16, the principal results about Capex are reported.
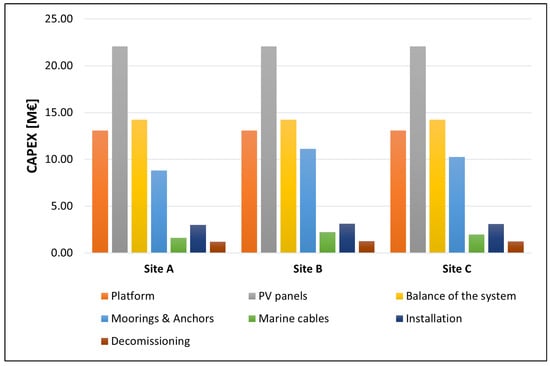
Figure 16.
Capex main items for the three considered sites.
Regarding the Opex, which includes maintenance costs such as overhaul and inspection, according to [88,89], it was considered EUR 15/kW.
5.5. LCOE
The Levelized Cost Of Energy is a ratio that calculates the cost incurred for the production of energy, taking into account the Capex and Opex of the plant and considering its entire helpful life: it is typically expressed as EUR per MWh or kWh.
The LCOE formula is defined as follows:
where is the capital expenditure expressed in millions of euros, is the value of the Opex for the single year t, also expressed in millions of euros, while is the electricity produced each year expressed in MWh, i is the weighted average cost of capital (WACC), expressed as a percentage, and takes into account many factors, including currency inflation and the level of investment risk: the higher this value is, the less value future cash flows have when discounted to the present. Revenue must be greater than the operating costs incurred each year, so a high value of i penalizes the LCOE ratio.
In order to perform this calculation, the useful life of the photovoltaic plant of 20 years has been estimated, and being a very innovative technology also has a high level of risk, equal to 6.4% [88]. The loss of productivity due to the panel degradation is considered by including a decrease factor equal to 2% per year.
In Table 13 the estimated LCOE is reported for each site in Lampedusa.
Table 13.
Capex, Opex and LCOE for the three considered sites.
The LCOE value is similar for the three sites considered: consequently, for a more accurate choice, it would be appropriate to consider other constraints, such as the landing point on the island and the ease of connection with the electricity grid.
6. Discussion
The obtained LCOE value is in line with other works, such as [87], which reports a variable LCOE based on the rated power and equal to USD 100/MWh; in [90], LCOE has been calculated for several European countries, finding a value of approximately EUR 150/MWh for Italy; in [91], the LCOE obtained is lower and varies between 75 and EUR 80/MWh for several sites located in Spain. Similar values are found in pre-commercial projects: according to [92], the demonstrator developed by Oceans of Energy will make it possible to reduce LCOE to EUR 150/MWh.
However, the LCOE is considerably higher when compared to solar PV for ground installation (USD 57/MWh according to IRENA [7]): this is linked to the presence of a more complex system, which requires the use of a mooring system and anchors, of the submarine cable and requires more frequent and complex O&M activities, in addition to being a technology not yet consolidated, with a higher level of risk and uncertainties. However, when compared with other offshore marine technologies, such as offshore wind and wave energy, which share many costs in common, floating PV is competitive: according to IRENA [93], in 2019, the LCOE for the bottom-fixed offshore wind was USD 89/MWh and USD 130/MWh for floating offshore wind, while for wave energy the identified range was between USD 300 and USD 550/MWh, based on the technology considered.
Moreover, among the advantages is the lack of land consumption: this aspect is considerable, especially for the context of the island of Lampedusa, where space availability is limited. The number of platforms to meet the island’s entire electricity needs is considerably high: however, the occupied maritime area is lower to that required by a maritime concession for offshore wind and can be located at distances greater from the coast, in order to limit their visibility.
However, indeed, a considerable aspect concerns the integration of floating PV with other renewable sources to diversify the energy mix: the integration, for example, with another offshore renewable source such as offshore wind or wave energy converters, would allow a better balance of the grid, helping to balance production and consumption and countering peaks.
7. Conclusions
This study describes a numerical model of a PV floating system developed in the Matlab-Simulink environment. The model considers different types of floating platforms, implements mooring systems according to the installation site and considers specific weather and sea conditions associated with wind and wave motion. Among the results, it is possible to evaluate the displacements along surge, heave and pitch.
The numerical model is used for the preliminary design of a floating PV system to be installed near the island of Lampedusa, along the Sicily Channel. First, the floating structure is dimensioned, made from a steel frame, HPDE floats and aluminium support for the photovoltaic panels. The structure satisfies the buoyancy and stability conditions imposed by the Standards.
Subsequently, three sites are considered for a possible plant installation arranged near the island: to evaluate the forces associated with the wave motion, the matrix of the occurrences of wave height and period is obtained. Three combinations of H and T are considered among the most occurrent, while the wind speed considered is 8 m/s, higher than the average annual speed value.
The sizing of the mooring system, made considering a catenary system and drag-embedded anchors, is verified by evaluating the displacements of the platform under the conditions described above.
Subsequently, a floating PV system is sized to meet the electricity needs of Lampedusa: the system nominal power is sized based on August energy consumption, the highest annual level due to the tourist flows present on the island. Thus, the plant has a peak power of 32.2 MWp, requiring 1150 support platforms.
Finally, to investigate the competitiveness of the FPV system, a techno-economic analysis is carried out: firstly, the main cost items of the system are identified, such as the floating foundation, photovoltaic panels, the electrical part and the submarine cables, evaluating the LCOE. The LCOE obtained for the three sites is substantially similar, being lower for the shallower sites and postponing the choice of the most competitive site for further evaluations
Further Works
From a technical point of view on the floating foundation considered, good stability of the system is highlighted, characterized by reduced displacements and oscillations. However, for more accurate analyses, it would be advisable to consider a more significant number of sea and weather conditions to verify the mooring system’s correct sizing.
Furthermore, given the system’s layout, it would be appropriate to consider a multiple number of platforms to analyse in more details the multibody interaction between the floating PV systems.
Finally, to estimate more accurately the energy produced by the system, solar simulators could be used, so as to consider relevant factors for this type of application, such as the module temperature, the evaporative cooling, inverter efficiency and energy losses.
Author Contributions
Conceptualization, A.G., E.F., M.S., G.M. and G.B.; methodology, A.G. and E.F.; software, A.G. and M.S.; validation, A.G.; formal analysis, A.G.; investigation, A.G.; resources, A.G.; data curation, A.G.; writing—original draft preparation, A.G.; writing—review and editing, A.G., E.F. and M.S.; visualization, A.G.; supervision, E.F., G.M. and G.B.; project administration, G.M. and G.B.; funding acquisition, G.M. and G.B. All authors have read and agreed to the published version of the manuscript.
Funding
This research received no external funding.
Data Availability Statement
The data presented in this study are available on request from the corresponding author.
Conflicts of Interest
The authors declare no conflict of interest.
Abbreviations
The following abbreviations are used in this manuscript:
| AC | Alternating Current |
| AISI | American Iron and Steel Institute |
| BEM | Boundary Element Momentum |
| CAD | Computer-Aided Design |
| CAPEX | Capital Expenditure |
| CFD | Computational Fluid Dynamic |
| COB | Centre Of Buoyancy |
| COG | Centre Of Gravity |
| DC | Direct Current |
| DOF | Degree Of Freedom |
| DNI | Direct Normal Irradiance |
| DNV | Det Norske Veritas |
| ECMWF | European Centre for Medium-Range Weather Forecasts |
| FPV | Floating Photovoltaic |
| FRP | Fiber-Reinforced Polymer |
| GHI | Global Horizontal Irradiation |
| HDPE | High-Density PolyEthylene |
| IEC | International Electrotechnical Commission |
| JONSWAP | Joint North Sea Wave Project |
| MARIN | Maritime Research Institute Netherlands |
| MRE | Marine Renewable Energy |
| NREL | National Renewable Energy Laboratories |
| O&G | Oil and Gas |
| O&M | Operations and Maintenance |
| OPEX | Operational Expenditure |
| PV | Photovoltaic |
| RAO | Response Amplitude Operator |
| RES | Renewable Energy Source |
| RP | Recommended Practice |
| USD | United States Dollar |
| UV | UltraViolet |
| WACC | Weighted Average Capital Cost |
| WEC | Wave Energy Converter |
References
- European Commission. The European Green Deal. 2019. Available online: https://ec.europa.eu/info/sites/default/files/european-green-deal-communication_en.pdf (accessed on 8 August 2022).
- IRENA. IRENA Statistics: Solar Energy. Available online: https://www.irena.org/Energy-Transition/Technology/Solar-energy (accessed on 12 August 2022).
- IRENA. Future of Solar Photovoltaic: Deployment, Investment, Technology, Grid Integration and Socio-Economic Aspects (A Global Energy Transformation: Paper); Technical Report; International Renewable Energy Agency: Abu Dhabi, United Arab Emirates, 2019. [Google Scholar]
- IEA. Renewables 2020: Analysis and Forecast to 2025; Technical Report; International Energy Agency. 2020. Available online: https://www.iea.org/reports/renewables-2020 (accessed on 17 August 2022).
- IEA. Renewables 2021: Analysis and Forecast to 2026; Technical Report; International Energy Agency. 2021. Available online: https://www.iea.org/reports/renewables-2021 (accessed on 18 August 2022).
- IRENA. End-of-Life Management: Solar Photovoltaic Panels; Technical Report; International Renewable Energy Agency: Abu Dhabi, United Arab Emirates, 2016; Available online: https://www.irena.org/publications/2016/Jun/End-of-life-management-Solar-Photovoltaic-Panels (accessed on 18 August 2022).
- IRENA. Renewable Power Generation Costs in 2020; Technical Report; International Renewable Energy Agency: Abu Dhabi, United Arab Emirates, 2021; Available online: https://www.irena.org/publications/2021/Jun/Renewable-Power-Costs-in-2020 (accessed on 18 August 2022).
- Ramasamy, V.; Margolis, R. Floating Photovoltaic System Cost Benchmark: Q1 2021 Installations on Artificial Water Bodies; Technical Report; National Renewable Energy Laboratory: Golden, CO, USA, 2021.
- Yousuf, H.; Khokhar, M.Q.; Zahid, M.A.; Kim, J.; Kim, Y.; Cho, E.C.; Cho, Y.H.; Yi, J. A Review on Floating Photovoltaic Technology (FPVT). Curr. Photovolt. Res. 2020, 8, 67–78. [Google Scholar] [CrossRef]
- Cazzaniga, R.; Rosa-Clot, M. The booming of floating PV. Solar Energy 2021, 219, 3–10. [Google Scholar] [CrossRef]
- Rosa-Clot, M.; Tina, G.M. Floating PV Plants; Elsevier: Amsterdam, The Netherlands, 2020. [Google Scholar]
- Mittal, D.; Saxena, B.K.; Rao, K.V.S. Floating solar photovoltaic systems: An overview and their feasibility at Kota in Rajasthan. In Proceedings of the 2017 International Conference on Circuit, Power and Computing Technologies (ICCPCT), Kollam, India, 20–21 April 2017; pp. 1–7. [Google Scholar] [CrossRef]
- El Hammoumi, A.; Chalh, A.; Allouhi, A.; Motahhir, S.; El Ghzizal, A.; Derouich, A. Design and construction of a test bench to investigate the potential of floating PV systems. J. Clean. Prod. 2021, 278, 123917. [Google Scholar] [CrossRef]
- Sanseverino, I.; Conduto, D.; Pozzoli, L.; Dobricic, S.; Lettieri, T. Algal Bloom and Its Economic Impact; Technical Report; Joint Research Centre–European Commission. 2016. Available online: https://op.europa.eu/en/publication-detail/-/publication/4d384d1b-1804-11e6-ba9a-01aa75ed71a1/language-en (accessed on 18 August 2022).
- Cazzaniga, R.; Cicu, M.; Rosa-Clot, M.; Rosa-Clot, P.; Tina, G.; Ventura, C. Floating photovoltaic plants: Performance analysis and design solutions. Renew. Sustain. Energy Rev. 2018, 81, 1730–1741. [Google Scholar] [CrossRef]
- Pringle, A.; Handler, R.; Pearce, J. Aquavoltaics: Synergies for dual use of water area for solar photovoltaic electricity generation and aquaculture. Renew. Sustain. Energy Rev. 2017, 80, 572–584. [Google Scholar] [CrossRef]
- Campana, P.E.; Wästhage, L.; Nookuea, W.; Tan, Y.; Yan, J. Optimization and assessment of floating and floating-tracking PV systems integrated in on- and off-grid hybrid energy systems. Sol. Energy 2019, 177, 782–795. [Google Scholar] [CrossRef]
- Grubišić-Čabo, F.; Nizetic, S.; Tina, G. Photovoltaic panels: A review of the cooling techniques. Trans. FAMENA 2016, 40, 63–74. [Google Scholar]
- Andrews, R.W.; Pearce, J.M. The effect of spectral albedo on amorphous silicon and crystalline silicon solar photovoltaic device performance. Sol. Energy 2013, 91, 233–241. [Google Scholar] [CrossRef]
- Cazzaniga, R.; Rosa-Clot, M.; Rosa-Clot, P.; Tina, G.M. Integration of PV floating with hydroelectric power plants. Heliyon 2019, 5, e01918. [Google Scholar] [CrossRef]
- Silvério, N.M.; Barros, R.M.; Tiago Filho, G.L.; Redón-Santafé, M.; dos Santos, I.F.S.; de Mello Valério, V.E. Use of floating PV plants for coordinated operation with hydropower plants: Case study of the hydroelectric plants of the São Francisco River basin. Energy Convers. Manag. 2018, 171, 339–349. [Google Scholar] [CrossRef]
- Lee, N.; Grunwald, U.; Rosenlieb, E.; Mirletz, H.; Aznar, A.; Spencer, R.; Cox, S. Hybrid floating solar photovoltaics-hydropower systems: Benefits and global assessment of technical potential. Renew. Energy 2020, 162, 1415–1427. [Google Scholar] [CrossRef]
- Pinto, S.; Stokkermans, J. Marine Floating Solar Plants: An overview of potential, challenges and feasibility. Proc. Inst. Civ. Eng. -Marit. Eng. 2020, 173, 1–39. [Google Scholar] [CrossRef]
- DNV GL AS. Recommended Practice DNVGL-RP-0584: Design, Development and Operation of Floating Solar Photovoltaic Systems. Technical Report. 2021. Available online: https://brandcentral.dnv.com/fr/gallery/10651/others/0338546af264473e8481ba6ea78daf0f_hi.pdf?_ga=2.10214133.1591987004.1669084388-876152154.1669084388 (accessed on 18 August 2022).
- Claus, R.; López, M. Key issues in the design of floating photovoltaic structures for the marine environment. Renew. Sustain. Energy Rev. 2022, 164, 112502. [Google Scholar] [CrossRef]
- Kumar, M.; Niyaz, H.; Gupta, R. Challenges and opportunities towards the development of floating photovoltaic systems. Sol. Energy Mater. Sol. Cells 2021, 233, 111408. [Google Scholar] [CrossRef]
- Cuce, E.; Cuce, P.M.; Saboor, S.; Ghosh, A.; Sheikhnejad, Y. Floating PVs in Terms of Power Generation, Environmental Aspects, Market Potential, and Challenges. Sustainability 2022, 14, 2626. [Google Scholar] [CrossRef]
- Lee, Y.G.; Joo, H.J.; Yoon, S.J. Design and installation of floating type photovoltaic energy generation system using FRP members. Solar Energy 2014, 108, 13–27. [Google Scholar] [CrossRef]
- Nguyen, D.A.T. The Global Evolution of Floating Solar PV. Working Paper. IFC. 2017. Available online: https://www.researchgate.net/publication/321461989_The_global_evolution_of_floating_solar_PV (accessed on 10 July 2022).
- BayWa r.e. BayWa r.e. Floating PV Projects. Available online: https://www.baywa-re.com/en/solar-projects/floating-pv (accessed on 10 July 2022).
- PV Magazine. Construction Begins on Europe’s Largest Floating PV Plant. Available online: https://www.pv-magazine.com/2021/05/25/europes-largest-floating-pv-plant-comes-online/ (accessed on 15 July 2022).
- Qin, Y.; Mueller, N.D.; Siebert, S.; Jackson, R.B.; AghaKouchak, A.; Zimmerman, J.B.; Tong, D.; Hong, C.; Davis, S.J. Flexibility and intensity of global water use. Nat. Sustain. 2019, 2, 515–523. [Google Scholar] [CrossRef]
- Kanotra, R.; Shankar, R. Floating Solar Photovoltaic Mooring System Design and Analysis. In Proceedings of the OCEANS 2022-Chennai, Chennai, India, 21–24 February 2022; pp. 1–9. [Google Scholar]
- Acharya, M.; Devraj, S. Floating Solar Photovoltaic (FSPV): A Third Pillar to Solar PV Sector; The Energy and Resources Institute: New Delhi, India, 2019. [Google Scholar]
- Whittaker, T.; Folley, M.; Hancock, J. Environmental Loads, Motions, and Mooring Systems. In Floating PV Plants; Elsevier: Amsterdam, The Netherlands, 2020; pp. 47–66. [Google Scholar]
- Hooper, T.; Armstrong, A.; Vlaswinkel, B. Environmental impacts and benefits of marine floating solar. Sol. Energy 2021, 219, 11–14. [Google Scholar] [CrossRef]
- Villa Caro, R.; Formoso, F.; López, M.; Carral, L. A review of ship mooring systems. Brodogradnja 2018, 69, 123. [Google Scholar] [CrossRef]
- Swimsol. Solar Sea. Available online: https://swimsol.com/#lagoon (accessed on 16 June 2022).
- World Bank Group; ESMAP; SERIS. Where Sun Meets Water: Floating Solar Market Report—Executive Summary; Technical Report; World Bank Group: Washington DC, USA, 2018. [Google Scholar]
- DET NORSKE VERITAS AS. Offshore Standard DNV-OS-H101: Marine Operations, General. Technical Report. 2011. Available online: https://rules.dnv.com/docs/pdf/DNVPM/codes/docs/2011-10/os-h101.pdf (accessed on 18 August 2022).
- Sahu, A.; Yadav, N.; Sudhakar, K. Floating photovoltaic power plant: A review. Renew. Sustain. Energy Rev. 2016, 66, 815–824. [Google Scholar] [CrossRef]
- Oceans of Energy. NORTH SEA 1—Surviving Almost Two Years on the North Sea. Available online: https://oceansofenergy.blue/north-sea-1/ (accessed on 15 August 2022).
- TU Wien. HELIOFLOAT—A Floating Lightweight Platform. Available online: https://www.tuwien.at/en/tu-wien/news/news-articles/news/more-space-to-soak-up-the-sun-1 (accessed on 21 July 2022).
- Ocean Sun. Ocean Sun. Available online: https://oceansun.no/ (accessed on 27 July 2022).
- Selj, J.; Kjeldstad, T.; Marstein, E.; Bragstad, S.; Bjørneklett, B.; Patel, S.; Lindholm, D. Performance of Ocean Sun’s FPV Technology. In Proceedings of the 37th European Photovoltaic Solar Energy Conference and Exhibition (EUPVSEC), online, 7–11 September 2020. [Google Scholar]
- Aksnes, V.; Alsos, H.; Bachynski-Polić, E.; Berthelsen, P.A.; Delhaye, V.; Furevik, B.R.; Jostad, H.P.; Kristiansen, T.; Ommani, B. On Common Research Needs for the Next Generation of Floating Support Structures. Int. Conf. Offshore Mech. Arct. Eng. 2022, 4. [Google Scholar] [CrossRef]
- Liu, H.; Krishna, V.V.; Leung, J.L.; Reindl, T.; Zhao, L. Field experience and performance analysis of floating PV technologies in the tropics. Prog. Photovoltaics: Res. Appl. 2018, 26, 957–967. [Google Scholar] [CrossRef]
- Dai, J.; Zhang, C.; Lim, H.; Ang, K.; Qian, X.; Wong, J.; Tan, S.; Wang, C. Design and construction of floating modular photovoltaic system for water reservoirs. Energy 2019, 116549. [Google Scholar] [CrossRef]
- Hersbach, H.; Bell, B.; Berrisford, P.; Hirahara, S.; Horányi, A.; Muñoz-Sabater, J.; Nicolas, J.; Peubey, C.; Radu, R.; Schepers, D.; et al. Complete ERA5 from 1979: Fifth Generation of ECWF Atmospheric Reanalyses of the Global Climate. Copernicus Climate Change Service (C3S) Data Store (CDS). Available online: https://cds.climate.copernicus.eu/ (accessed on 27 August 2022).
- Ikhennicheu, M.; Danglade, B.; Pascal, R.; Arramounet, V.; Trébaol, Q.; Gorintin, F. Analytical method for loads determination on floating solar farms in three typical environments. Sol. Energy 2021, 219, 34–41. [Google Scholar] [CrossRef]
- Pozza, A.; Sample, T. Crystalline silicon PV module degradation after 20 years of field exposure studied by electrical tests, electroluminescence, and LBIC. Prog. Photovolt. Res. Appl. 2016, 24, 368–378. [Google Scholar] [CrossRef]
- Sirigu, M.; Faraggiana, E.; Ghigo, A.; Bracco, G. Development of MOST, a fast simulation model for optimisation of floating offshore wind turbines in Simscape Multibody. J. Phys. Conf. Ser. Iop Publ. 2022, 2257, 012003. [Google Scholar] [CrossRef]
- Faraggiana, E.; Giorgi, G.; Sirigu, M.; Ghigo, A.; Bracco, G.; Mattiazzo, G. A review of numerical modelling and optimisation of the floating support structure for offshore wind turbines. J. Ocean. Eng. Mar. Energy 2022, 1–24. [Google Scholar] [CrossRef]
- Petracca, E.; Faraggiana, E.; Ghigo, A.; Sirigu, M.; Bracco, G.; Mattiazzo, G. Design and Techno-Economic Analysis of a Novel Hybrid Offshore Wind and Wave Energy System. Energies 2022, 15, 2739. [Google Scholar] [CrossRef]
- Sirigu, A.S.; Gallizio, F.; Giorgi, G.; Bonfanti, M.; Bracco, G.; Mattiazzo, G. Numerical and experimental identification of the aerodynamic power losses of the ISWEC. J. Mar. Sci. Eng. 2020, 8, 49. [Google Scholar] [CrossRef]
- Giorgi, G.; Davidson, J.; Habib, G.; Bracco, G.; Mattiazzo, G.; Kalmár-Nagy, T. Nonlinear Dynamic and Kinematic Model of a Spar-Buoy: Parametric Resonance and Yaw Numerical Instability. J. Mar. Sci. Eng. 2020, 8, 504. [Google Scholar] [CrossRef]
- Rava, M.; Dafnakis, P.; Martini, V.; Giorgi, G.; Orlando, V.; Mattiazzo, G.; Bracco, G.; Gulisano, A. Low-Cost Heaving Single-Buoy Wave-Energy Point Absorber Optimization for Sardinia West Coast. J. Mar. Sci. Eng. 2022, 10, 397. [Google Scholar] [CrossRef]
- Dörenkämper, M.; Wahed, A.; Kumar, A.; de Jong, M.; Kroon, J.; Reindl, T. The cooling effect of floating PV in two different climate zones: A comparison of field test data from the Netherlands and Singapore. Sol. Energy 2021, 214, 239–247. [Google Scholar] [CrossRef]
- Lindholm, D.; Selj, J.; Kjeldstad, T.; Fjær, H.; Nysted, V. CFD modelling to derive U-values for floating PV technologies with large water footprint. Sol. Energy 2022, 238, 238–247. [Google Scholar] [CrossRef]
- Mignone, A.; Inghirami, G.; Rubini, F.; Cazzaniga, R.; Cicu, M.; Rosa-Clot, M. Numerical simulations of wind-loaded floating solar panels. Sol. Energy 2021, 219, 42–49. [Google Scholar] [CrossRef]
- Choi, S.M.; Park, C.D.; Cho, S.H.; Lim, B.J. Effects of wind loads on the solar panel array of a floating photovoltaic system–Experimental study and economic analysis. Energy 2022, 256. [Google Scholar] [CrossRef]
- Yu, F.; Su, Y.; Liu, Y.; Liu, H.; Duan, F. Dynamic response of the mooring system in the floating photovoltaic power station. J. Phys. Conf. Ser. Iop Publ. 2021, 2087. [Google Scholar] [CrossRef]
- Song, J.; Kim, J.; Lee, J.; Kim, S.; Chung, W. Dynamic Response of Multiconnected Floating Solar Panel Systems with Vertical Cylinders. J. Mar. Sci. Eng. 2022, 10, 189. [Google Scholar] [CrossRef]
- Ruehl, K.; Ogden, D.; Yu, Y.; Keester, A.; Tom, N.; Forbush, D.; Leon, J. WEC-Sim v4.4 in Zenodo. 2021. Available online: https://zenodo.org/badge/latestdoi/20451353 (accessed on 10 July 2022).
- Babarit, A.; Delhommeau, G. Theoretical and numerical aspects of the open source BEM solver NEMOH. In Proceedings of the 11th European Wave and Tidal Energy Conference (EWTEC2015), Nantes, France, 6–11 September 2015. [Google Scholar]
- Delmas, J.; Assire, A. Salome-Meca: Une plateforme au service de la simulation mécanique. 2009. Available online: https://hal.archives-ouvertes.fr/hal-00592745 (accessed on 17 September 2022).
- Chatzigiannakou, M.A.; Potapenko, T.; Ekergård, B.; Temiz, I. Numerical analysis of an Uppsala University WEC deployment by a barge for different sea states. Ocean. Eng. 2020, 205, 107287. [Google Scholar] [CrossRef]
- Cottura, L.; Caradonna, R.; Ghigo, A.; Novo, R.; Bracco, G.; Mattiazzo, G. Dynamic Modeling of an Offshore Floating Wind Turbine for Application in the Mediterranean Sea. Energies 2021, 14, 248. [Google Scholar] [CrossRef]
- Journée, J.M.; Massie, W. Offshore Hydromechanics; Delft University of Technology: Delft, The Netherlands, 2000. [Google Scholar]
- Lindgren, H. Session of Powering Performance. In Proceedings of the 17th International Towing Tank Conference, Goteborg, Sweden, 8–15 September 1984; pp. 8–15. [Google Scholar]
- DET NORSKE VERITAS AS. Recommended Practice DNV-RP-C205: Environmental Conditions and Environmental Loads. Technical Report. 2010. Available online: https://rules.dnv.com/docs/pdf/DNVPM/codes/docs/2010-10/rp-c205.pdf (accessed on 13 July 2022).
- Jubayer, C.M.; Hangan, H. A numerical approach to the investigation of wind loading on an array of ground mounted solar photovoltaic (PV) panels. J. Wind. Eng. Ind. Aerodyn. 2016, 153, 60–70. [Google Scholar] [CrossRef]
- Hall, M.; Goupee, A. Validation of a lumped-mass mooring line model with DeepWind semisubmersible model test data. Ocean. Eng. 2015, 104, 590–603. [Google Scholar] [CrossRef]
- DTU. Global Solar Atlas 2.0, a Free, Web-Based Application Is Developed and Operated by the Company Solargis s.r.o. on behalf of the World Bank Group, utilizing Solargis data, with Funding Provided by the Energy Sector Management Assistance Program (ESMAP). Available online: https://globalsolaratlas.info/map (accessed on 13 July 2022).
- DTU. Global Wind Atlas 3.0, a Free, Web-Based Application Developed, Owned and Operated by the Technical University of Denmark (DTU). Available online: https://globalwindatlas.info/en (accessed on 12 July 2022).
- Mattiazzo, G. State of the art and perspectives of wave energy in the Mediterranean sea: Backstage of ISWEC. Front. Energy Res. 2019, 7. [Google Scholar] [CrossRef]
- Trapanese, M.; Frazitta, V. Desalination in small islands: The case study of Lampedusa (Italy). In Proceedings of the OCEANS 2018 MTS/IEEE Charleston, Charleston, SC, USA, 22–25 October 2018; pp. 1–7. [Google Scholar]
- Brano, V.L.; Beccali, M.; Ippolito, M.; Ciulla, G.; Finocchiaro, P.; Cascia, D.L.; Leone, G.; Zizzo, G. Analisi delle tecnologie per la climatizzazione e sistemi ICT applicati agli utenti finali delle isole minori non connesse alla RTN al fine di efficientare il sistema elettrico isolano. [Analysis of air conditioning technologies and ICT systems applied to final users in small islands not connected to the NTG to improve the energy efficiency of the island’s electrical system.]; Technical Report; ENEA: Rome, Italy, 2016. [Google Scholar]
- Curto, D.; Favuzza, S.; Franzitta, V.; Musca, R.; Navarro Navia, M.A.; Zizzo, G. Evaluation of the optimal renewable electricity mix for Lampedusa island: The adoption of a technical and economical methodology. J. Clean. Prod. 2020, 263, 121404. [Google Scholar] [CrossRef]
- European Commission Directorate General for Maritime Affairs and Fisheries. EMODnet Bathymetry Project. Available online: https://portal.emodnet-bathymetry.eu/ (accessed on 5 August 2022).
- DNV GL AS. DNVGL-ST-0119: Floating Wind Turbine Structures. Technical Report. 2018. Available online: https://www.dnv.com/energy/standards-guidelines/dnv-st-0119-floating-wind-turbine-structures.html (accessed on 4 October 2022).
- Ghigo, A.; Cottura, L.; Caradonna, R.; Bracco, G.; Mattiazzo, G. Platform Optimization and Cost Analysis in a Floating Offshore Wind Farm. J. Mar. Sci. Eng. 2020, 8, 835. [Google Scholar] [CrossRef]
- Faraggiana, E.; Sirigu, M.; Ghigo, A.; Bracco, G.; Mattiazzo, G. An efficient optimisation tool for floating offshore wind support structures. Energy Rep. 2022, 8, 9104–9118. [Google Scholar] [CrossRef]
- Markos, F.; Sentian, J. Potential of solar energy in Kota Kinabalu, Sabah: An estimate using a photovoltaic system model. J. Phys. Conf. Ser. IOP Publ. 2016, 710. [Google Scholar] [CrossRef]
- Ikhennicheu, M.; Mattias Lynch, S.D.; Borisade, F.; Matha, D.; Dominguez, J.L.; Vicente, R.D.; Tim, H.; Ramirez, L.; Potestio, S.; Molins, C.; et al. D2.1 Review of the State of the Art of Mooring and Anchoring Designs, Technical Challenges and Identification of Relevant DLCs. Technical Report. CoreWind Project. 2020. Available online: https://corewind.eu/wp-content/uploads/files/publications/COREWIND-D2.1-Review-of-the-state-of-the-art-of-mooring-and-anchoring-designs.pdf (accessed on 4 October 2022).
- Ghigo, A.; Niosi, F.; Paduano, B.; Bracco, G.; Mattiazzo, G. Mooring System Design and Analysis for a Floating Offshore Wind Turbine in Pantelleria. Turbo Expo Power Land Sea Air 2022, 11. [Google Scholar] [CrossRef]
- Barbuscia, M. Economic viability assessment of floating photovoltaic energy. Work Pap. 2018, 1, 1–11. [Google Scholar]
- Micheli, L. Energy and economic assessment of floating photovoltaics in Spanish reservoirs: Cost competitiveness and the role of temperature. Sol. Energy 2021, 227, 625–634. [Google Scholar] [CrossRef]
- Talavera, D.; Muñoz-Cerón, E.; Ferrer-Rodríguez, J.; Pérez-Higueras, P.J. Assessment of cost-competitiveness and profitability of fixed and tracking photovoltaic systems: The case of five specific sites. Renew. Energy 2019, 134, 902–913. [Google Scholar] [CrossRef]
- Rosa-Clot, M.; Tina, G.M. Chapter 10—levelized Cost of Energy (LCOE) Analysis. In Floating PV Plants; Rosa-Clot, M., Marco Tina, G., Eds.; Academic Press: Cambridge, MA, USA, 2020; pp. 119–127. [Google Scholar] [CrossRef]
- López, M.; Soto, F.; Hernández, Z. Assessment of the potential of floating solar photovoltaic panels in bodies of water in mainland Spain. J. Clean. Prod. 2022, 340, 130752. [Google Scholar] [CrossRef]
- PV Magazine. Off-Shore PV project with LCOE of €0.15/kWh off the Belgian Coast. 2021. Available online: https://www.pv-magazine.com/2021/09/03/off-shore-pv-project-with-lcoe-of-e0-15-kwh-off-the-belgian-coast/ (accessed on 15 August 2022).
- IRENA. Offshore Renewables: An Action Agenda for Deployment; Technical Report; International Renewable Energy Agency: Abu Dhabi, United Arab Emirates, 2021; Available online: https://www.irena.org/publications/2021/Jul/Offshore-Renewables-An-Action-Agenda-for-Deployment (accessed on 14 September 2022).


Publisher’s Note: MDPI stays neutral with regard to jurisdictional claims in published maps and institutional affiliations. |
© 2022 by the authors. Licensee MDPI, Basel, Switzerland. This article is an open access article distributed under the terms and conditions of the Creative Commons Attribution (CC BY) license (https://creativecommons.org/licenses/by/4.0/).