Article

How Does Energy Consumption and Economic Development Affect Carbon Emissions? A Multi-Process Decomposition Framework

1
College of Economics and Management, Huaiyin Normal University, 71 Jiaotong Avenue, Huaian 223001, China
2
College of Economics and Management & Research Centre for Soft Energy Science, Nanjing University of Aeronautics and Astronautics, 29 Jiangjun Avenue, Nanjing 211106, China
*
Author to whom correspondence should be addressed.
Energies 2022, 15(23), 8802; https://doi.org/10.3390/en15238802
Submission received: 8 October 2022 / Revised: 14 November 2022 / Accepted: 20 November 2022 / Published: 22 November 2022

Abstract

:
Against the background that climate warming has become a global challenge, exploring the factors that drive carbon emissions change is important to achieve emission reduction targets. Because of the differences in economic development, resource endowment, and historical accumulation, different countries generally have significant technological heterogeneity in the carbon generation process. Therefore, the heterogeneity-related factors should also be understood, which can help policy making and responsibility attribution more accurate. As such, this study developed a meta-frontier-based production–theoretical decomposition analysis method to track the progress of carbon emission change in 42 countries during 2012–2019 with production heterogeneity between the countries taken into account. The empirical study draws the following three meaningful conclusions: firstly, the carbon emission process of different countries has clear technological heterogeneity, mainly reflected in aspects of their energy-use efficiency and energy-use technology. Secondly, the decomposition analysis results showed that the potential energy intensity effect and the economic activity effect played the dominant role in driving and reducing carbon emissions, respectively. Additionally, this conclusion is right for all types of countries. Thirdly, the attribution analysis showed that different types of countries have significantly different contributions to the influencing factors of carbon emission changes, among which countries with large energy consumption and large economies need to take more responsibility for emission reduction.

1. Introduction

The Intergovernmental Panel on Climate Change (IPCC) Special Report on Global Warming of 1.5 °C stated that if the climate change rate remained unchanged, global warming will increase by 1.5 °C between 2030 and 2052 [1]. This will increase the frequency of extreme weather events around the world, the decline of ecosystem diversity, and threaten human livelihood and health [2,3]. Preventing this catastrophic climate change has become the consensus of all countries in the world.
According to the fifth assessment report of IPCC, the main cause of greenhouse effect is the excessive carbon dioxide (CO2) emission produced by the combustion of traditional fossil energy [4]. According to the scenario analysis by Huo et al [5], in 2030, global carbon emissions are most likely to increase by 30% above the 2010 level. Meanwhile, Janzen et al [6] calculated that the cost of the greenhouse effect caused by carbon emissions is about 5% of the global GDP each year; and could even reach 20% in the future without immediate action. Therefore, energy saving and CO2 emission reduction is a matter of urgency.
A growing number of countries are taking active steps to address the challenge of climate warming. However, in the process of economic development, the conflict between emission reduction and economic growth may be exacerbated by specific development policies adopted by countries. As such, understanding the relationships between energy consumption, carbon emissions, and economic growth can help achieve efficient development targets [7]. In recent years, there has been an increasing focus on the field of their internal relationships [8,9]. Specifically, for researchers, it is necessary to calculate the reduction effect brought by different influencing factors. Econometrics [10,11] and decomposition analysis [12,13] methods are the two mainstream tools for influencing factor analysis. Compared with the decomposition analysis method, the econometric method has certain subjectivity in determining the influencing factors [11]. This is not conducive to the horizontal comparison of related research topics between different studies. As such, decomposition analysis has been widely applied in the field of carbon emission change [14,15].
At present, there are two popular decomposition analysis methods, namely, index decomposition analysis (IDA) and structural decomposition analysis (SDA). The two methods are different but related. From the perspective of mathematical modeling, SDA can be regarded as a generalization of IDA [16]. Specifically, IDA can annually decompose the changes/differences in energy and environmental indicators at the industrial level [17]. Based on the input–output model, from the perspective of sectoral association, SDA can explore the direct and indirect influencing factors that lead to changes/differences in energy and environmental indicators at the national or regional level [13]. Comparing these two approaches, in the process of model application, SDA has higher data requirements and model complexity than IDA. In addition, the IDA method facilitates time series and international comparisons [18]. As such, the simple and flexible characteristics make the IDA method more favored by scholars [19,20,21]. However, as a type of economic accounting method, both SDA and IDA cannot capture the impact of technical factors on carbon emissions (energy consumption) change. To solve this problem, Pasurka [22] introduced the decomposition idea into the production framework for the first time, which can identify the impact of technological progress and technical efficiency changes on carbon emissions. On this basis, Zhou and Ang [23] further introduced Shepherd’s directional distance function and defined it as the production–theoretical decomposition analysis (PDA) method.
Using the above research methods, from the perspective of carbon emission change influencing factors, the driving factors can mainly be summarized into three aspects: the structural effect [24], the technological effect [25], and the scale effect [26]. However, few studies have involved the effect that considers the heterogeneity of production processes. In fact, due to the historical reasons, different countries are at different stages of development, and the characteristics of CO2 emissions are also significantly different. Understanding the heterogeneity-related effect of carbon emissions is necessary to guide emission reduction work.
Based on the above research context, the production heterogeneity of carbon emissions in different countries have been barely discussed, especially in the identification of heterogeneity-related driving factors. Considering the production heterogeneity between different countries, this study developed a new production–theoretical decomposition analysis method to track the progress of carbon emission change in 42 countries during 2012–2019 with the production heterogeneity between countries taken into account. Compared with the existing related studies, the contributions of this study can be summarized as follows:
(i).
Overcoming the defect that the traditional decomposition analysis method cannot study the heterogeneity-related factors. From a methodological perspective, considering the production heterogeneity, an extension of the traditional PDA method is constructed. This is able to yield additional insights about the change of heterogeneity in the components driving changes in carbon emissions.
(ii).
Few studies have discussed the influencing factors from the “process” perspective. This study constructs a new decomposition framework and systematically decomposes the influencing factors of carbon emission changes from different stages. The identification of process contribution can make the responsibility of carbon emission reduction clearer.
(iii).
To the best of our knowledge, few studies have accurately identified the transmission mechanism between energy consumption, economic output, and carbon emissions. This study measures all-around their internal relationships. This can help policy makers to formulate more balanced emission reduction policies from multiple dimensions of energy consumption and economic development. Additionally, the research paradigm of this study can also be used to explore changes in specific indicators in other fields. Especially for those decision-making units with significant heterogeneity (time and space) characteristics.
The rest of the paper is organized as follows. Section 2 presents the research methods. Section 3 describes the data and sample used. Section 4 provides the empirical results and cause analyses. Section 5 concludes with some policy implications.

2. Methodology

2.1. Production Technology

Assuming that there are N countries as decision-making units (DMUs), and each country invests capital (K), labor (L), and energy (E) to produce a desirable output—gross domestic production (GDP, denoted by Y). Meanwhile, undesirable output is inevitable in the production process, such as representative CO2 emissions (C). According to [27], the production technology set (T) of this production process can be expressed as Equation (1).
T = { ( K , L , E , Y , C ) : ( K , L , E )   c a n   p r o d u c e   ( Y , C ) }
Based on production theory, T is generally a closed and bounded set (The detailed mathematical properties see the research by [28]). As such, the production technology (under the constant return scale assumption) can be expressed as Equation (2).
T = { ( K , L , E , Y , C ) : n = 1 N λ n K n K ,   n = 1 N λ n L n L ,   n = 1 N λ n E n E ,      n = 1 N λ n Y n Y ,   n = 1 N λ n C n = C    λ n 0 ,   n = 1 , 2 , , N }
where λ n is the weight coefficient, ensuring that the production frontier is a convex shape.
The above production technology has been widely applied in the field of energy and environmental research [18,25]. However, constrained by the actual production process, it is not appropriate that all the DMUs share the same production technology [29]. Meta-frontier is generally used to describe the technical heterogeneity of different groups [28]. Based on the differences in production technology, we first classify all the DMUs into H subgroups. The number of DMUs in the h-th group is Nh, and h = 1 H N h = N . As such, the h-th subgroup forms its own production technology frontier, corresponding to the production technology set Th. The DMUs belonging to the same subgroup have a homogeneous technology level under the group frontiers.

2.2. Multi-Process Decomposition Framework

Based on the extended Kaya identification [28], global carbon emission changes can be decomposed as follows:
C t = i = 1 I C i t E i t × E i t Y i t × Y i t = i = 1 I E N S i t × E N I i t × E C A i t
On the right hand of Equation (3), the first component ( C i t E i t ) is defined as the i-th country’s carbon emission factor in year t, representing the energy consumption structure (ENS). E i t Y i t is the i-th country’s energy consumption per GDP in year t, which reflects the energy intensity (ENI). The last component ( Y i t ) is the i-th country’s economic scale in year t, defined as the economic activity (ECA).
According to [30], changes in energy intensity are complicatedly influenced by the production process-related factors, including the production heterogeneity between different countries. As such, this study introduced meta-frontier DEA technology into the traditional PDA framework, the variation in carbon emissions in the i-th country in year t can be decomposed as follows:
C t = i = 1 I C i t E i t × E i t Y i t × Y i t = i = 1 I E N S i t × E N I i t × E C A i t = i = 1 I C i t E i t × { E i t Y i t | E i t / [ D m t ( E i t , K i t , L i t , Y i t , C i t ) × D m t + 1 ( E i t , K i t , L i t , Y i t , C i t ) ] 1 / 2 Y i t · [ D m t ( E i t , K i t , L i t , Y i t , C i t ) D g t ( E i t , K i t , L i t , Y i t , C i t ) × D m t + 1 ( E i t , K i t , L i t , Y i t , C i t ) D g t + 1 ( E i t , K i t , L i t , Y i t , C i t ) ] 1 / 2 · D g t ( E i t , K i t , L i t , Y i t , C i t ) · [ D g t + 1 ( E i t , K i t , L i t , Y i t , C i t ) D g t ( E i t , K i t , L i t , Y i t , C i t ) ] 1 / 2 × Y i t E N S t × P E I t × T E G t × G E F t × G T C t E N I t × E C A t
Compared with Equation (3), the ENI is further decomposed into four new factors in Equation (4), i.e., the potential energy intensity (PEI), the production technology gap between group and meta-frontier (TEG), the group energy efficiency (GEF), and the group technology (GTC). Figure 1 clearly illustrates the decomposition process.
Therefore, according to the research by [12], changes in carbon emissions from time t to t+1 can be expressed as follows:
D t o t t , t + 1 = C t + 1 C t = i = 1 I E N S i t + 1 i = 1 I E N S i t × { E N I i t + 1 E N I i t | E i t + 1 / [ D m t ( E i t + 1 , K i t + 1 , L i t + 1 , Y i t + 1 , C i t + 1 ) × D m t + 1 ( E i t + 1 , K i t + 1 , L i t + 1 , Y i t + 1 , C i t + 1 ) ] 1 / 2 / Y i t + 1 E i t / [ D m t ( E i t , K i t , L i t , Y i t , C i t ) × D m t + 1 ( E i t , K i t , L i t , Y i t , C i t ) ] 1 / 2 / Y i t ·   ( [ D m t ( E i t + 1 , K i t + 1 , L i t + 1 , Y i t + 1 , C i t + 1 ) D g t ( E i t + 1 , K i t + 1 , L i t + 1 , Y i t + 1 , C i t + 1 ) D m t + 1 ( E i t + 1 , K i t + 1 , L i t + 1 , Y i t + 1 , C i t + 1 ) D g t + 1 ( E i t + 1 , K i t + 1 , L i t + 1 , Y i t + 1 , C i t + 1 ) ] [ D m t ( E i t , K i t , L i t , Y i t , C i t ) D g t ( E i t , K i t , L i t , Y i t , C i t ) D m t + 1 ( E i t , K i t , L i t , Y i t , C i t ) D g t + 1 ( E i t , K i t , L i t , Y i t , C i t ) ] ) 1 / 2 ·   D g t + 1 ( E i t + 1 , K i t + 1 , L i t + 1 , Y i t + 1 , C i t + 1 ) D g t ( E i t , K i t , L i t , Y i t , C i t ) ·   [ D g t ( E i t + 1 , K i t + 1 , L i t + 1 , Y i t + 1 , C i t + 1 ) D g t + 1 ( E i t + 1 , K i t + 1 , L i t + 1 , Y i t + 1 , C i t + 1 ) D g t ( E i t , K i t , L i t , Y i t , C i t ) D g t + 1 ( E i t , K i t , L i t , Y i t , C i t ) ] 1 / 2 × E C A i t + 1 E C A i t D E N S t , t + 1 E n e r g y   i n p u t   p r o c e s s × D P E I t , t + 1 × D T E G t , t + 1 × D G E F t , t + 1 × D G T C t , t + 1 P r o d u c t i o n   p r o c e s s × D E C A t , t + 1 E c o n o m i c   o u t p u t   p r o c e s s
Appendix A describes the calculation process of each influencing factor in Equation (5). As such, the drivers of carbon emissions change can be divided into three processes, i.e., energy input process, production process, and economic output process, as summarized in Table 1.

3. Data Description

Since 2012, countries around the world have gradually shrugged off the effects of the global recession with energy consumption and economic growth on track. However, with the outbreak of COVID-19 at the end of 2019, global economic and social development has been abnormal since 2020. Therefore, the research period of this study spans from 2012 to 2019.
This study tried to focus on the identification of global carbon emission change drivers, and thus the sample selection aimed to be representative. The representativeness of 42 sample countries (listed in Appendix B) is mainly reflected in the following two aspects: first, both economic volume and carbon emissions of these countries account for almost 70% of the global total, especially in 2019, accounting for 72.6% and 75.4%, respectively. Therefore, these countries can well represent the overall development trend of global economic development and carbon emissions. Second, these 42 countries are distributed in various regions of the world, including Asia, the Americas, Africa, Europe and other regions, with a certain degree of regional representation.
Following the idea of Zhang and Wang [31], we assumed the production process uses labor (collected from the International Labor Organization, ILO), real capital formation (collected from the World Bank, WB), and energy consumption (collected from IEA) to produce GDP (collected from WB) and an undesirable output of CO2 emissions (collected from World Resource Institute, WRI).
According to [30], we chose energy intensity, a comprehensive index to measure energy and economy, to categorize the group boundaries (Some articles use geography to divide countries into different groups [32]. However, Lin and Du [30] proved that a country’s technological level has no direct relationship with its geography). Specifically, 42 countries were divided into three types using K-means cluster analysis, i.e., Group-L, Group-M, and Group-S (see Appendix A). Each group was composed of 14 countries. Most of the countries in Group-L were large economic output countries with relatively large energy consumption (e.g., China); most of the countries in Group-M were middle-scale economic countries with middle-scale energy consumption (e.g., Sweden); most of the countries in Group-S were small-scale economic countries with small-scale energy consumption (e.g., Mongolia).
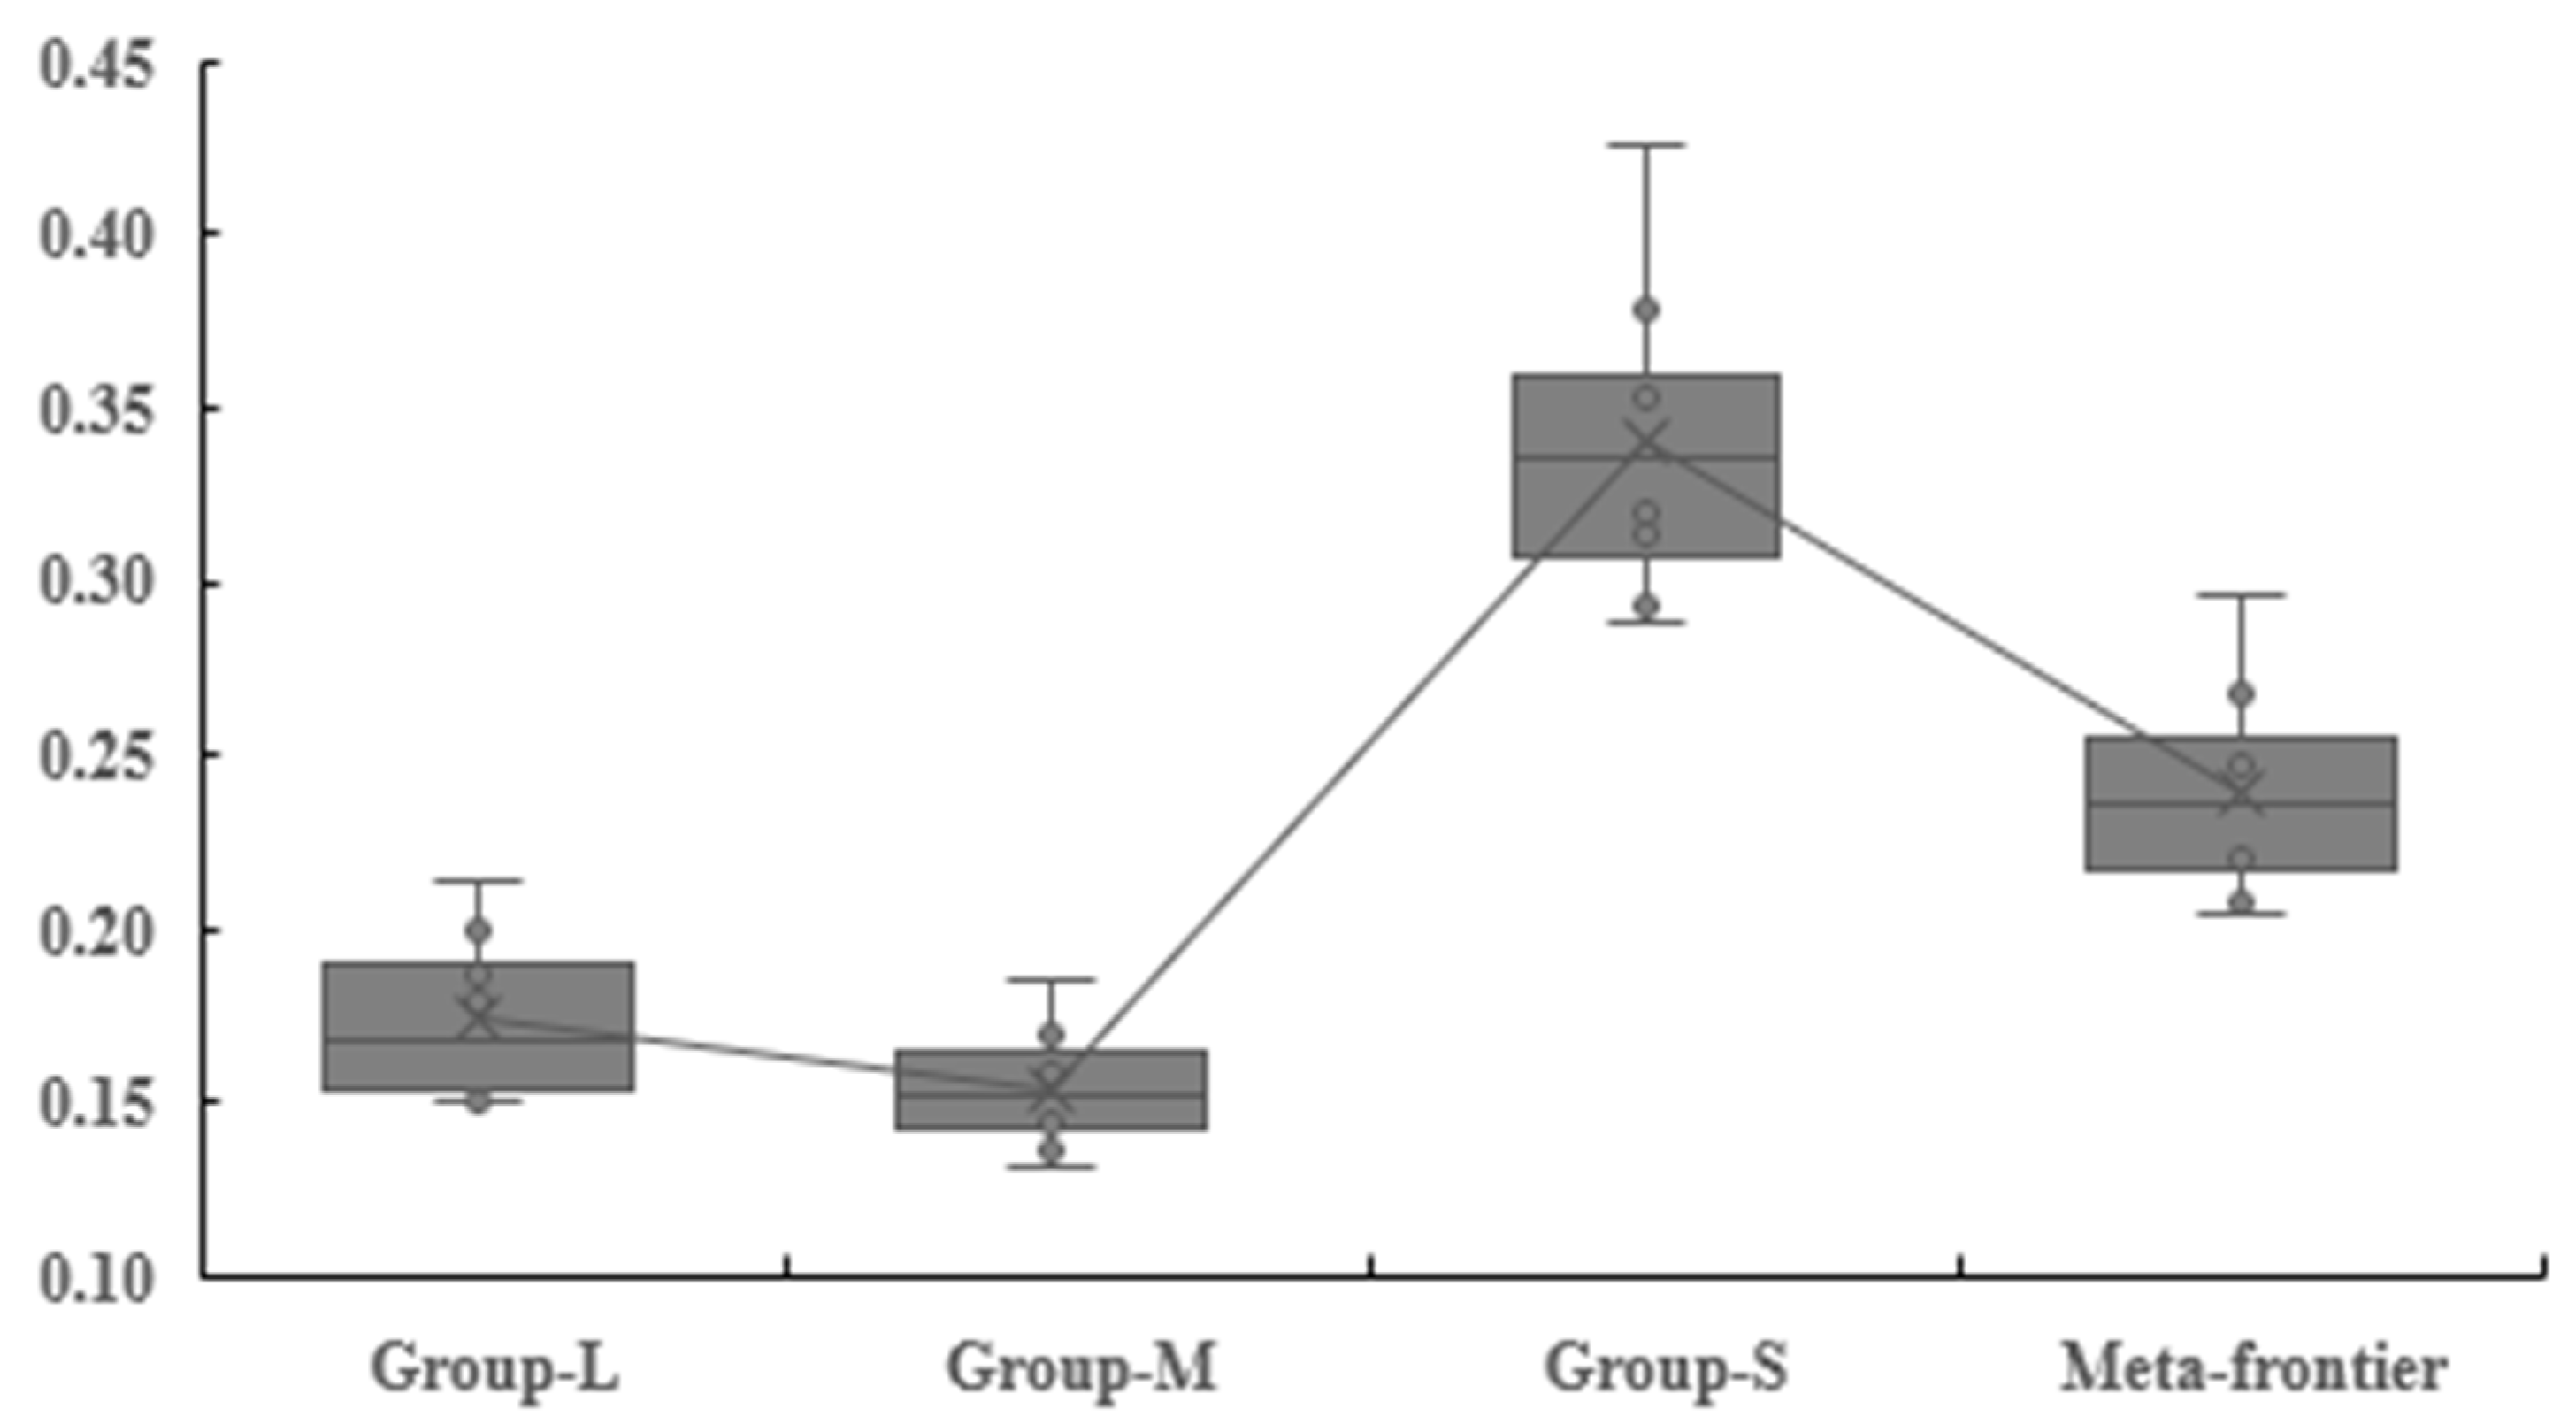
Figure 2 is a box diagram of the energy intensity of the different groups. Obviously, the difference in energy intensity between the different groups is significant. Among them, the energy intensity of Group-M was lower, followed by Group-L and Group-S.

4. Results and Analysis

4.1. Production Heterogeneity

The production heterogeneity of carbon emissions in various countries is mainly reflected in the production process involved in the energy intensity (EI). During the study period, EI experienced a downward trend, decreasing from 0.251 kg/dollar in 2012 to 0.204 kg/dollar in 2019. As mentioned above, the 42 sample countries were divided into three categories. From the group perspective, Group-S showed the highest EI, followed by Group-L and Group-M. This was mainly because Group-S was composed of developing countries. Compared with the other two groups, the modes of energy consumption and economic development of those countries in Group-S were relatively extensive. This is consistent with the study by [31].
Further, to reveal the EI evolution process in the different group countries, the standard β -convergence theory was applied to conduct the test [33]. The following regression model was used for β -convergence estimation:
ln ( y i , t / y i , 0 ) = α + β ln ( y i , 0 ) + ε i , t
where y i , 0 and y i , t denote the EI of i-th country in period 0 and period t, respectively; ln ( y i , t / y i , 0 ) represents the average change rate of EI in the i-th country between time 0 and t; α is a constant value, reflecting the steady-state characteristic and the rate of technological progression; ε i , t is the error term at time t for the i-th country; β reflects whether EI converges to a steady-state or diverges. A statistically significant and negatively suggestive dataset shows β -convergence.
The β -convergence test of EI was analyzed by means of panel data regression analysis in Eviews 8.0. The Hausman test provides an indicator to determine which type of model should be used: a fixed effect model or a random effect model. The results show that the value of chi sq. was 14.27 and the value of probability was 0.0099. Therefore, the original assumption was wrong, so the fixed effects model was used here. The full results are shown in Table 2.
As shown in Table 2, within the three country groups and the overall sample, the estimated coefficients of β were all negative and statistically significant at the level of 1%, which implies the existing of absolute β -convergence. In addition, the convergence speed can be determined according to the values. The values of β indicates that the convergence speed of Group-S was relatively fast, followed by the Group-M and Group-L. This means that there existed a catch-up effect for the backward (large energy intensity) to the advanced countries (small energy intensity). Henceforth, in order to further improve this convergence rate and narrow the EI difference, it was necessary to take certain measurements to enhance the communication of energy-use technology, management system arrangements, and other aspects between the different types of countries.
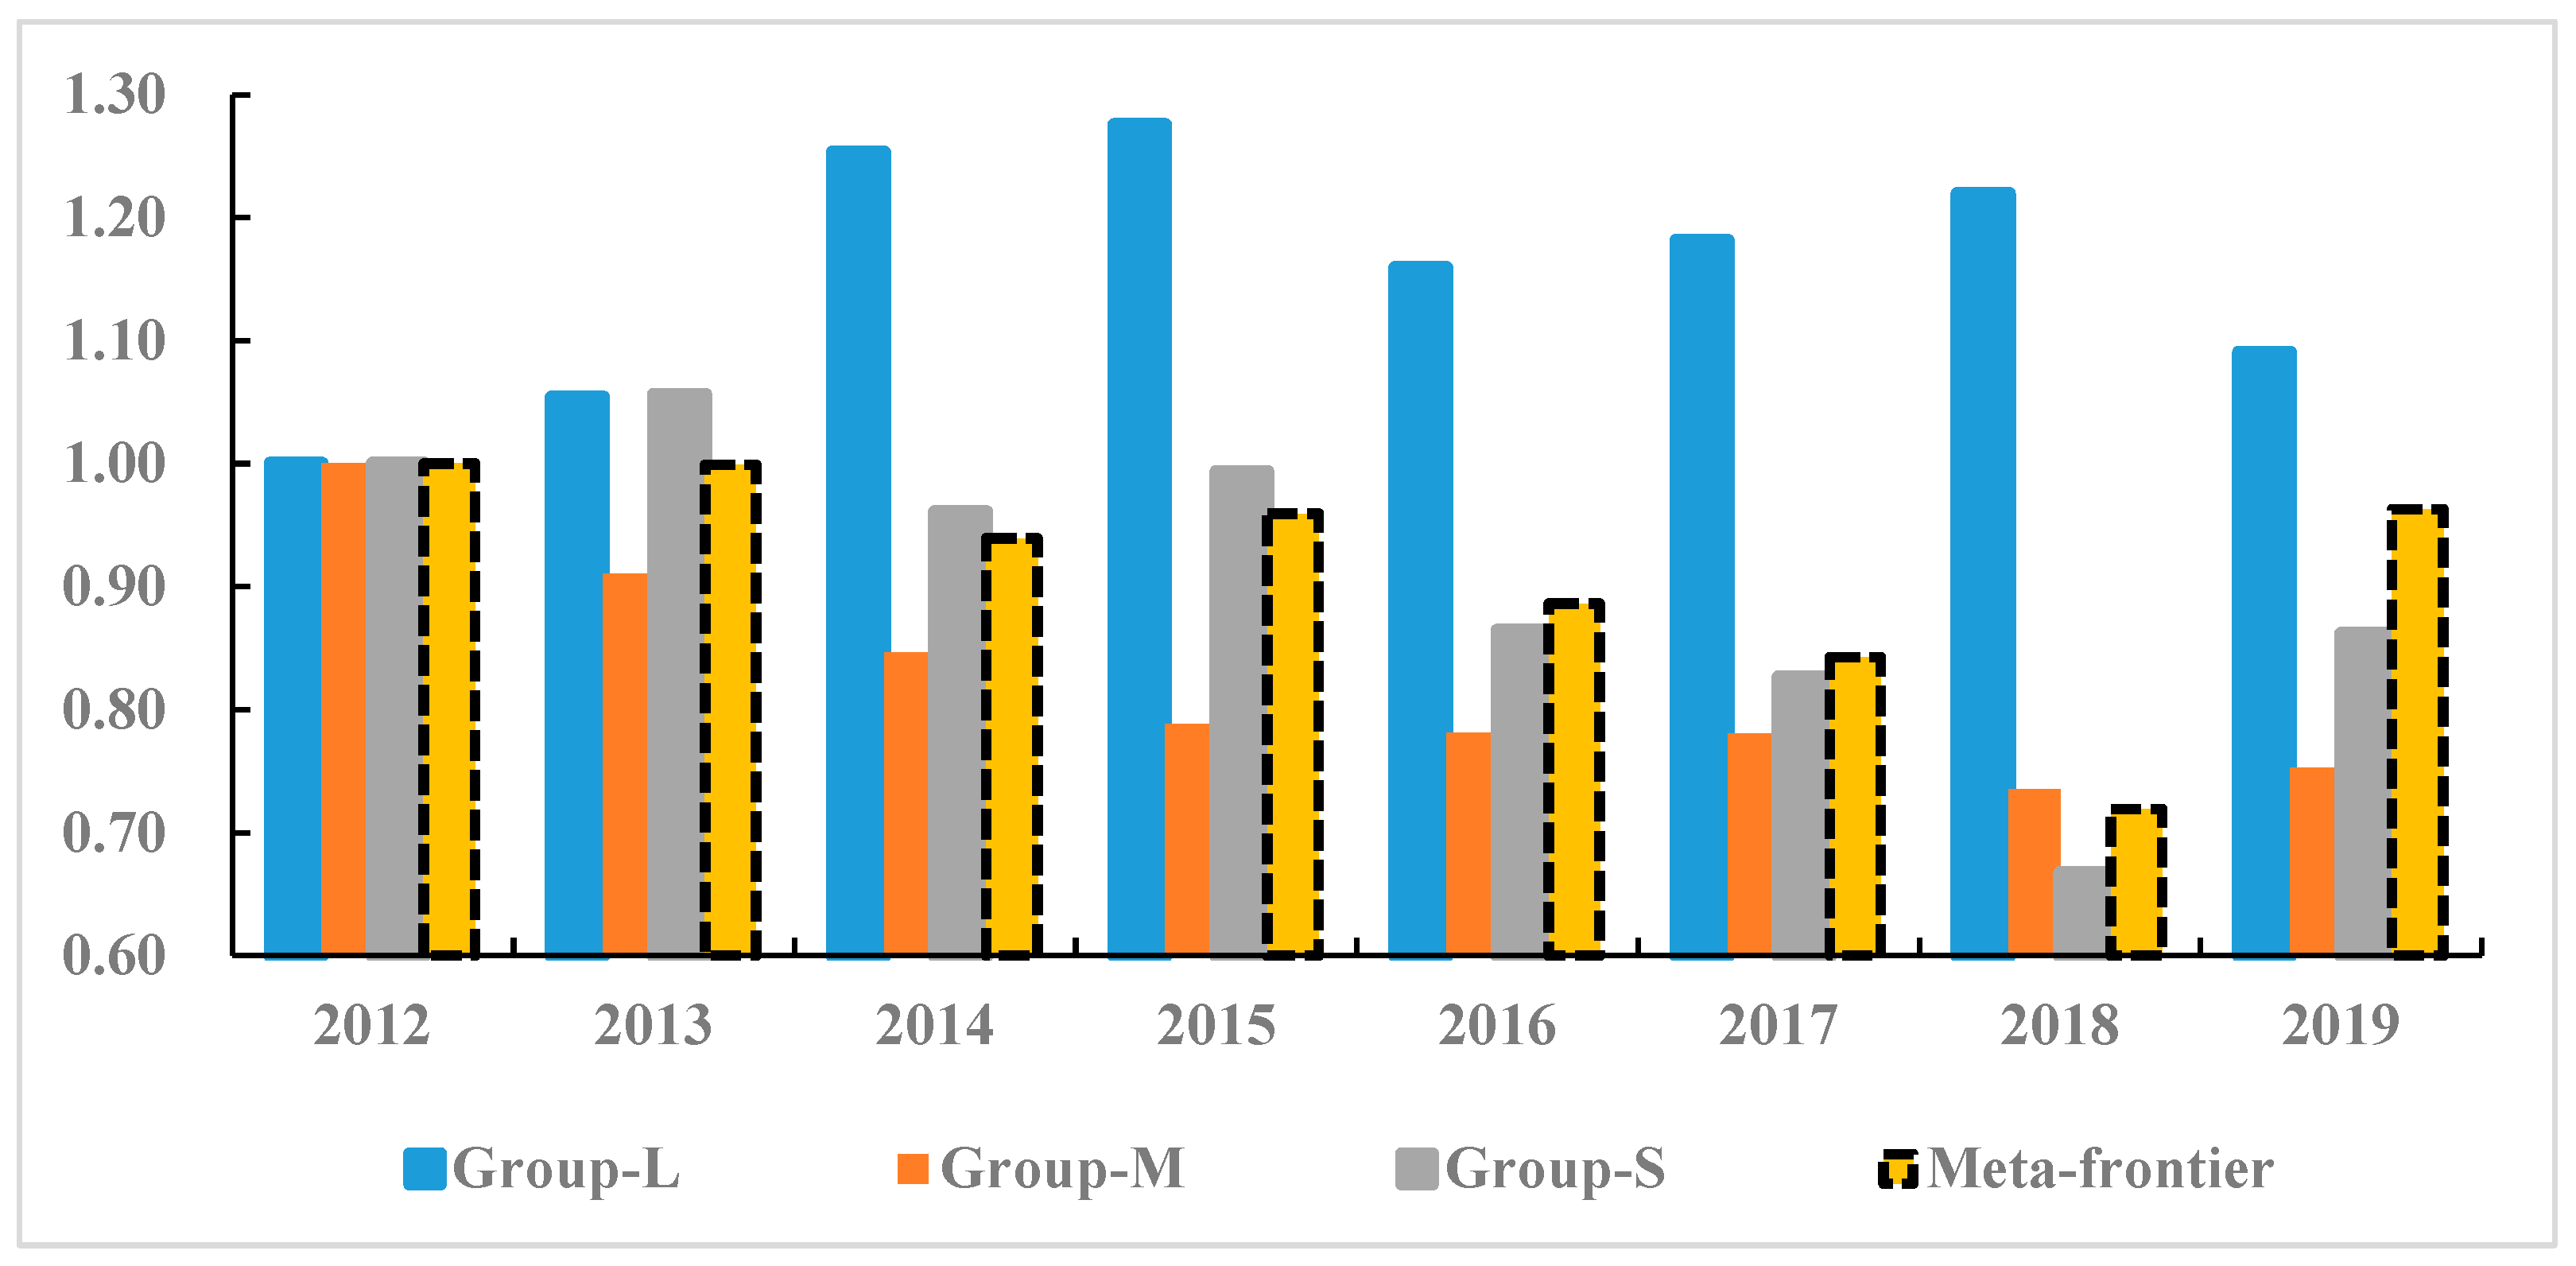
According to the decomposition framework constructed above, differences in energy-use technology and energy efficiency were the core factors that affected the production heterogeneity. Figure 3 illustrates the time series change of the different countries’ energy-use efficiency.
As shown in Figure 3, the energy efficiency of the sample countries decreased in a fluctuation manner and rebounded after reaching the lowest value in 2018. This is mainly because since 2017, the world economy witnessed a gradual improvement. Developed economies enjoyed a sound growth momentum, while emerging markets and developing economies neglected process optimization in order to acquire steady growth and recovery [34]. Taking Indonesia as an example, in addition to the relatively low management level, the industrial structure of high energy consumption has not been reasonably optimized, resulting in a 29% decline in energy efficiency. For the different types of countries, Group-M showed the best energy efficiency, followed by Group-L and Group-S. This is mainly due to the fact that Group-M was basically composed of developed countries that consume relatively less energy, having enough advantages (talent, management, and capital investment) to improve their energy efficiency [28,35].
Compared with the trend of efficiency change, the heterogeneity of technology change is relatively great. As is shown in Figure 4, with the exception of Group-L, the other two groups contributed positively to the overall technological improvement. From 2012 to 2017, the cumulative technology change rate of Group-M was relatively more significant. Compared with the other two groups of countries, the countries in Group-L, despite their large energy consumption, were in a leading position in terms of energy-use technology and emission-reduction technology, with little room for improvement. For example, many OECD countries shifted from relying on energy-intensive manufacturing industries to using less energy-intensive service-based economic activities. In contrast, most countries in Group-S were developing countries, where technological promotion potential and space are relatively large, but the impact is more pronounced. However, Group-L countries were world leaders in energy-use technology, a good sign that the other countries are continually catching-up.

4.2. Influencing Factors Analysis

4.2.1. Decomposition Results and Analysis

During the study period, the carbon emissions of the sample countries showed a significant increasing trend, with an average annual growth rate of 1.46%. Using the decomposition analysis model constructed above, we explored the driving factors of global carbon emission changes from three aspects: energy input, production process and economic output. Table 3 and Figure 5 show the single-period and multi-period decomposition results and their evolutionary trends of six influencing factors from 2012 to 2019, respectively. As is shown in Table 3, ECA had an enhanced effect on carbon emission changes over the years, with an average annual growth rate of 1.084, which is the main obstacle for the decline of carbon emissions. Meanwhile, ENS and ENI both played positive roles in carbon emission reduction (G-mean values were all less than 1). The findings are consistent with other studies on changes in global carbon emissions [28,36].
Energy intensity, an indicator reflecting changes in energy production technology, was the most important factor in curbing the growth of carbon emissions, with an average annual contribution of 0.9434. Further decomposition of ENI showed that PEI was a key factor in contributing to the reduction in carbon emissions, with an annual contribution rate of 0.9338. However, during the period of 2013–2014, PEI not only failed to reduce carbon emissions, but also promoted an increase in carbon emissions (1.0253). This phenomenon may be caused by the impact of the US Subprime Mortgage Crisis, which greatly affected the investment in energy substitutes (such as labor shortage and insufficient capital investment), thus consuming more energy at the same output level [36]. This is consistent with the research conclusions by [31]. Since 2013, in order to remove the impact of energy shortages and the economic crisis, major energy-consuming countries around the world (such as the United States, China, and Russia) have paid more attention to energy saving and emission reduction. For example, in 2012 China has invested more than 100 billion yuan in supporting the research, development, promotion and application of low-carbon technologies. Thus, strengthening the role of PEI and ENI in reducing carbon emissions.
The average effects of GEF and GTC change on global carbon emission were 1.0005 and 1.0016, respectively. This reflects that neither production technology nor production efficiency effectively curbed the growth of carbon emissions. Especially for GTC, it was second only to ECA in its contribution to the growth of carbon emissions from 2012 to 2017 (see Figure 5). The phenomenon, since 2017, GTC has continuously played an active role in reducing carbon emissions. This may be that global countries are gradually repairing the impact of the economic crisis, and energy-saving and emission-reduction technologies have developed rapidly. For the GEF, except for 2012–2014 and 2017–2018, the emission-reduction effect was not significant in other years. This indicates that there is still great potential in improving energy efficiency to achieve emission reduction.
As for TEG, reflecting the production heterogeneity, it significantly promoted an increase in carbon emissions. Additionally, its promoting effect was second only to ECA. From the perspective of the evolutionary trend, Table 3 and Figure 5 show that the change trend of TEG was almost inverse to that of global carbon emissions. The greater the heterogeneity of production technology between different countries, the more uneven the production level, which increases global carbon emissions. Therefore, countries should further emphasize exchange and learning from each other, thus narrowing the gap between countries with different energy-use technology levels.
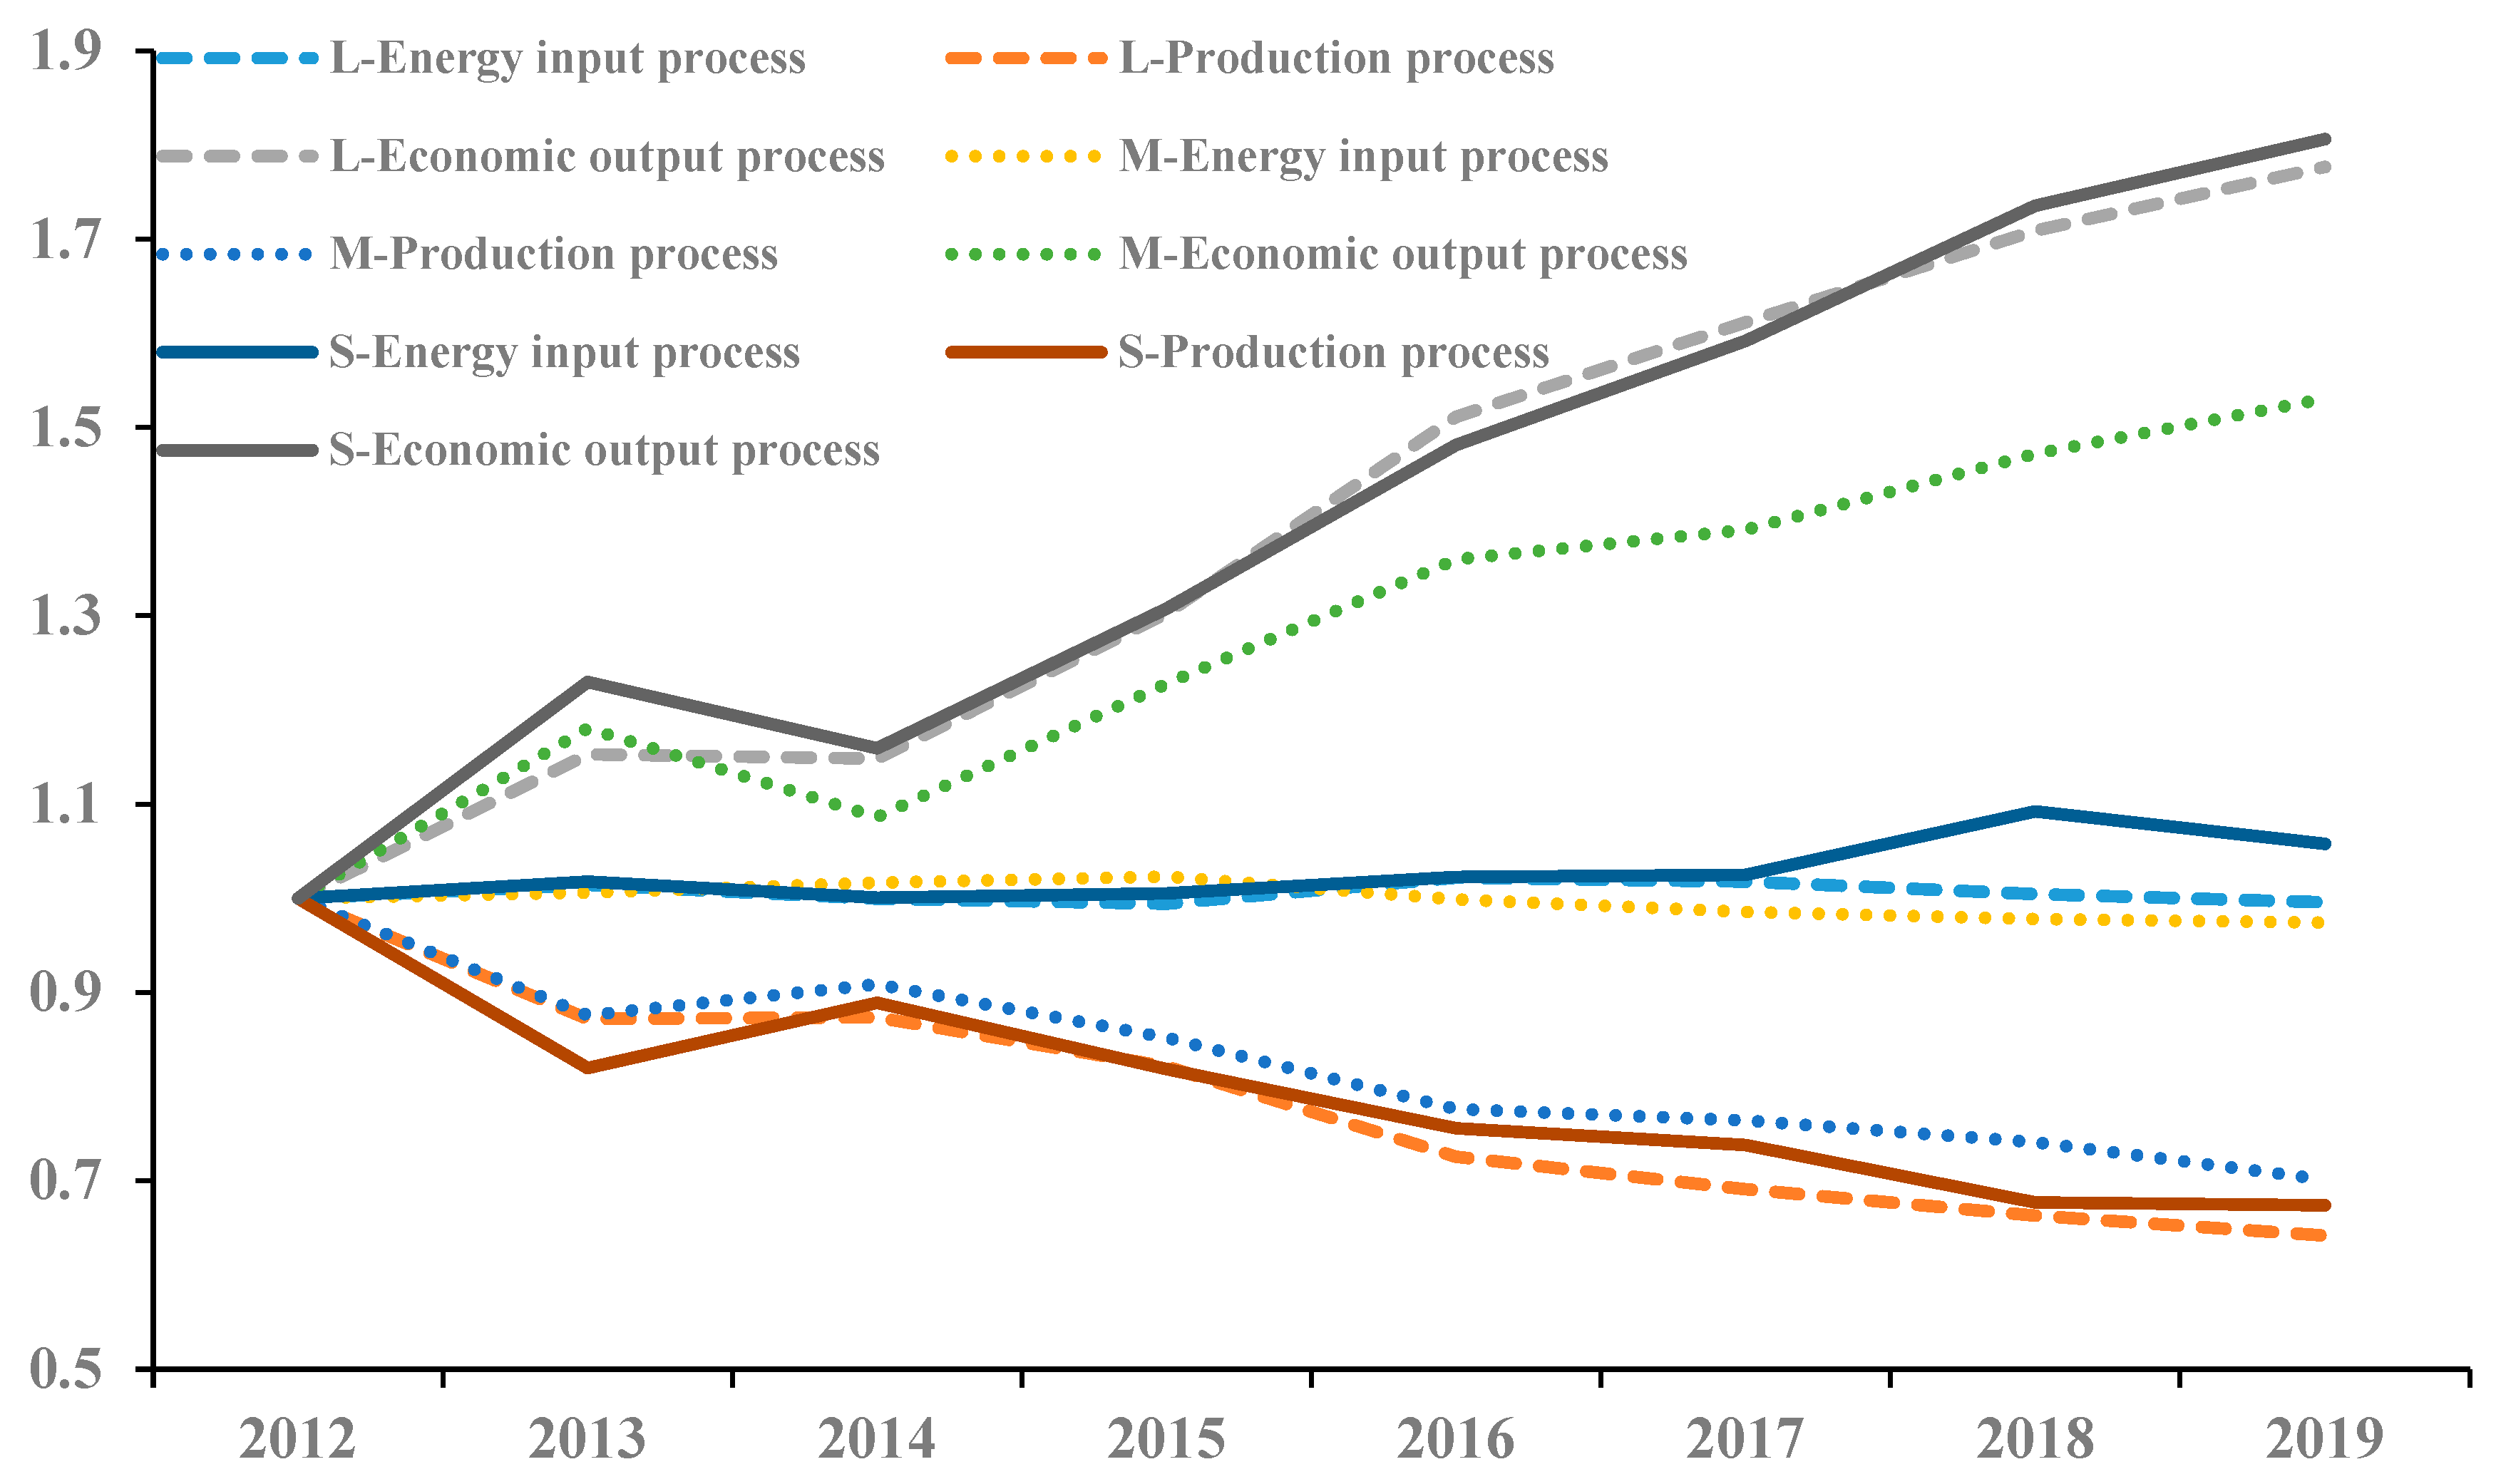
From the group perspective, because different types of countries have obvious differences in resource endowment, production environment, technology level, management experience and other aspects, the impact degree and mechanism of carbon emission change factors on different types of countries is also different [37]. Figure 6 describes the cumulative decomposition results for sample countries’ carbon emission change by different processes of different groups. From the process perspective, the economic output process (ECA) and production process (ENI) were dominant factors that promote and inhibit the increase in carbon emissions for all types of countries, respectively. Meanwhile, the energy input process (ENS) on the carbon emissions of the different groups were relatively small. Due to the effects of resource endowment and energy price, there was no obvious difference in energy structure among the countries at present, and the optimization of energy-use structures is a long-term process. As such, in the short term, the impact of energy structural change on carbon emission change was not significant.
Considering the dominant reduction role that the production process played, it is necessary to further discuss the different influencing factors in the production process. PEI effectively helped all types of countries reduce their carbon emissions, and PEI was the most important emission-reduction factor for Group-L and Group-M. For Group-S, the contribution of GTC (0.739) to carbon emission reduction was more obvious than PEI (0.812). This is due to the fact that Group-L and Group-M were mainly developed countries, and therefore have significant advantages in the application of low-carbon production technology. While Group-S was mainly composed of developing countries with relatively low energy consumption, which low-carbon production technology have not been widely promoted or applied. As such, countries in Group-S generally had more room for technological progression, leading to the more significant carbon emission reduction effect of GTC. Meanwhile, the improvement in energy efficiency involves a series of long-term reserves, such as management level, experience accumulation and talent training.
As one of the main factors contributing to the increase in carbon emissions, TEG contributed 12.6% to the growth of carbon emissions in Group-M, followed by Group-S (7.64%) and Group-L (4.35%). The greater the gap, the more backwards the energy-saving and emission-reduction technology was, the greater the contribution to carbon emissions. The TEG effect had the least impact on the change of carbon emissions in developed countries with a large energy consumption. This is mainly due to the fact that Group-L type countries generally have always been in the leading position in production technology and are the promoters of the global technological progression. Thus, compared with other type countries, the technology gap between Group-L and global technology frontier is relatively small, leading to less impact on the change of carbon emissions of Group-L countries. This further indicates that the different types of countries should strengthen their cooperation and exchange of production technology to narrow the technological gap, thus decreasing the carbon emissions.

4.2.2. Attribution Results and Analysis

After understanding how different factors drive the change in carbon emissions, how different types of countries contribute to each factor needed to be clarified. This can provide a reference for differentiated designing of carbon emission reduction policies for different countries. The attribution analysis method can effectively realize this purpose. Taking the potential energy intensity (PEI) as an example, the contribution of each country to PEI can be calculated by using Equation (7).
D p e i T 1 , T 1 = i = 1 I D p e i T 1 , T 1 = i = 1 I w i S V F i T 1 L ( F i T 1 D p e i T 1 , T , F i T ) i = 1 I w i j S V F i j T 1 L ( F i T 1 D p e i T 1 , T , F i T ) ( F i T F i T 1 1 )
where F i s = E i s / [ D m s ( E i s , K i s , L i s , Y i s , C i s ) × D m t ( E i s , K i s , L i s , Y i s , C i s ) ] 1 / 2 Y i s . In this expression, D p e i T 1 , T 1 represents the percentage change of the potential energy intensity effect from time T−1 to time T. w i S V F i T 1 L ( F i T 1 D e n s T 1 , T , F i T ) i = 1 I w i j S V F i j T 1 L ( F i T 1 D e n s T 1 , T , F i T ) F i T F i T 1 denotes the coefficient of contribution of the i-th group country to the percentage change in PEI during the period of T−1 to T. The contribution of each country to the other five influencing factors can be calculated similarly.
During the study period, different types of countries made different contributions to the change in carbon emissions in different years. The overall carbon emissions of the sampled countries increased by 10.70% from 2012 to 2019, the carbon emission of Group-S increased by 21.06%, followed by Group-L (11.04%) and Group-M (4.63%). During 2018–2019, the overall carbon emissions only increased 0.83%. This is mostly because most of the sample countries promoted the decline of carbon, especially for the leading role that Group-L played. In order to further explore the core driving force of the contribution of different types of countries to carbon emissions, the detailed contribution of the different groups to the influencing factors of carbon emission change was calculated using Equation (7). Specifically, sample countries with different development modes and stages had different contributions to carbon emission across the four heterogeneity-related drivers in the production process (i.e., PEI, TEG, GEF, and GTC), as shown in Table 4.
For PEI, from 2012 to 2019, except for 2013–2014, the cumulative contribution value of each country to PEI promoted carbon emission reduction, of which Group-L was the most obvious, especially in 2015–2016 (−10.83%), 2012–2013 (−9.16%) and 2014–2015 (−8.53%). In particular, for 2017–2018 (0.17%), Group-S did not contribute to PEI reduction. This may be due to the fact that, in addition to the impact of the economic environment, the energy consumption of Group-S countries was relatively small, and the decline of energy prices had a greater impact on the growth of the total energy consumption. The attribution effect of each group to the GEF was almost the opposite to that of PEI. This is because the effect of PEI has a direct internal relationship with the effect of GEF. The economic connotation of PEI represents the energy intensity that peels off the ineffectiveness of energy use. When the overall energy intensity of a country changes little, the attribution effects of PEI and GEF thus have a reverse trend.
Meanwhile, for GTC, from 2012 to 2018, Group-L was always the main body to increase the carbon emissions by GTC, with an average annual contribution rate of 3.09%. Of which, Group-L made the most significant contribution in 2012–2013 and 2015–2016. Different from Group-L, both Group-M and Group-S significantly reduced the carbon emissions of GTC. This is mainly due to the effective improvement of energy-use technologies in these two types of countries. Considering the fact that, with the continuous improvement of energy-use technology, the technology gap will inevitably continue to narrow. As such, the attribution effect of each group to the TEG was almost the opposite to that of GTC.

5. Conclusions

Identifying the key factors affecting the change in global carbon emissions can help target carbon emission reduction and curb global warming. Meanwhile, knowing the contribution degree of different countries to the influencing factors can help better share the emission reduction responsibility. Therefore, this study took 42 representative countries as a sample to decompose and attribute the changes in carbon emissions from 2012 to 2019. In particular, considering the obvious differences in resource endowment, production technology and management level among the different countries, this study proposed a new decomposition analysis framework by combining PDA and meta-frontier analysis. The newly built method can be used to further explore the impact of production technology heterogeneity on carbon emission reduction. In general, three important findings can be concluded from the empirical study.
First, the production process of the different types of countries has clear heterogeneity characteristics. The energy intensity level of the different countries has a trend of β -convergence. There exists a catch-up effect for the backwards to the advanced countries. In addition, differences in energy-use technology and energy efficiency are core factors that affect production heterogeneity. Compared with the trend of efficiency change, the heterogeneity of technological change is relatively greater. Group-M and Group-S have both contributed positively to global technological improvement, especially for the countries in Group-M. In order to further improve the convergence rate and narrow the technology gap, it is necessary to take certain measurements to enhance the communication of energy-use technology, management system arrangements, and other aspects between the different types of countries.
Second, the decomposition analysis showed that the potential energy intensity effect is the most important reason for carbon emission reduction. Meanwhile, the group energy efficiency effect and the energy structural effect also played positive roles in carbon emission reduction. The other factors, including group technology change effect, technology gap effect, and economic activity effect failed to inhibit carbon emissions. In particular, economic activity was the main driver in increasing carbon emissions during the study period. From a group perspective, economic activity had the most significant pull effect on carbon emissions in Group-S, followed by Group-L and Group-M. This suggests that developing countries and those with large energy consumption countries should pay more attention to carbon reduction in the process of economic development. For example, these two types of countries can reduce the impact of economic activity on carbon emissions through industrial structure adjustment, new energy applications and other ways when making economic development policies.
Third, in the production process, the structure of the contribution coefficient showed different characteristics in the different groups. The cumulative contribution value of each country to the potential energy intensity promoted carbon emissions reduction, of which Group-L was the most obvious, especially in the period of 2015–2016. Meanwhile, the attribution effect of each group to the efficiency effect was almost the opposite to that of the potential energy intensity. From 2012 to 2018, Group-L was the main body to increase the carbon emissions by the technology effect, with an average annual contribution of 3.09%. Different from Group-L, Group m and Group-S both played significant role in decreasing the carbon emissions by the technology effect. The attribution effect of each group to the technology gap was almost the opposite to that of technology effect. A country must be concerned not only with its own technological progression, but also with the development of the global technology frontier and the pace of technological progression.

Author Contributions

Conceptualization, X.L. and Y.Z.; methodology, X.L.; software, Y.L.; validation, X.L., Y.Z. and Y.L.; formal analysis, X.L.; investigation, Y.L.; resources, X.L.; data curation, Y.L.; writing—original draft preparation, X.L.; writing—review and editing, Y.Z.; visualization, Y.L.; supervision, Y.Z.; project administration, X.L.; funding acquisition, X.L. All authors have read and agreed to the published version of the manuscript.

Funding

This research was funded by National Natural Science Foundation of China (no. 71904059), and the Qin Lan Project of the Jiangsu province.

Conflicts of Interest

The authors declare no conflict of interest.

Appendix A

In order to calculate the effect of each influencing factor in Equation (5). Following the idea of [28], the distance functions in Equation (5) can be calculated by Equations (A1) and (A2), as follows:
[ D g p ( E i q , K i q , L i q , Y i q , C i q ) ] 1 = min θ i , g       s . t . i = 1 I h λ i E i p θ i , g E i q ;   i = 1 I h λ i K i p K i q ; i = 1 I h λ i L i p L i q         i = 1 I h λ i Y i p Y i q         i = 1 I h λ i C i p = C i q + φ i         λ i 0 ,   i = 1 , , I h ; φ i 0 ,   i = 1 , , I h         p , q { t , t + 1 }
[ D m p ( E i q , K i q , L i q , Y i q , C i q ) ] 1 = min θ i , m       s . t . h = 1 H i = 1 I h λ i E i p θ i , m E i q ;   h = 1 H i = 1 I h λ i K i p K i q ;   h = 1 H i = 1 I h λ i L i p L i q         h = 1 H i = 1 I h λ i Y i p Y i q         h H i = 1 I h λ i C i p = C i q + φ i         λ i 0 ,   i = 1 , , I h ,   h = 1 , , H ;   φ i 0 ,   i = 1 , , I h ,   h = 1 , , H         p , q { t , t + 1 }
where θ i , g and θ i , m respectively reflect the energy-use efficiency.
Following [23], the technology-change effect under the group frontier can be measured by [ D g t ( E i t + 1 , K i t + 1 , L i t + 1 , Y i t + 1 , C i t + 1 ) D g t + 1 ( E i t + 1 , K i t + 1 , L i t + 1 , Y i t + 1 , C i t + 1 ) D g t ( E i t , K i t , L i t , Y i t , C i t ) D g t + 1 ( E i t , K i t , L i t , Y i t , C i t ) ] 1 / 2 . Meanwhile, the technology-change effect under the meta-frontier can be measured by [ D m t ( E i t + 1 , K i t + 1 , L i t + 1 , Y i t + 1 , C i t + 1 ) D m t + 1 ( E i t + 1 , K i t + 1 , L i t + 1 , Y i t + 1 , C i t + 1 ) D m t ( E i t , K i t , L i t , Y i t , C i t ) D m t + 1 ( E i t , K i t , L i t , Y i t , C i t ) ] 1 / 2 . Combining these two effects, the change in energy-use technology among the different types of economies can effectively reflect their heterogeneity in technology.
Combined with the LMDI decomposition form, the contribution of each influencing factor in Equation (5) can be calculated using Equations (A3)–(A8):
D E N S t , t + 1 = exp ( i = 1 I w i S V ln ( E N S i t + 1 E N S i t )
D P E I t , t + 1 = exp ( i = 1 I w i S V ln ( P E I i t + 1 P E I i t )
D T G E t , t + 1 = exp ( i = 1 I w i S V ln ( T G E i t + 1 T G E i t )
D G E F t , t + 1 = exp ( i = 1 I w i S V ln ( G E F i t + 1 G E F i t )
D G T C t , t + 1 = exp ( i = 1 I w i S V ln ( G T C i t + 1 G T C i t )
D E C A t , t + 1 = exp ( i = 1 I w i S V ln ( E C A i t + 1 E C A i t )
where w i S V represents the weight of country i in the sample, and w i S V = L ( C i t / C t , C i t + 1 / C t + 1 ) i = 1 I L ( C i t / C t , C i t + 1 / C t + 1 ) .

Appendix B

Table A1. Representative 42 sample countries and their classifications.
Group-LGroup-MGroup-S
NO.CountryNO.CountryNO.Country
1France15Austria29Tanzania
2Germany16Belgium30Iceland
3Italy17Ireland31Jordan
4Spain18Singapore32Macedonia
5Brazil19Sweden33Belarus
6Canada20Switzerland34Kyrgyz
7Japan21Chile35Mongolia
8America22Colombia36Senegal
9China23Denmark37Tajikistan
10Korea24Hungary38Tunisia
11Russian 25Israel39Nicaragua
12Turkey26New Zealand40Ecuador
13Netherlands27Portugal41Benin
14Indonesia28Romania42Bolivia

References

  1. Intergovernmental Panel on Climate Change. Summary for Policymakers of IPCC Special Report on Global Warming of 1.5 °C Approved by Governments; Intergovernmental Panel on Climate Change: Geneva, Switzerland, 2018. [Google Scholar]
  2. Intergovernmental Panel on Climate Change. Climate Change 2021: The Physical Science Basis. Contribution of Working Group I to the Sixth Assessment Report of the Intergovernmental Panel on Climate Change; Intergovernmental Panel on Climate Change: Geneva, Switzerland, 2021. [Google Scholar]
  3. Fuchs, R.; Brown, C.; Rounsevell, M. Europe’s Green Deal offshores environmental damage to other nations. Nature 2020, 586, 671–673. [Google Scholar] [CrossRef]
  4. Goh, T.; Ang, B.; Xu, X. Quantifying drivers of CO2 emissions from electricity generation Current practices and future extensions. Appl. Energy 2018, 231, 1191–1204. [Google Scholar] [CrossRef]
  5. Huo, C.; Hameed, J.; Sharif, A.; Albasher, G.; Alamri, O.; Alsultan, N.; Baig, N. Recent scenario and nexus of globalization to CO2 emissions: Evidence from wavelet and Quantile on Quantile Regression approach. Environ. Res. 2022, 212, 113067. [Google Scholar] [CrossRef]
  6. Janzen, R.; Davis, M.; Kumar, A. Evaluating long-term greenhouse gas mitigation opportunities through carbon capture, utilization, and storage in the oil sands. Energy 2020, 209, 118364. [Google Scholar] [CrossRef]
  7. Debone, D.; Leite, V.P.; Miraglia, S.G.E.K. Modelling approach for carbon emissions, energy consumption and economic growth: A systematic review. Urban Clim. 2021, 37, 100849. [Google Scholar] [CrossRef]
  8. Acheampong, A.O.; Boateng, E.B. Modelling carbon emission intensity: Application of artificial neural network. J. Clean. Prod. 2019, 225, 833–856. [Google Scholar] [CrossRef]
  9. Ajmi, A.N.; Hammoudeh, S.; Nguyen, D.K.; Sato, J.R. On the relationships between CO2 emissions, energy consumption and income: The importance of time variation. Energy Econ. 2015, 49, 629–638. [Google Scholar] [CrossRef]
  10. Zhu, Z.; Liao, H.; Cao, H.; Wang, L.; Wei, Y.M.; Yan, J. The differences of carbon intensity reduction rate across 89 countries in recent three decades. Appl. Energy 2014, 113, 808–815. [Google Scholar] [CrossRef]
  11. Dong, F.; Long, R.; Li, Z.; Dai, Y. Analysis of carbon emission intensity, urbanization and energy mix: Evidence from China. Nat. Hazards 2016, 82, 1375–1391. [Google Scholar] [CrossRef]
  12. Wang, Q.; Hang, Y.; Su, B.; Zhou, P. Contributions to sector-level carbon intensity change: An integrated decomposition analysis. Energy Econ. 2018, 70, 12–25. [Google Scholar] [CrossRef]
  13. Su, B.; Ang, B.W. Structural decomposition analysis applied to energy and emissions: Some methodological developments. Energy Econ. 2012, 34, 177–188. [Google Scholar] [CrossRef]
  14. Shao, S.; Yang, L.; Gan, C. Using an extended LMDI model to explore techno-economic drivers of energy-related industrial CO2 emission changes: A case study for Shanghai (China). Renew. Sustain. Energy Rev. 2016, 55, 516–536. [Google Scholar] [CrossRef] [Green Version]
  15. Long, H.; Xie, R.; Gao, C.; Sun, M.; Su, B. Analysis of China’s regional differences in water consumption based on spatial structural decomposition analysis model. Sci. Total Environ. 2022, 848, 157629. [Google Scholar] [CrossRef]
  16. Wang, H.; Ang, B.W.; Su, B. A multi-region structural decomposition analysis of global CO2 emission intensity. Ecol. Econ. 2017, 142, 163–176. [Google Scholar] [CrossRef]
  17. Ang, B.W. LMDI decomposition approach: A guide for implementation. Energy Policy 2015, 86, 233–238. [Google Scholar] [CrossRef]
  18. Hang, Y.; Wang, Q.; Wang, Y.; Su, B.; Zhou, D. Industrial SO2 emissions treatment in China: A temporal-spatial whole process decomposition analysis. J. Environ. Manag. 2019, 243, 419–434. [Google Scholar] [CrossRef]
  19. Ang, B.W.; Zhang, F.Q. A survey of index decomposition analysis in energy and environmental studies. Energy 2000, 25, 1149–1176. [Google Scholar] [CrossRef]
  20. Zhang, W.; Li, K.; Zhou, D.; Zhang, W.; Gao, H. Decomposition of intensity of energy-related CO2 emission in Chinese provinces using the LMDI method. Energy Policy 2016, 92, 369–381. [Google Scholar] [CrossRef]
  21. Zhou, D.; Huang, F.; Wang, Q.W.; Liu, X. The role of structure change in driving CO2 emissions from China’s waterway transport sector. Resour. Conserv. Recycl. 2021, 171, 105627. [Google Scholar] [CrossRef]
  22. Pasurka, C.A. Decomposing electric power plant emissions within a joint production framework. Energy Econ. 2006, 28, 26–43. [Google Scholar] [CrossRef]
  23. Zhou, P.; Ang, B.W. Decomposition of aggregate CO2 emissions: A production-theoretical approach. Energy Econ. 2008, 30, 1054–1067. [Google Scholar] [CrossRef]
  24. Bulut, U.; Muratoglu, G. Renewable energy in Turkey: Great potential, low but increasing utilization, and an empirical analysis on renewable energy-growth nexus. Energy Policy 2018, 123, 140–150. [Google Scholar] [CrossRef]
  25. Shironitta, K.; Okamoto, S.; Kagawa, S. Cross-country analysis of relationship between material input structures and consumption-based CO2 emissions. Environ. Econ. Policy Stud. 2019, 21, 533–554. [Google Scholar] [CrossRef]
  26. Xiao, H.; Sun, K.J.; Tu, X.W.; Bi, H.M.; Wen, M. Diversified carbon intensity under global value chains: A measurement and decomposition analysis. J. Environ. Manag. 2020, 272, 111076. [Google Scholar] [CrossRef]
  27. Färe, R.; Grosskopf, S.; Pasurka, C.A. Pollution abatement activities and traditional productivity. Ecol. Econ. 2007, 62, 673–682. [Google Scholar] [CrossRef]
  28. Liu, X.; Hang, Y.; Wang, Q.W.; Chiu, C.; Zhou, D. The role of energy consumption in global carbon intensity change: A meta-frontier-based production-theoretical decomposition analysis. Energy Econ. 2022, 109, 105968. [Google Scholar] [CrossRef]
  29. O’Donnell, C.J.; Rao, D.S.P.; Battese, G. Metafrontier frameworks for the study of firm-level efficiencies and technology ratios. Empir. Econ. 2008, 34, 231–255. [Google Scholar] [CrossRef]
  30. Lin, B.; Du, K. Decomposing energy intensity change: A combination of index decomposition analysis and production-theoretical decomposition analysis. Appl. Energy 2014, 129, 158–165. [Google Scholar] [CrossRef]
  31. Zhang, N.; Wang, B. A deterministic parametric metafrontier Luenberger indicator for measuring environmentally-sensitive productivity growth: A Korean fossil-fuel power case. Energy Econ. 2015, 51, 88–98. [Google Scholar] [CrossRef]
  32. Oh, D.H. A metafrontier approach for measuring an environmentally sensitive productivity growth index. Energy Econ. 2010, 32, 146–157. [Google Scholar] [CrossRef]
  33. Barro, R.J.; Sala-i-Martin, X. Public finance in models of economic growth. Rev. Econ. Stud. 1992, 59, 645–661. [Google Scholar] [CrossRef] [Green Version]
  34. Chen, J. Carbon neutrality: Toward a sustainable future. Innovation 2021, 2, 100127. [Google Scholar] [CrossRef]
  35. Wang, H.; Ang, B.W.; Su, B. Assessing drivers of economy-wide energy use and emissions: IDA versus SDA. Energy Policy 2017, 107, 585–599. [Google Scholar] [CrossRef]
  36. Wang, Z.; Chen, H.; Huo, R.; Wang, B.; Zhang, B. Marginal abatement cost under the constraint of carbon emission reduction targets: An empirical analysis for different regions in China. J. Clean. Prod. 2020, 249, 119362. [Google Scholar] [CrossRef]
  37. Wang, S.; Zhu, X.; Song, D. Drivers of CO2 Emissions from Power Generation in China Based on Modified Struc-tural Decomposition Analysis. J. Clean. Prod. 2019, 220, 1143–1155. [Google Scholar] [CrossRef]
Figure 1. Multi-process decomposition framework.
Energies 15 08802 g001
Figure 2. Energy intensity distribution of the different groups.
Energies 15 08802 g002
Figure 3. Time series changes in energy efficiency of the different groups during the period of 2012–2019.
Energies 15 08802 g003
Figure 4. Time series changes in energy-use technology of the different groups during the period of 2012–2019.
Energies 15 08802 g004
Figure 5. Cumulative changes in the sample countries’ carbon emissions and its decomposition, 2012–2019.
Energies 15 08802 g005
Figure 6. The cumulative decomposition results for the sample countries’ carbon emission change by processes of the different groups, 2012–2019.
Energies 15 08802 g006
Table 1. Connotations of carbon emissions change influencing processes and factors.
FactorsConnotation (during the Period of t to t+1)
Energy input process D E N S t , t + 1 The effect of energy structure on the carbon emission changes.
Production process D P E I t , t + 1 The effect of potential energy intensity on the carbon emission changes.
D T G E t , t + 1 The effect of the technology gap on the carbon emission changes.
D G E F t , t + 1 The effect of group energy efficiency on the carbon emission changes.
D G T C t , t + 1 The effect of group technology progress on the carbon emission changes.
Economic output process D E C A t , t + 1 The effect of economic output on the carbon emission changes.
Table 2. Test for β -convergence of energy intensity.
All SampleGroup-LGroup-MGroup-S
α −0.0220
(−1.5814)
−0.0207 *
(−1.9564)
−0.0154
(−0.3106)
−0.0263 **
(−1.9116)
β −0.9141 ***
(−6.3426)
−0.9527 ***
(−4.6013)
−0.9869 ***
(−4.2586)
−1.8864 ***
(−6.7649)
Adj - R 2 0.57340.48110.33600.7524
Note: (i) “***”, “**”, and “*” indicate that the levels of 1%, 5% and 10% are significant, respectively; (ii) values in brackets are t-statistics.
Table 3. Changes in sample countries’ carbon emissions and its decomposition, 2012–2019.
Period Energy Consumption Economic Development Total
ENSENIECA
PEITEGGEFGTC
2012–20131.01480.89910.88180.98471.12061.14801.0192
2013–20140.98831.02530.98860.99421.00211.01461.0126
2014–20150.99660.91051.02841.00481.00261.07521.0108
2015–20161.02510.87190.97381.00781.03981.10831.0109
2016–20170.99600.95010.99511.00791.00601.06821.0200
2017–20180.98960.93811.03440.99720.99531.07091.0207
2018–20190.99230.94901.17731.00730.86301.04631.0083
G-mean0.99960.93381.00811.00051.00161.08391.0146
0.9434
Table 4. Single-period attribution results leads to different groups (Unit: %).
2012–20132013–20142014–20152015–20162016–20172017–20182018–2019
PEIGroup-L−9.16361.7567−8.5300−10.8257−4.7901−6.3618−4.6767
Group-M−0.75850.4784−0.3191−0.8711−0.2660−0.0410−0.3618
Group-S−0.24850.1930−0.0802−0.0806−0.02250.1658−0.1523
TEGGroup-L−12.0480−1.63802.7604−3.0240−0.69323.213017.7065
Group-M0.15560.3930−0.00080.29950.00480.1770−0.1863
Group-S−0.01390.0015−0.01760.00670.0992−0.04700.0864
GEFGroup-L−1.8079−0.57060.21680.57530.3896−0.46411.1343
Group-M0.2167−0.16410.2048−0.14730.2135−0.0622−0.0674
Group-S−0.04000.0533−0.04100.25410.08680.1502−0.4337
GTCGroup-L12.49560.67480.47304.06040.75000.0643−14.4655
Group-M−0.5998−0.4309−0.34410.1056−0.0547−0.27720.2166
Group-S0.0500−0.13400.0287−0.2888−0.1971−0.35990.4604
Publisher’s Note: MDPI stays neutral with regard to jurisdictional claims in published maps and institutional affiliations.