
Optical Properties of Coal after Ex-Situ Experimental Simulation of Underground Gasification at Pressures of 10 and 40 bar
 , , and
Abstract
:1. Introduction
2. Experimental Methods
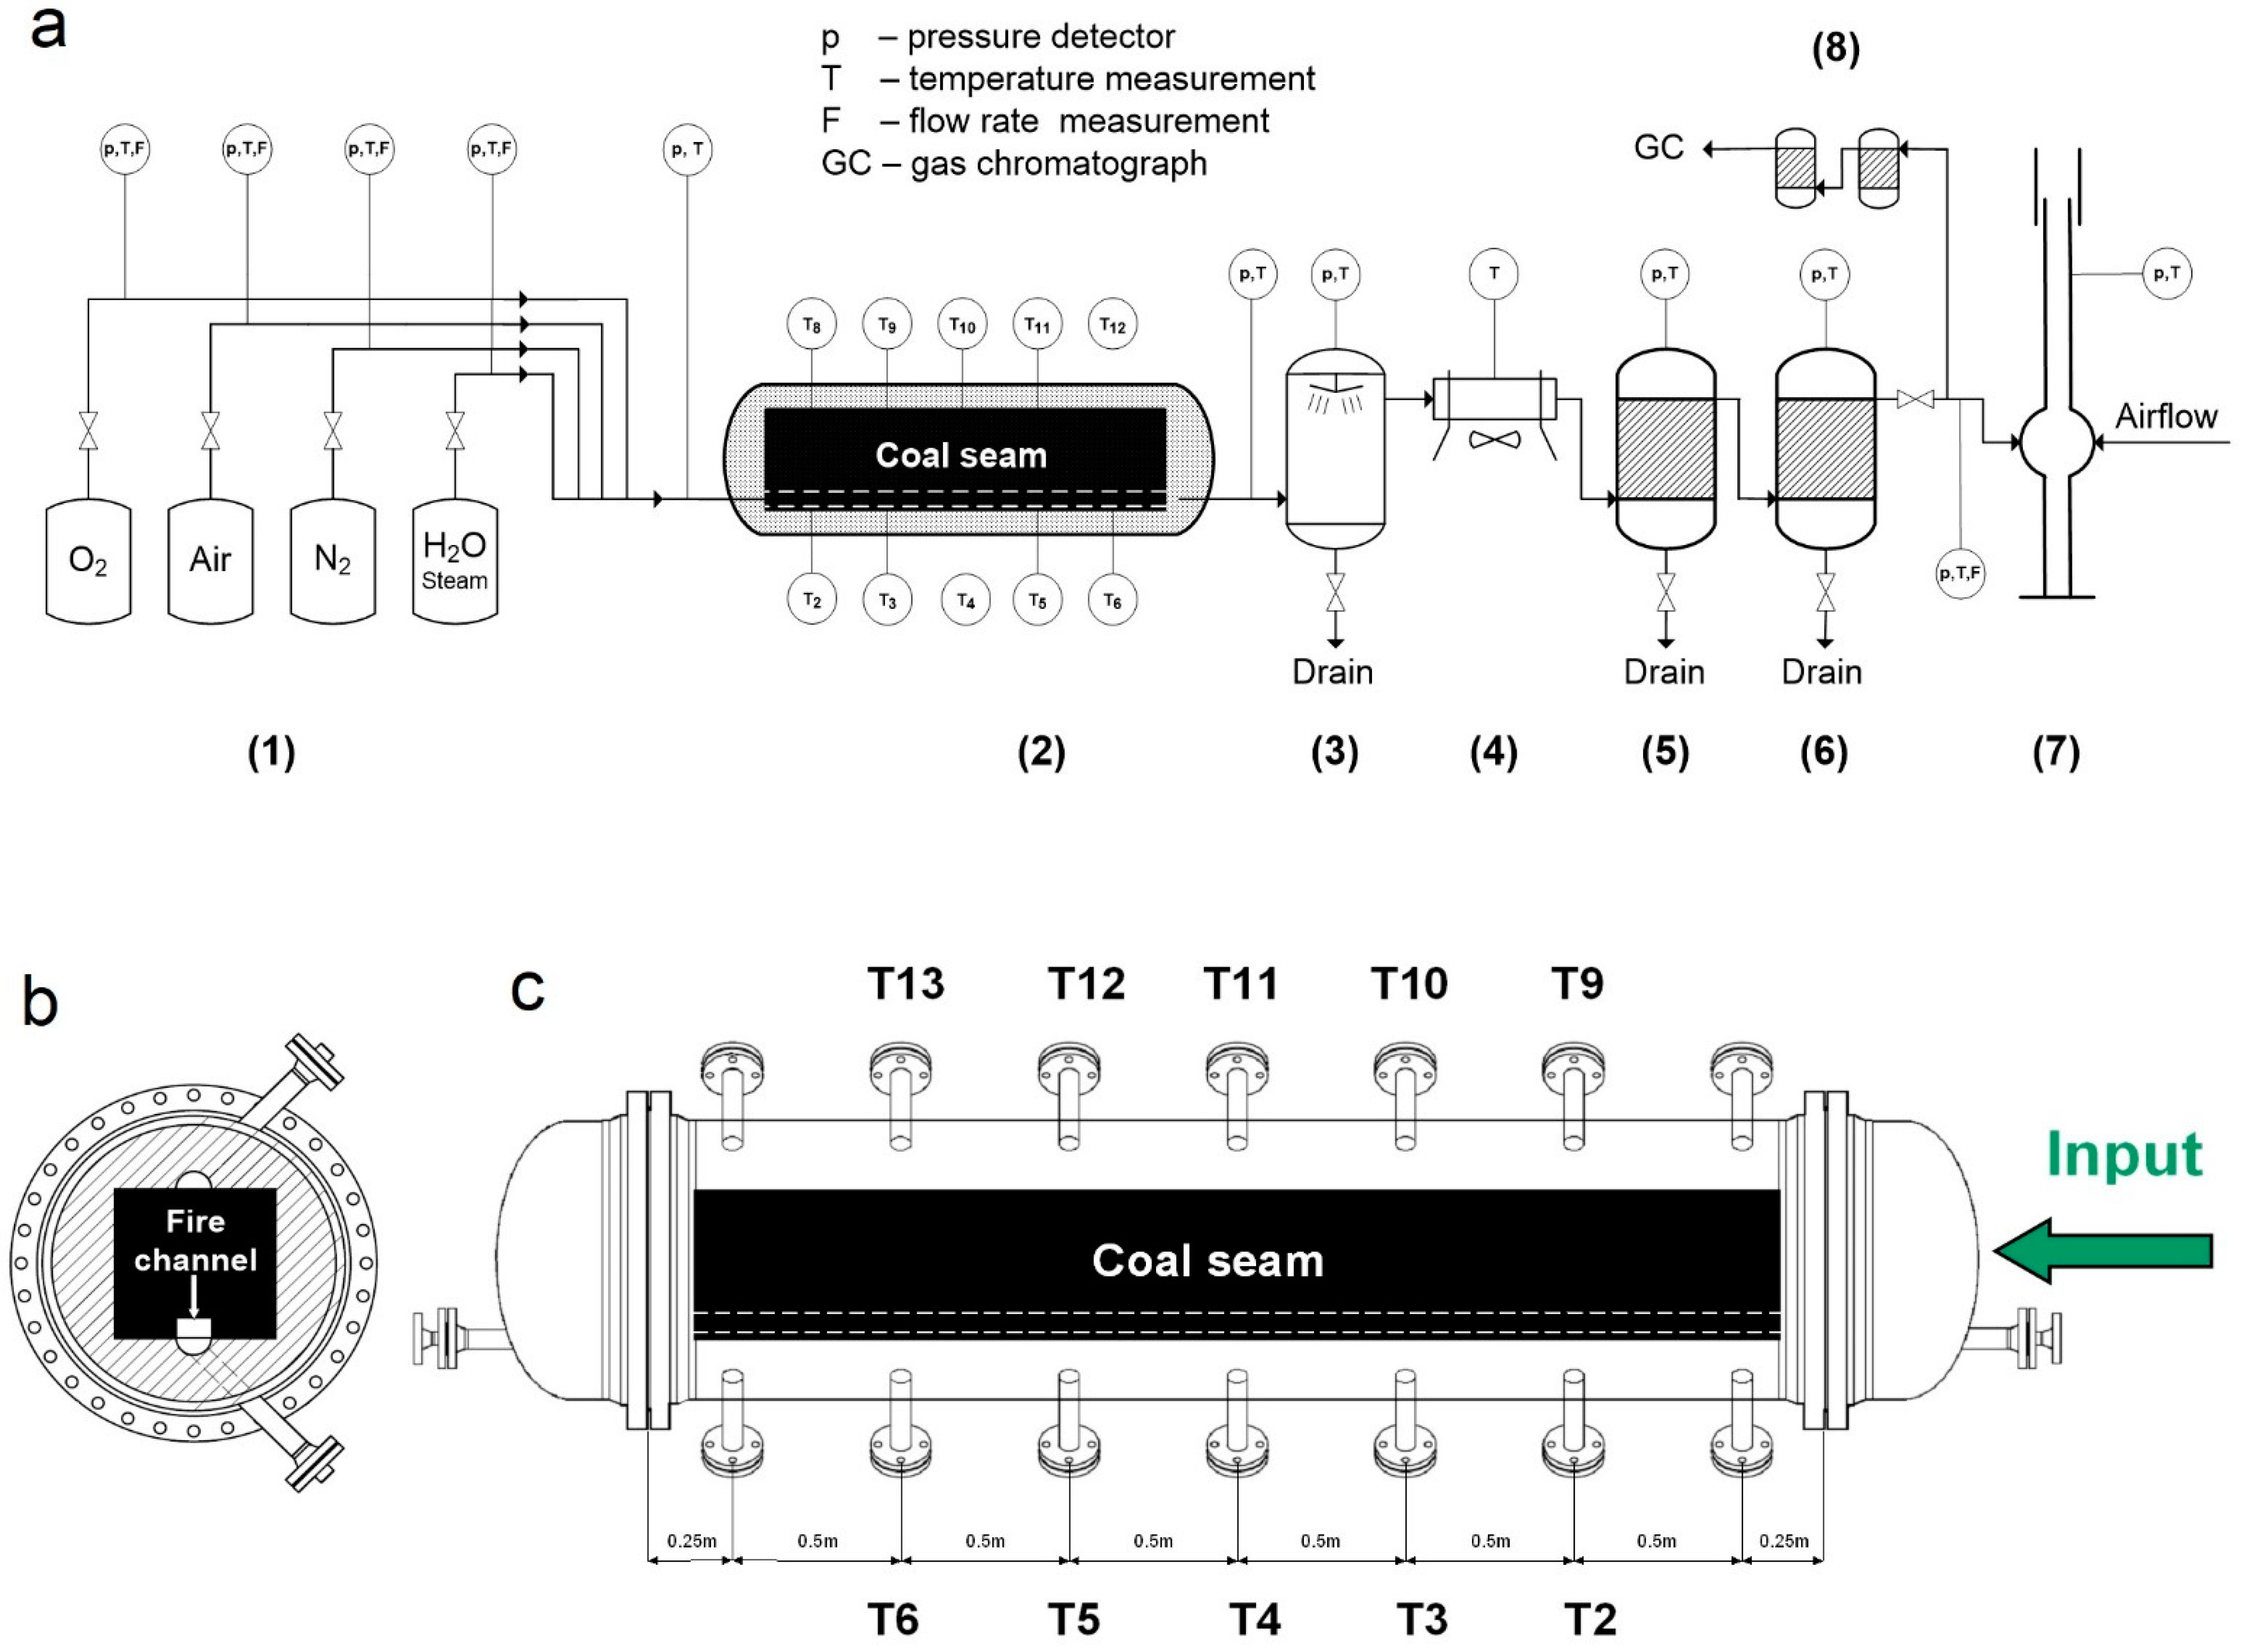
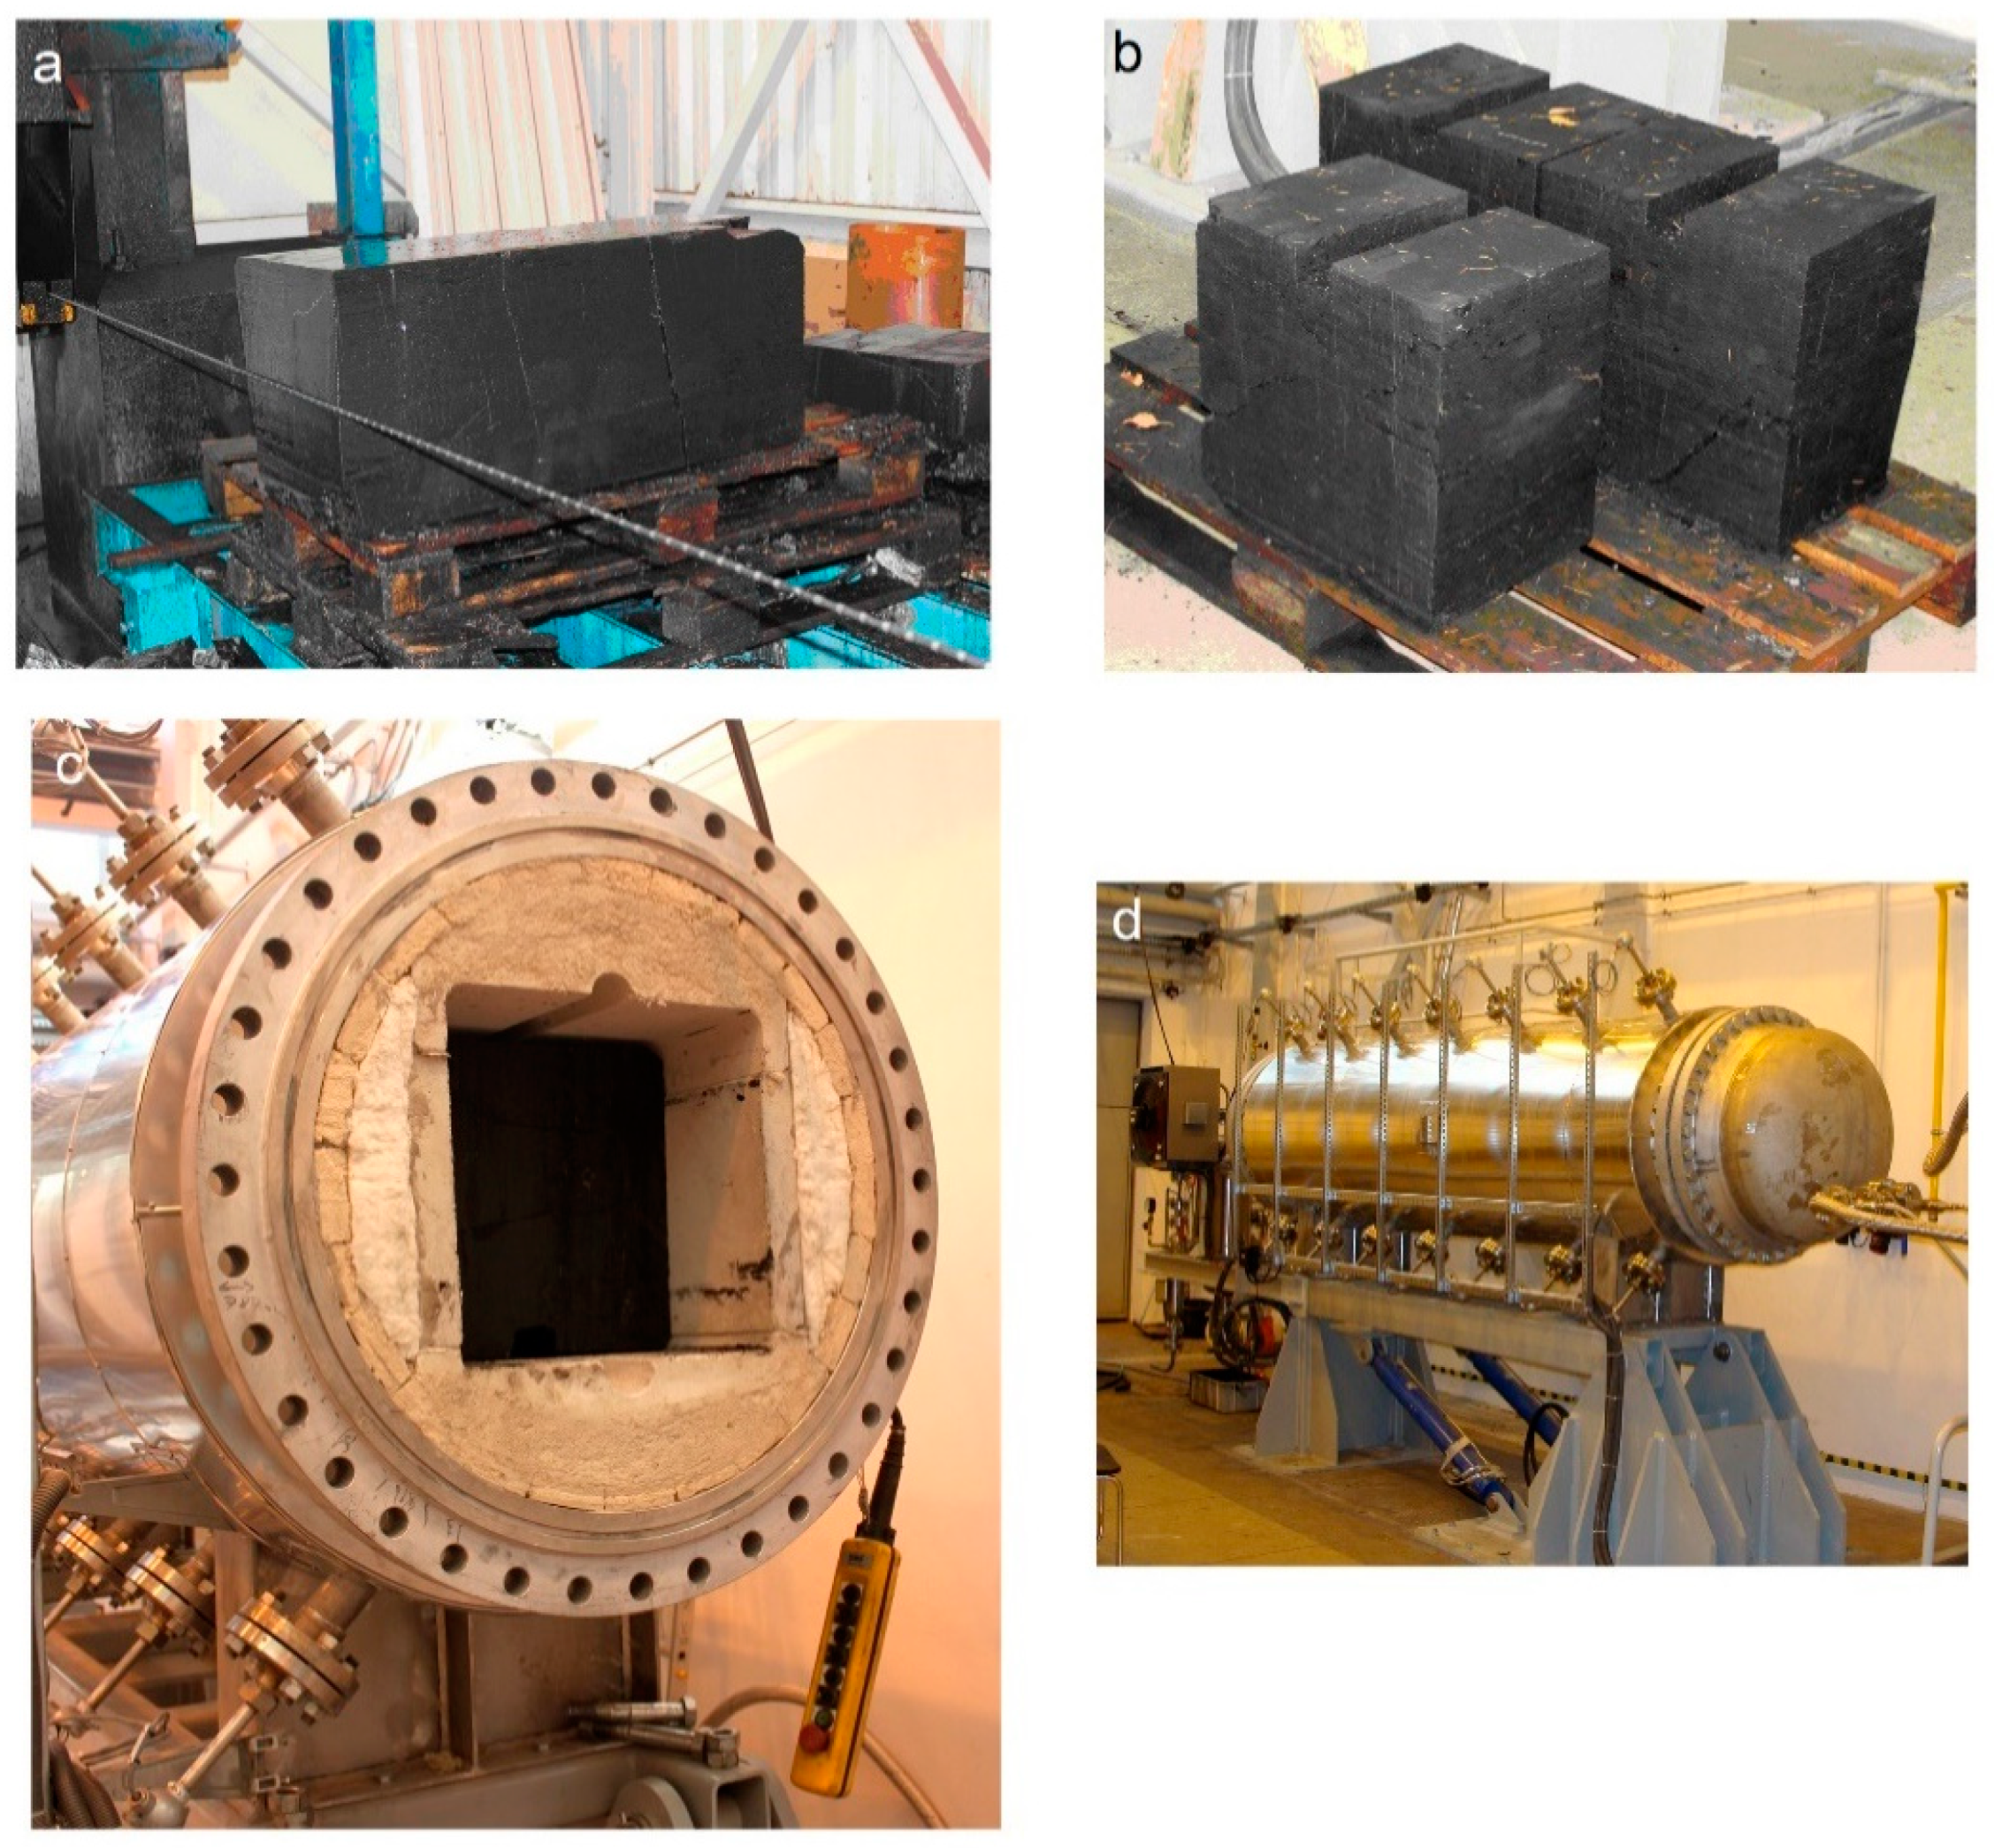
2.1. Reactor Construction and Sample Preparation
2.2. Experiment Parameters and Sampling
2.3. Analyses Methods
3. Results
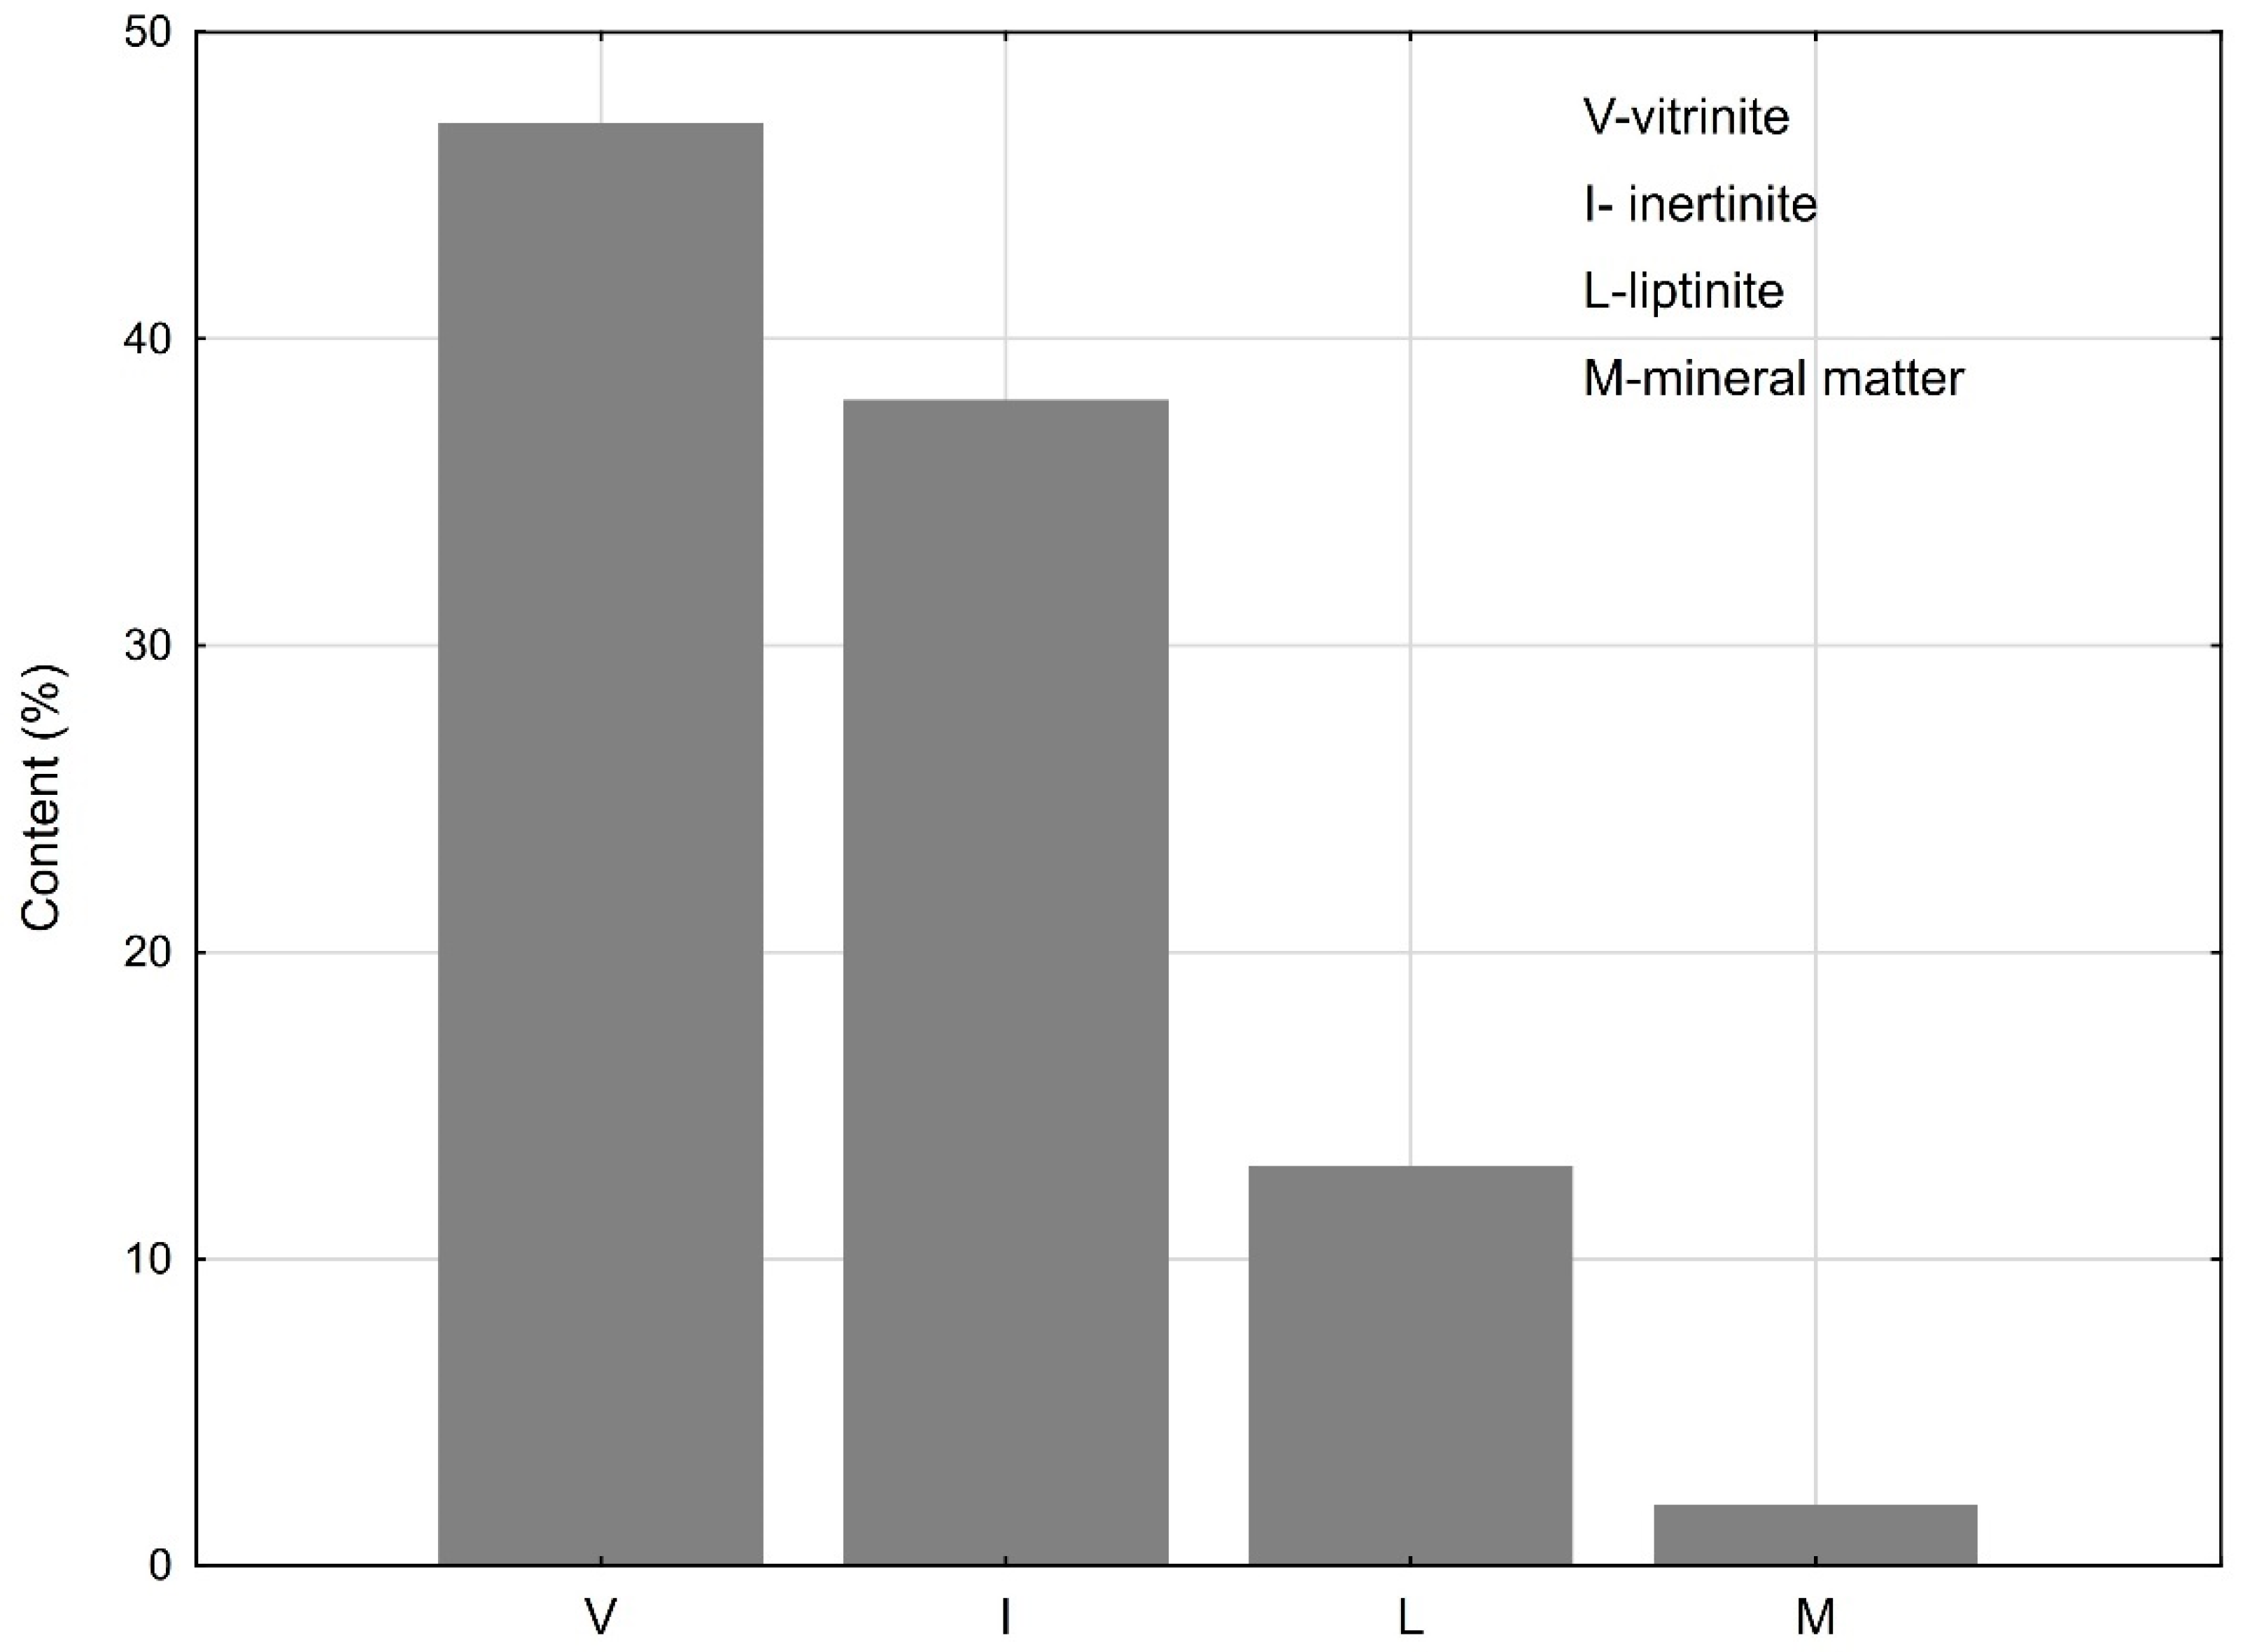
3.1. Properties of Raw Coal Sample before Gasification
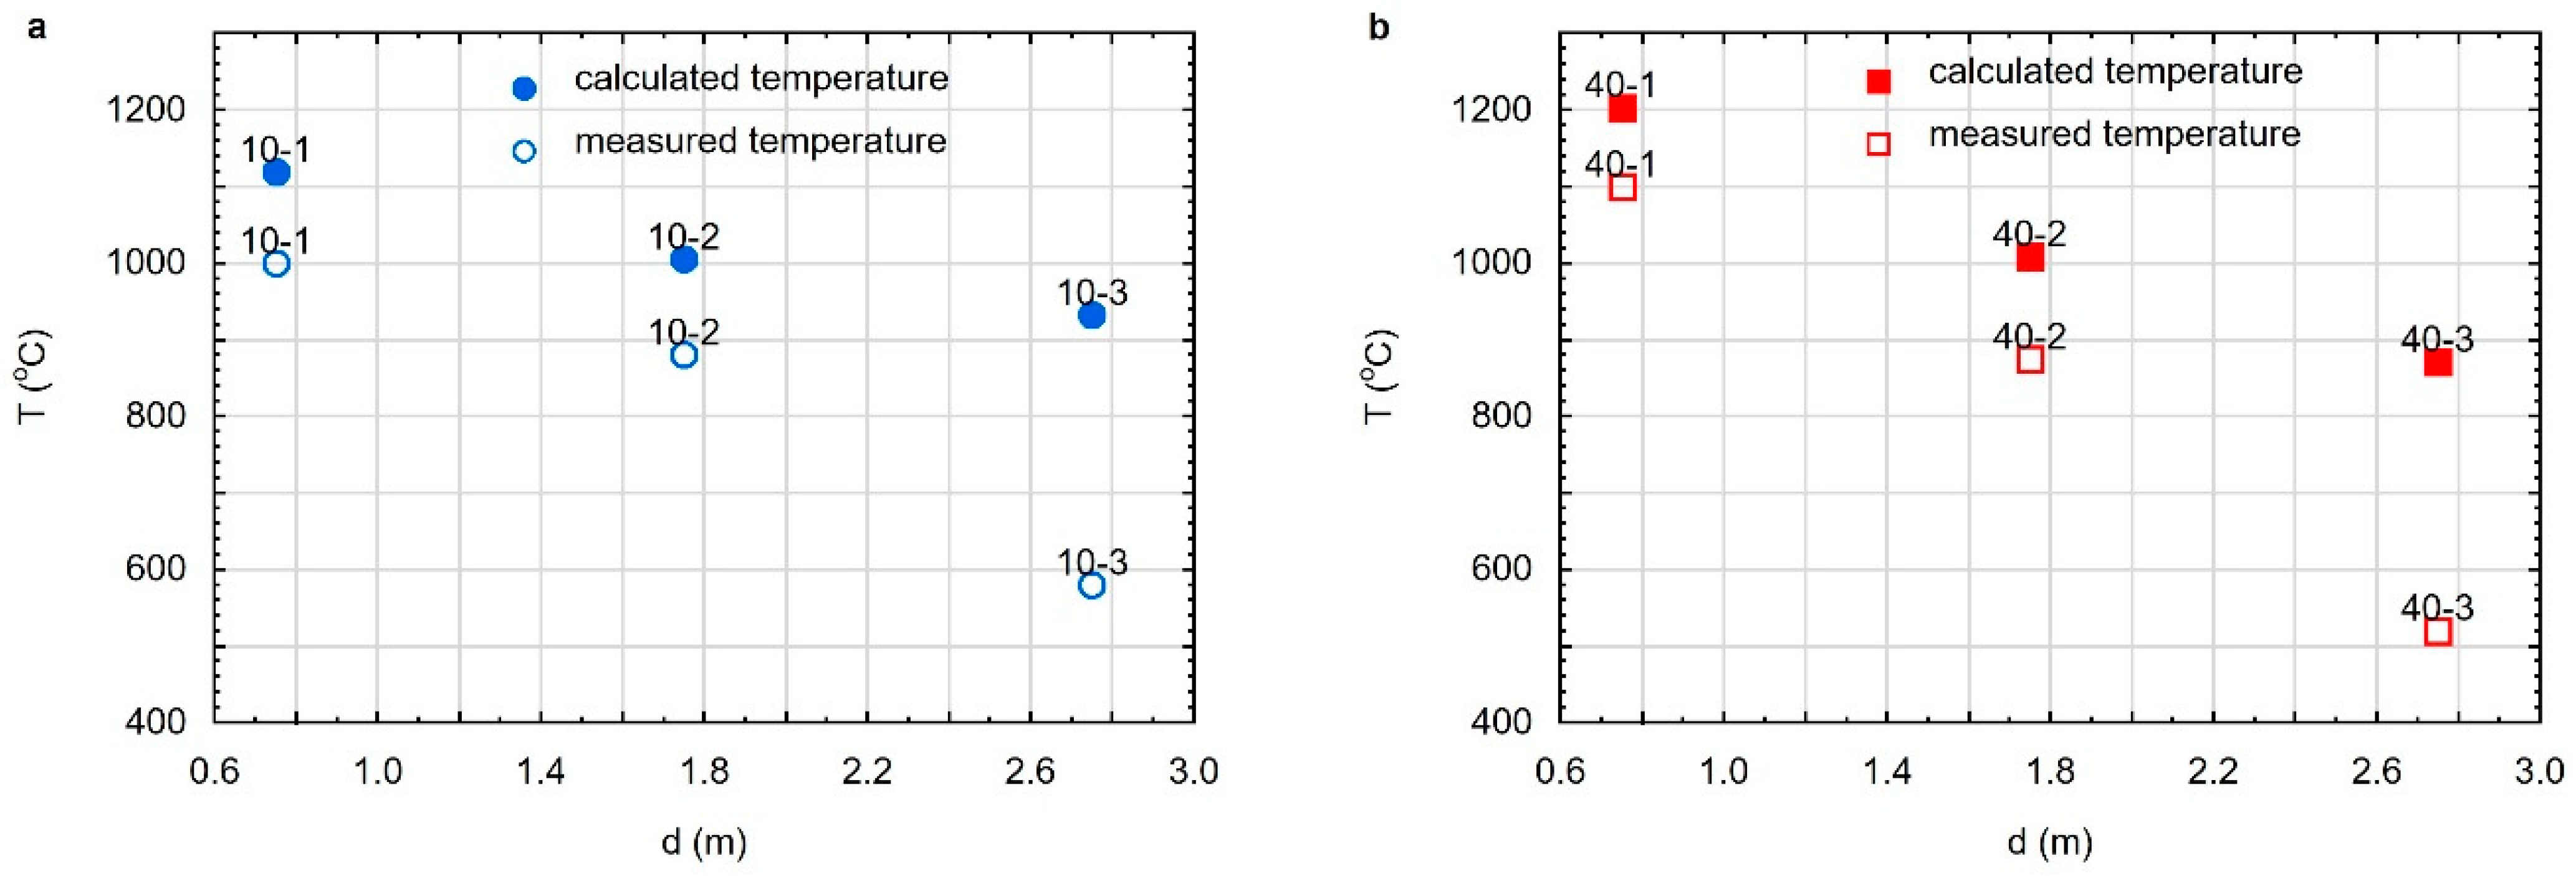
3.2. Temperature Distribution in the Reactor during Gasification
3.3. Properties of Residues after Coal Gasification
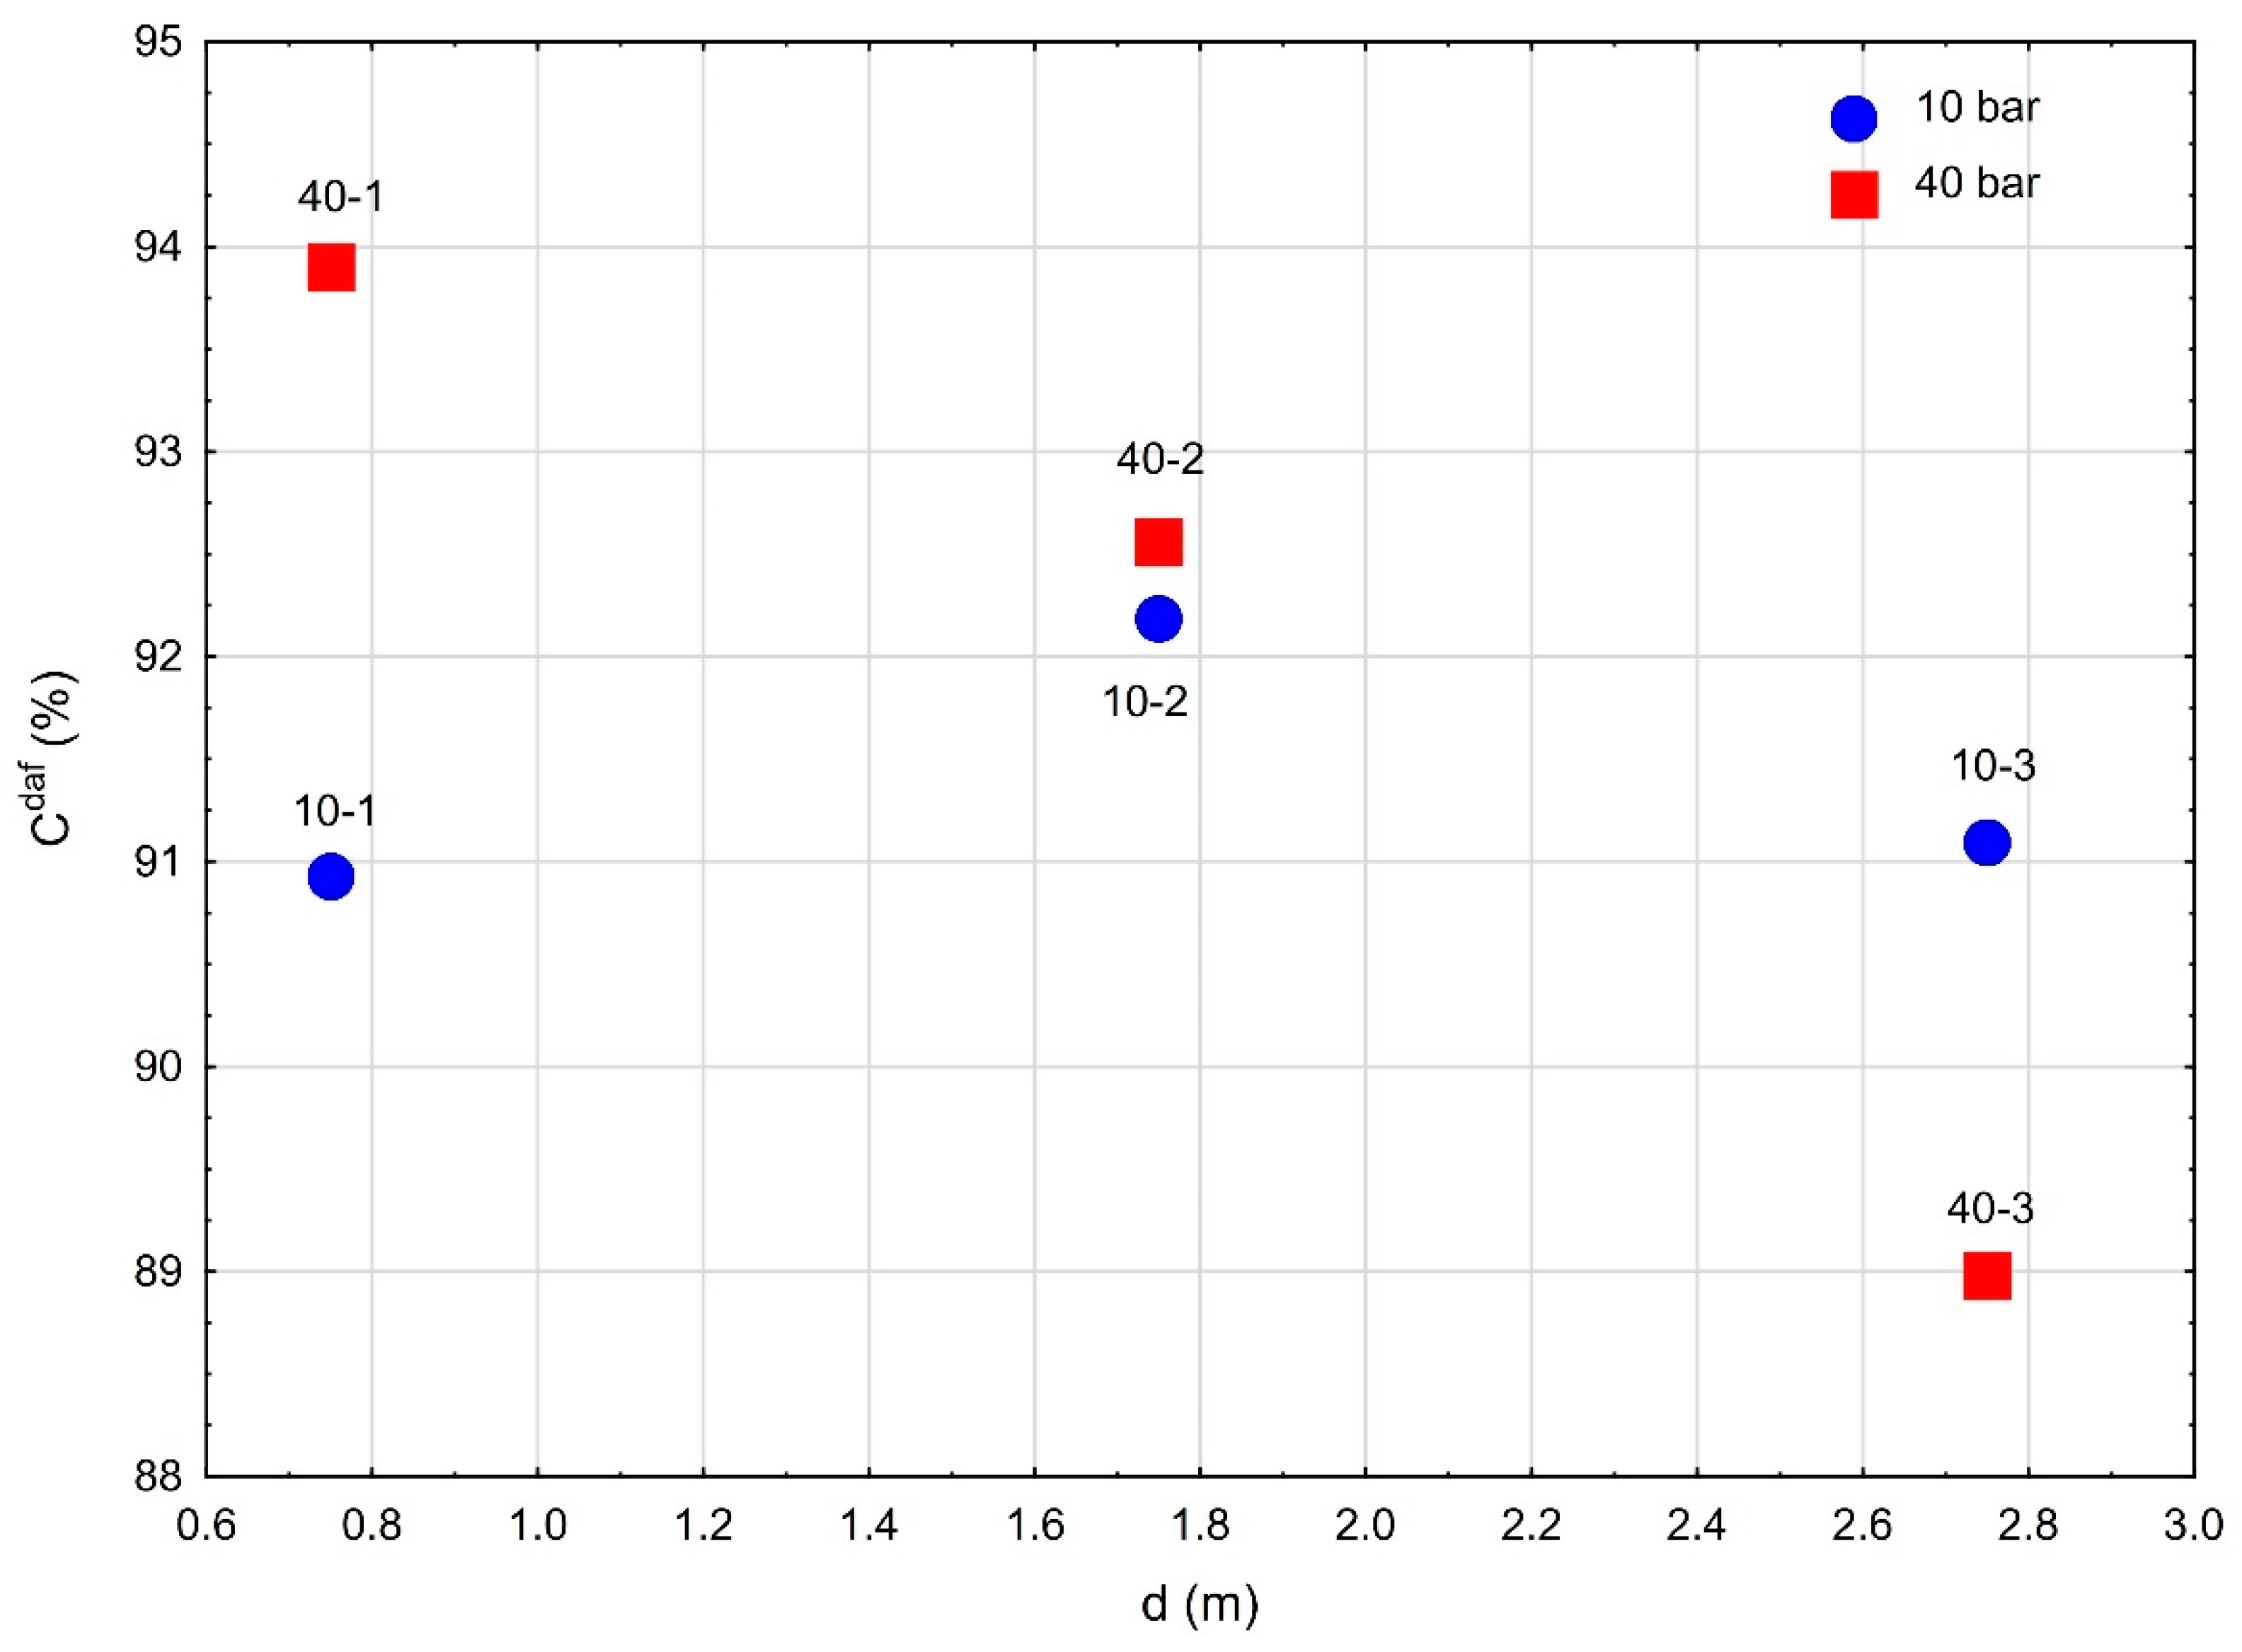
3.3.1. Elemental Analysis
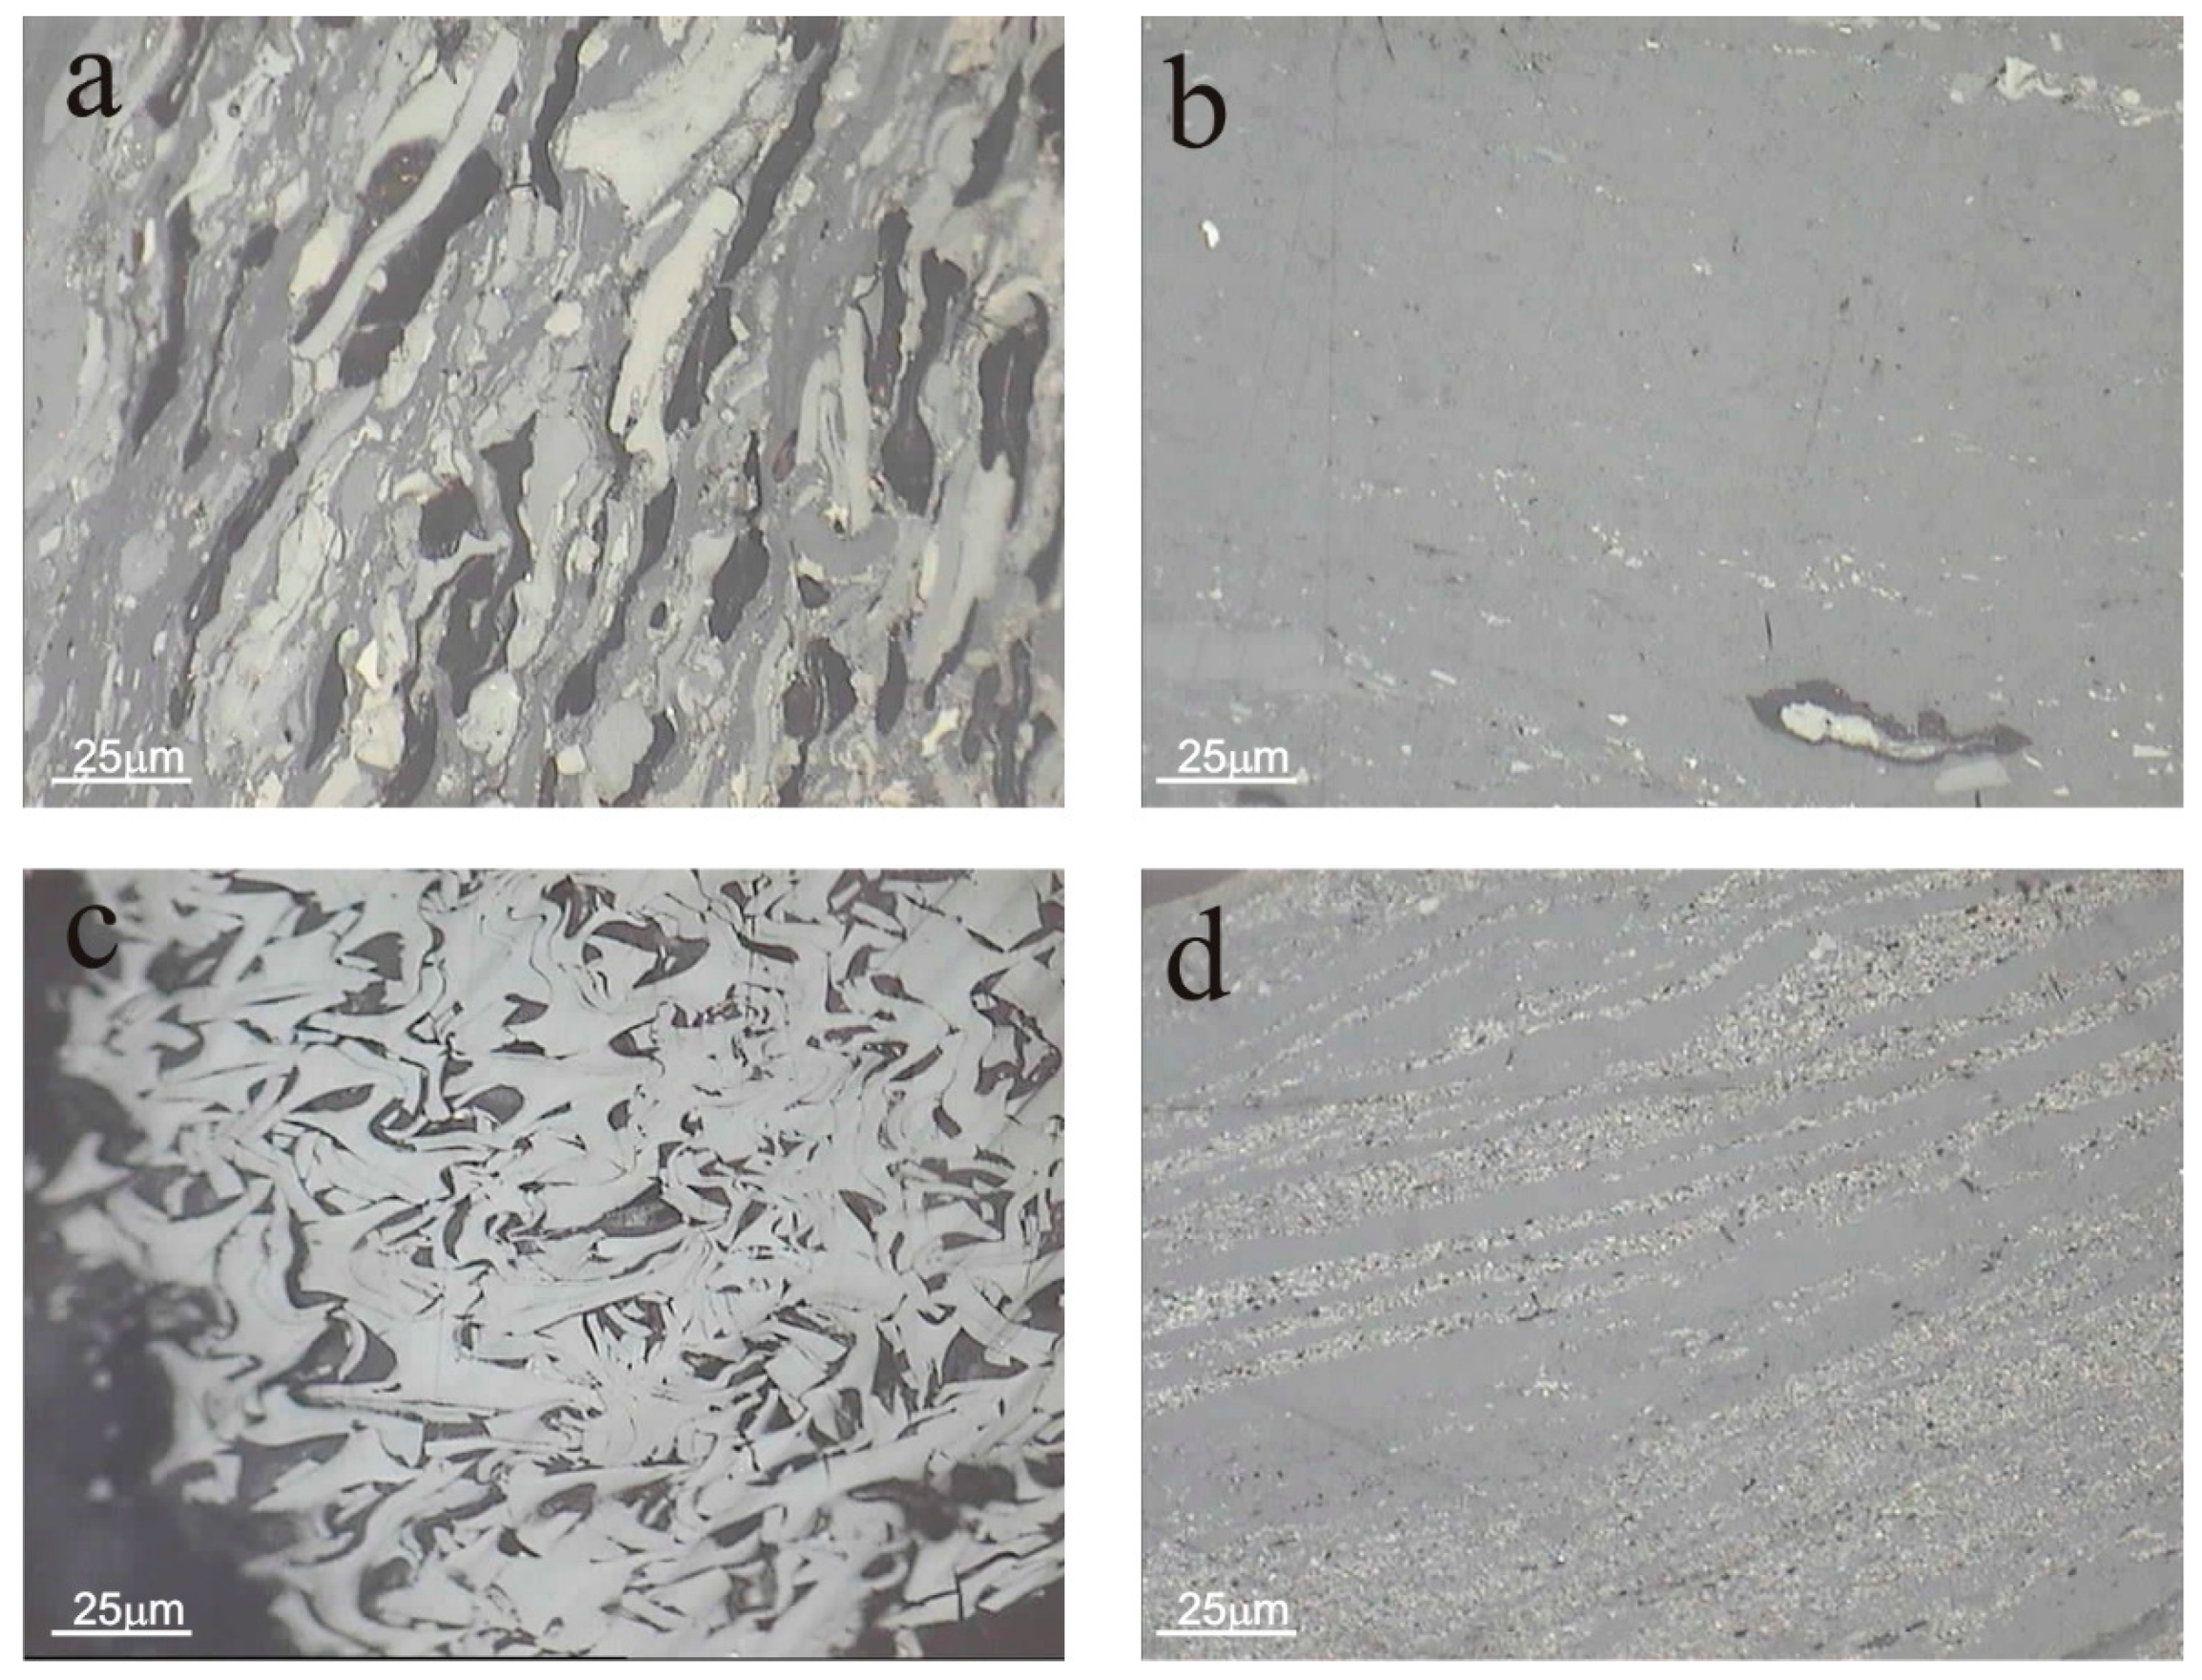
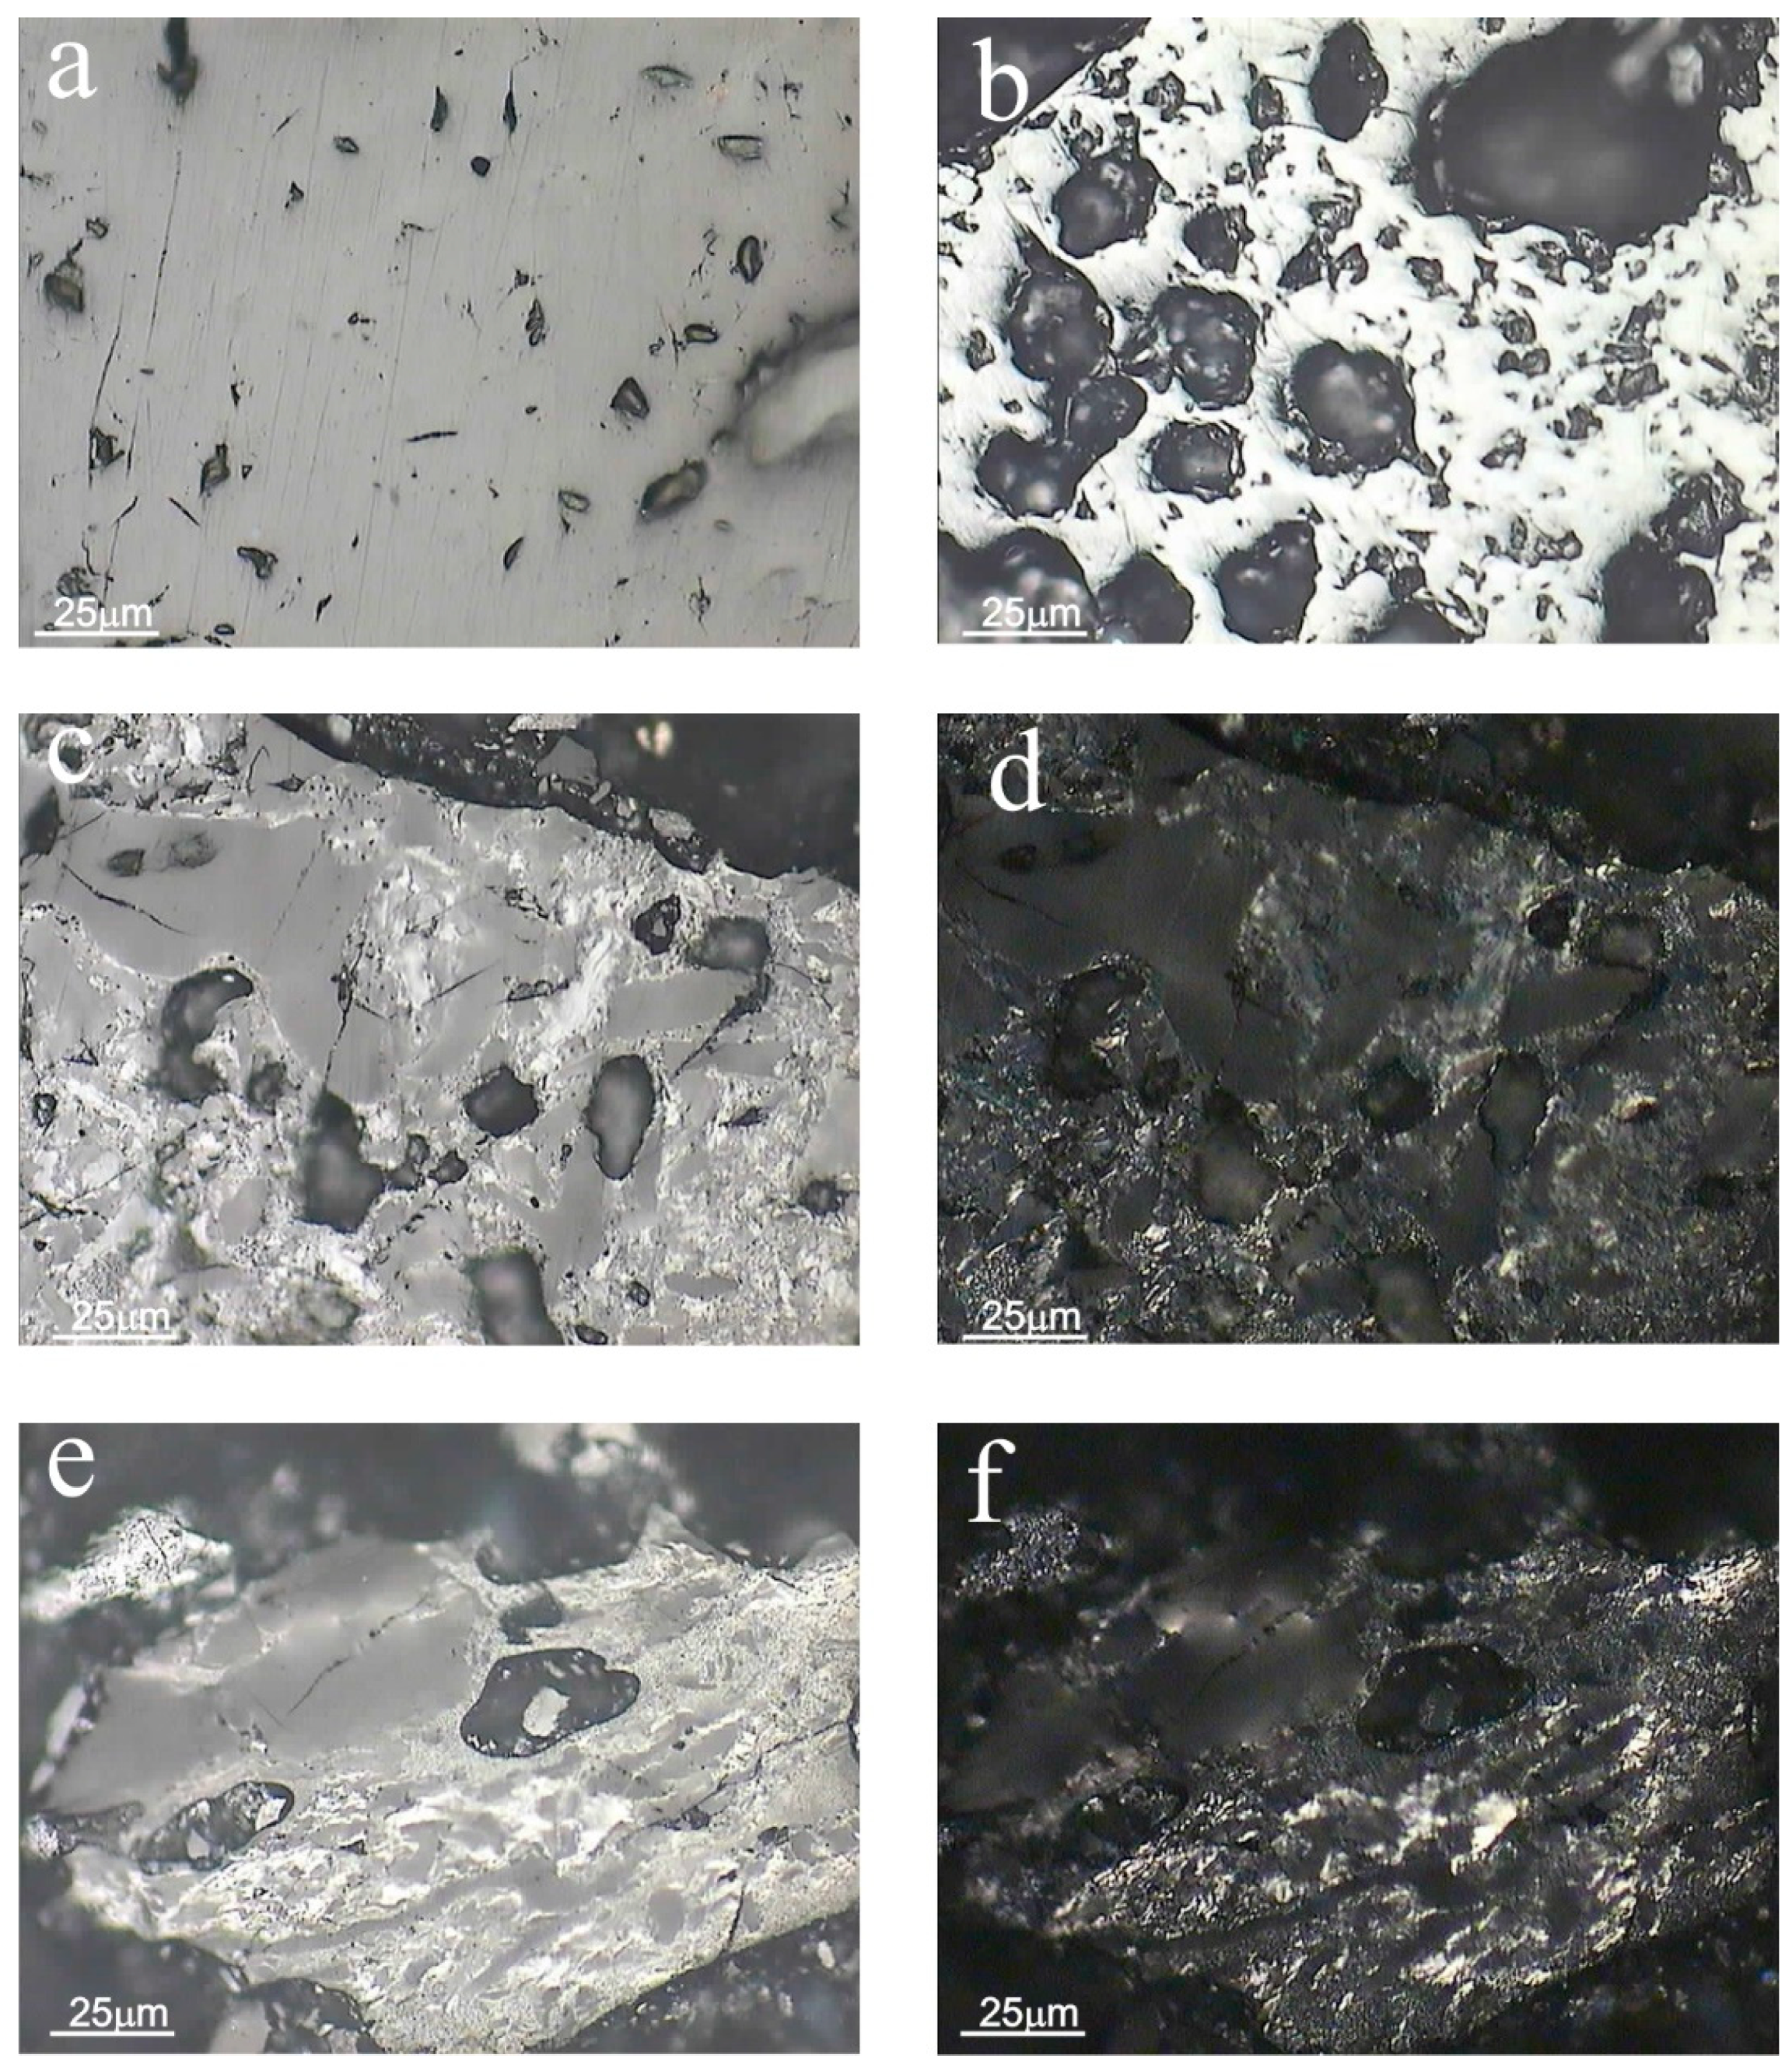
3.3.2. Optical Properties of the Residue after Gasification at a Pressure of 10 Bar
3.3.3. Optical Properties of the Residue after Gasification at a Pressure of 40 Bar
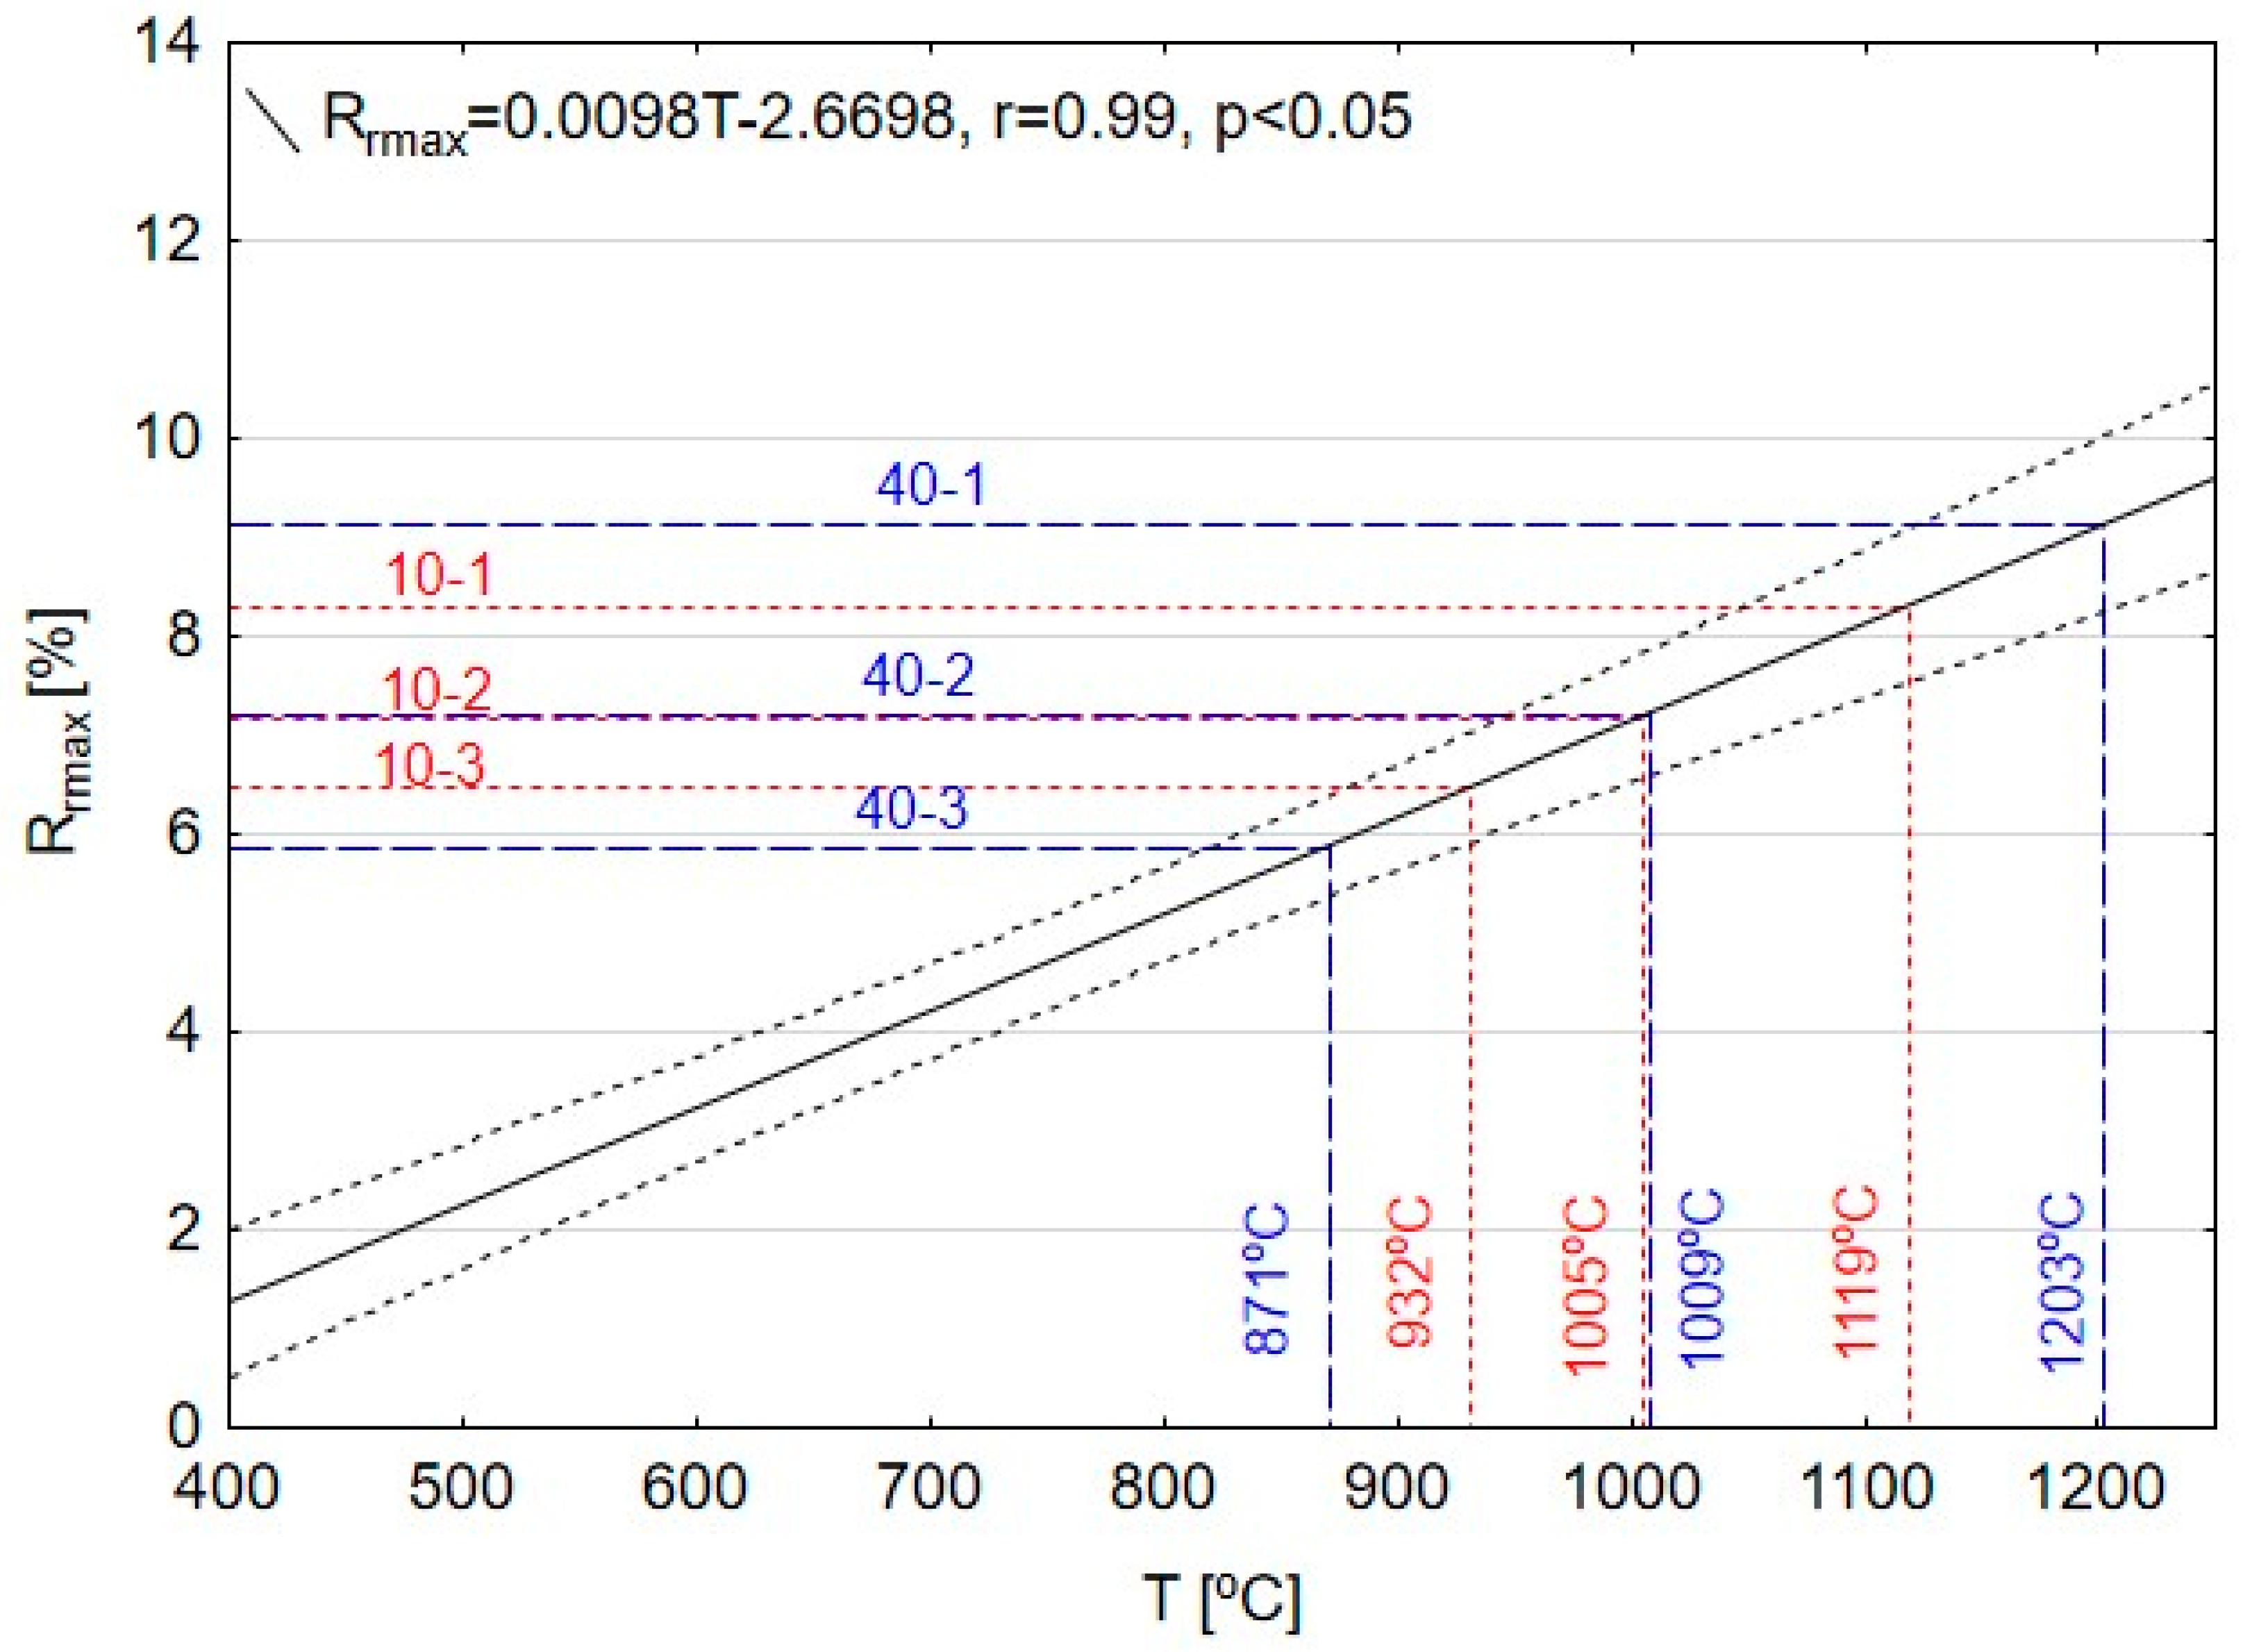
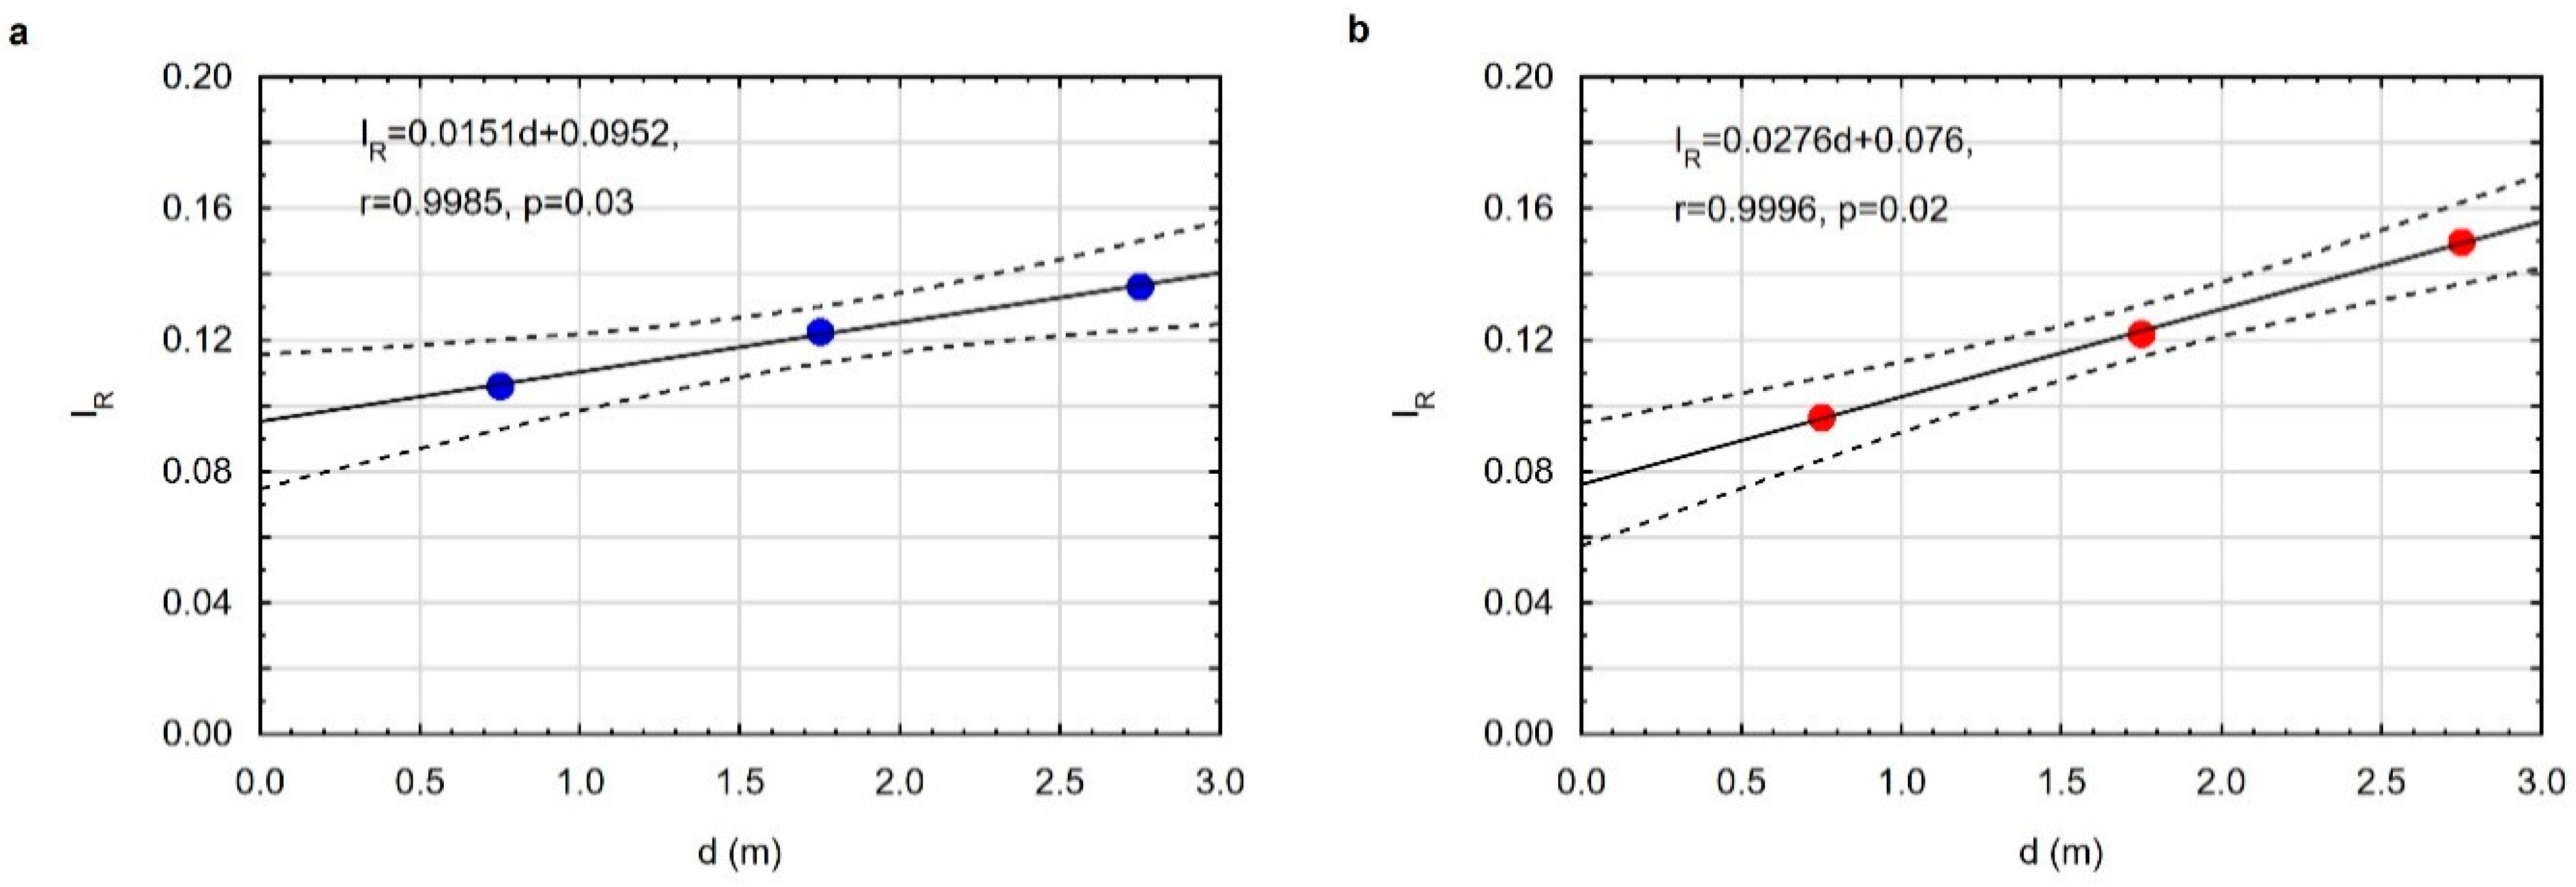
3.4. Maximum Temperature and Range of the Coal Gasification Process
4. Conclusions
Author Contributions
Funding
Data Availability Statement
Conflicts of Interest
References
- Gregg, D.W.; Edgar, T.F. Underground coal gasification. AIChE J. 1978, 24, 753–781. [Google Scholar] [CrossRef]
- Maev, S.; Bliderman, M.S.; Gruber, G.P. Underground coal gasification (UCG) to products: Designs, efficiencies, and economics. Undergr. Coal Gasif. Combust. 2018, 435–468. [Google Scholar] [CrossRef]
- Burton, E.; Friedmann, J.; Upadhye, R. Best Practices in Underground Coal Gasification; Lawrence Livermore National Laboratory: Livermore, CA, USA, 2019. [Google Scholar]
- Shafirovich, E.; Varma, A. Underground coal gasification: A brief review of current status. Ind. Eng. Chem. Res. 2009, 48, 7865–7875. [Google Scholar] [CrossRef]
- Klimenko, A. Early Ideas in Underground Coal Gasification and Their Evolution. Energies 2009, 2, 456–476. [Google Scholar] [CrossRef] [Green Version]
- Nieć, M.; Sermet, E.; Chećko, J.; Górecki, J. Evaluation of coal resources for underground gasification in Poland. Selection of possible UCG sites. Fuel 2017, 208, 193–202. [Google Scholar] [CrossRef]
- Frejowski, A.; Bondaruk, J.; Duda, A. Challenges and Opportunities for End-of-Life Coal Mine Sites: Black-to-Green Energy Approach. Energies 2021, 14, 1385. [Google Scholar] [CrossRef]
- Perkins, G. Underground coal gasification—Part II: Fundamental phenomena and modelling. Prog. Energy Combust. 2018, 67, 234–274. [Google Scholar] [CrossRef]
- Kapusta, K.; Stańczyk, K.; Wiatowski, M.; Chećko, J. Environmental aspects of a field-scale underground coal gasification trial in a shallow coal seam at the Experimental Mine Barbara in Poland. Fuel 2013, 113, 196–208. [Google Scholar] [CrossRef]
- Kasztelewicz, Z.; Ptak, K.; Zajączkowski, M. Szanse i zagrożenia podziemnego zgazowania węgla. Przegl. Górn. 2009, 1–2, 8–11. [Google Scholar]
- Nieć, M. Barriers and limitations for underground coal gasification. Bull. Państw. Inst. Geol. 2012, 448, 183–194. [Google Scholar]
- Nieć, M.; Chećko, J.; Górecki, J.; Sermet, E. State of the resources base of coal in Poland and deposits and environmental problems in relation to the underground coal gasification process. Przegl. Górn. 2014, 11, 28–37. [Google Scholar]
- Palarski, J.; Strozik, G.; Jendruś, R. The influence on the rock mass deformation on the protection of the surface and ground water resources by underground coal gasification. Przegl. Górn. 2013, 8, 149–155. [Google Scholar]
- Salamon, K.; Kabiesz, J. Selected aspects of hazards associated with the attempts of underground coal gasification. Przegl. Górn. 2013, 12, 23–31. [Google Scholar]
- Pankiewicz-Sperka, M.; Kapusta, K.; Basa, W.; Stolecka, K. Characteristics of Water Contaminants from Underground Coal Gasification (UCG) Process—Effect of Coal Properties and Gasification Pressure. Energies 2021, 14, 6533. [Google Scholar] [CrossRef]
- Wiatowski, M.; Kapusta, K.; Nowak, J.; Szyja, M.; Basa, W. An exsitu underground coal gasification experiment with a siderite interlayer: Course of the process, production gas, temperatures and energy efficiency. Int. J. Coal Sci. Technol. 2021, 8, 1447–1460. [Google Scholar] [CrossRef]
- Wiatowski, M.; Stańczyk, K.; Świądrowski, J.; Kapusta, K.; Cybulski, K.; Krause, E.; Grabowski, J.; Rogut, J.; Howaniec, N.; Smoliński, A. Semi-technical underground coal gasification (UCG) using the shaft method in Experimental Mine “Barbara”. Fuel 2012, 99, 170–179. [Google Scholar] [CrossRef]
- Bhutto, A.W.; Bazmi, A.A.; Zahedi, G. Underground coal gasification: From fundamentals to applications. Prog. Energy Combust. 2013, 39, 189–214. [Google Scholar] [CrossRef]
- Green, M. Underground coal gasification, state of the art. In Proceedings of the Clean Coal Conference’2008, Bedewo, Poland, 8 December 2008. [Google Scholar]
- Hydrogen-Oriented Underground Coal Gasification for Europe (HUGE). European Commission Final Report 2012; EUR 25044. Available online: https://op.europa.eu/en/publication-detail/-/publication/885cb5ab-9f08-11e5-8781-01aa75ed71a1 (accessed on 15 January 2021).
- Wiatowski, M.; Kapusta, K. Evolution of tar compounds in raw gas from a pilot-scale underground coal gasification (UCG) trial at Wieczorek mine in Poland. Fuel 2020, 276, 118070. [Google Scholar] [CrossRef]
- Kapusta, K.; Wiatowski, M.; Stańczyk, K.; Zagoršcak, R.; Hywel Rhys, T. Large-scale Experimental Investigations to Evaluate the Feasibility of Producing Methane-Rich Gas (SNG) through Underground Coal Gasification Process. Effect of Coal Rank and Gasification Pressure. Energies 2020, 13, 1334. [Google Scholar] [CrossRef] [Green Version]
- Kapusta, K. Effect of Lignite Properties on Its Suitability for the Implementation of Underground Coal Gasification (UCG) in Selected Deposits. Energies 2021, 14, 5816. [Google Scholar] [CrossRef]
- Gabzdyl, W.; Probierz, K. The occurrence of anthracites in an area characterized by lower rank coals in the Upper Silesian Coal Basin of Poland. Int. J. Coal Geol. 1987, 7, 209–225. [Google Scholar] [CrossRef]
- Gabzdyl, W.; Probierz, K. Thermal methamorphic products of coals from Jastrzębie Region. In Proceedings of the International Conference on Structure and Properties of Coals, Wroclaw, Poland, 17–19 June 1991; Institute of Chemistry and Technology of Petroleum and Coal, Technical University of Wroclaw: Wroclaw, Poland, 1991; pp. 7–9. [Google Scholar]
- Probierz, K. Effect of thermal metamorphism on coalification degree (rank) and petrographic composition of the coal seams in Jastrzębie region (Upper Silesia Coal Basin of Poland). Zesz. Nauk. Politech. Śląskiej Górnictwo 1989, 176. [Google Scholar]
- Chodyniecka, L.; Sankiewicz, J. Basalt from the Sumina area (Rybnik Coal Basin). Geol. Q. 1978, 22, 119–133. [Google Scholar]
- Matuszewska, A.; Pusz, S.; Duber, S. Evaluation of the structure of bituminous coal from Sośnica mine in the Upper Silesian Coal Basin (Poland) using reflectance indicating surface (RIS) parameters. Int. J. Coal Geol. 2015, 152, 177–188. [Google Scholar]
- Adamczyk, Z.; Komorek, J.; Nowak, J.; Lewandowska, M. The impact of a Neogene basaltoid intrusion on the distribution of rare earth elements and yttrium in Carboniferous rocks from the Sumina area, Poland (SW part of Upper Silesian Coal Basin). Acta Geol. Pol. 2020, 70, 31–49. [Google Scholar] [CrossRef]
- Goodarzi, F.; Murchison, D.G. Optical properties of carbonized vitrinites. Fuel 1972, 51, 322–328. [Google Scholar]
- Jimenez, A.; Iglesias, J.M.; Laggoun-Defarge, F.; Suarez-Ruiz, I. Effect of the increase in temperature on the evolution of the physical and chemical structure of vitrinite. J. Anal. Appl. Pyrol. 1999, 50, 117–148. [Google Scholar]
- Murchison, D.G. Petrographic aspect of coal structure: Reactivity of macerals in laboratory and natural environments. Fuel 1991, 70, 296–315. [Google Scholar]
- Komorek, J.; Morga, R. Charakterystyka własności optycznych witrynitu poddanego obróbce termicznej na przykładzie węgla z pokładu 833/1 kopalni Gliwice. Zesz. Nauk. Pol. Śl. Górnictwo 2001, 249, 59–73. [Google Scholar]
- Komorek, J.; Morga, R. Vitrinite reflectance property change during heating under inert conditions. Int. J. Coal Geol. 2003, 54, 125–136. [Google Scholar] [CrossRef]
- Komorek, J.; Morga, R.; Lewandowski, M. Własności optyczne witrynitu poddanego obróbce termicznej na przykładzie węgla z kopalni Chwałowice z GZW. Przegl. Górn. 2000, 56, 36–40. [Google Scholar]
- Morga, R.; Komorek, J. Wpływ obróbki termicznej na własności optyczne i strukturę wewnętrzną antracytu. Zesz. Nauk. Pol. Śl. Górnictwo 2002, 254, 111–128. [Google Scholar]
- Morga, R.; Komorek, J. Zmienność Cech Optycznych i Struktury Witrynitu Poddanego Oddziaływaniu Temperatur w Zakresie 400–1200 °C. Monograph; Prace Geologiczne PAN: Kraków, Poland, 2004; pp. 1–152. [Google Scholar]
- Komorek, J.; Morga, R. Evolution of optical properties of vitrinite, sporinite and semifusinite in response to heating under inert condition. Int. J. Coal Geol. 2007, 71, 389–404. [Google Scholar] [CrossRef]
- Komorek, J. Zmiany Struktury Wewnętrznej Witrynitu i Liptynitu Poddanych Oddziaływaniu Temperatury w Zakresie 400–1200 °C. Monograph; Wydawnictwo Politechniki Śląskiej: Gliwice, Poland, 2013. [Google Scholar]
- Róg, L. Vitrinite reflectance as a measure of the range of influence of the temperature of a georeactor on rock mass during underground coal gasification. Fuel 2018, 224, 94–100. [Google Scholar] [CrossRef]
- Malumbazo, N.; Wagner, N.J.; Bunt, J.R. The petrographic determination of reactivity differences of two South African inertinite-rich lump coals. J. Anal. Appl. Pyrol. 2012, 93, 139–146. [Google Scholar] [CrossRef]
- Perkins, G. Underground coal gasification—Part I: Field demonstrations and process performance. Prog. Energy Combust. Sci. 2018, 67, 58–187. [Google Scholar] [CrossRef]
- Wiatowski, M.; Kapusta, K.; Świądrowski, J.; Cybulski, K.; Ludwik-Pardała, M.; Grabowski, J.; Stańczyk, K. Technological aspects of underground coal gasification in the Experimental “Barbara” Mine. Fuel 2015, 159, 454–462. [Google Scholar] [CrossRef]
- Khan, M.M.; Mmbaga, J.P.; Shirazi, A.S.; Trivedi, J.; Li, Q.; Gupta, R. Modelling underground coal gasification-A review. Energies 2015, 8, 12603–12668. [Google Scholar] [CrossRef] [Green Version]
- PN-ISO 7404-2:2005; Metody Analizy Petrograficznej Węgla Kamiennego (Bitumicznego) i Antracytu—Część 2: Metoda Przygotowania Próbek Węgla. Available online: https://sklep.pkn.pl/pn-iso-7404-2-2005p.html (accessed on 15 January 2021).
- PN-ISO 7404-5:2002; Metody Analizy Petrograficznej Węgla Kamiennego (Bitumicznego) i Antracytu—Część 5: Metoda Mikroskopowa Oznaczania Refleksyjności Witrynitu. Available online: https://sklep.pkn.pl/pn-iso-7404-5-2002p.html (accessed on 15 January 2021).
- Kilby, W.E. Biaxial Reflecting Coals in the Peace River Coalfield; British Columbia Ministry of Energy, Mines and Petroleum, Geological Fieldwork, Paper 1986-1; British Columbia Geological Survey: Victoria, BC, Canada, 1986; pp. 127–137. [Google Scholar]
- Kilby, W.E. Recognition of vitrinite with non-uniaxial negative reflectance characteristics. Int. J. Coal Geol. 1988, 9, 267–285. [Google Scholar] [CrossRef]
- Kilby, W.E. Vitrinite reflectance measurement—Some technique enhancements and relationships. Int. J. Coal Geol. 1991, 9, 201–218. [Google Scholar] [CrossRef]
- PN-G-04560:1998; Paliwa Stałe—Oznaczanie Zawartości Wilgoci, Części Lotnych Oraz Popiołu Analizatorem Automatycznym. Available online: https://sklep.pkn.pl/pn-g-04560-1998p.html (accessed on 15 January 2021).
- PN-G-04516:1998; Paliwa Stałe—Oznaczanie Zawartości Części Lotnych Metodą Wagową. Available online: https://sklep.pkn.pl/pn-g-04516-1998p.html (accessed on 23 January 2021).
- PN-ISO 1928:2020-05; Paliwa Stałe—Oznaczanie Ciepła Spalania Metodą Spalania w Bombie Kalorymetrycznej i Obliczanie Wartości Opałowej. Available online: https://sklep.pkn.pl/pn-iso-1928-2020-05e.html (accessed on 15 January 2021).
- PN-G-04584:2001; Paliwa Stałe—Oznaczanie Zawartości Siarki Całkowitej i Popiołowej Automatycznymi Analizatorami. Available online: https://sklep.pkn.pl/pn-g-04584-2001p.html (accessed on 23 January 2021).
- PN-ISO 11760:2007; Klasyfikacja Węgla. Available online: https://sklep.pkn.pl/pn-iso-11760-2007p.html (accessed on 15 January 2021).
- Taylor, G.H.; Teichmüller, M.; Davis, A.; Diessel, C.K.F.; Littke, R.; Robert, T. Organic Petrology; Gebr. Borntraeger: Berlin, Germany; Stuttgart, Germany, 1998. [Google Scholar]
- Malumbazo, N.; Wagner, N.J.; Bunt, J.R. The impact of particle size and maceral segregation on char formation in a packed bed combustion unit. Fuel 2013, 111, 350–356. [Google Scholar] [CrossRef]
- Malumbazo, N.; Wagner, N.J.; Bunt, J.R.; Van Niekerk, D.; Assumption, H. Structural analysis of chars generated from South African inertinite coals in a pipe-reactor combustion unit. Fuel Process. Technol. 2011, 92, 743–749. [Google Scholar] [CrossRef]


| Chemical–Technological Properties | ||||||||
|---|---|---|---|---|---|---|---|---|
| Wa | Ad | Vdaf | Qdaf | Std | Cdaf | Hdaf | Ndaf | |
| % | % | % | MJ/kg | % | % | % | % | |
| 2.36 | 2.74 | 32.61 | 31.9 | 0.31 | 81.74 | 4.39 | 1.3 | |
| Optical Properties | ||||||||
| Rr | S | Rmax | smax | Rmin | smin | Rrmax | Rrmin | Rbi |
| % | % | % | % | % | % | % | % | % |
| 0.79 | 0.05 | 0.82 | 0.03 | 0.76 | 0.05 | 0.88 | 0.66 | 0.22 |
| Pressure | Sample | d | Cdaf | Hdaf | Ndaf |
|---|---|---|---|---|---|
| Bar | m | % | |||
| 10-1 | 0.75 | 90.93 | 0.83 | 1.08 | |
| 10 | 10-2 | 1.75 | 92.19 | 0.68 | 1.40 |
| 10-3 | 2.75 | 91.09 | 0.98 | 1.43 | |
| 40-1 | 0.75 | 93.90 | 0.58 | 1.09 | |
| 40 | 40-2 | 1.75 | 92.56 | 1.15 | 1.54 |
| 40-3 | 2.75 | 88.98 | 2.38 | 1.39 | |
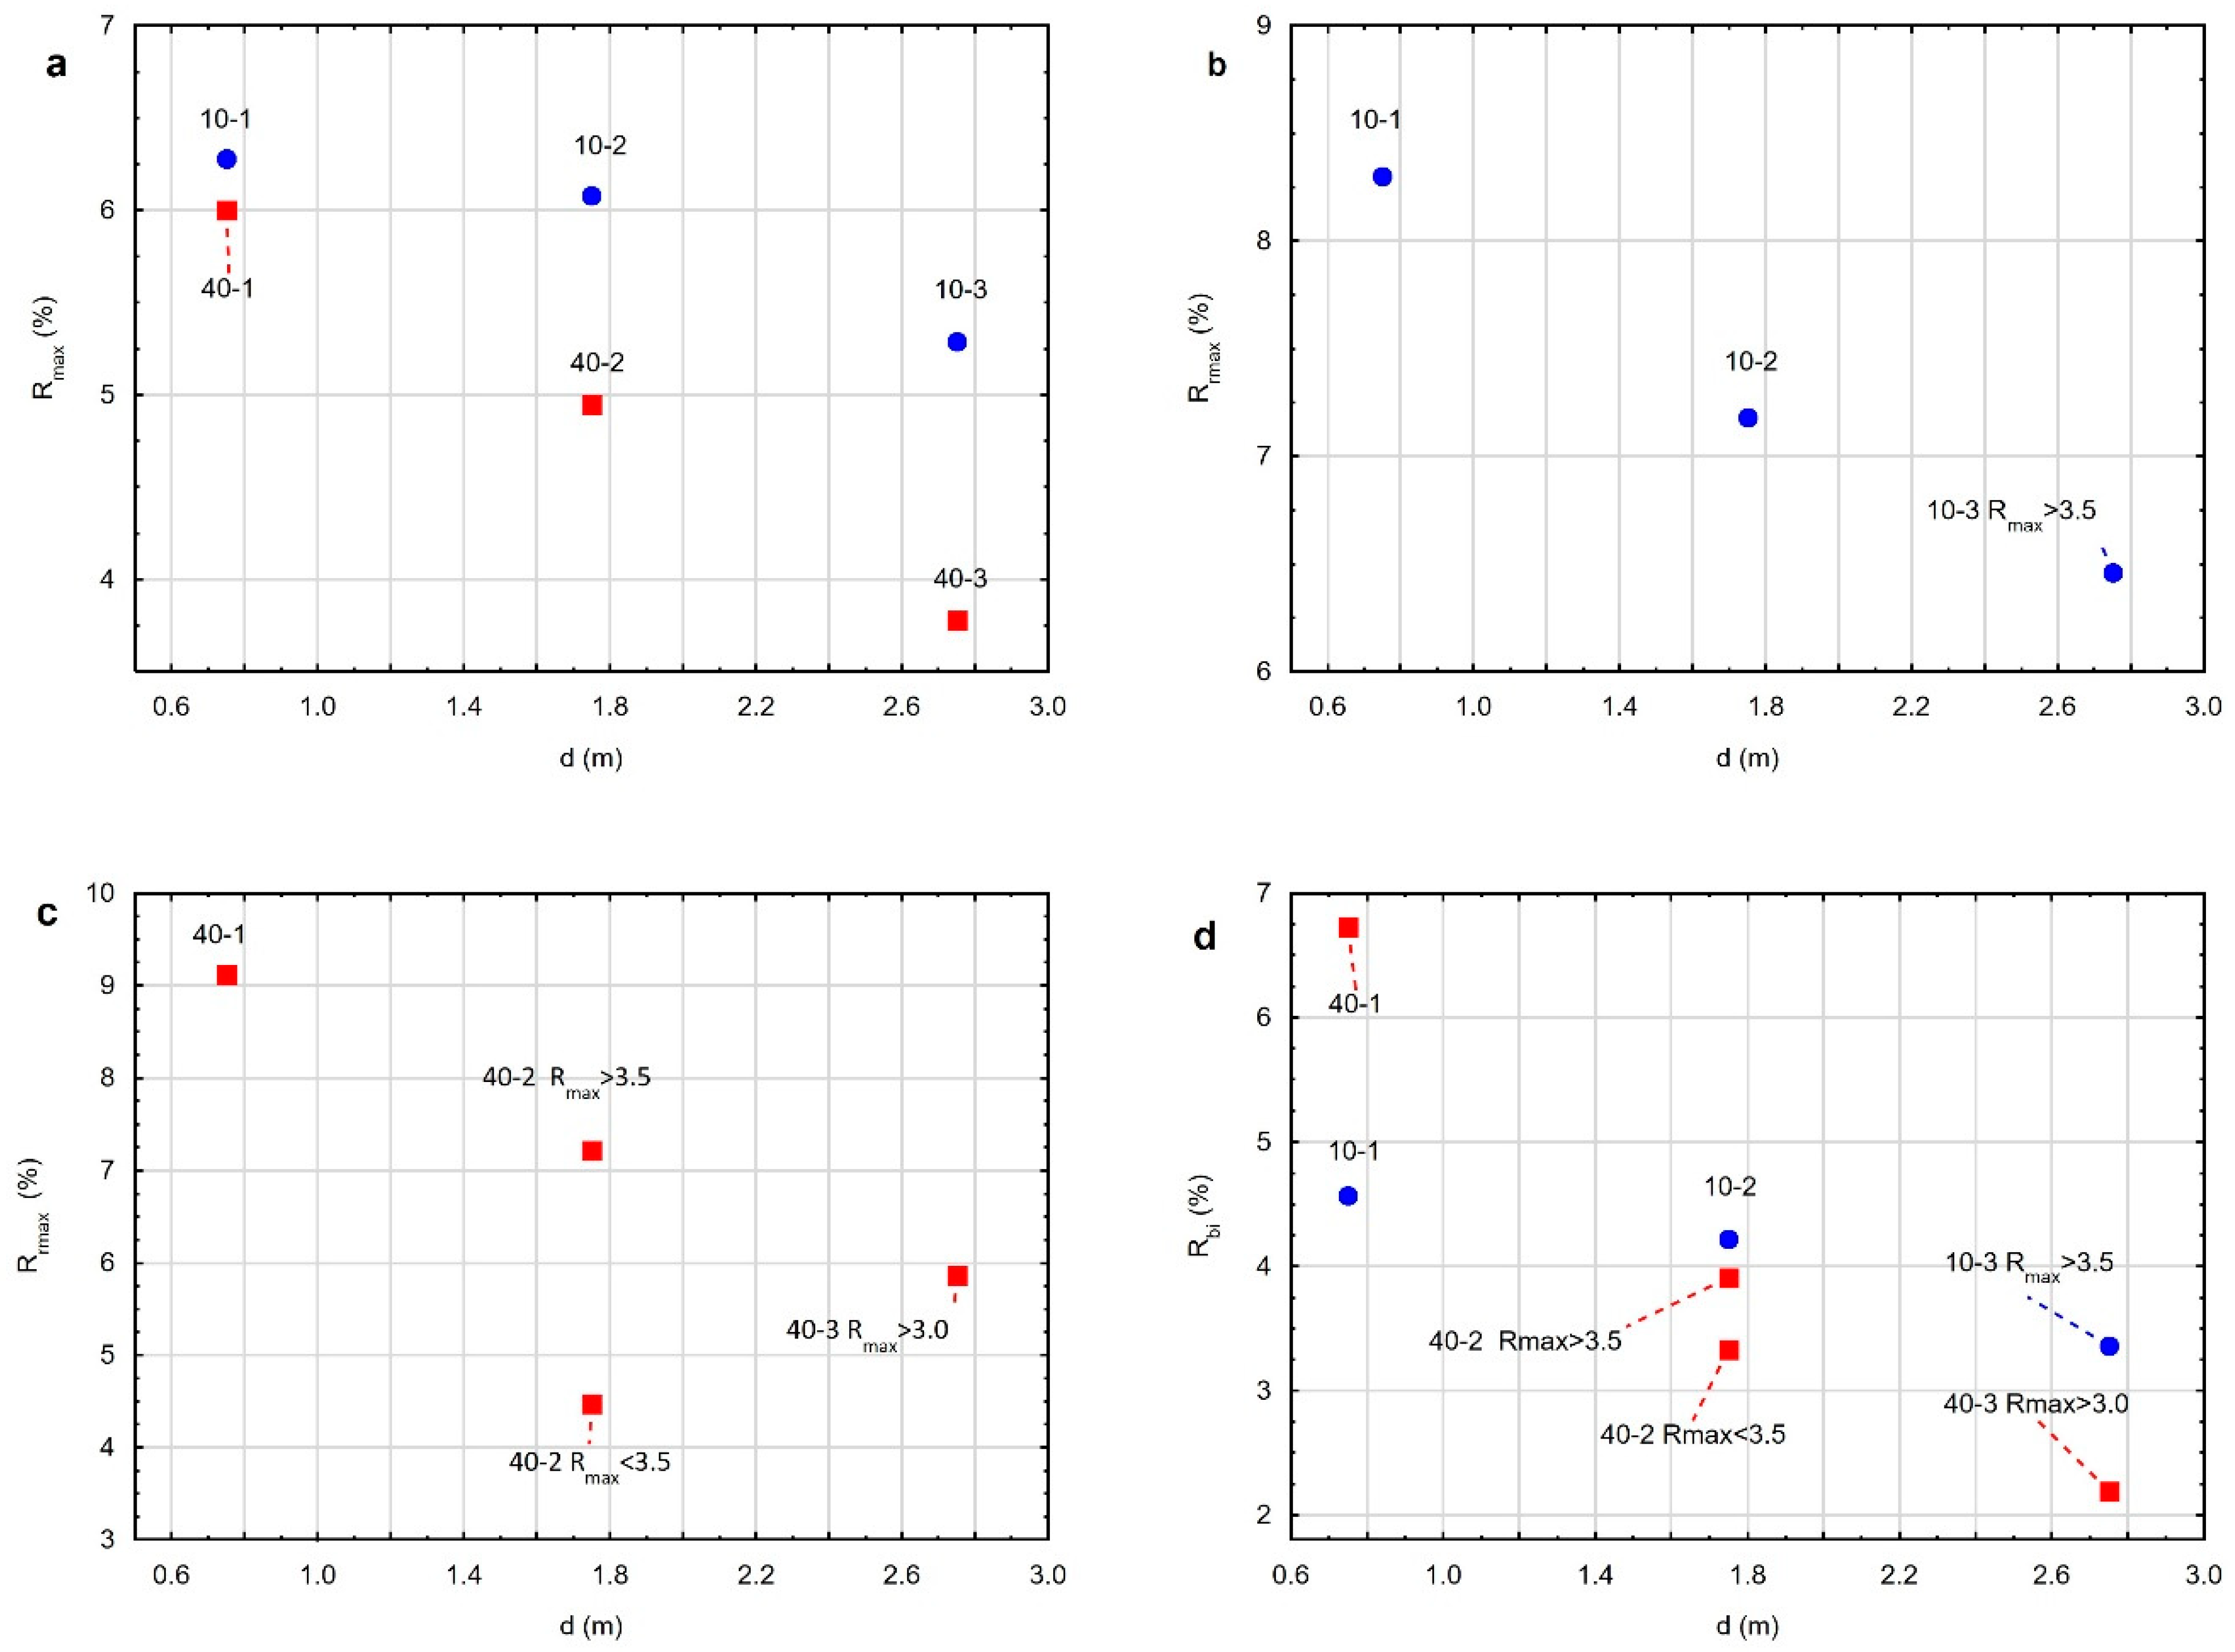
| Pressure | Sample | Rmax | smax | Rmin | smin | Rrmax | Rrmin | Rbi | |
|---|---|---|---|---|---|---|---|---|---|
| bar | % | ||||||||
| 10-1 | AM | 6.28 | 1.01 | 4.87 | 1.07 | 8.30 | 3.73 | 4.57 | |
| 10-2 | AM | 6.08 | 0.55 | 5.40 | 0.59 | 7.18 | 2.84 | 4.22 | |
| 10 | 10-3 | AM | 5.29 | 1.07 | 4.66 | 1.07 | NM | NM | NM |
| Rmax < 3.5 | 2.76 | 0.60 | 2.29 | 0.55 | NM | NM | NM | ||
| Rmax > 3.5 | 5.32 | 0.57 | 4.72 | 0.81 | 6.46 | 3.10 | 3.36 | ||
| 40-1 | AM | 6.00 | 1.56 | 4.95 | 1.28 | 9.12 | 2.39 | 6.73 | |
| 40-2 | AM | 4.95 | 1.51 | 4.31 | 1.57 | NM | NM | NM | |
| Rmax < 3.5 | 2.93 | 0.77 | 2.24 | 0.55 | 4.47 | 1.14 | 3.33 | ||
| 40 | Rmax > 3.5 | 5.82 | 0.70 | 5.21 | 0.85 | 7.22 | 3.31 | 3.91 | |
| 40-3 | AM | 3.78 | 1.84 | 3.45 | 1.7 | NM | NM | NM | |
| Rmax < 3.0 | 1.34 | 0.38 | 1.19 | 0.37 | NM | NM | NM | ||
| Rmax > 3.0 | 5.09 | 0.39 | 4.60 | 0.46 | 5.87 | 3.68 | 2.19 | ||
Publisher’s Note: MDPI stays neutral with regard to jurisdictional claims in published maps and institutional affiliations. |
© 2022 by the authors. Licensee MDPI, Basel, Switzerland. This article is an open access article distributed under the terms and conditions of the Creative Commons Attribution (CC BY) license (https://creativecommons.org/licenses/by/4.0/).
Share and Cite
Nowak, J.; Kokowska-Pawłowska, M.; Komorek, J.; Wiatowski, M.; Kapusta, K.; Adamczyk, Z. Optical Properties of Coal after Ex-Situ Experimental Simulation of Underground Gasification at Pressures of 10 and 40 bar. Energies 2022, 15, 8824. https://doi.org/10.3390/en15238824
Nowak J, Kokowska-Pawłowska M, Komorek J, Wiatowski M, Kapusta K, Adamczyk Z. Optical Properties of Coal after Ex-Situ Experimental Simulation of Underground Gasification at Pressures of 10 and 40 bar. Energies. 2022; 15(23):8824. https://doi.org/10.3390/en15238824
Chicago/Turabian StyleNowak, Jacek, Magdalena Kokowska-Pawłowska, Joanna Komorek, Marian Wiatowski, Krzysztof Kapusta, and Zdzisław Adamczyk. 2022. "Optical Properties of Coal after Ex-Situ Experimental Simulation of Underground Gasification at Pressures of 10 and 40 bar" Energies 15, no. 23: 8824. https://doi.org/10.3390/en15238824