Article

Renewable Energies: Economic and Energy Impact in the Context of Increasing the Share of Electric Cars in EU

by
Andreea-Ileana Zamfir
1,*,
Elena Oana Croitoru
1,
Cristina Burlacioiu
2 and
Cosmin Dobrin
1
1
Faculty of Management, Bucharest University of Economics Studies, 010374 Bucharest, Romania
2
The Institute for Business Administration in Bucharest, ASEBUSS, 012101 Bucharest, Romania
*
Author to whom correspondence should be addressed.
Energies 2022, 15(23), 8882; https://doi.org/10.3390/en15238882
Submission received: 9 October 2022 / Revised: 21 November 2022 / Accepted: 23 November 2022 / Published: 24 November 2022
(This article belongs to the Special Issue Public Policies and Development of Renewable Energy)

Abstract

:
Renewable energies have an essential role in reducing various forms of pollution. The policymakers within the European Union place more and more emphasis on the replacement of internal combustion engine vehicles with electric vehicles in order to reduce emissions. The aim of this research is to analyze the current trends in producing and using renewable energy until 2028 and to estimate the impact of replacing the current internal combustion engine cars with electric cars. The significance of this study emerges from the estimation of the amount of electricity needed to replace current cars with electric cars and if it can be covered from green sources, based on the forecast of green energy until the year 2028. In addition, we also calculate in this study the impact on the public budgets of the European Union member states, as a result of the reduction of excise duties for fuels, following the reduction of their consumption. The research was carried out based on the extensive literature on the subject and data from Eurostat. The data used in this study are from 1990 to 2021. In this research we have used the IBM SPSS application with two of the most used forecasting algorithms: exponential smoothing model and autoregressive integrated moving average (ARIMA), based on the statistical analysis of the historical data. The estimated results showed that the replacement of traditional fuels will lead to an increase of 12.18% for electrical energy, and it could be covered 100% from green sources, if needed, even before 2028. There are many implications of this study for policymakers and the population. The results show that we still need policies to stimulate electricity production from renewable sources. There is a challenge regarding reducing government revenue due to fuel excises, which can be compensated by updating tax policies, with an impact on population and living standards. Furthermore, maintaining and adapting support schemes for electric cars, as well as expanding electric car infrastructure and smart grids are also challenges that need to be addressed by the policymakers and the industry.

1. Introduction

There is a large debate nowadays within the European Union regarding electricity produced from renewable energy sources [1,2]. The European Union is among the world’s leading climate leaders, given the goal of achieving climate neutrality by 2050 [3]. The policymakers within the European Union place more and more emphasis on the replacement of internal combustion engine vehicles with electric vehicles, in order to reduce emissions. The achievement of this goal is questionable due to the current economic, political, and security context. We will explain this context in the paragraphs below.
After the start of the war in Ukraine on 24 February 2022, the expectation of economic development has fallen sharply from previous estimates, and inflationary pressures have intensified [4]. The European Union and the entire world now have to face a mixture of crises: the natural disasters crisis, the economic crisis, and the energy crisis. The degree of uncertainty about macroeconomic developments has significantly increased, due to the ongoing war in Ukraine and the possible multiple implications of the energy crisis. Moreover, the security of the electricity supply is threatened by a wide range of factors—technical, economic, and political—in the context of climate impacts, energy transition, digital economy, COVID-19 pandemic, and conflict impacts on society, productivity, and economic growth [5,6,7].
The European Union is among the most vulnerable regions in the world in terms of energy security because of the high energy import dependency and insufficiency of energy reserves that lead to an important gap between energy production and consumption [8]. Energy and electrical utilities are among the critical infrastructures that are essential to the proper functioning of any economy. Thus, the protection of critical infrastructure has to be further developed even in the most developed countries in terms of cyber security (i.e., France, Estonia, and Lithuania) [9]. Therefore, the energy security crisis in Europe and the global climate crisis are currently the main concerns of t policymakers [6]. Nevertheless, the measures to ensure energy security must not lose sight of the objective of energy transition [4]. Today, energy security becomes the leading incentive for governments to initiate programs to increase the use of electric vehicles [10]. Electrification and biofuel development are complementary approaches that would represent the best way to reach the objectives of the European Green Deal [11]. The huge development and technological advances of hybrid cars and electric vehicles will increase the need for electricity in the near future. A new energy economy is coming into view, and it will be more electrified, efficient, interconnected, and clean [3].
The circular economy is an open issue nowadays, intensely debated, which aims at eliminating waste, and pollution, and reducing the use of resources of all types [12]. The transition from a linear to a circular economy entails various processes of circular innovations, in order to overcome the limitations of the traditional linear economic paradigm [13]. This transition involves new ways of thinking, new models of production and consumption, with minimization of raw materials and waste, an extension of the life cycle of products (through repair, reuse, and recycling), and efficient use of resources. An important part of the transition towards the circular economy is the energy sector, and the shift from fuel consumption to clean energy will improve the circular loop of the transport sector [12]. Onshore wind and photovoltaic renewable energy will be the main sources contributing to the reduction of carbon emissions in the European Union, provided that they will replace most gas and coal-fired power plants [3]. In this context, accelerating the transition to clean energy is one of the biggest opportunities to cope with the energy crisis. Increasing the production of electricity from renewable sources will have multiple positive effects, such as reducing both the use of fossil fuels and prices in the energy market. Furthermore, one key solution to integrate energy efficiency and renewable energy in cities is the development of modern district energy systems [14]. To achieve these goals, national governments and the European Union should focus on financing renewable energy, energy efficiency, and new technologies [15].
Electric vehicles can provide climate benefits, thus having in mind the new climate objectives of the European Union, car producers must develop more innovations for their engines [11]. Electric vehicles together with renewable energy sources for producing the electricity needed by these offer the potential to reduce the environmental impacts, both in terms of emissions and fossil fuel depletion [16]. Furthermore, in 2050 scenarios, the environmental impact of electric vehicles is decreasing in most European Union countries, because of the reduction of fossil fuel share for electricity generation [17]. According to a long-term forecast based on the electric vehicle inventory in 26 countries across five continents, that used a logistic growth model, 30% of the worldwide passenger vehicle fleet will be electric vehicles in 2032 [18].
Moreover, many authors have used life cycle assessment in order to assess the energy and environmental impact of different types of vehicles. For example, ref. [19] analyzed the environmental impact of diesel and petrol vehicles, plug-in hybrid vehicles, and electric vehicles in Hong Kong. The results showed that electric vehicles are the optimal choice with the 2050 electricity mix, in which 85% is from renewable energy sources, followed by plug-in hybrid vehicles, in terms of the lower environmental impact [19]. Another study assessed the emissions impact of internal combustion engine vehicles and electric vehicles by taking into account the entire life cycle of vehicles, and the results revealed that electric vehicles emit more PM2.5 and SO2, but less CO2, VOCs, and NOx than internal combustion engine vehicles [20]. The greenhouse gas emission reduction potential of electric vehicles can be improved by adjusting the electricity mix, advancing electricity production technologies, and increasing the combined heat and power scale [21]. Another comparative environmental impact assessment of electric vehicles carried out in the top 10 countries for electric vehicle sales showed that the environmental impact of electric vehicles may be reduced by integrating renewable energy sources into electricity production [22].
In order to achieve the goal of increasing the use of electric vehicles, governments must invest in large-scale renewable energy sources [18]. Some incentives could be further used by policymakers in order to support widespread vehicle electrification [23]. In addition, it will be particularly important to design support policies for the development of electric vehicles purchase, as well as infrastructure investments to facilitate equity in access to the electric vehicle charge points.
The objective of this study is to analyze the economic and energy impact of renewable electricity in the context of increasing the share of electric cars within the European Union. This research estimates the amount of electricity needed to replace internal combustion engine vehicles with electric vehicles, and also estimates the growth of green energy in the forecasted period of seven years, in order to analyze if the energy needed for the migration to electric vehicles can be covered by the increase of electricity generated from green sources. Furthermore, the paper investigates the impact of the replacement of internal combustion engine vehicles with electric vehicles on national government budgets, taking into account the reduction of fuel excises.
Therefore, the research was conducted on two levels:
  • Energy level, with three research directions (questions):
    • Analyzing the current trends in producing and using renewable electricity within the EU
    • Estimating the amount of electricity needed to replace current internal combustion engine vehicles with electric vehicles
    • Evaluating the potential of renewable electricity to replace the current oil-based fuels;
  • Economic level, with one research direction (question):
    • Estimating the impact of replacing the current internal combustion engine cars with electric cars on the public budgets of the European Union member states.
The significance of this study emerges from the estimation of the amount of electricity needed to replace current cars with electric cars and if it can be covered from green sources, based on the forecast of green energy until the year 2028. In addition, we also calculate in this study the impact on the public budgets of the European Union member states, as a result of the reduction of excise duties for fuels, following the reduction of their consumption.
A mix of two of the most used forecasting algorithms: the exponential smoothing model and the autoregressive integrated moving average (ARIMA) model was applied in order to carry out the first part of the research. In the second part of this study, we have used available data in order to estimate the impact of replacing the current internal combustion engine cars with electric cars.
Our study is different from other studies in the literature because it uses a different technique to estimate the amount of electrical energy required by the transition to electric cars, based on the existing fuel consumption in EU countries, and it tries to put together the electric and the economic challenges.
This paper makes several important contributions to our knowledge in this area: to have a better understanding of the trend of renewable energies, what could be reached in the next years, whether the transition to electric cars could be easy or tough and whether it could be a real benefit for our climate (in case we could use green energy for them). Otherwise, in case we have to supply them with electrical energy produced from fossil fuel there is almost no gain. Besides this, the research tries to give a view of what this shift to electric cars means for countries’ budgets, in order to be prepared to adjust the fiscal policies and legislation.

2. Literature Review

Electricity is the fastest growing source of final energy demand [24], and its share of the world’s final consumption of energy reached 20% in 2021 and is planned to increase by 2040 (Figure 1) [3,25].
The electricity system, along with the electrification of the transport sector, could make a major contribution to the achievement of the objective to decarbonize national energy systems [11,26]. The transition to renewable electricity can lead to higher productivity, and thus, it can positively affect economic growth, especially in highly developed countries, considering GDP/capita. Less developed countries may have possible adverse effects on economic growth when investing in renewable electricity [7]. The imperative role of developing electricity is defined by its socio-economic impacts, and today people’s lives and well-being depend on the use of electricity [27].
Renewable electricity has an important contribution to decarbonizing the energy sector. However, electrical power plants based on renewable energy sources have environmental impacts which can be minimized by careful selection of renewable energy sources for electricity production and the method of their utilization [28].
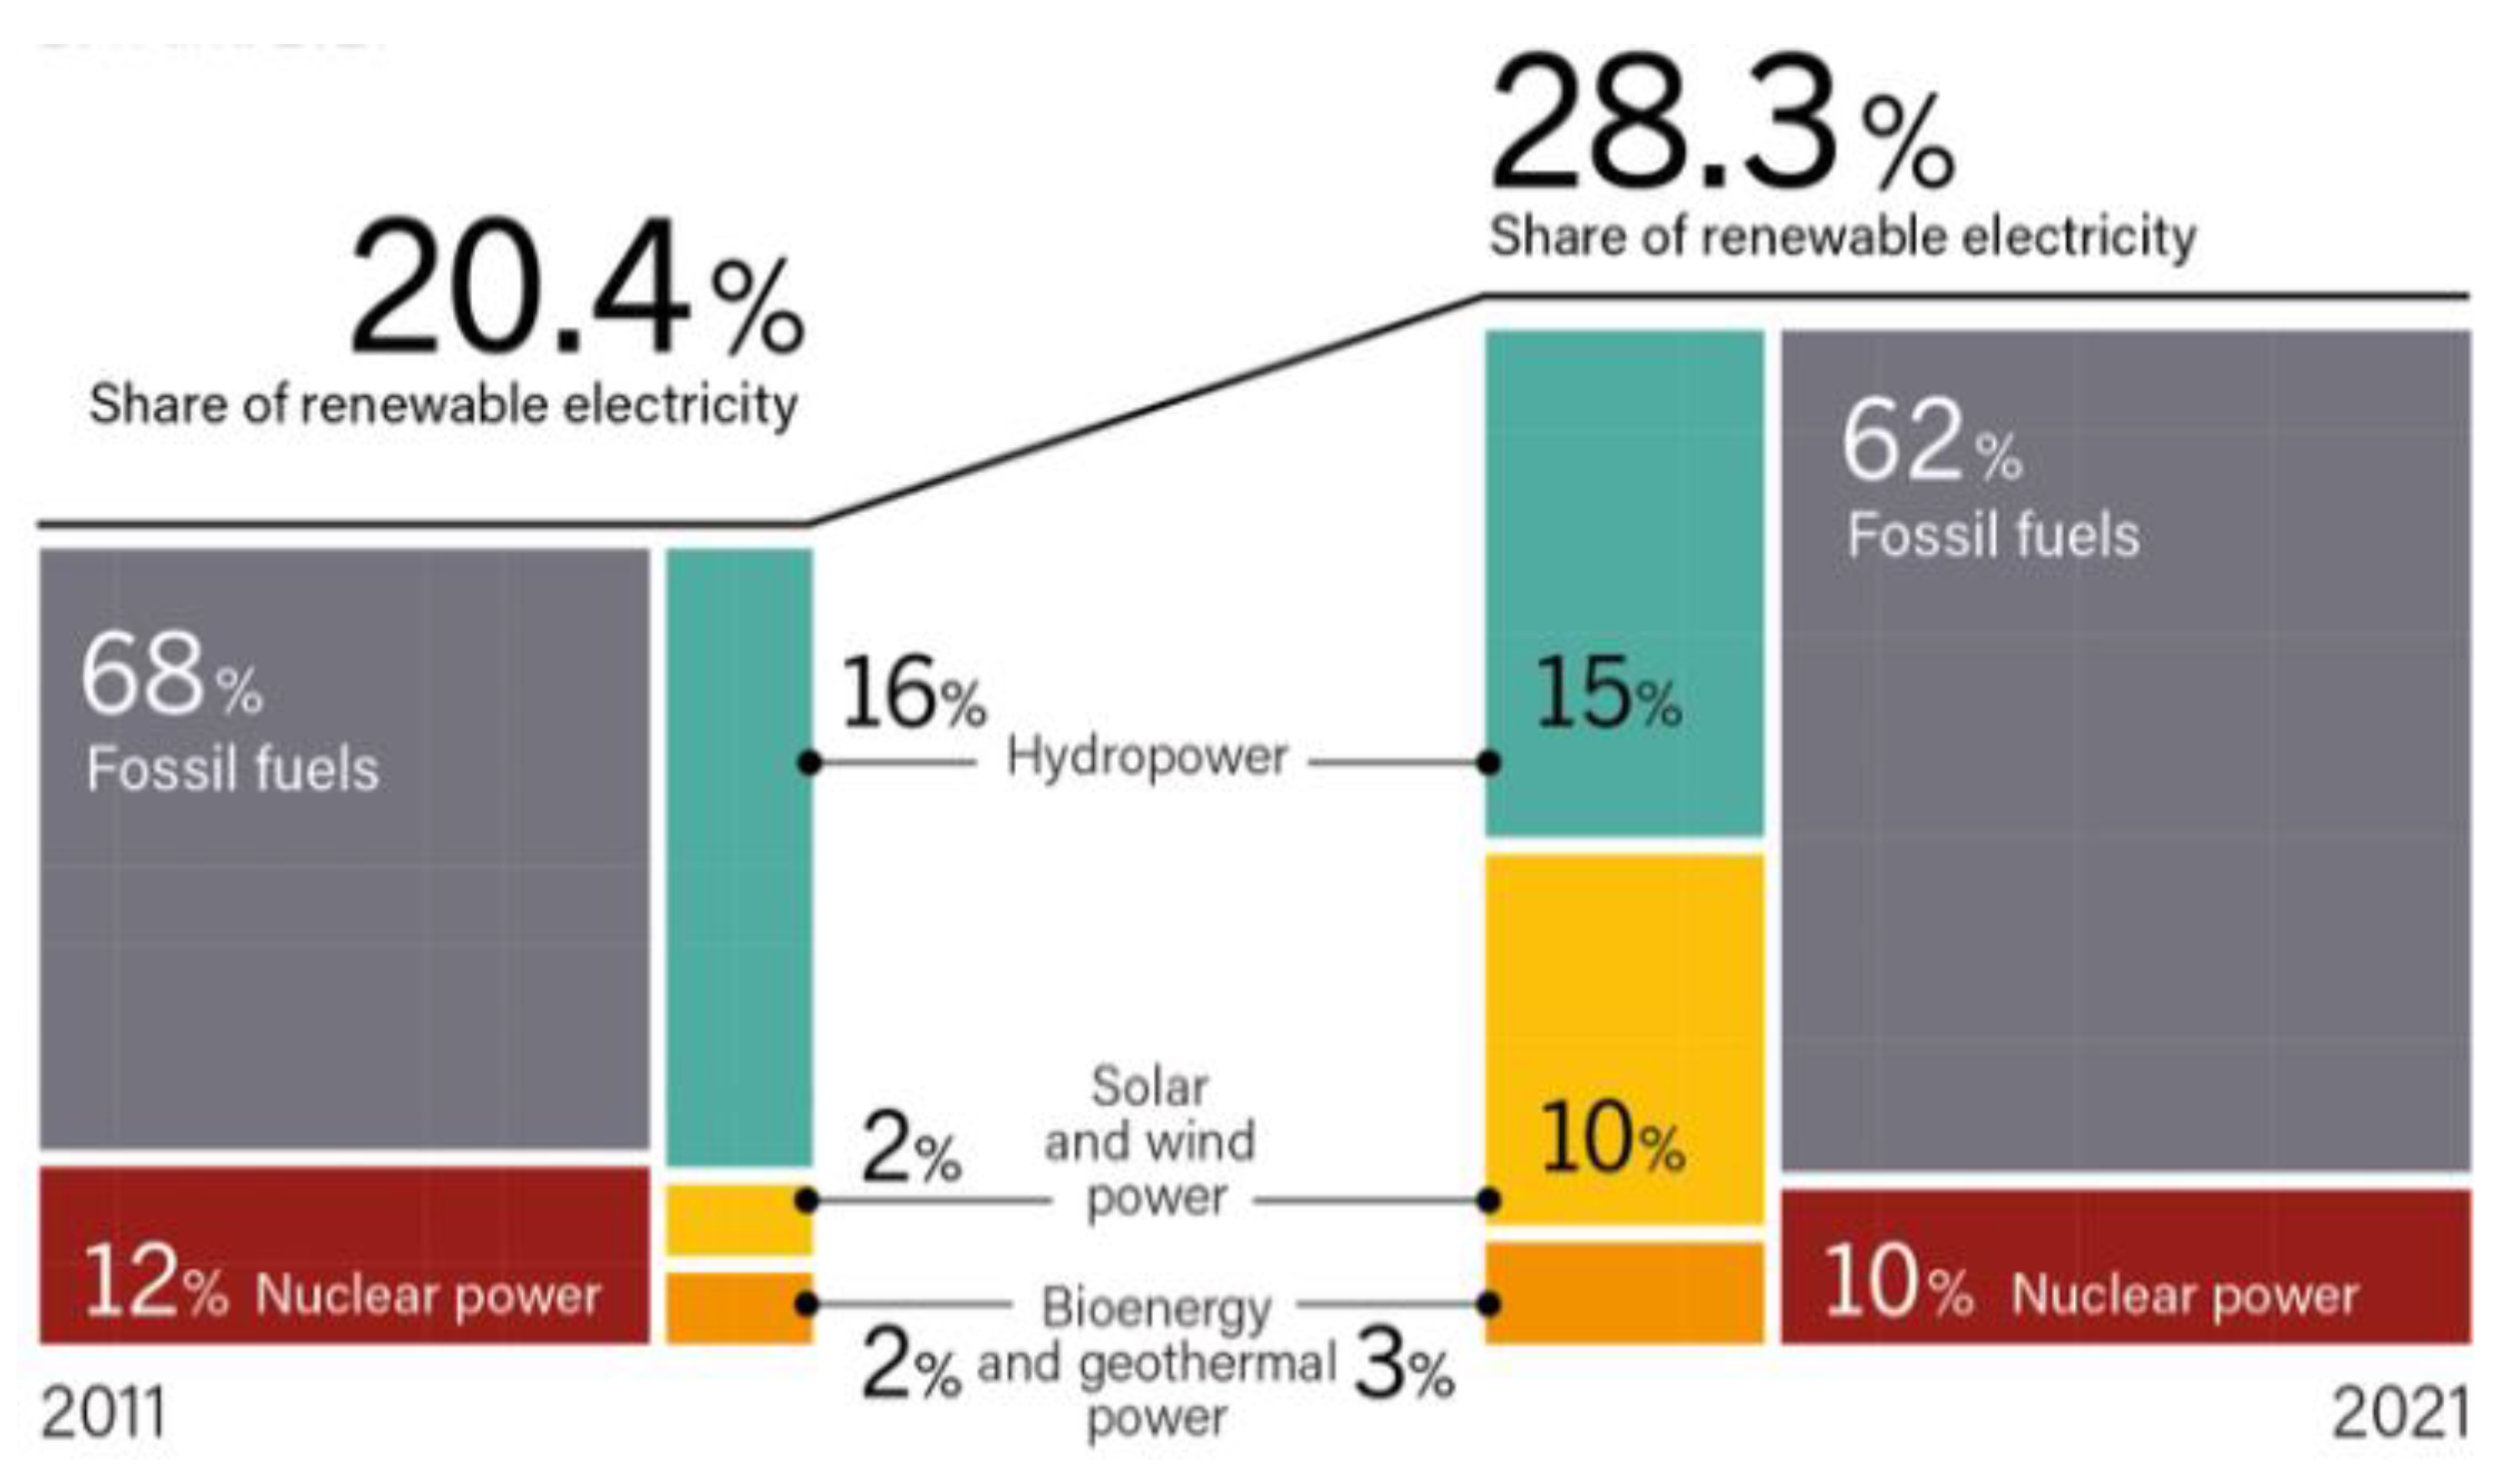
Renewable energy sources generated 28.3% of global electricity in 2021, up from 20.4% in 2011 (as seen in Figure 2) and similar to the 2020 level of 28.5% [29]. The total installed renewable power capacity grew by 11% in 2021, even though this is far from the development needed for the world to reach net zero emissions by 2050 [29].
The economic and energy contexts within the European Union were marked by the steep rise in prices for energy products, with negative effects on companies and the population, in terms of reliability and affordability of electricity starting in the second half of 2021. Some recent studies have focused on topics of equity in domestic electricity tariffs, but the economic costs of using renewable electricity in residential areas still remain unintelligible for many people [30]. The increase in energy prices was mainly due to the resumption of demand for these products following the easing of restrictions related to the COVID-19 pandemic, some blockages in their production, and a significant increase in the price of carbon [4].
In this context, policymakers appealed to individuals and companies to reduce electricity consumption. This pro-environmental behavior of individuals and companies includes some practical ways to reduce electricity consumption, such as: turning off lights and air conditioning when leaving home or the office and replacing old technologies with high electricity consumption with new technologies with low electricity consumption [31]. This energy-saving behavior has been recommended more and more in European Union countries in the context of the current crises. The senior management of companies has an important role to play in this endeavor [32]. However, buying energy-efficient products and enhancing efficient energy use is not enough to reduce energy consumption over long periods of time [32].
Renewable energies play an essential role in reducing greenhouse gas emissions and other forms of pollution and, Europe as a world leader, must adopt this alternative source of energy. In order to stimulate the growth of renewable energies in gross final energy consumption, the European Union supported the adoption and application of certain national targets, which were politically accepted [33,34,35,36].
We note that globally, humanity is consuming more energy than it can produce. Moreover, if we are making an indicative calculation, we find that in the past 40 years, fuel consumption has doubled, which would lead to resource depletion in the next 30–50 years [37]. Therefore, the use of renewable energy and the use of innovative technologies to protect and preserve the environment are policies that may lead to sustainable development, ensuring the welfare and superior living standards for future generations. Moreover, generating electricity from local renewable energy sources could empower underprivileged communities, because they would have access to electricity and energy independence at the same time [38].
People’s well-being depends on the transition to modern energy services (electricity, lighting, heating, water provision, sanitation, healthcare, cooking, transport, internet and communication services, etc.), and these could be provided using local renewable energy sources. The main arguments that support this statement are related to the variety and large distribution of renewable sources, price reductions for the technologies that convert them into electricity, reduced payback periods, as well as their environmentally-friendly character [37,39,40,41]. Nevertheless, there are some counterarguments, such as the dispersion and intermittency of renewable sources (however, these can be anticipated, managed, and even lessened), the implementation of public policies, ethical behavior of the managers and policymakers, legislative changes, infrastructure, etc. [37,42,43,44,45,46,47,48,49].
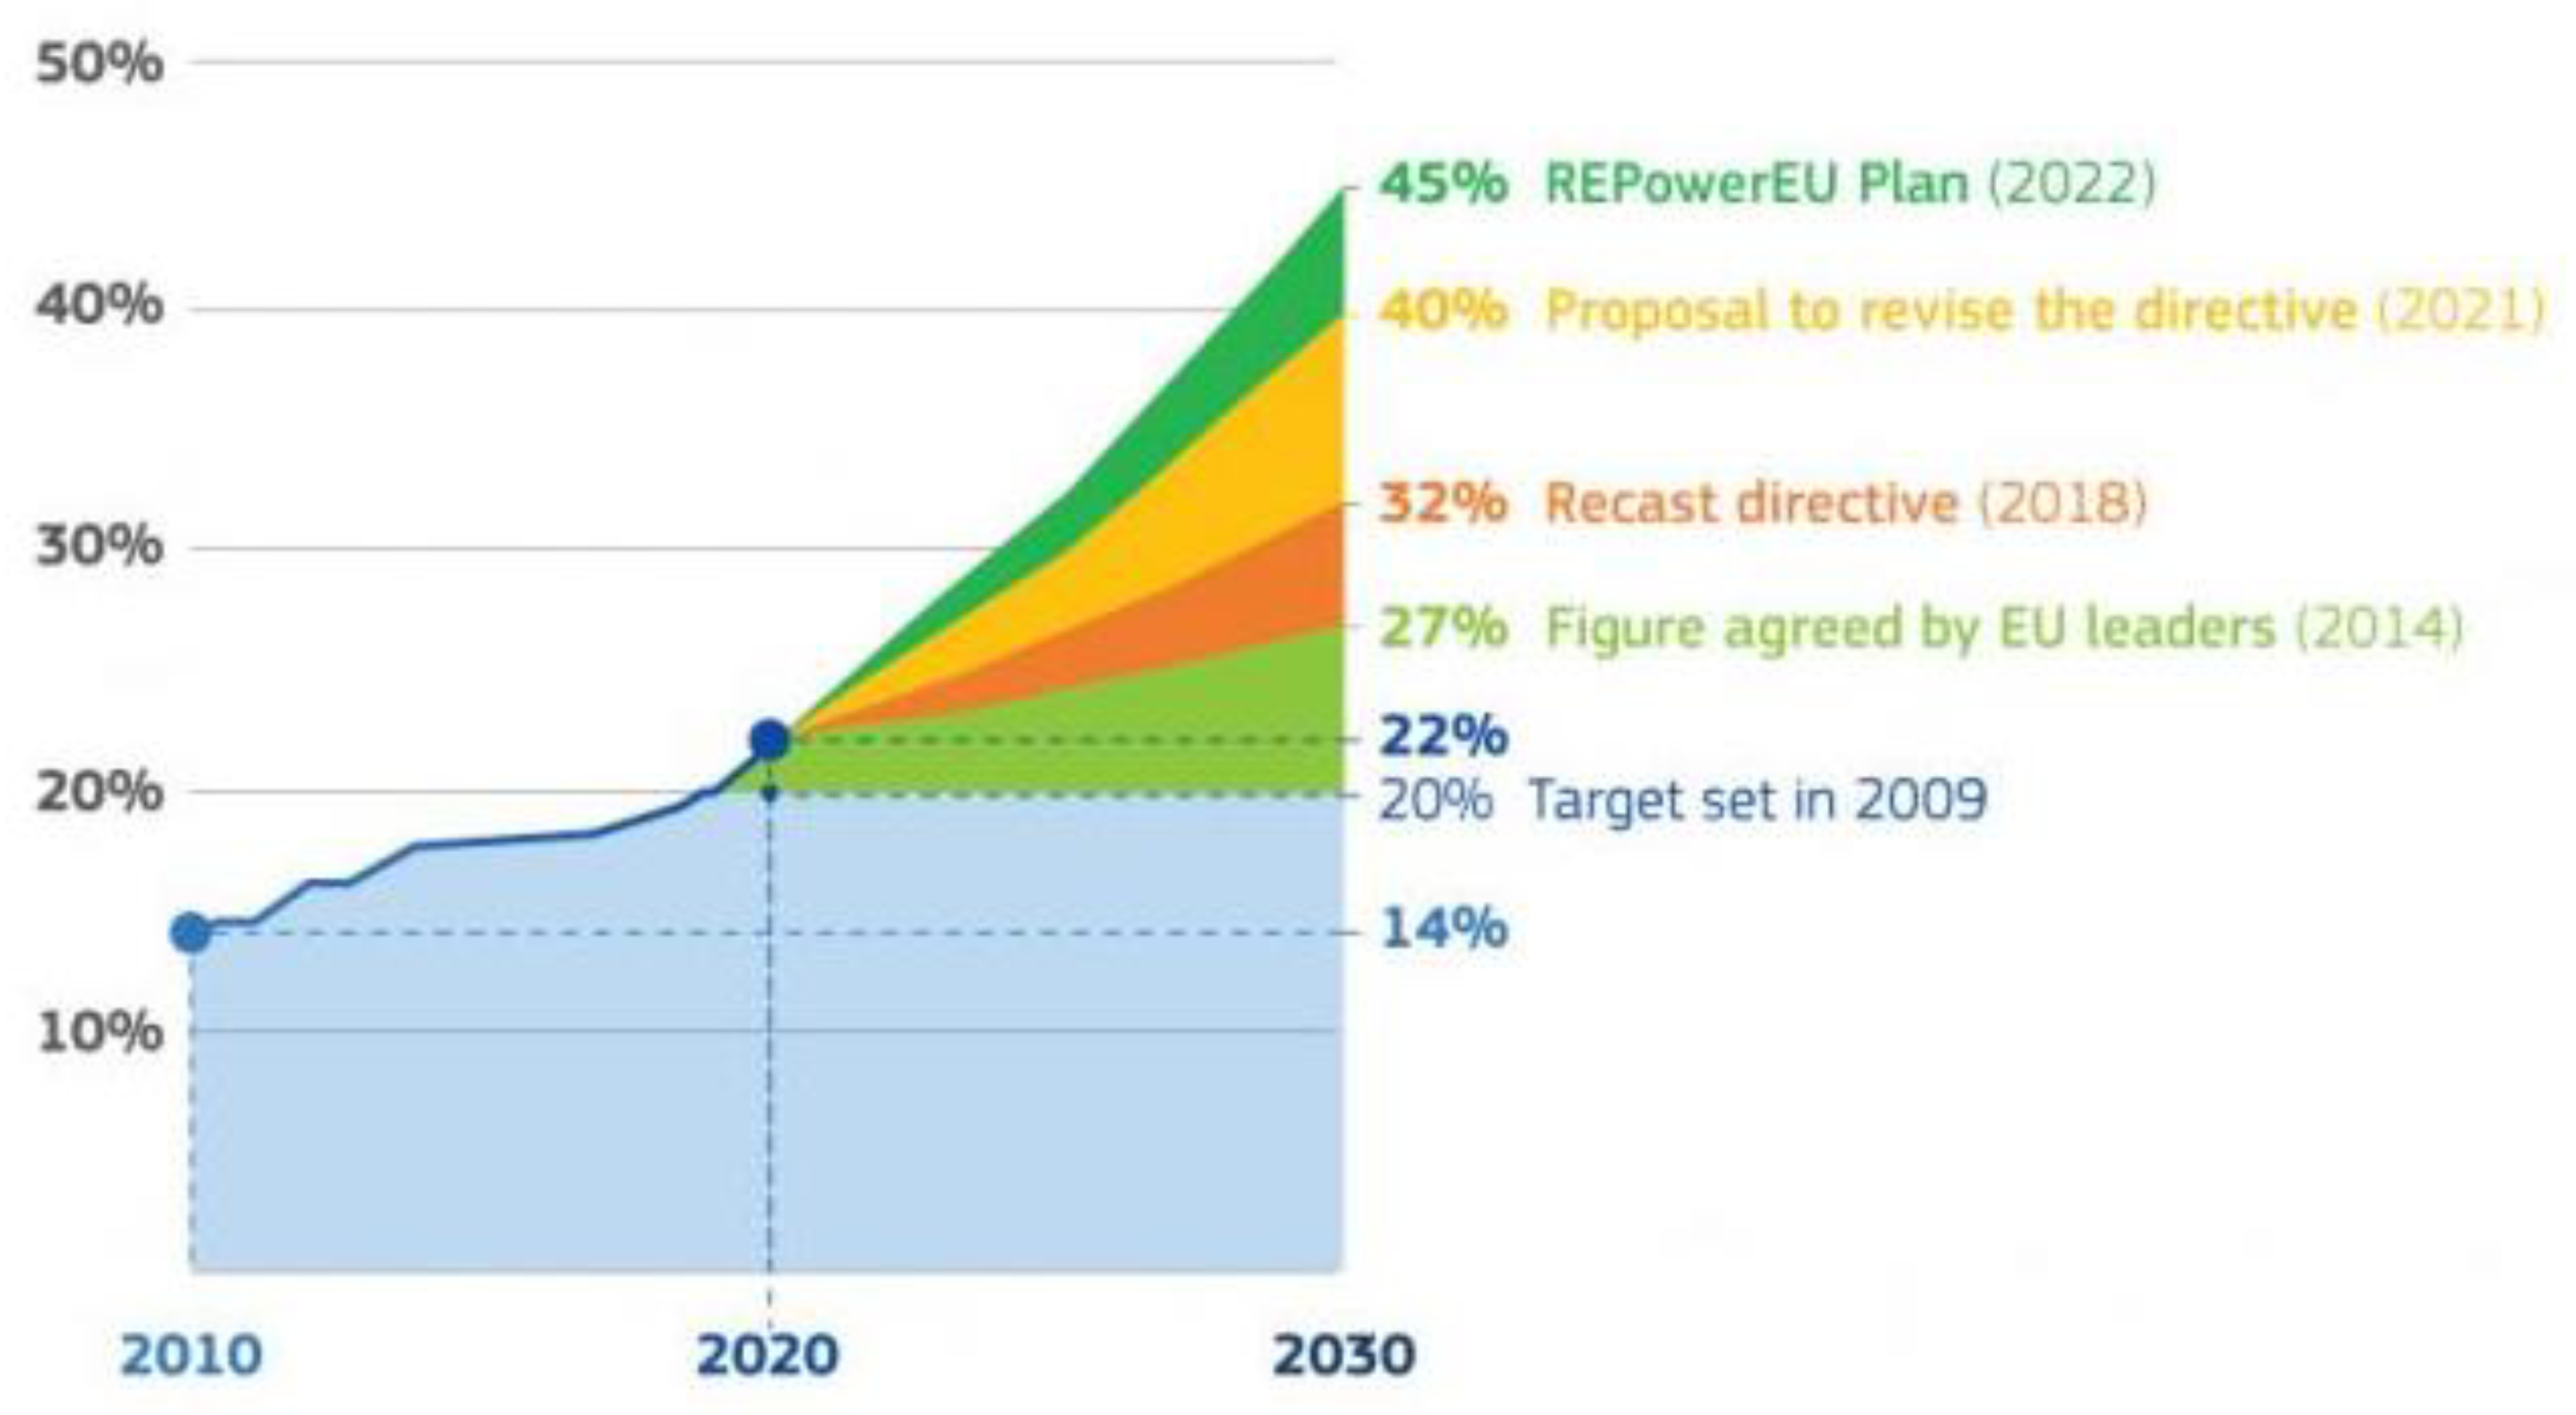
The European Union has set ambitious energy and climate objectives, the cutting of greenhouse gas emissions by at least 55% by 2030 as compared to 1990, and becoming a climate-neutral continent by 2050 [50]. Furthermore, in order to accelerate the deployment of renewable energy in the context of economic and energy crises, the European Commission has modified the targets in the last three years (Figure 3).
Electric vehicles are a promising contribution to reaching the European Union objectives [51], but they will lead to an increase in consumption which may affect the national grid stability. According to a long-term forecast based on the electric vehicle inventory in 26 countries across five continents, using a logistic growth model, 30% of the worldwide passenger vehicle fleet will be electric vehicles in 2032 [18]. Moreover, the world has faced recent episodes of extreme weather conditions (such as floods, droughts, extreme storms, and wildfires) that may become more frequent in the future, and this may disturb the balance between the production and the consumption of electricity from renewable sources [52]. Therefore, the interdependencies and synergies between the electricity system and other sectors and the connections between national and international electricity systems became urgent issues to be addressed by policymakers [26].
Conventional gasoline or diesel engines struggle with low-carbon technologies. One solution that could compete with current engine solutions is the full-hybrid architecture. Plug-in hybrid electric vehicles driven in electric mode are found to be the ideal solution, due to the limited size of their batteries, which is well-suited for the day-to-day use of these vehicles. Battery electric vehicles are effective solutions for reducing greenhouse gas emissions. However, there is a current trend of increasing the battery size in order to improve the range of electric vehicles, but this is unfavorable to greenhouse gas impacts. Significant greenhouse gas emission benefits could also be reached by using biofuels, taking into account that vehicle engines can already accommodate up to 85% ethanol or 100% biodiesel without engine changes [11].
There may be huge differences between countries regarding the development of electric vehicles, and these can be the result of the differences regarding support policies [18].
There are many methods, tools, and models used in the literature to forecast electric vehicle market development. For instance, in order to forecast the development trend of vehicle types, currently, different methods can be used: total cost of ownership, time series, agent-based model (ABM), bass diffusion model (BASS), and scenario analysis [53]. Some authors have used the S-Curve Adoption Tool for Electric Vehicles (SCATE) to forecast the future proportion of electric vehicles within the Counties of England [54]. They emphasized that the S-Curve data can be further used to estimate future electric vehicle energy consumption in a county, to analyze regional future demand for electric charge points, and to plan the development of the infrastructure [54]. As well, the Lotka-Volterra model can be used to estimate the size of the passenger car market in the next 30 years and the proportion of passenger cars divided by power source [53]. Moreover, a “Well-to-Wheel” tool can be used to compare emissions generated by two fleets: one that is based on internal combustion engine vehicles and one that is based on different electric vehicle penetration levels. Using this methodology, an iterative process is developed on the contribution of renewable energy sources to the electricity generation system until a certain level of emissions reduction is achieved [55].
Considering the targets of the European Union and the issues described above, we will further analyze the economic and energy impact of renewable electricity in the context of increasing the share of electric cars within the European Union.

3. Materials and Methods

The renewable electricity produced in EU27 between 1990–2021 is represented by four main types (Table 1):
(1)
Hydro
(2)
Wind
(3)
Solar
(4)
Other renewables including bioenergy
This study wants to respond to several questions:
-
What is the trend of renewable energies in the EU and what can be achieved by 2028?
-
How much electrical energy is needed to replace current cars with electric cars?
-
Could this energy be obtained from green sources?
-
What would be the impact of this change on EU countries’ income from petrol and diesel excises?
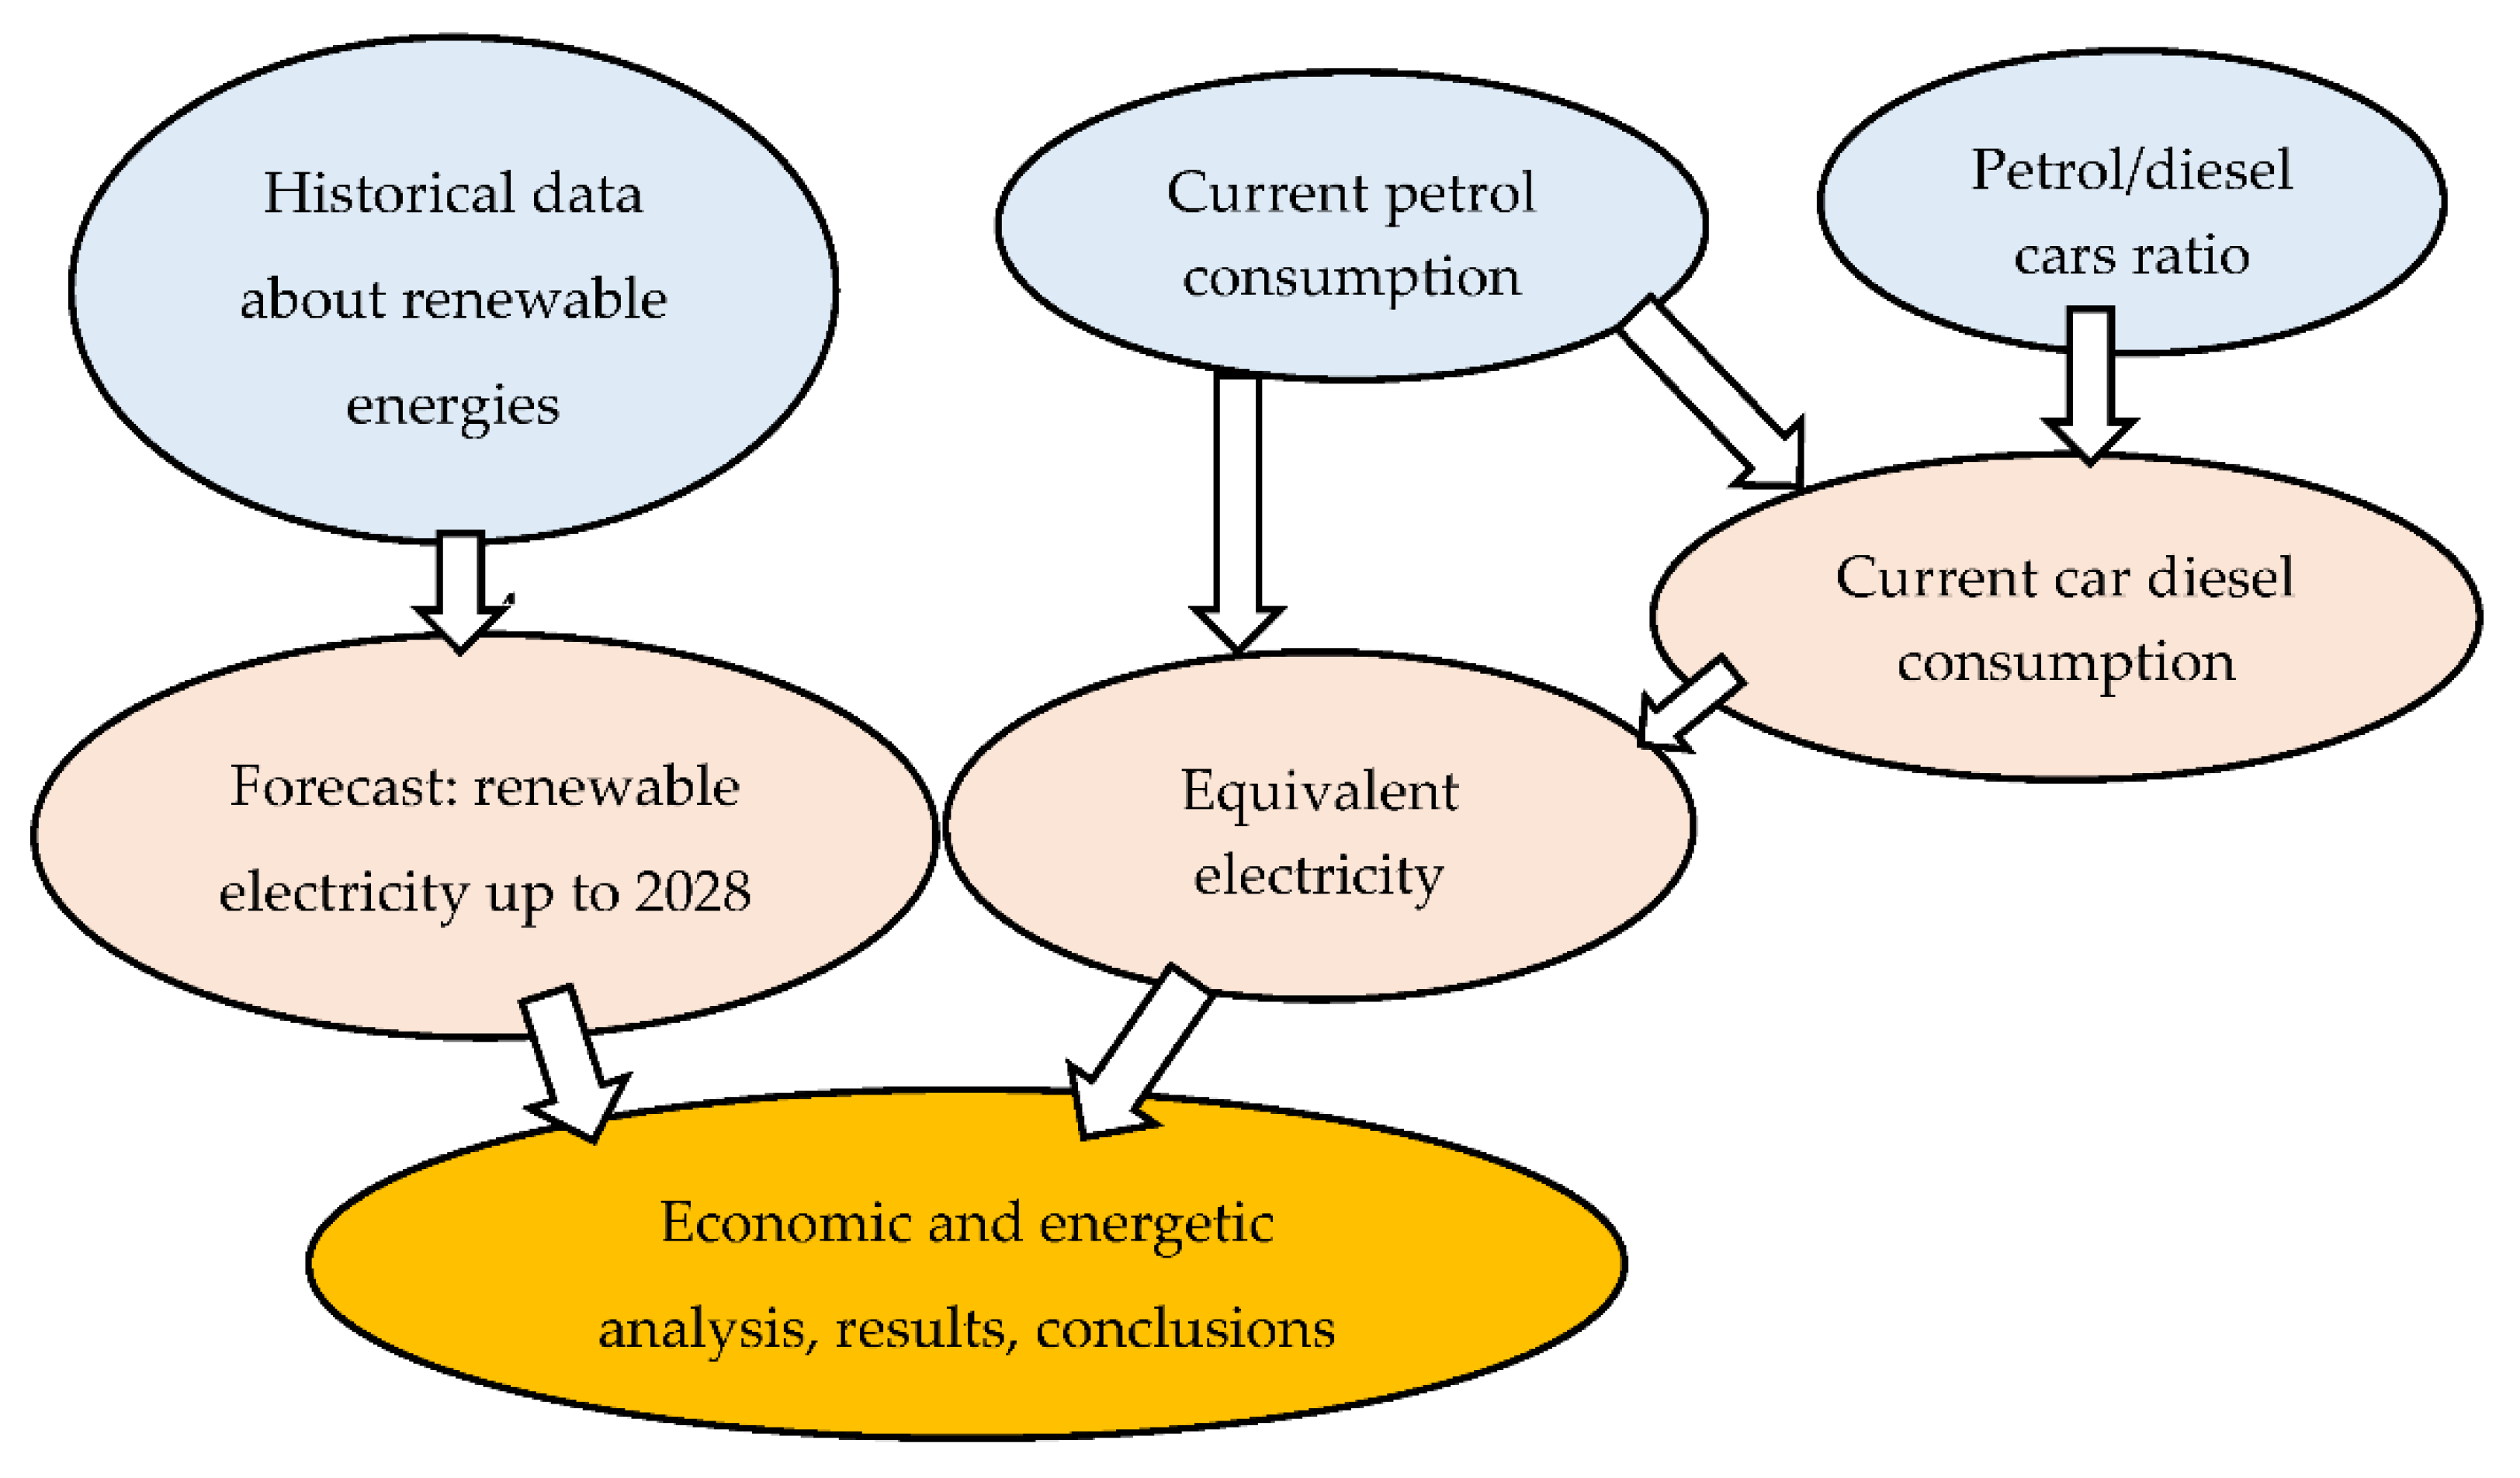
The first step of the analysis was to carry out a statistical characterization of the time series from Table 1. Based on these results, the forecast algorithms to be further used were selected. This is the left part of the graphical research scheme, presented in Figure 4.
The result of this step is an estimation of how much renewable electricity can be produced yearly in the EU until 2028.
The second step, represented by the right part of Figure 4, will determine how much electricity is required to replace existing cars with electric cars. For this, the starting point is the current petrol consumption in EU countries, because most of it is used by petrol cars. Taking into consideration the EUROSTAT petrol/diesel cars ratio, we will determine the total fuel consumption of diesel cars and from there, the total equivalent electricity required to replace cars that use fossil fuels.
The third step (bottom part of Figure 4) will analyze the previous results from 2 different perspectives: energy and economics.
In the next section, we have analyzed and tried to estimate the trend and nominal values of these four categories of renewable energies, for the next period, until 2028. In order to conduct this part of the research, we have applied two of the most used forecasting algorithms with their variations:
  • Exponential smoothing model (Simple, Holt’s linear trend, Brown’s linear trend, Damped trend).
  • Autoregressive integrated moving average (ARIMA) model.
While exponential smoothing models are based on a description of the trend and seasonality in the data, ARIMA models aim to describe the autocorrelations in the data.
The model was chosen based on the statistical analysis of the historical data.
Exponential smoothing [58,59] is a smoothing technique used for time series. Generally, it is applied to determine future values based on historical values.
A simple form of exponential smoothing is represented by formula [60]:
s t = α x t + ( 1 α ) s t 1 = s t 1 + α ( x t s t 1 )
where
-
α is a smoothing factor and 0 α 1
-
s t is a weighted average of the current observation x t and the previous statistics s t 1
In case there are at least two existing values, exponential smoothing can produce a smoothed statistic.
The second used algorithm is ARIMA with 2 flavors of it: (0, 1, 0), named “random walk” and (0, 0, 0), named “white noise”. ARIMA models can be applied for non-stationarity data. ARIMA(0, 1, 0) formula is [60]:
Y τ = μ + Y t 1
where Y is the series and the autoregressive coefficient is 1.
In this research, 6 algorithms from the previous 2 categories were tested. The selected forecast algorithms had the best fit for the analyzed data, based on R-squared. For each series, from Table 1, we chose the technique with the highest R-squared. IBM SPSS application was used to implement the selected algorithms on the existing time series.

4. Results

4.1. Analysis of the Current Trends in Producing and Using Renewable Electricity

After the statistical analysis of the time series from Table 1, we observed that the data are homogenous and nonseasonal. The R squared for each of these three series is presented in Table 2.
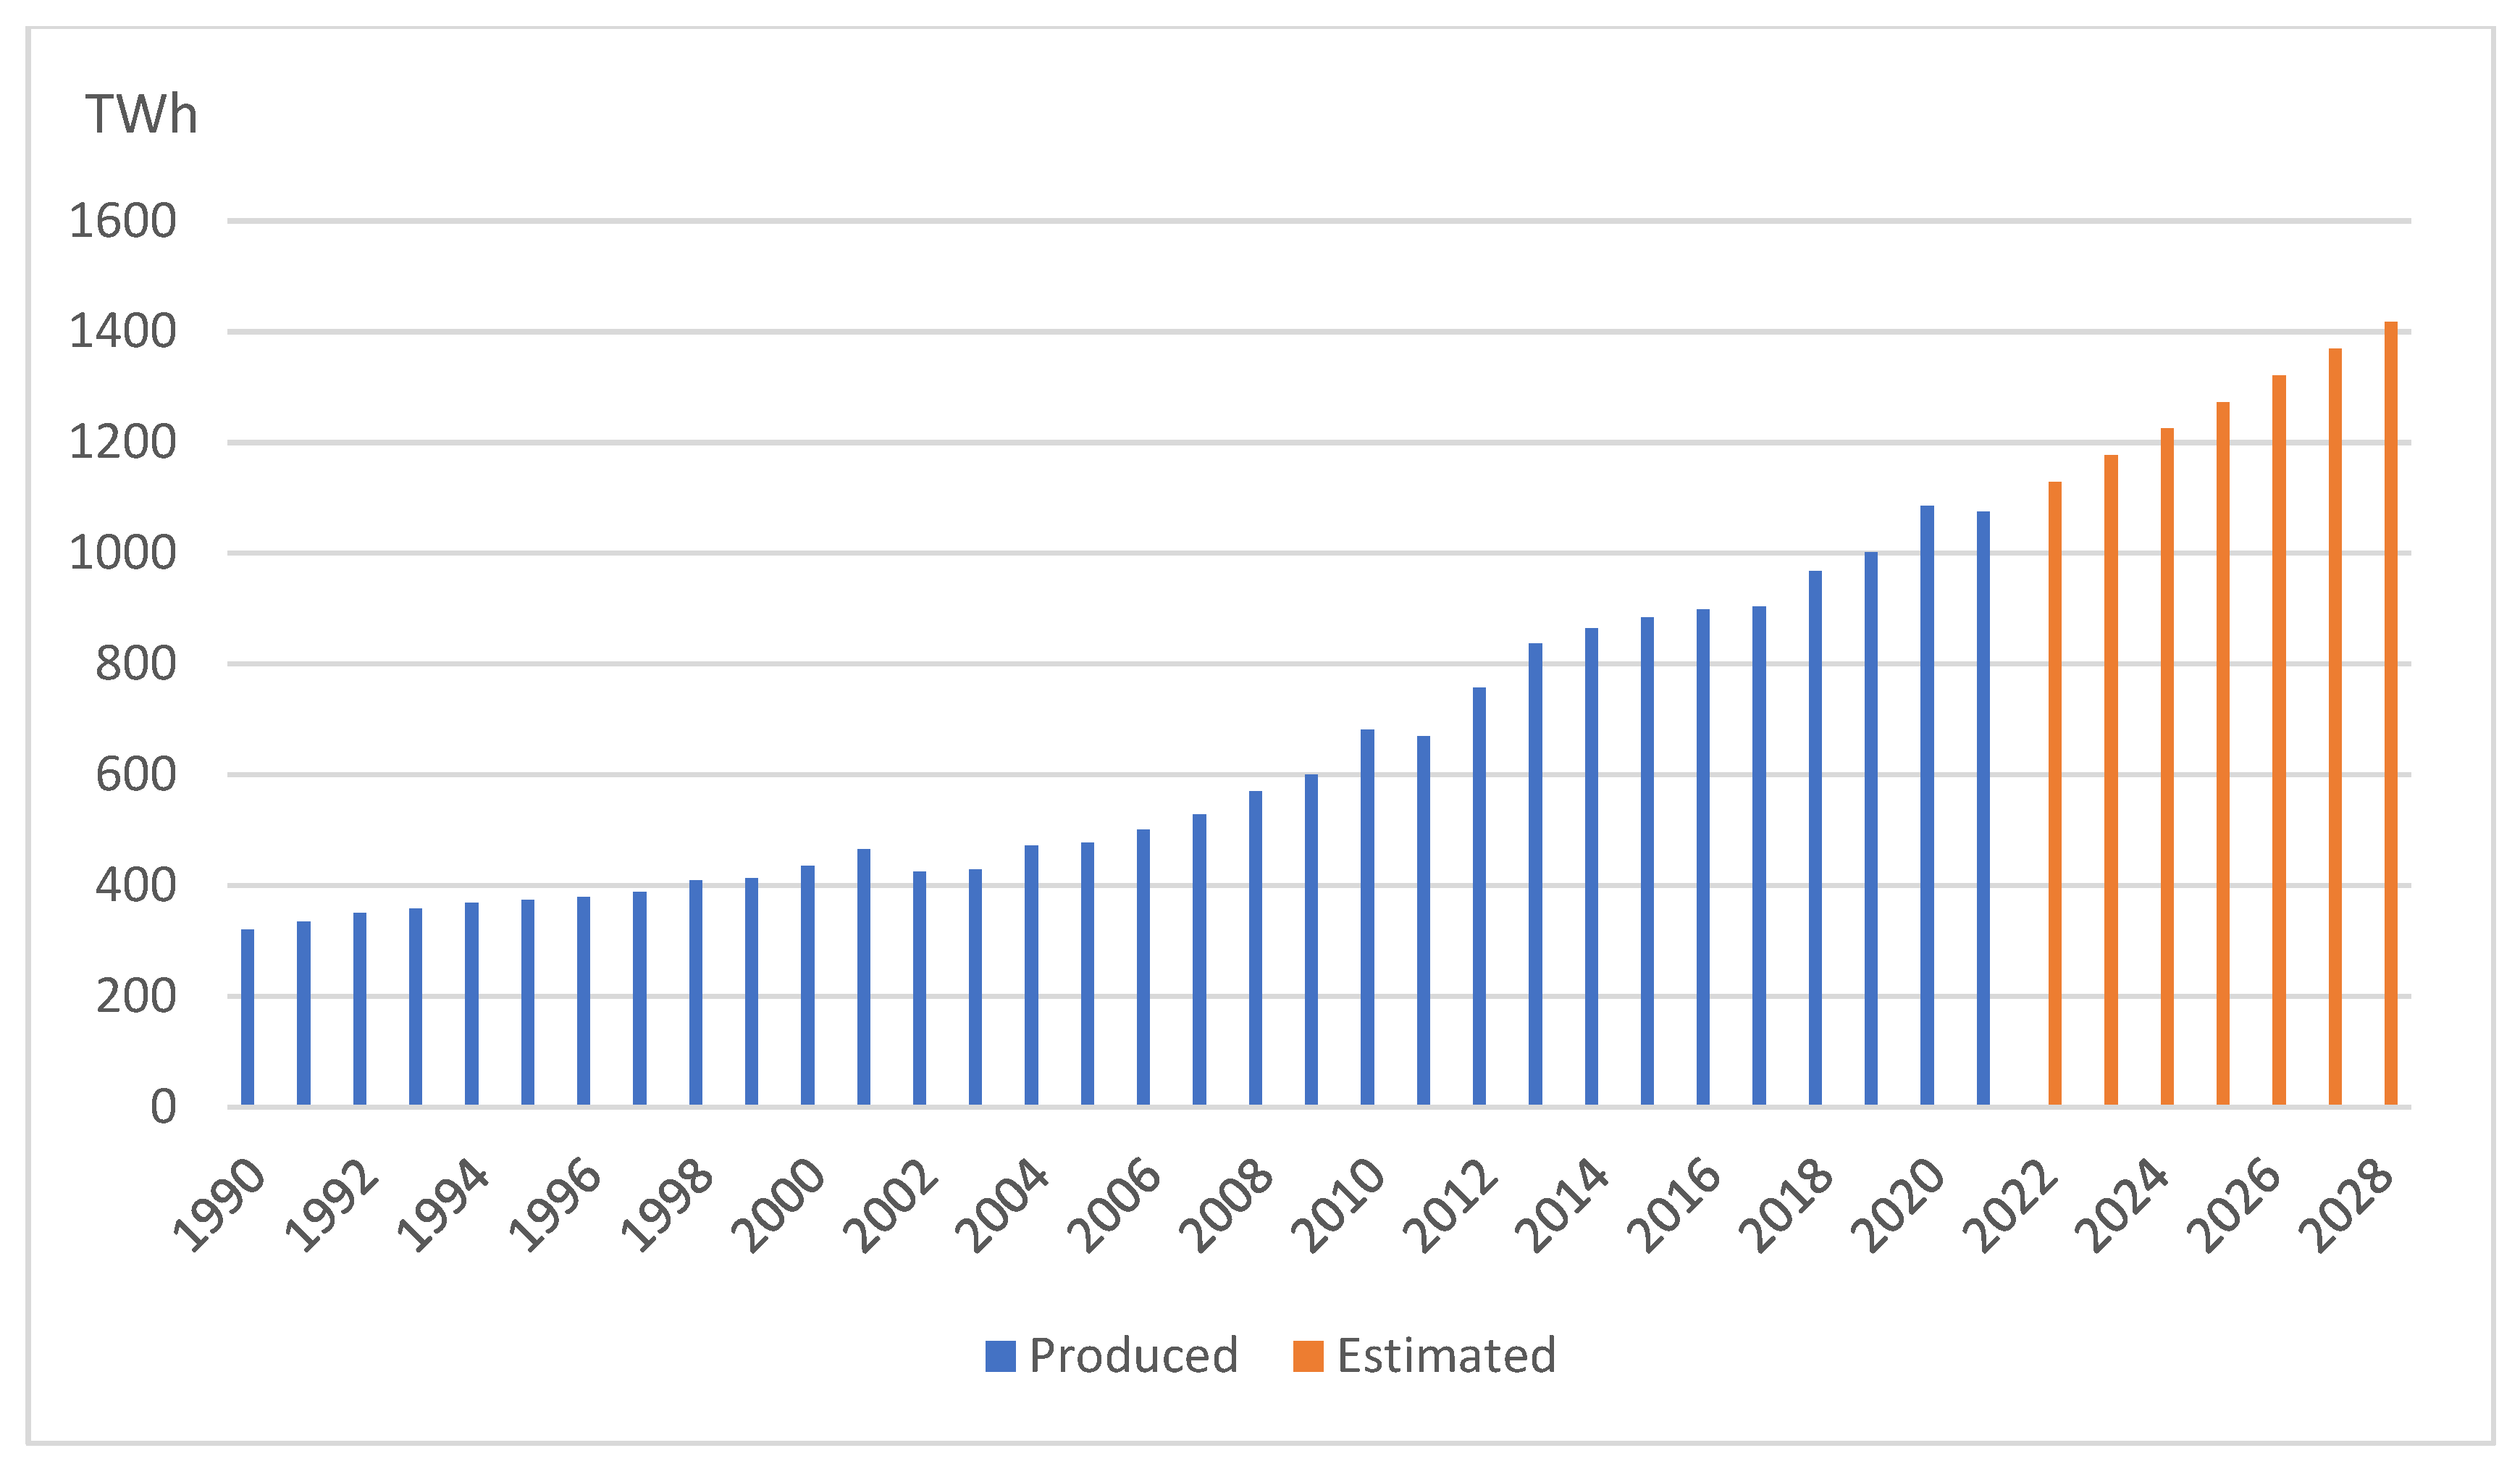
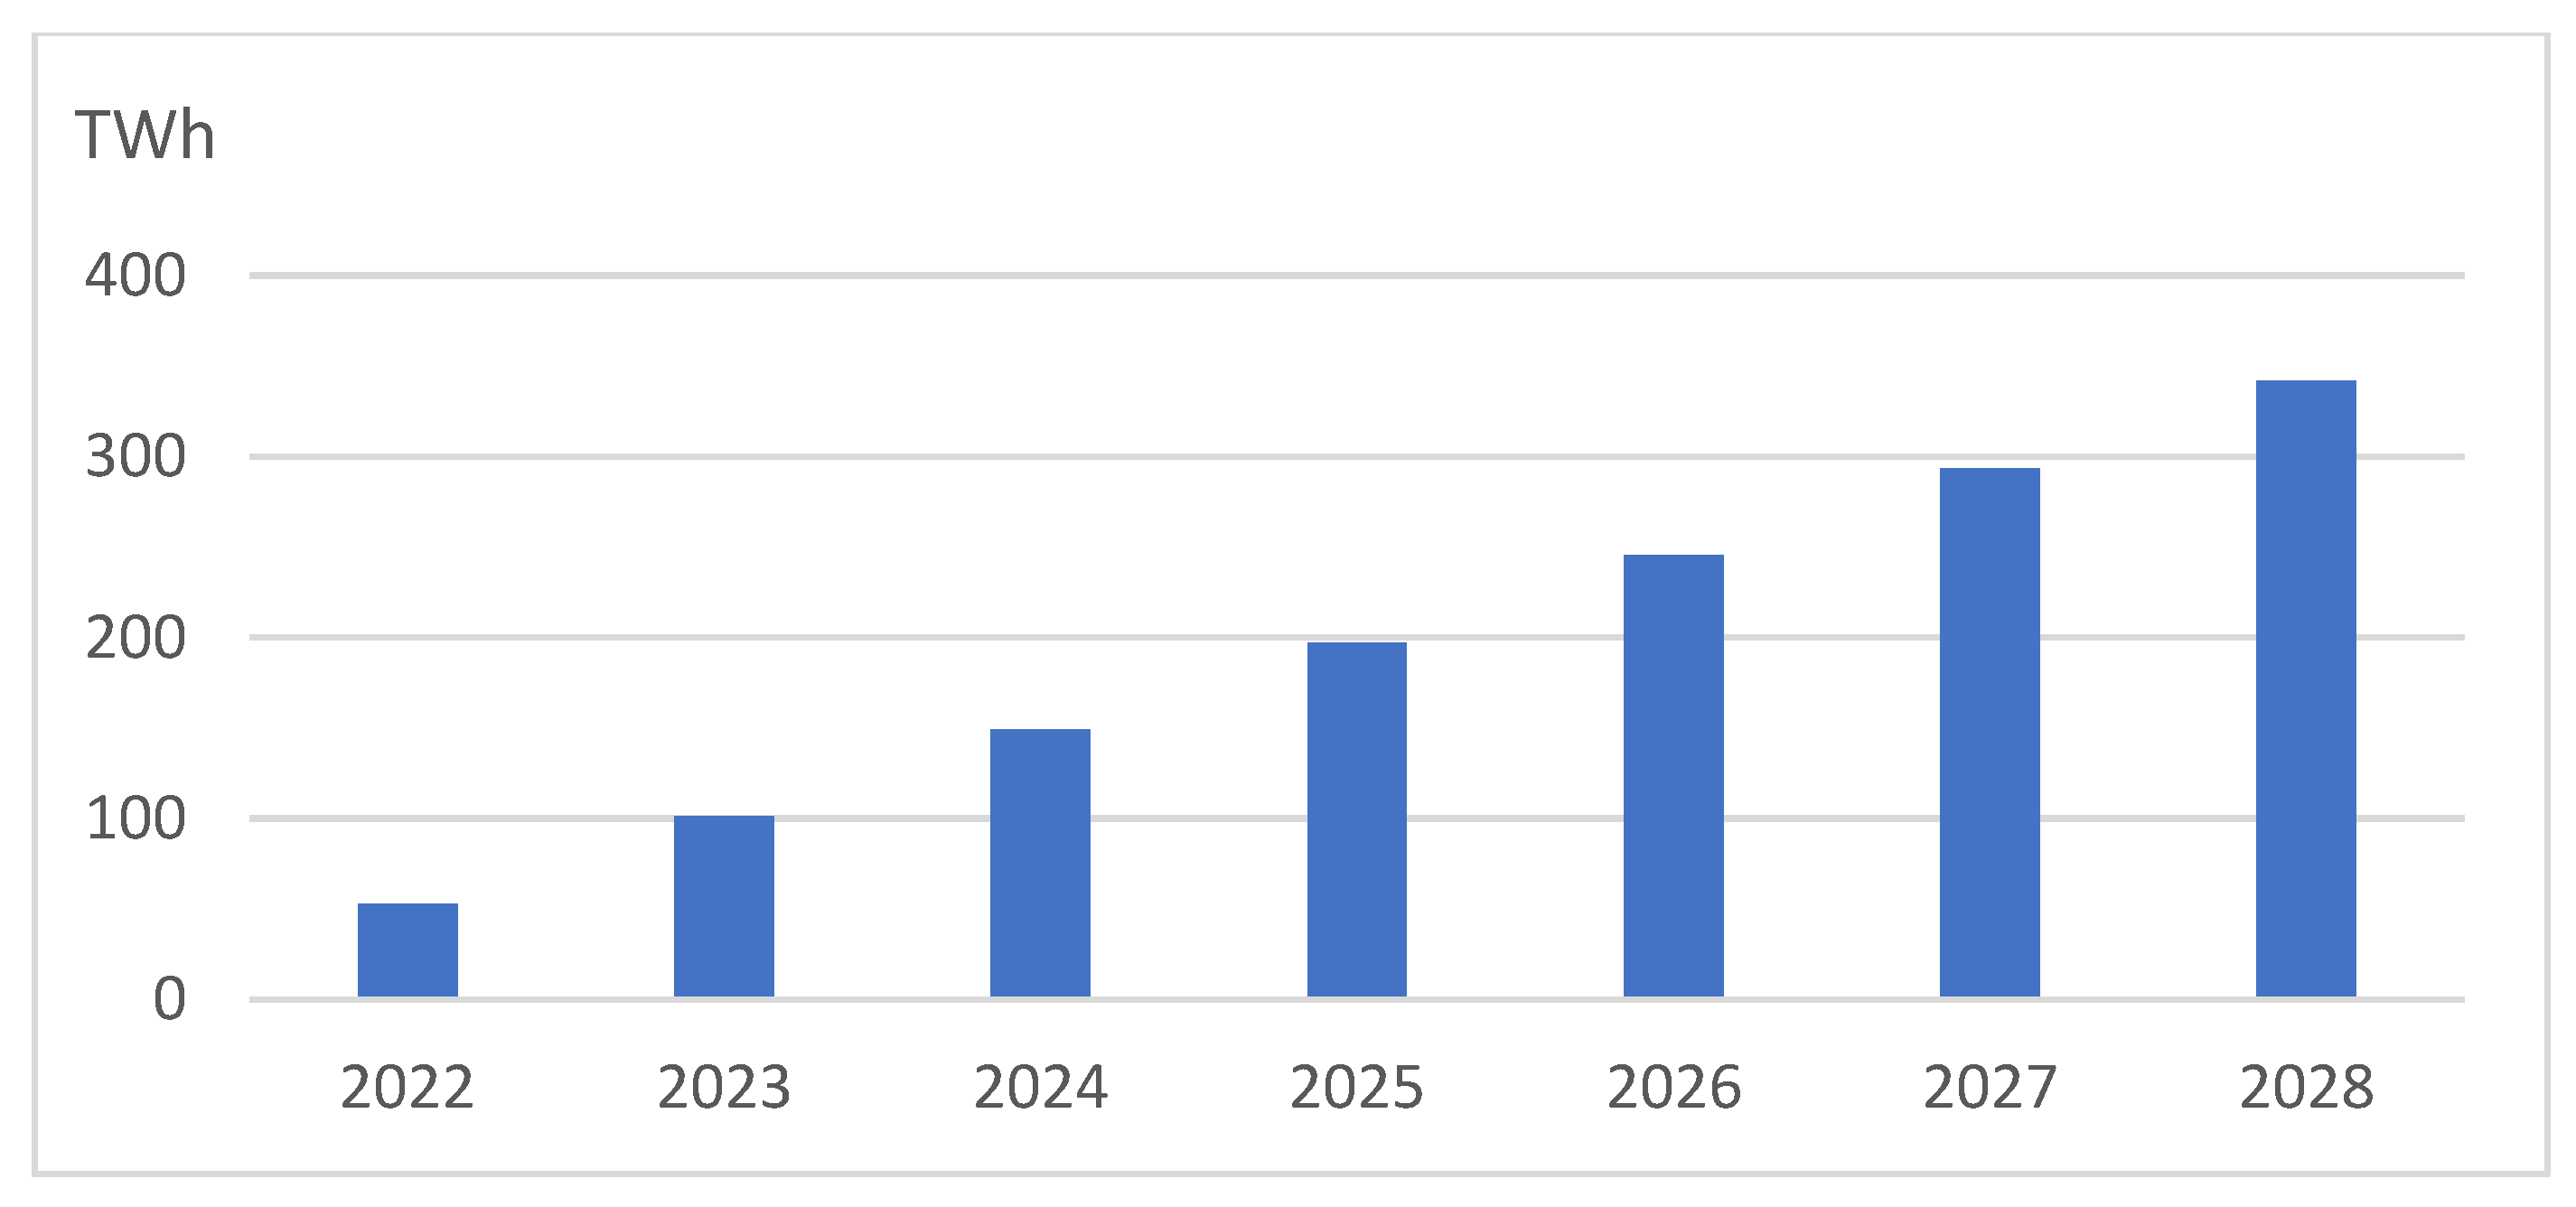
The modeling algorithms presented before were applied to the time series from Table 1. The results of the predictions are presented in Table 3 and Figure 5.
The results show that for wind, solar and other renewables including bioenergy, we have a good prediction with a higher confidence level. In the case of electricity from hydro sources, the algorithm that fitted best was ARIMA (0, 0, 0) and the prediction is estimated to be the average of existing data because there is not a clear trend. Observing the hydroelectricity production distribution data, it looks like all values are homogeneously distributed between 300 and 400 TWh, with an average of 354.55 TWh. The standard deviation of them was calculated and is 24.36TWh and it was used to adjust the average.
The total hydropower installed in EU countries has been pretty much constant in the last three decades. This is because of its environmental impact, even if it is green energy. There are several pieces of EU legislation that address the environmental impacts of hydropower, which include changes that can affect wildlife and river morphology, causing a fragmentation of the river system. The year-by-year fluctuations are mainly because of weather (the amount of precipitation). This is the reason that ARIMA algorithm estimations are constant with a value around the average. In our study, we decided to decrease the estimated value with the standard deviation value to avoid further use of a value with a lower probability but to analyze what would happen in a pessimistic case. So, most likely, in real life, the results for the next years could be even better.
In Table 3 and in the following part we have used the pessimistic estimation to avoid making conclusions based on an optimistic vision that could be less likely to happen. The resulting value is 330.19TWh and can be found in the Hydro column in Table 3.
Based on the current forecast modeling results, analyzing data from Table 1 and Table 3, the results show that the additional renewable electricity added to the power grid in 2028 would be 342.36 TWh in a pessimistic scenario and 366.73 TWh in an optimistic case. Even continuing the analysis using the pessimistic value, it looks like the growth of renewable electricity production represents an important amount that allows governments to reduce the other non-green sources of electricity and thus increase the share of renewables.
Table 4 presents a comparison between the current share (2021) of renewable electricity of the total energies consumed and an estimation of this share in 2028 taking into consideration the median values of the forecast. It is important to mention that these percentages are calculated in the hypothesis that the rest of the energy sources will be used in the same amount as in 2021. This offers flexibility about how much non-green energy is needed to be produced.
As we highlighted above, the total installed hydropower also looks to be almost constant over the last three decades, with production fluctuating between 300 and 400 TWh, depending on weather conditions. At the same time, wind and solar electricity experienced a big growth starting from almost nothing in 1990 to exceeding hydro in the case of wind and to half of hydro in the case of solar electricity (Table 1). Other renewable sources (no hydro, wind, or solar) also had a 10 times higher growth in the same period of time. This is why the total share of hydro is predicted to decrease in the next years, from 8.80% to 7.17%. All other renewable electricity sources, except hydro, will increase their share until 2028.

4.2. The Impact of Migration to Electric Cars

In the last couple of years, the number of electric cars on the roads was significantly higher. For instance, there were almost 20 million passenger electric vehicles in 2021, over 1.3 million commercial electric vehicles (including buses, delivery vans, and trucks), and over 280 million electric mopeds, scooters, motorcycles, and three-wheelers on the road globally [61]. Moreover, electric vehicle model availability has increased tremendously from 2015 to 2021 (Figure 6) [62]. Different electric vehicle models are available nowadays, and their diversification is still increasing. For instance, the number of available electric vehicle models has increased by more than 15% in 2021 as compared to 2020 and has reached 450 models [62].
On one hand, the number of electric cars on the roads was significantly higher, and, on the other hand, the number of electric car models available on the market increased rapidly. These realities lead us to the conclusion that people are willing and eager to buy electric cars and have a greater variety of electric car models to choose from. Electric engines are also more efficient than internal combustion engines, and the fuel costs are lower in the case of electric cars as compared to internal combustion engine cars [63,64]. This will lead to an increasing replacement of current internal combustion engine cars with electric cars in the next years.
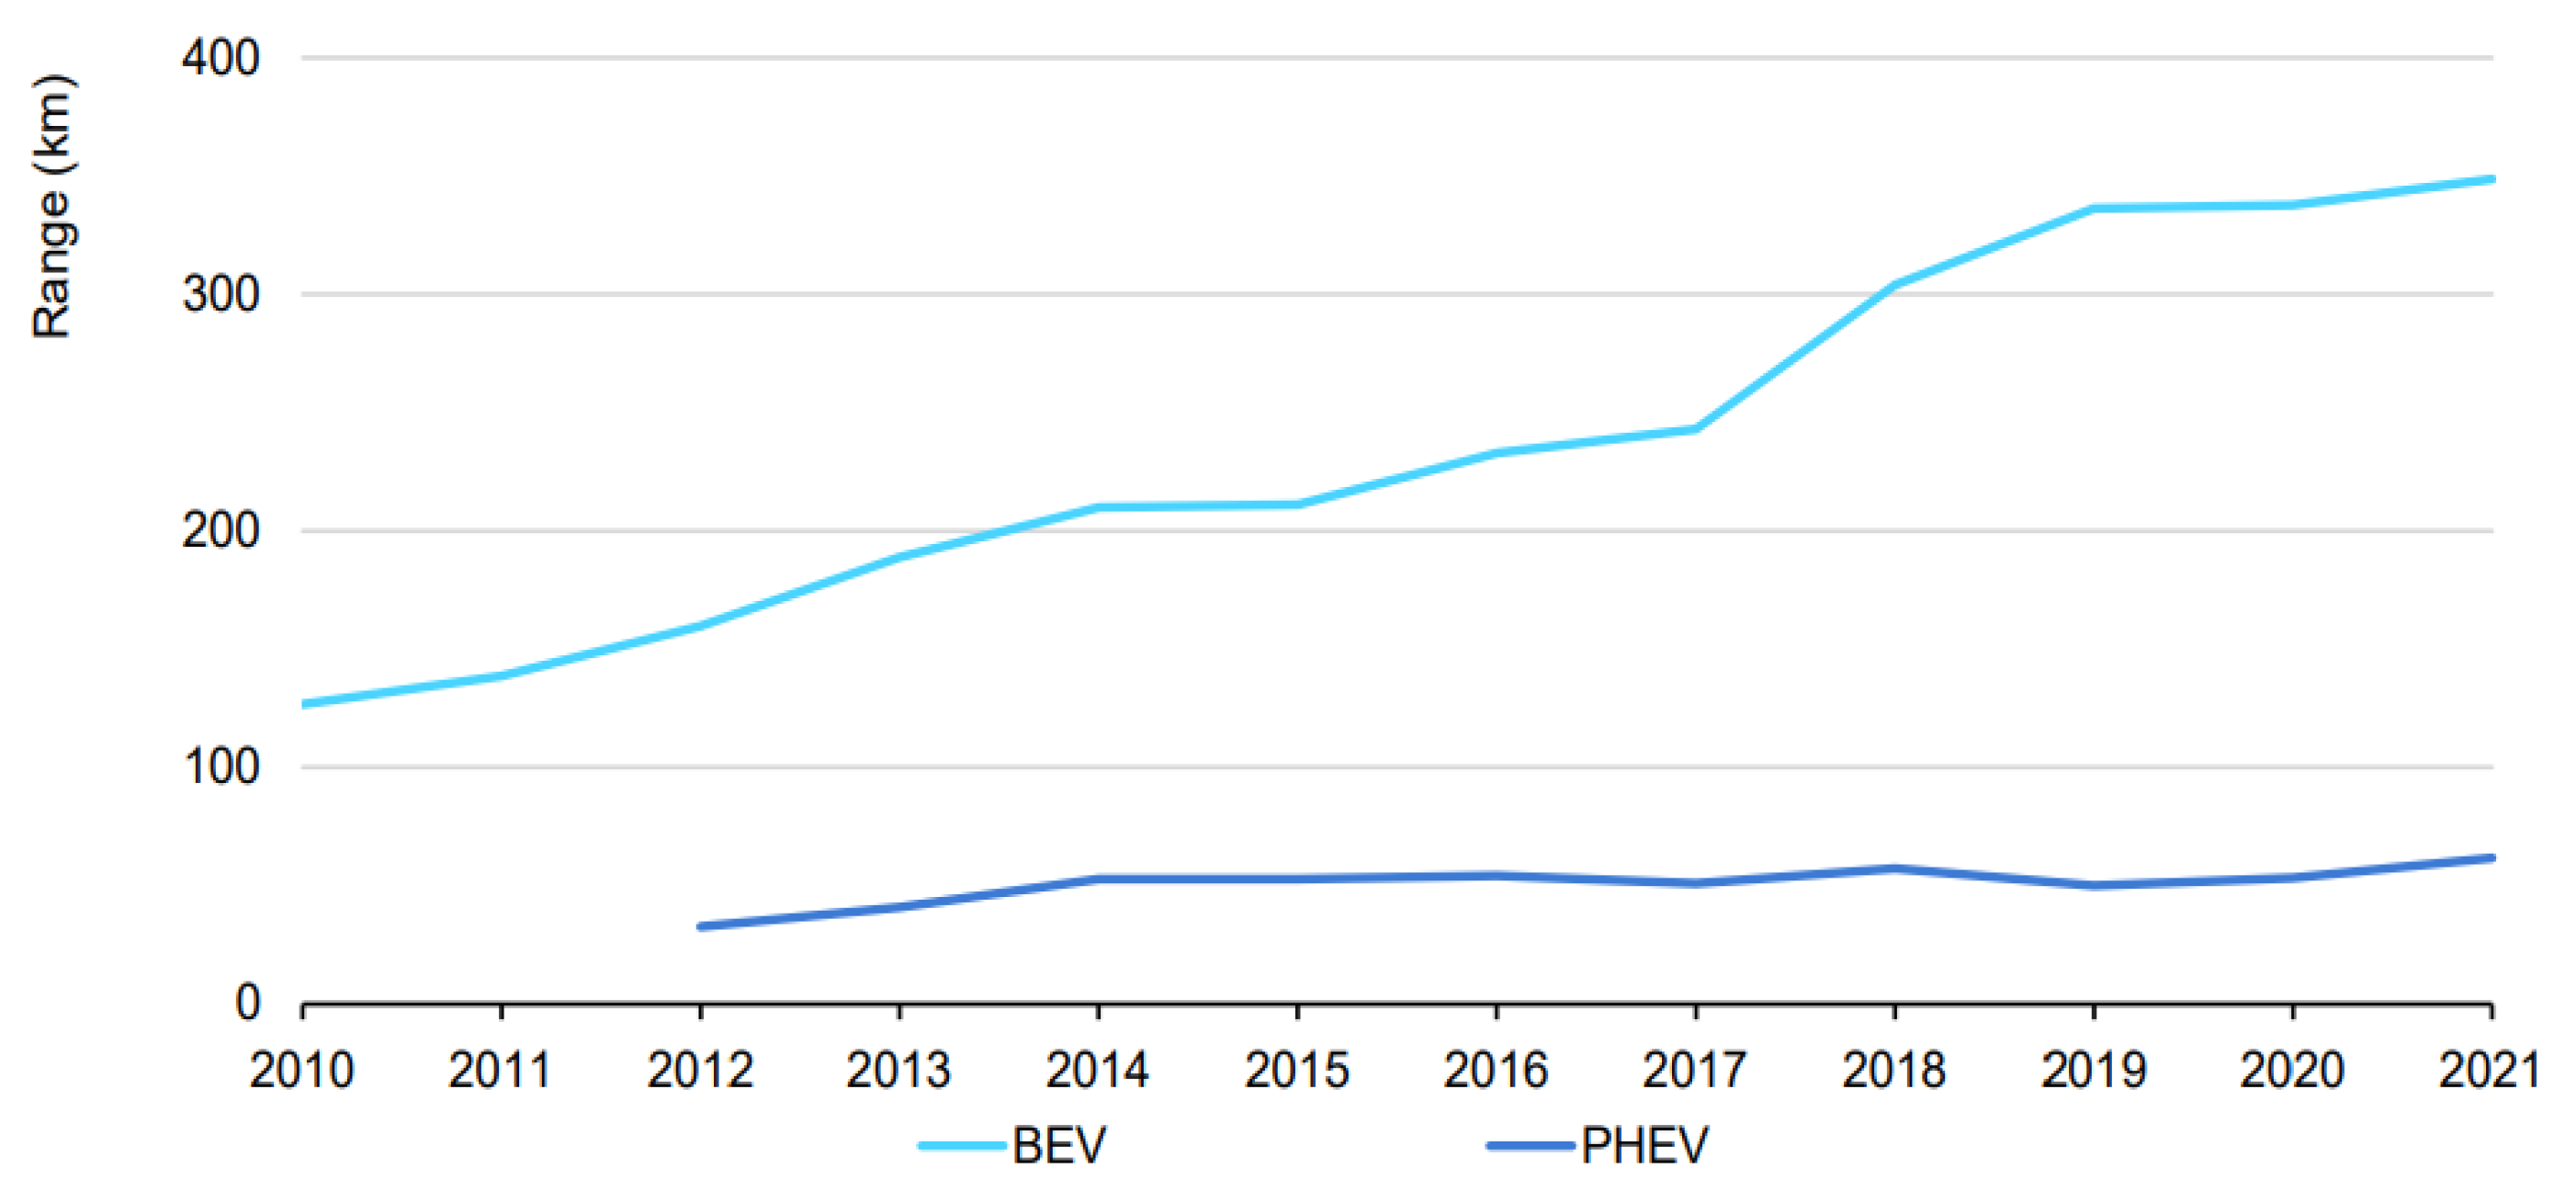
The driving range of electric vehicles remains an important concern for consumers, even though the average range has increased over the years (Figure 7), both for battery electric vehicles (BEV) and plug-in hybrid vehicles (PHEV). The producers of electric vehicles usually aim for longer ranges to boost sales. However, increasing the driving range typically implies larger batteries, increased resource needs, and higher prices. As fast charging will become more widely available, the driving range of electric vehicles will probably reach a plateau [62].
An important concern about growing the number of electric cars is how much pressure will be added to the current power grid and how much more energy would be needed. Below there is an analysis and an estimation regarding this issue.
Taking into consideration the regular consumption of a common gasoline engine, a comparable diesel, and an electric engine (Table 5), a conversion factor between them can be estimated. In this table, we have used an average consumption advertised by the manufacturers of compact cars with similar engine power, but using different fuels (fossil fuels or electricity). We have used it because this consumption is measured in the same way in a controlled environment by all manufacturers, to allow customers to compare the consumption of different cars. Analyzing the number of diesel and petrol cars registered in the EU27 (except Bulgaria, Greece, Ireland, and Slovakia, because there are no data for them) it can be seen that the ratio is 45% diesel and 55% petrol. In EUROSTAT we have available data regarding motor petrol and diesel consumption. In the case of petrol, it is mostly used by cars, whereas in the case of diesel, there are many more consumers (trucks, buses, industrial reshipments, agriculture machinery, cargo ships and so on). Using the previous percentage distribution and the average diesel engine consumption, the diesel used by passenger cars can be determined.
In a theoretical hypothesis that all current cars will be replaced in the future by electrical cars, the amount of electrical energy required by this change was computed and is shown in the last column of Table 5. The total equivalent electricity consumption is 313.34 TWh. Comparing this value with the total energy available for consumption in EU27, 2571 TWh (in 2021), we may conclude that the extra load on the power grid would be around 12.18%. The result is similar to that reported by others [65]. This would be the maximum extra load of the power grid in the case of all current cars being replaced by electric cars, but this is not expected to be in place before 2045 or even later, taking into account that the lifetime of a car is around 15 years and that until 2030, this type of car will still be sold.
In light of the result obtained in the previous paragraph, where we have estimated the amount of electricity that will be obtained in 2028 from renewable sources, 342.36 TWh, it looks like the electrical energy required by electric cars could be covered 100% from these kinds of green sources. A detailed green electricity forecast to be added year by year can be observed in Figure 8. This reveals that this amount of required electricity can be covered even earlier, in 2027.
This will have an important impact on EU countries in multiple directions:
  • Carbon footprint;
  • Ecological impact;
  • Energy independence of EU.
Whether this turns out not to be an issue for the power grid, this migration to electric cars could still be an issue for EU governments because the fuel tax is an important revenue source. The next paragraph will tackle this topic to estimate the impact of tax revenue.
Among EU countries, there are different taxes added to petrol or diesel, presented in Figure 9.
Based on these duties’ values per ton, in Table 6 we have calculated the total amount of petrol and diesel excise revenue per each country. In the 3rd column, we have estimated the total quantity of diesel fuel used by cars per each EU country, starting from the total petrol used and the petrol/diesel car ratio in that country. In columns 4 and 5, we have calculated the total amount of taxes (excluding VAT) for petrol and diesel. The last column is the sum of columns 4 and 5, which helps us to gain a consolidated view of car fuel taxes for each country.
The amounts are important and they should be addressed by updating the tax policies to avoid pressure on highway budgets. Taking Romania as an example, this revenue equals 0.375% of its current GDP (2021) [68]. In EU27, the total taxes (excluding VAT) will be 62 billion Euros, of which Germany and France will have the highest amounts, 16 billion Euros, and 11.6 billion Euros, respectively, followed by Italy, with 8.5 billion Euros, and then big drop to Spain, with 4.5 billion Euros. In general, at the level of each country analyzed, the total petrol taxes excluding VAT are much higher than diesel taxes excluding VAT.
On the other hand, this would mean that we have almost no petrol or diesel consumed by passenger cars and this would have a huge positive impact on climate change. This will be an important step to obtain the energy independence that is crucial in the context of the current world energy crisis and the Ukrainian conflict.
This reduction in the use of petrol and diesel will decrease the overall oil demand and will help the governments in their efforts to:
  • Keep the energy prices under control
  • Reduce their energy expenses.

5. Discussion and Conclusions

Analyzing the above issues, we may conclude by asserting that renewable energies seem to be the future for the EU and for our planet. We have to accelerate the migration to them in order to protect nature and the population. This study has shown that even six years from now, in 2028, there is an important growing use of this kind of energy. In parallel with the electric car share increasing, this will help to reach the EU green targets. Governments have the opportunity nowadays to reduce the other non-green sources of electricity and thus increase the share of renewables.
The research carried out allows us to conclude that there are still important challenges and one of them is energy storage, but so far, the prospects look good. Electric cars would be a big win because their engines are almost four times more efficient than traditional engines [69].
This paper synthesizes some of the important aspects regarding the energy future of EU countries. The results obtained show that we still need policies to stimulate electricity production from renewable sources because we will gain an important benefit from these. Replacing all current passenger cars is not too difficult to implement in the near future, as global policy pressure grows, more electric car models become available, and consumer interest increases. Therefore, electric vehicle adoption is set to continue to rise sharply by 2025 [61]. According to the estimation carried out in this paper, the extra load on the power grid is not too high, at around 12.18%, and if needed, it could be covered 100% from green sources even before 2028. This would be a huge gain in our fight to protect the planet.
There is a small challenge regarding reducing government revenue due to fuel excises but it can be easily compensated by updating tax policies. Moreover, support schemes for electric vehicles and electric vehicle chargers need to be developed in order to increase the sales of electric cars and to encourage users to give up internal combustion engine vehicles in favor of electric ones. These could include bonus payments to buyers of electric vehicles, as well as tax reductions or exemptions. The impact of these support schemes on national budgets could be significant. Taking into account our conclusion that government revenue due to fuel excises will decrease, and also the need for public funding to further develop renewable electricity and the growth of electric cars, it seems that the updating of tax policies becomes very important, together with the rethinking and reconfiguration of public budgets.
To conclude, all four questions investigated in this research paper have positive responses based on this study. This offers a better view of the future of renewable energies and the migration to electric cars and their potential challenges and improvements.
We may suggest that further research should be carried out in investigating and summarizing the grid integration of electric vehicles and smart charging policies in European Union countries, as well as support schemes for electric cars. Furthermore, another research direction could be to investigate how changes in policy measures influence electric vehicle market growth in different countries.

Author Contributions

Conceptualization, A.-I.Z., E.O.C., C.B. and C.D.; methodology, A.-I.Z., E.O.C., C.B. and C.D.; formal analysis, A.-I.Z., E.O.C., C.B. and C.D.; investigation, A.-I.Z., E.O.C., C.B. and C.D.; writing—original draft preparation, A.-I.Z., E.O.C. and C.B.; writing—review and editing, A.-I.Z., E.O.C., C.B. and C.D. All authors have read and agreed to the published version of the manuscript.

Funding

This research received no external funding.

Data Availability Statement

Not applicable.

Conflicts of Interest

The authors declare no conflict of interest.

References

  1. Bórawski, P.; Wyszomierski, R.; Bełdycka-Bórawska, A.; Mickiewicz, B.; Kalinowska, B.; Dunn, J.W.; Rokicki, T. Development of Renewable Energy Sources in the European Union in the Context of Sustainable Development Policy. Energies 2022, 15, 1545. [Google Scholar] [CrossRef]
  2. Zamfir, A.; Colesca, S.E.; Corbos, R.A. Public policies to support the development of renewable energy in Romania: A review, Renew. Sustain. Energy Rev. 2016, 58, 87–106. [Google Scholar] [CrossRef]
  3. IEA. World Energy Outlook 2021; IEA: Paris, France, 2021; Available online: https://www.iea.org/reports/world-energy-outlook-2021 (accessed on 15 April 2022).
  4. Banca Nationala a Romaniei. Raportul Asupra Stabilitatii Financiare–Iunie 2022. 2022. Available online: https://www.bnr.ro/Raportul-asupra-stabilita%c8%9bii-financiare---iunie-2022-24352.aspx (accessed on 18 July 2022).
  5. IEA. Power Systems in Transition; IEA: Paris, France, 2020; Available online: https://www.iea.org/reports/power-systems-in-transition (accessed on 15 April 2022).
  6. World Energy Council. World Energy Pulse: Climate, COVID and Conflict Implications and Outlooks, April 2022. Available online: https://www.worldenergy.org/assets/downloads/World_Energy_Pulse_2022.pdf?v=1654602455 (accessed on 17 July 2022).
  7. Makieła, K.; Mazur, B.; Głowacki, J. The Impact of Renewable Energy Supply on Economic Growth and Productivity. Energies 2022, 15, 4808. [Google Scholar] [CrossRef]
  8. Gökgöz, F.; Güvercin, M.T. Energy security and renewable energy efficiency in EU. Renew. Sustain. Energy Rev. 2018, 96, 226–239. [Google Scholar] [CrossRef]
  9. Tvaronavičienė, M.; Plėta, T.; Della Casa, S.; Latvys, J. Cyber security management of critical energy infrastructure in national cybersecurity strategies: Cases of USA, UK, France, Estonia and Lithuania. Insights Into Reg. Dev. 2020, 2, 802–813. [Google Scholar] [CrossRef]
  10. Cao, J.; Chen, X.; Qiu, R.; Hou, S. Electric vehicle industry sustainable development with a stakeholder engagement system. Technol. Soc. 2021, 67, 101771. [Google Scholar] [CrossRef]
  11. Ternel, C.; Bouter, A.; Melgar, J. Life cycle assessment of mid-range passenger cars powered by liquid and gaseous biofuels: Comparison with greenhouse gas emissions of electric vehicles and forecast to 2030. Transp. Res. Part D 2021, 97, 102897. [Google Scholar] [CrossRef]
  12. Marino, A.; Pariso, P. The transition towards to the circular economy: European SMEs’ trajectories. Entrep. Sustain. Issues 2021, 8, 431–445. [Google Scholar] [CrossRef]
  13. Antonioli, D.; Chioatto, E.; Mazzanti, M. Innovations and the circular economy: A national and regional perspective. Insights Into Reg. Dev. 2022, 9, 57–70. [Google Scholar] [CrossRef]
  14. Sarma, U.; Karnitis, G.; Zuters, J.; Karnitis, E. District heating networks: Enhancement of the efficiency. Insights Into Reg. Dev. 2019, 1, 200–213. [Google Scholar] [CrossRef]
  15. Draghici, M. România–Oportunităţi şi riscuri pentru independenţa energetică, Ernst & Young, 16 mai 2022. 2022. Available online: https://www.ey.com/ro_ro/energy-reimagined/oportunitati-si-riscuri-pentru-independenta-energetica (accessed on 19 July 2022).
  16. Burchart-Korol, D.; Jursova, S.; Folega, P.; Korol, J.; Pustejovska, P.; Blaut, A. Environmental life cycle assessment of electric vehicles in Poland and the Czech Republic. J. Clean. Prod. 2018, 202, 476–487. [Google Scholar] [CrossRef]
  17. Burchart-Korol, D.; Jursova, S.; Folega, P.; Pustejovska, P. Life cycle impact assessment of electric vehicle battery charging in European Union countries. J. Clean. Prod. 2020, 257, 120476. [Google Scholar] [CrossRef]
  18. Rietmann, N.; Hügler, B.; Lieven, T. Forecasting the trajectory of electric vehicle sales and the consequences for worldwide CO2 emissions. J. Clean. Prod. 2020, 261, 121038. [Google Scholar] [CrossRef]
  19. Shafique, M.; Azam, A.; Rafiq, M.; Luo, X. Life cycle assessment of electric vehicles and internal combustion engine vehicles: A case study of Hong Kong. Res. Transp. Econ. 2022, 91, 101112. [Google Scholar] [CrossRef]
  20. Yang, L.; Yu, B.; Yang, B.; Chen, H.; Malima, G.; Wei, Y.-M. Life cycle environmental assessment of electric and internal combustion engine vehicles in China. J. Clean. Prod. 2021, 285, 124899. [Google Scholar] [CrossRef]
  21. Wu, Z.; Wang, M.; Zheng, J.; Sun, X.; Zhao, M.; Wang, X. Life cycle greenhouse gas emission reduction potential of battery electric vehicle. J. Clean. Prod. 2018, 190, 462–470. [Google Scholar] [CrossRef]
  22. Shafique, M.; Luo, X. Environmental life cycle assessment of battery electric vehicles from the current and future energy mix perspective. J. Environ. Manag. 2022, 303, 114050. [Google Scholar] [CrossRef] [PubMed]
  23. Younes, A.; Fingerman, K.R.; Barrientos, C.; Carman, J.; Johnson, K.; Wallach, E.S. How the U.S. Renewable Fuel Standard could use garbage to pay for electric vehicles. Energy Policy 2022, 166, 112916. [Google Scholar] [CrossRef]
  24. Pablo-Romero, M.P.; Sanchez-Braza, A.; Galyan, A. Renewable energy use for electricity generation in transition economies: Evolution, targets and promotion policies. Renew. Sustain. Energy Rev. 2021, 138, 110481. [Google Scholar] [CrossRef]
  25. IEA. Share of Global Final Energy Consumption by fuel in the Sustainable Development Scenario, 2000–2040; IEA: Paris, France, 2020; Available online: https://www.iea.org/data-and-statistics/charts/share-of-global-final-energy-consumption-by-fuel-in-the-sustainable-development-sce (accessed on 15 April 2022).
  26. Thimet, P.J.; Mavromatidis, G. Review of model-based electricity system transition scenarios: An analysis, for Switzerland, Germany, France, and Italy. Renew. Sustain. Energy Rev. 2022, 159, 112102. [Google Scholar] [CrossRef]
  27. Kyriakopoulos, G.L.; Arabatzis, G. Electrical energy storage systems in electricity generation: Energy policies, innovative technologies, and regulatory regimes. Renew. Sustain. Energy Rev. 2016, 56, 1044–1067. [Google Scholar] [CrossRef]
  28. Rahman, A.; Farrok, O.; Haque, M.M. Environmental impact of renewable energy source based electrical power plants: Solar, wind, hydroelectric, biomass, geothermal, tidal, ocean, and osmotic. Renew. Sustain. Energy Rev. 2022, 161, 112279. [Google Scholar] [CrossRef]
  29. REN21. Renewables 2022 Global Status Report; REN21: Paris, France, 2022; Available online: https://www.ren21.net/wp-content/uploads/2019/05/GSR2022_Full_Report.pdf (accessed on 15 July 2022).
  30. Ansarin, M.; Ghiassi-Farrokhfal, Y.; Ketter, W.; Collins, J. A review of equity in electricity tariffs in the renewable energy era. Renew. Sustain. Energy Rev. 2022, 161, 112333. [Google Scholar] [CrossRef]
  31. Fatoki, O. Determinants of hotel employees’ electricity saving intention: Extending the theory of planned behaviour. Entrep. Sustain. Issues 2020, 8, 86–97. [Google Scholar] [CrossRef]
  32. Nguyen, V.P.; Tran, T.K. Explicating Energy Saving Intention from the Prospect of Small Medium Enterprises. Entrep. Sustain. Issues 2020, 8, 716–734. [Google Scholar] [CrossRef] [PubMed]
  33. Gawel, E.; Strunz, S.; Lehmann, P. A Public Choice View on the Climate and Energy Policy Mix in the EU-How Do the Emissions Trading Scheme and Support for Renewable Energies Interact? Energy Policy 2014, 64, 175–182. [Google Scholar] [CrossRef] [Green Version]
  34. Lean, H.H.; Smyth, R. Will Policies to Promote Renewable Electricity Generation Be Effective? Evidence from Panel Stationarity and Unit Root Tests for 115 Countries. Renew. Sustain. Energy Rev. 2013, 22, 371–379. [Google Scholar] [CrossRef]
  35. Stigka, E.K.; Paravantis, J.A.; Mihalakakou, G.K. Social Acceptance of Renewable Energy Sources: A Review of Contingent Valuation Applications. Renew. Sustain. Energy Rev. 2014, 32, 100–106. [Google Scholar] [CrossRef]
  36. Zamfir, A. Developing Urban Renewable Energy Projects: Opportunities and Challenges for Romania. Theor. Empir. Res. Urban Manag. 2014, 9, 52–64. [Google Scholar]
  37. Zamfir, A. Managementul Strategic al Serviciilor de Valorificare Regională a Energiei Regenerabile; Editura ASE: Bucharest, Romania, 2013. (In Romanian) [Google Scholar]
  38. Sánchez, A.S.; Torres, E.A.; Kalid, R.A. Renewable energy generation for the rural electrification of isolated communities in the Amazon Region. Renew. Sustain. Energy Rev. 2015, 49, 278–290. [Google Scholar] [CrossRef]
  39. Blum, N.U.; Wakeling, R.S.; Schmidt, T.S. Rural electrification through village grids–Assessing the cost competitiveness of isolated renewable energy technologies in Indonesia. Renew. Sustain. Energy Rev. 2013, 22, 482–496. [Google Scholar] [CrossRef]
  40. Mboumboue, E.; Njomo, D. Potential contribution of renewables to the improvement of living conditions of poor rural households in developing countries: Cameroon’s case study. Renew. Sustain. Energy Rev. 2016, 61, 266–279. [Google Scholar] [CrossRef]
  41. Pîrlogea, C. Investments for a Sustainable Energy Future. Bus. Excell. Manag. 2012, 2, 21–30. [Google Scholar]
  42. Leva, S.; Zaninelli, D. Sustainable Energy and Economic Evaluation in Stand-Alone Photovoltaic Systems. In Proceedings of the 2006 IASME/WSEAS International Conference on Energy & Environmental Systems, Chalkida, Greece, 8–10 May 2006; pp. 76–82. [Google Scholar]
  43. Sovacool, B.K. The Intermittency of Wind, Solar, and Renewable Electricity Generators: Technical Barrier or Rhetorical Excuse? Util. Policy 2009, 17, 288–296. [Google Scholar] [CrossRef]
  44. Applica & Ismeri Europa. Inception Report, Expert Evaluation Network Delivering Policy Analysis, Contract No. 2010.CE.16.B.A.T.041. 2011. Available online: http://ec.europa.eu/regional_policy/sources/docgener/evaluation/pdf/eval2007/expert_innovation/ince (accessed on 6 July 2022).
  45. Hernandez Moreno, S. Current Technologies Applied to Urban Sustainable Development. Theor. Empir. Res. Urban Manag. 2009, 4, 125–140. [Google Scholar]
  46. Georgescu, S.D. The Moral Manager: Regaining Ethics for Business. Bus. Excell. Manag. 2013, 3, 24–29. [Google Scholar]
  47. ECORYS. Non-Cost Barriers to Renewables-AEON Study Romania. Final Report. 2010. Available online: http://ec.europa.eu/energy/renewables/studies/doc/renewables/2010_non_cost_barriers_countries.zip (accessed on 6 July 2022).
  48. Verboncu, I. Steps to Excellence in the Industrial Enterprises Management. Bus. Excell. Manag. 2013, 3, 5–23. [Google Scholar]
  49. Bordons, C.; García-Torres, F.; Valverde, L. Gestión Óptima de la Energía en Microredes con Generación Renovable. Rev. Iberoam. de Automática e Inf. Ind. 2015, 12, 117–132. (In Spanish) [Google Scholar] [CrossRef] [Green Version]
  50. European Commission. Renewable Energy Targets. 2022. Available online: https://energy.ec.europa.eu/topics/renewable-energy/renewable-energy-directive-targets-and-rules/renewable-energy-targets_en (accessed on 20 July 2022).
  51. Croce, A.I.; Musolino, G.; Rindone, C.; Vitetta, A. Sustainable mobility and energy resources: A quantitative assessment of transport services with electrical vehicles. Renew. Sustain. Energy Rev. 2019, 113, 109236. [Google Scholar] [CrossRef]
  52. Gutierrez-Garcia, F.; Arcos-Vargas, A.; Gomez-Exposito, A. Robustness of electricity systems with nearly 100% share of renewables: A worst-case study. Renew. Sustain. Energy Rev. 2022, 155, 111932. [Google Scholar] [CrossRef]
  53. Guo, D.; Yan, W.; Gao, X.; Hao, Y.; Xu, Y.; Wenjuan, E.; Tan, X.; Zhang, T. Forecast of passenger car market structure and environmental impact analysis in China. Sci. Total Environ. 2021, 772, 144950. [Google Scholar] [CrossRef] [PubMed]
  54. Collett, K.A.; Bhagavathy, S.M.; McCulloch, M.D. Forecast of electric vehicle uptake across counties in England: Dataset from S-curve analysis. Data Brief 2021, 39, 107662. [Google Scholar] [CrossRef] [PubMed]
  55. Bastida-Molina, P.; Hurtado-Pérez, E.; Peñalvo-López, E.; Moros-Gómez, M.C. Assessing transport emissions reduction while increasing electric vehicles and renewable generation levels. Transp. Res. Part D 2020, 88, 102560. [Google Scholar] [CrossRef]
  56. Supply, Transformation and Consumption of Oil and Petroleum Products. Available online: https://ec.europa.eu/eurostat/databrowser/view/NRG_CB_OIL__custom_3074042/default/table?lang=en (accessed on 16 July 2022).
  57. Electricity Production by Source, European Union (27). Available online: https://ourworldindata.org/grapher/electricity-prod-source-stacked?country=~European+Union+%2827%29 (accessed on 11 September 2022).
  58. Brown, R.G. Smoothing Forecasting and Prediction of Discrete Time Series; Prentice-Hall: Englewood Cliffs, NJ, USA, 1963. [Google Scholar]
  59. Brown, R.G. Exponential Smoothing for Predicting Demand; Arthur D. Little Inc.: Cambridge, MA, USA, 1956; p. 15. [Google Scholar]
  60. Hyndman, R.J.; Athanasopoulos, G. Forecasting: Principles and Practice, 2nd ed.; OTexts: Melbourne, Australia, 2018. [Google Scholar]
  61. Bloomberg NEF. Electric Vehicle Outlook. 2022. Available online: https://about.bnef.com/electric-vehicle-outlook/ (accessed on 16 July 2022).
  62. IEA. Global EV Outlook 2022 Securing Supplies for an Electric Future. 2022. Available online: https://iea.blob.core.windows.net/assets/ad8fb04c-4f75-42fc-973a-6e54c8a4449a/GlobalElectricVehicleOutlook2022.pdf (accessed on 15 July 2022).
  63. Albatayneh, A.; Assaf, M.N.; Alterman, D.; Jaradat, M. Comparison of the Overall Energy Efficiency for Internal Combustion Engine Vehicles and Electric Vehicles. Environ. Clim. Technol. 2020, 24, 669–680. [Google Scholar] [CrossRef]
  64. US Department of Energy. Alternative Fuels Data Center, Electric Vehicle Benefits and Considerations. 2022. Available online: https://afdc.energy.gov/fuels/electricity_benefits.html (accessed on 17 November 2022).
  65. Myth Buster: Electric Vehicles Will Overload the Power Grid. Available online: https://www.virta.global/blog/myth-buster-electric-vehicles-will-overload-the-power-grid (accessed on 16 July 2022).
  66. TEDB—“Taxes in Europe” Database. Available online: https://taxation-customs.ec.europa.eu/online-services/online-services-and-databases-taxation/tedb-taxes-europe-database_en (accessed on 22 November 2022).
  67. Search Tax (Simple). Available online: https://ec.europa.eu/taxation_customs/tedb/taxSearch.html/ (accessed on 22 November 2022).
  68. INS. Available online: https://insse.ro/cms/ro (accessed on 18 July 2022).
  69. Gustafsson, T.; Johansson, A. Comparison between Battery Electric Vehicles and Internal Combustion Engine Vehicles Fueled by Electrofuels. From an Energy Efficiency and Cost Perspective. Master’s Thesis, Department of Energy and Environment, Chalmers University of Technology, Gothenburg, Sweden, 2015. Available online: https://publications.lib.chalmers.se/records/fulltext/218621/218621.pdf (accessed on 16 November 2022).
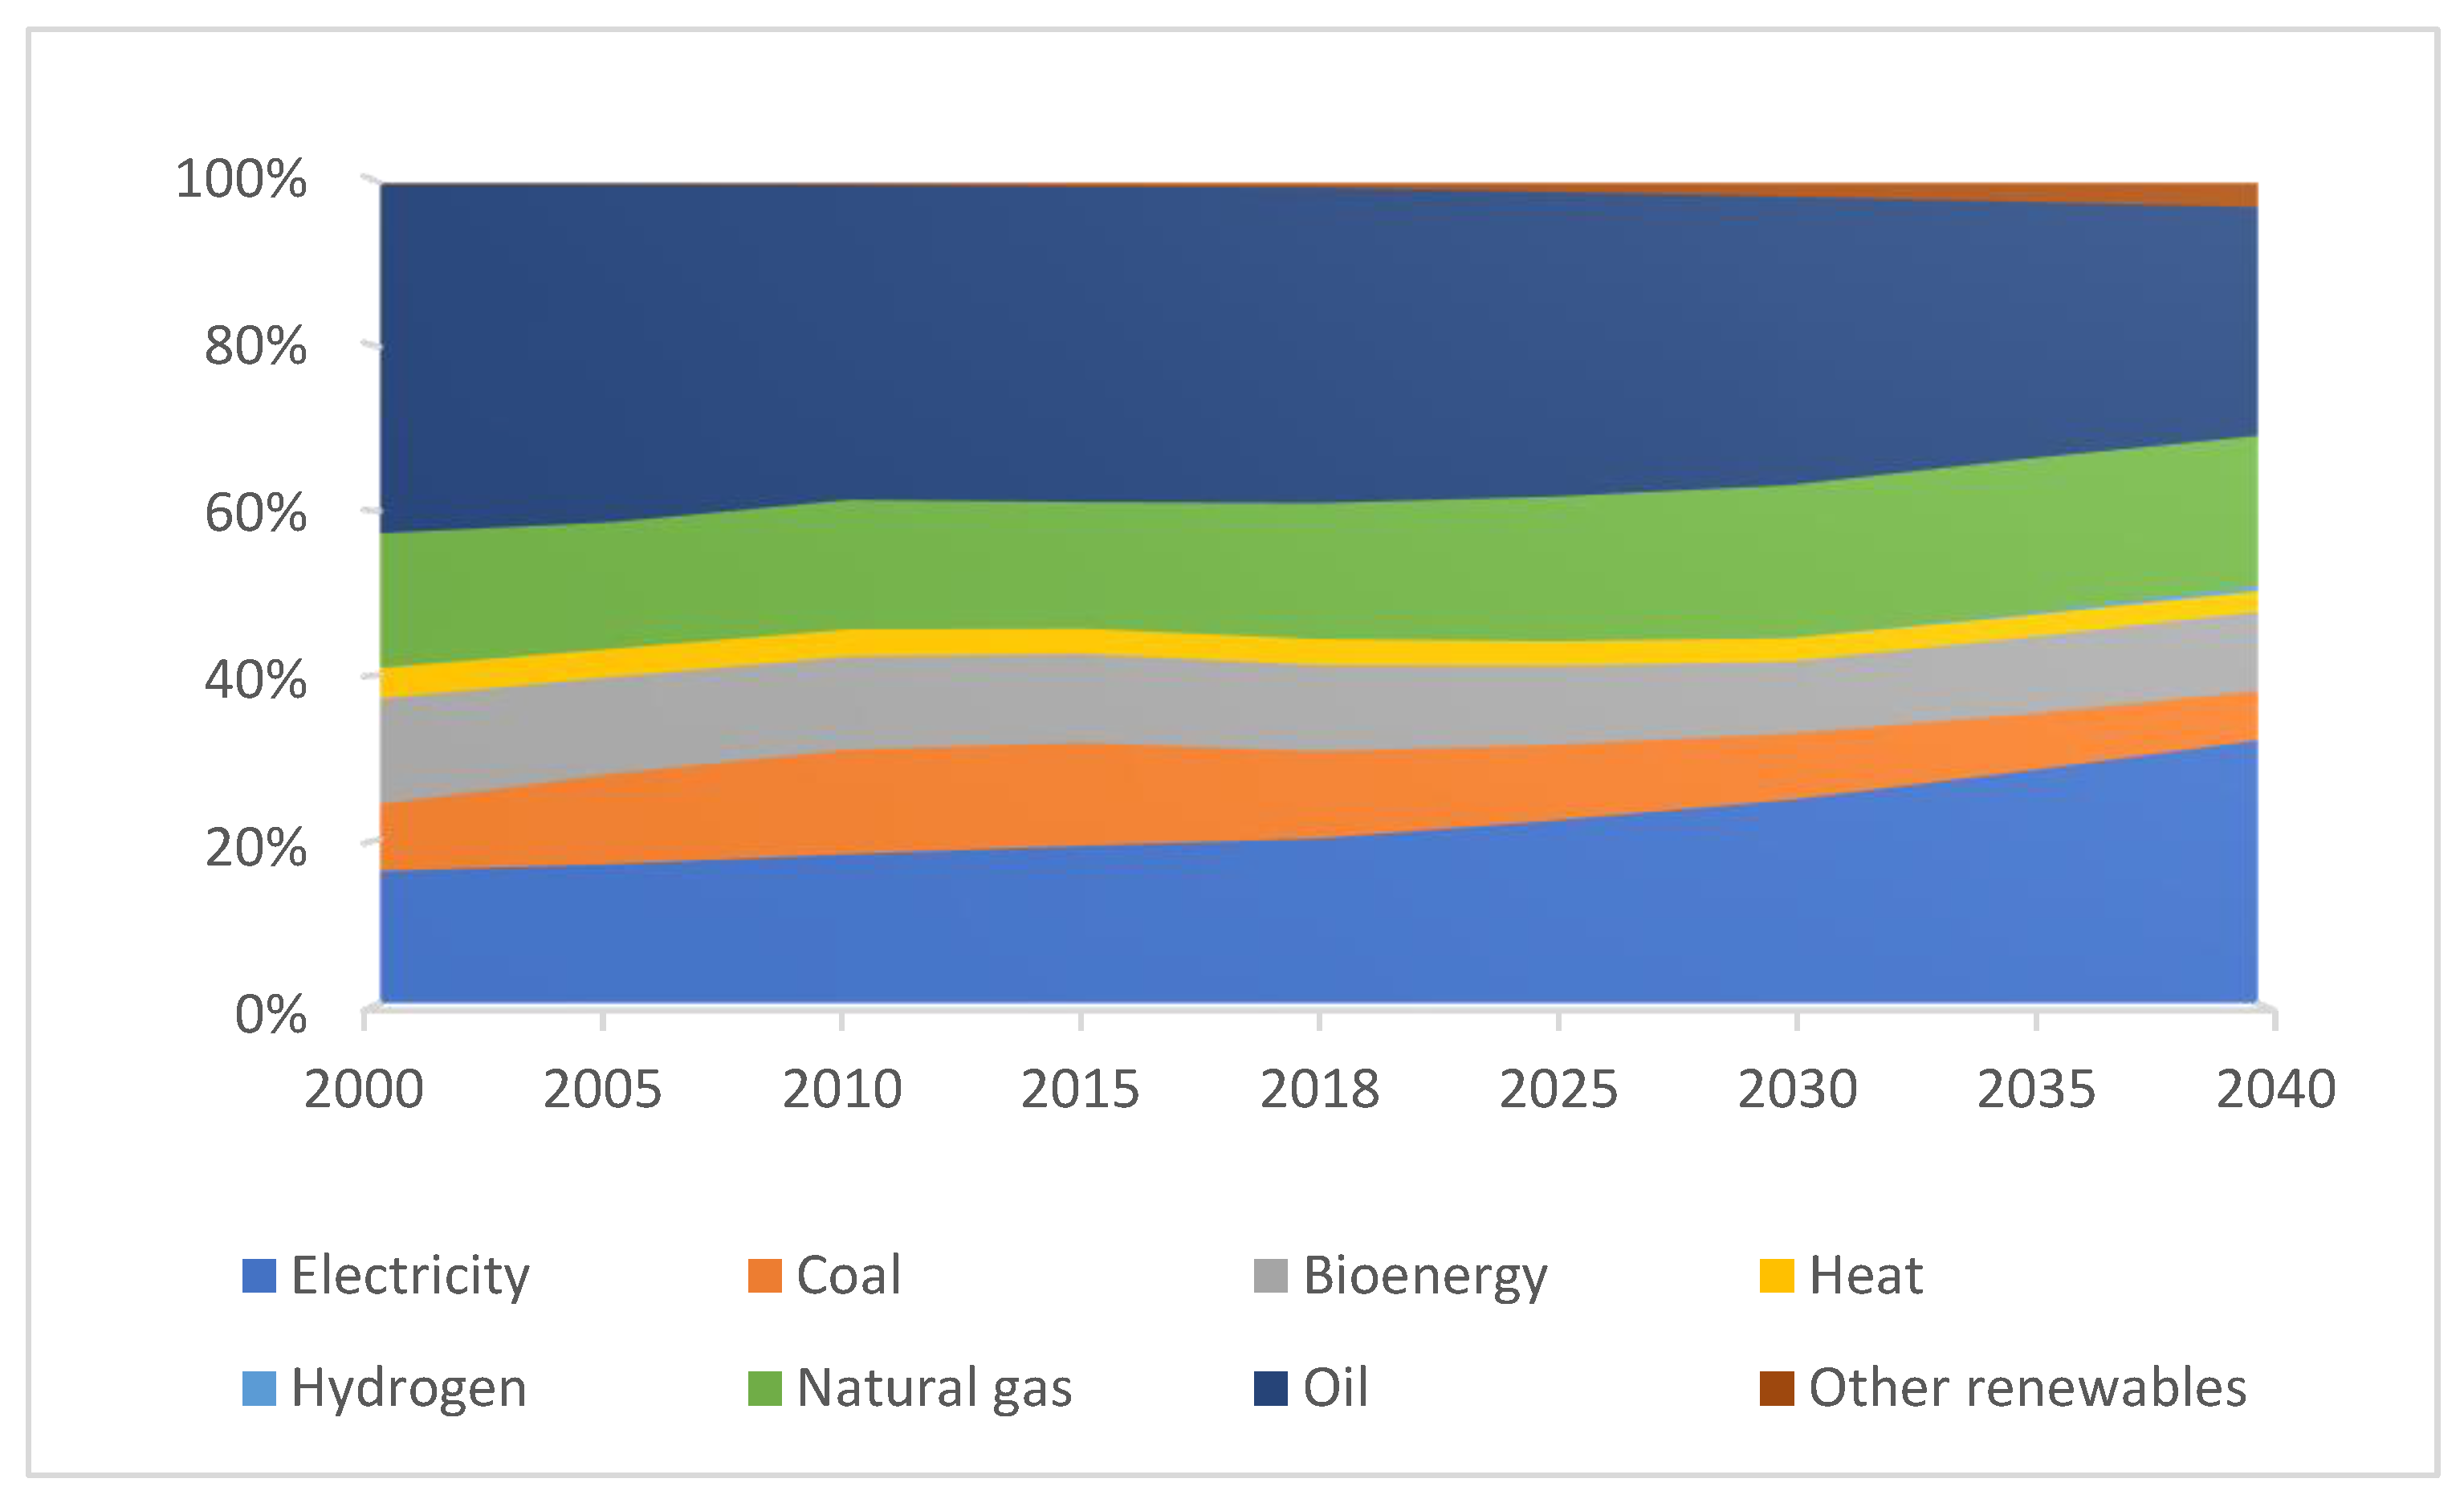
Figure 1. Share of global final energy consumption by fuel in the Sustainable Development Scenario, 2000–2040 [25].
Energies 15 08882 g001
Figure 2. Share of renewable electricity in 2011 and 2021 [29].
Energies 15 08882 g002
Figure 3. Evolution of renewable energy targets in European Union [50].
Energies 15 08882 g003
Figure 4. The research model.
Energies 15 08882 g004
Figure 5. Renewable electricity forecast. Source: own elaborations.
Energies 15 08882 g005
Figure 6. Status and evolution of electric vehicle model availability 2015–2021 [62].
Energies 15 08882 g006
Figure 7. Evolution of average driving range electric vehicle by powertrain 2010–2021 [62].
Energies 15 08882 g007
Figure 8. Additional electrical energy obtained from renewable sources until 2028. Source: own elaborations.
Energies 15 08882 g008
Figure 9. Excise duties in EU countries. Source: own elaboration. Data from [66,67].
Energies 15 08882 g009
Table 1. Renewable electricity produced in EU27 in TWh [56,57].
YearHydroWindSolarOther RenewablesTotal
1990301.51950.77050.011517.3430319.6445
1991315.57680.97100.013517.8698334.4311
1992329.21581.50200.022118.7209349.4608
1993335.17182.06740.028420.5868357.8544
1994344.25662.63460.029721.3220368.2430
1995346.64713.47050.038823.4366373.5929
1996350.53954.33900.040823.3871378.3064
1997353.61326.62590.049927.9160388.2051
1998367.473310.28740.059130.9709408.7908
1999367.246913.35300.069231.6421412.3112
2000379.102921.42260.057234.4540435.0367
2001401.998425.84860.173837.5481465.5689
2002345.681535.06650.291243.0938424.1330
2003335.721443.29690.441149.0716428.5310
2004355.268257.50400.722458.5947472.0893
2005340.547068.10631.476666.7623476.8922
2006342.709478.70952.526475.9177499.8631
2007338.891899.91233.826684.6918527.3225
2008354.8763113.23007.526594.2254569.8583
2009357.6626124.319714.2410103.1748599.3981
2010401.2794139.259723.3477117.3570681.2439
2011332.8492164.512346.6411125.2723669.2749
2012359.5532187.388470.2163139.5604756.7184
2013396.6519209.521783.4164146.5854836.1754
2014398.6117220.771591.9333152.7763864.0927
2015363.2407263.104598.8284157.9100883.0836
2016372.7115266.784199.0203159.7005898.2164
2017322.4639312.2943105.8617162.6998903.3198
2018370.2343320.6057112.5046164.3521967.6968
2019345.6435364.3421123.2669168.32451001.5771
2020374.5344397.3034143.2808170.01921085.1378
2021344.3512389.4972160.6203180.07871074.5474
Table 2. R-squared and applied model. Source: own elaborations.
SeriesHydroWindSolarOther Renewables
R-squaredN/A0.9950.9930.998
Forecasting modelARIMAExponential smoothingExponential smoothingExponential smoothing
Table 3. Forecast-renewable electricity produced in EU27 in TWh. Source: own elaborations.
YearHydroWindSolarOther RenewablesTotal
2022330.1959434.3775177.9599185.55561128.0890
2023330.1959457.5404195.2995193.19111176.2270
2024330.1959480.7032212.6391200.82651224.3649
2025330.1959503.8661229.9787208.46201272.5028
2026330.1959527.0290247.3183216.09741320.6407
2027330.1959550.1918264.6580223.73281368.7786
2028330.1959573.3547281.9976231.36831416.9165
Table 4. Growing estimate for renewable energies. Source: own elaborations.
YearElectricity from Hydro ShareElectricity from Wind ShareElectricity from Solar ShareOther Renewable Electricity ShareTotal Renewable Electricity Share
20218.80%9.96%4.11%4.60%27.47%
20287.17%12.48%6.14%5.04%30.83%
Table 5. Fuel consumption and equivalence in GWh for different engine types.
Engine TypeConsumption per 100 kmConversion Factor to Electric Engine (kWh/L)Fuel Consumption in EU * in 2021 (Thousand Tons)Equivalent Electricity Consumption (GWh)
Petrol6 L2.5 kWh/L68,934.952172,337.380
Diesel5 L3 kWh/L47,001.103141,003.310
Electric15 kWhn/an/an/a
* EU27 countries except Bulgaria, Greece, Ireland, and Slovakia.
Table 6. Fuel consumption in 2021 and corresponding taxes. Source: own elaborations.
CountryPetrol [50] (Tons)Diesel (Tons) EstimatedPetrol Taxes (Excluding VAT) EURDiesel Taxes (Excluding VAT) EURTotal Taxes (Excluding VAT) EUR
Austria1,440,3561,412,853694,251,592535,471,4441,229,723,036
Belgium2,020,5001,536,6521,212,300,000671,516,9951,883,816,995
Bulgaria533,136n/a193,528,368n/a193,528,368
Croatia445,262467,272229,309,930191,581,647420,891,577
Cyprus299,16065,207128,339,64023,996,200152,335,840
Czech Republic1,516,000823,925768,612,000327,098,2811,095,710,281
Denmark1,316,000467,300843,556,000219,630,8361,063,186,836
Estonia207,000113,151116,541,00047,184,004163,725,004
Finland1,481,000423,1611,067,801,000251,357,5871,319,158,587
France9,148,10210,165,3536,248,153,6665,367,306,48611,615,460,152
Germany19,215,0007,364,45812,585,825,0003,483,388,40816,069,213,408
Greece2,033,938n/a1,423,756,600n/a1,423,756,600
Hungary1,515,000587,645525,705,000187,458,703713,163,703
Ireland598,476n/a381,229,212n/a381,229,212
Italy7,237,8835,432,5395,269,178,8243,259,523,3528,528,702,176
Latvia169,472283,13886,261,248113,255,190199,516,438
Lithuania253,200548,572117,991,200204,068,693322,059,893
Luxembourg336,300312,558177,230,100129,399,022306,629,122
Malta75,87228,39727,238,0489,370,92336,608,971
Netherlands3,819,644455,7673,147,386,656281,208,1043,428,594,760
Poland4,876,9212,349,6621,750,814,639775,388,5072,526,203,146
Portugal963,2051,054,995643,420,940520,112,3691,163,533,309
Romania1,401,0001,057,859536,583,000371,308,674907,891,674
Slovakia553,011n/a284,247,654n/a284,247,654
Slovenia368,680310,508164,062,600115,509,021279,571,621
Spain5,188,2515,026,9952,614,878,5041,975,608,9274,590,487,431
Sweden1,922,583926,7531,291,975,776475,424,0591,767,399,835
EU2768,934,95241,214,71942,530,178,19719,536,167,43162,066,345,628
Publisher’s Note: MDPI stays neutral with regard to jurisdictional claims in published maps and institutional affiliations.