Article

Study on Carbon Emission Pathways in the Rural Areas of Guangdong Province

Key Laboratory of Renewable Energy, Guangzhou Institute of Energy Conversion, Chinese Academy of Sciences, Guangzhou 510640, China
*
Author to whom correspondence should be addressed.
Energies 2022, 15(23), 8886; https://doi.org/10.3390/en15238886
Submission received: 24 October 2022 / Revised: 17 November 2022 / Accepted: 22 November 2022 / Published: 24 November 2022
(This article belongs to the Special Issue Energy Economic Policy of Low Carbon City)

Abstract

:
In response to global warming, China has formulated the “double carbon” strategic goals of peaking carbon dioxide emissions before 2030 and reaching carbon neutrality before 2060. The problem of rural carbon emissions is often ignored due to underdeveloped industries and services. In this paper, the carbon emission pathways in the rural areas of Guangdong Province are investigated. Since energy consumption is the main source of carbon emissions, the factor analysis was used to analyze the main factors affecting rural household energy consumption and agricultural production energy consumption. Multiple linear regression was conducted to predict the rural energy consumption demand in Guangdong. Furthermore, the current situation and development trend of rural energy supply, demand and consumption structure, and the potential of renewable energy development were considered to predict carbon emissions in the rural areas of Guangdong. Moreover, the carbon emission pathways in the rural areas of Guangdong were discussed under two scenarios: the base scenario and the radical model.

1. Introduction

Guangdong Province is in the southernmost part of mainland China, and the territory is located between 20°09′~25°31′ north latitude and 109°45′~117°20′ east longitude. It is a major population and economic province in China, and economic development directly affects carbon emissions [1], so the study of its carbon emission is of great significance to the formulation of carbon emission standards [2,3]. According to the results of the 7th National Population Census, the rural population of Guangdong is 3,257,638, accounting for 25.85% of the province’s total population. Recently, as urbanization and modernization have accelerated, the total energy consumption in the rural areas of Guangdong has grown, and the gap between rural energy supply and demand has gradually increased. In the process of accelerating the construction of an ecological civilization system in Guangdong and developing a beautiful countryside, the role of rural energy is becoming increasingly significant. Currently, there are still problems of unreasonable structure, inadequate development and low efficiency in the rural energy consumption in Guangdong. Rural energy consumption is of strategic importance to the economic and social development of rural areas and the reduction of carbon emissions. The problems in the development and rural energy consumption in Guangdong should be clearly analyzed. A more reasonable mode of development and rural energy consumption should be developed.
By 2030, China will reduce carbon dioxide emissions per unit of GDP by more than 65 percent from the 2005 level, and the share of renewable energy in primary energy consumption will reach about 25 percent [4,5]. China usually uses 2021 as the reference starting year for carbon neutrality. For a net-zero CO2 emissions system, 60% of total energy needs to come from renewable sources [6]. The development of solar power generation in rural areas is an effective way to reduce carbon emissions [7]. To achieve carbon neutrality, technological breakthroughs, shifts in production and consumption patterns, and improved policies are urgently needed [8]. Energy consumption is the main effect leading to carbon emissions. From 2005 to 2016, China’s total carbon emissions accounted for nearly one-third of the world’s total carbon emissions, and the carbon emission intensity is generally higher than other countries in the world [9].
As shown in Figure 1, the basic framework of rural energy includes rural energy consumption (demand) and rural energy production (supply). Rural energy consumption primarily consists of household energy consumption, agriculture energy consumption and rural industrial energy consumption, of which household energy consumption includes cooking, lighting, cooling and heating. Agriculture energy consumption comprises energy for cultivation, farming and primary processing of agricultural products, etc. Rural industrial energy consumption involves electricity and heat consumption for industry and sideline industries in rural areas. The supply of energy in rural areas includes both external commercial energy input and internal energy development in rural areas. The internal rural energy development contains both the development of new biomass energy (such as fuel ethanol, biodiesel and formed fuel), renewable energy (such as hydro, wind, solar and geothermal energy) and traditional biomass energy (such as fuelwood and direct use of straw). Moreover, there is a distinction between commercial and non-commercial energy sources within rural areas, and even the same energy source may exist both as a commercial and non-commercial energy source, such as biogas and solar energy.
The impact of rural economic development level, agricultural mechanization level and rural infrastructure construction level on high-quality straw energy use is explored [10]. Zhang reviewed household energy in rural areas [11], while there is a lack of analysis of the production of energy. Li analyzed the transition from non-commercial to commercial energy in rural China [12]. At present, the proportion of non-commodity energy in rural areas is already very low, mainly fossil fuels and electricity. More attention should pay to commercial energy.
With rural energy as an integral part of China’s overall energy system, its development is inevitably affecting the situation of energy supply and demand in China. Rural energy plays an essential role in improving the quality of life in rural areas, rural economies and rural environmental and infrastructure conditions.

2. Energy Supply and Demand in Guangdong

2.1. Rural Energy Production and Consumption in Guangdong

The main sources of energy production in rural areas are renewable energy, such as biomass, wind, photovoltaic and hydropower. While agricultural straw, livestock manure and other biomass resources are plentiful in Guangdong, approximately 60% of agricultural straw is casually discarded or directly burned each year, and only 15% to 20% of straw is used for biomass energy [7,8].
Due to the lack of statistical data on non-commercial energy, only commercial energy was considered in this study. Rural energy consumption mainly consists of three major components: household energy consumption, agriculture production energy consumption, and electricity consumption for rural industries and sidelines.
The proportion of household energy consumption, agriculture production energy consumption and electricity consumption for rural industrial and sideline can be seen in Figure 2b. Household energy consumption accounts for 50% of the total rural energy consumption. The electricity consumption in the rural industrial and sideline industries accounts for approximately 30% of the total rural energy consumption. Agriculture production energy consumption accounts for approximately 20% of the total rural energy consumption.
The energy consumption in the rural areas of Guangdong has grown steadily, from 3.49 million tce in 1990 to 38.66 million tce in 2019, representing an increase of more than 11 times. Among them, household energy consumption and rural industrial and sideline electricity consumption have grown rapidly. Household energy consumption increased from 1.559 million tce in 1990 to 20.348 million tce in 2019, representing an increase of 13 times. The electricity consumption for rural industrial and sideline grew from 1.305 million tce in 1995 to 12.130 million tce in 2019, representing an increase of more than nine times. The production energy consumption is relatively stable, with an annual energy consumption between three and six million tce (Figure 2b). The results indicated that household energy consumption is the main body of rural energy consumption. This result is consistent with the results that household carbon emission is the major part of total carbon emission in rural areas [15]. The major types of rural household energy consumption in Guangdong are petrol, liquefied petroleum gas, electricity and others (heat energy from coal power, with coal power efficiency at 42%). This is followed by small quantities of diesel and very small quantities of kerosene, raw coal and coal products (Figure 3a).
The major types of rural import energy consumption in Guangdong are diesel, electricity and other (Heat energy from coal power, with coal-fired power and electricity efficiency at 42%), followed by a small amount of raw coal and gasoline (Figure 3b).

2.2. Forecasting Methods of Rural Energy Consumption in Guangdong

Since energy consumption directly affects carbon emissions, energy consumption must first be predicted to predict carbon emissions. There are many factors affecting rural energy consumption, so correlation analysis is used to analyze the influence degree of each factor on energy consumption. According to the analysis of rural household energy consumption data in Guangdong over the past 20 years (2000–2019), there is a significant negative correlation between rural household energy consumption and population size in Guangdong. This is mainly because the rural population is decreasing year by year, but the total amount of energy consumption is increasing year by year. There is a significant positive correlation between energy consumption per capita, disposable income per capita, number of household appliances, vehicles and water heaters, which is mainly due to the increase in rural living standards.
As population changes always have a greater impact on carbon emissions than population density [17], and carbon emissions are related to energy consumption, so the population is chosen as a major factor affecting energy consumption. The level of economic development is also one of the factors affecting carbon emissions, so the rural per capita was considered in the forecasting methods. According to the rural population and rural per capita disposable income in Guangdong, combined with multiple linear stepwise regression analyses, the rural household energy consumption in Guangdong is forecasted.
Through correlation analysis, the key factors affecting energy consumption can be found, and irrelevant factors can be eliminated. Therefore, to accurately predict the trend of energy consumption, it is necessary to carry out a correlation analysis on its influencing factors.
Using rural household energy consumption in Guangdong as the dependent variable and the number of populations, per capita energy consumption, per capita disposable income, the number of household appliances, vehicles and water heaters as independent variables, a linear regression analysis was conducted. It was found that there were strong covariance issues with energy consumption per capita, disposable income per capita, number of household appliances, vehicles and number of water heaters, etc. The detailed results of the correlation analysis are listed in Table 1.
Although there are many factors affecting household energy consumption, some of these factors are collinearity. The collinearity must be eliminated. Through the analysis of the relationship between the factors, the key influencing factors of life energy were obtained. The collinearity of the above influence factors was eliminated by stepwise regression analysis, and a significance test was performed. The covariance was eliminated by stepwise regression analysis, and significance tests were conducted, and the results are shown in Figure 4. The ANOVA means the analysis of variance in Figure 4.
The regression results indicate that the regression equation fits well and is statistically significant and that household energy consumption in Guangdong can be expressed linearly in terms of rural population size and disposable income per capita:
E = 0.105 × N + 0.095 × M + 671.85
where E represents the total amount of rural household energy consumption in a million tce, N represents the number of rural populations in 10,000 people, and M represents the per capita disposable income in Yuan.
The rural population and per capita disposable income in 2030 will be 29.95 million and 34,000 Yuan, respectively, and the rural population and per capita disposable income in 2060 will be 25.6 million and 53,500 Yuan, respectively. The data on the rural population and per capita disposable income is forecasted by the 14th Five-Year Plan of National Economic and Social Development of Guangdong and the Outline of Vision for 2035 and Rural Development Institute, the China Social Sciences Press and the Think Tank for Urban-Rural Development of the Chinese Academy of Social Sciences.
The results of the analysis of rural agriculture production energy consumption data in Guangdong over the past 20 years (2000–2019) indicate that there is a significant positive correlation between rural agriculture production energy consumption and effective irrigated area, total rural machinery power, vegetable cultivation area, fruit garden area, tea garden area and the total output value of agriculture, forestry, livestock and fishery in Guangdong, while there is a significant negative correlation with the people employed in the primary sector, agricultural sown area and total fishery area. The results of the correlation analysis are shown in Table 2.
As shown in Table 2, there is a strong correlation between many factors. The rural mechanical power and the gross output value of agriculture, forestry, livestock and fishery have a strong collinearity relationship with most factors. The collinearity of the above influence factors was eliminated by stepwise regression analysis, and a significance test was performed. The covariance was eliminated by stepwise regression analysis, and significance tests were conducted, and the results are shown in Figure 5.
Using rural agriculture production energy consumption in Guangdong as the dependent variable, the rural mechanical power and the gross output value of the agriculture, forestry, livestock and fishery chose as the independent variable. The regression results indicate that the regression equation fits well and is statistically significant and that the rural energy consumption in Guangdong can be linearly expressed in terms of the total power of agricultural machinery and the total output value of agriculture, forestry, livestock and fishery:
E p = 0.104 × P + 0.066 × T + 422.07
where Ep represents the total energy used for agriculture production in a million tce, P represents the total power of agricultural machinery in a million kW, and T represents the total output value of agriculture, forestry, livestock and fishery in billion Yuan.
Based on the data on the total power of agricultural machinery and the total output value of agriculture, forestry, livestock, and fishery in Guangdong, the total energy consumption of rural agriculture production in Guangdong can be forecasted.
According to the “Implementation Suggestions of the Guangdong Provincial People’s Government on Accelerating the Transformation and Upgrading of Agricultural Mechanization and Agricultural Equipment Industry” (Guangdong Provincial Government Letter [2019] No. 428), it is suggested that, by 2025, the total power of agricultural machinery in the province will exceed 26 million kW. The integrated agricultural mechanization rate will reach 76%.
Although predictions up to 40 years in length may lead to inaccurate predictions because the model’s results are highly consistent with historical data, in the absence of major social changes, the model can be used to predict future data. The results in Figure 6a indicate that by 2030, the number of rural populations in Guangdong will be 29.95 million, and the urbanization rate of the resident population will reach 77.15%. The per capita disposable income in rural areas will be approximately RMB 40,000, which is twice as much as the per capita disposable income in 2020. The total household energy consumption will reach 35.87 million tce, which is 1.6 times the household energy consumption in 2020. By 2060, the number of rural people in Guangdong will be 25.6 million, and the urbanization rate of the resident population will be 84.25%. The per capita disposable income in rural areas will be approximately 53,500 Yuan. The total amount of household energy consumption will reach 54.855 million tce, which is 1.53 times the amount of household energy consumption in 2030.
The urbanization process, rural population data and disposable income of people in Guangdong, as forecasted by the 14th Five-Year Plan of National Economic and Social Development of Guangdong and the Outline of Vision for 2035 and Rural Development Institute. According to the “Implementation Suggestions of the Guangdong Provincial People’s Government on Accelerating the Transformation and Upgrading of Agricultural Mechanization and Agricultural Equipment Industry” (Guangdong Provincial Government Letter [2019] No. 428). By 2025, the total power of agricultural machinery in the province will exceed 26 million kW, and the integrated mechanization rate of cultivation, seeding and harvesting of major crops will reach 76%.
According to the total power of agricultural machinery and the total output value of agriculture, forestry, livestock and fishery in Guangdong, combining multiple linear stepwise regression analyses to predict the agriculture energy consumption in Guangdong is shown in Figure 6b. By 2030, it is expected that the total power of agricultural machinery in Guangdong will be 27.3 million kW, the total output value of agriculture, forestry, livestock and fishery will be 1315 billion Yuan, and the total rural energy consumption for production in Guangdong will reach 10.06 million tce. By 2060, the total power of agricultural machinery in Guangdong will be 29.05 million kW, the total output value of agriculture, forestry, livestock and fishery will be 2030 billion Yuan, and the total agriculture energy consumption in the rural areas of Guangdong will reach 14.6 million tce.

3. Development Status and Forecast of Rural Renewable Energy in Guangdong

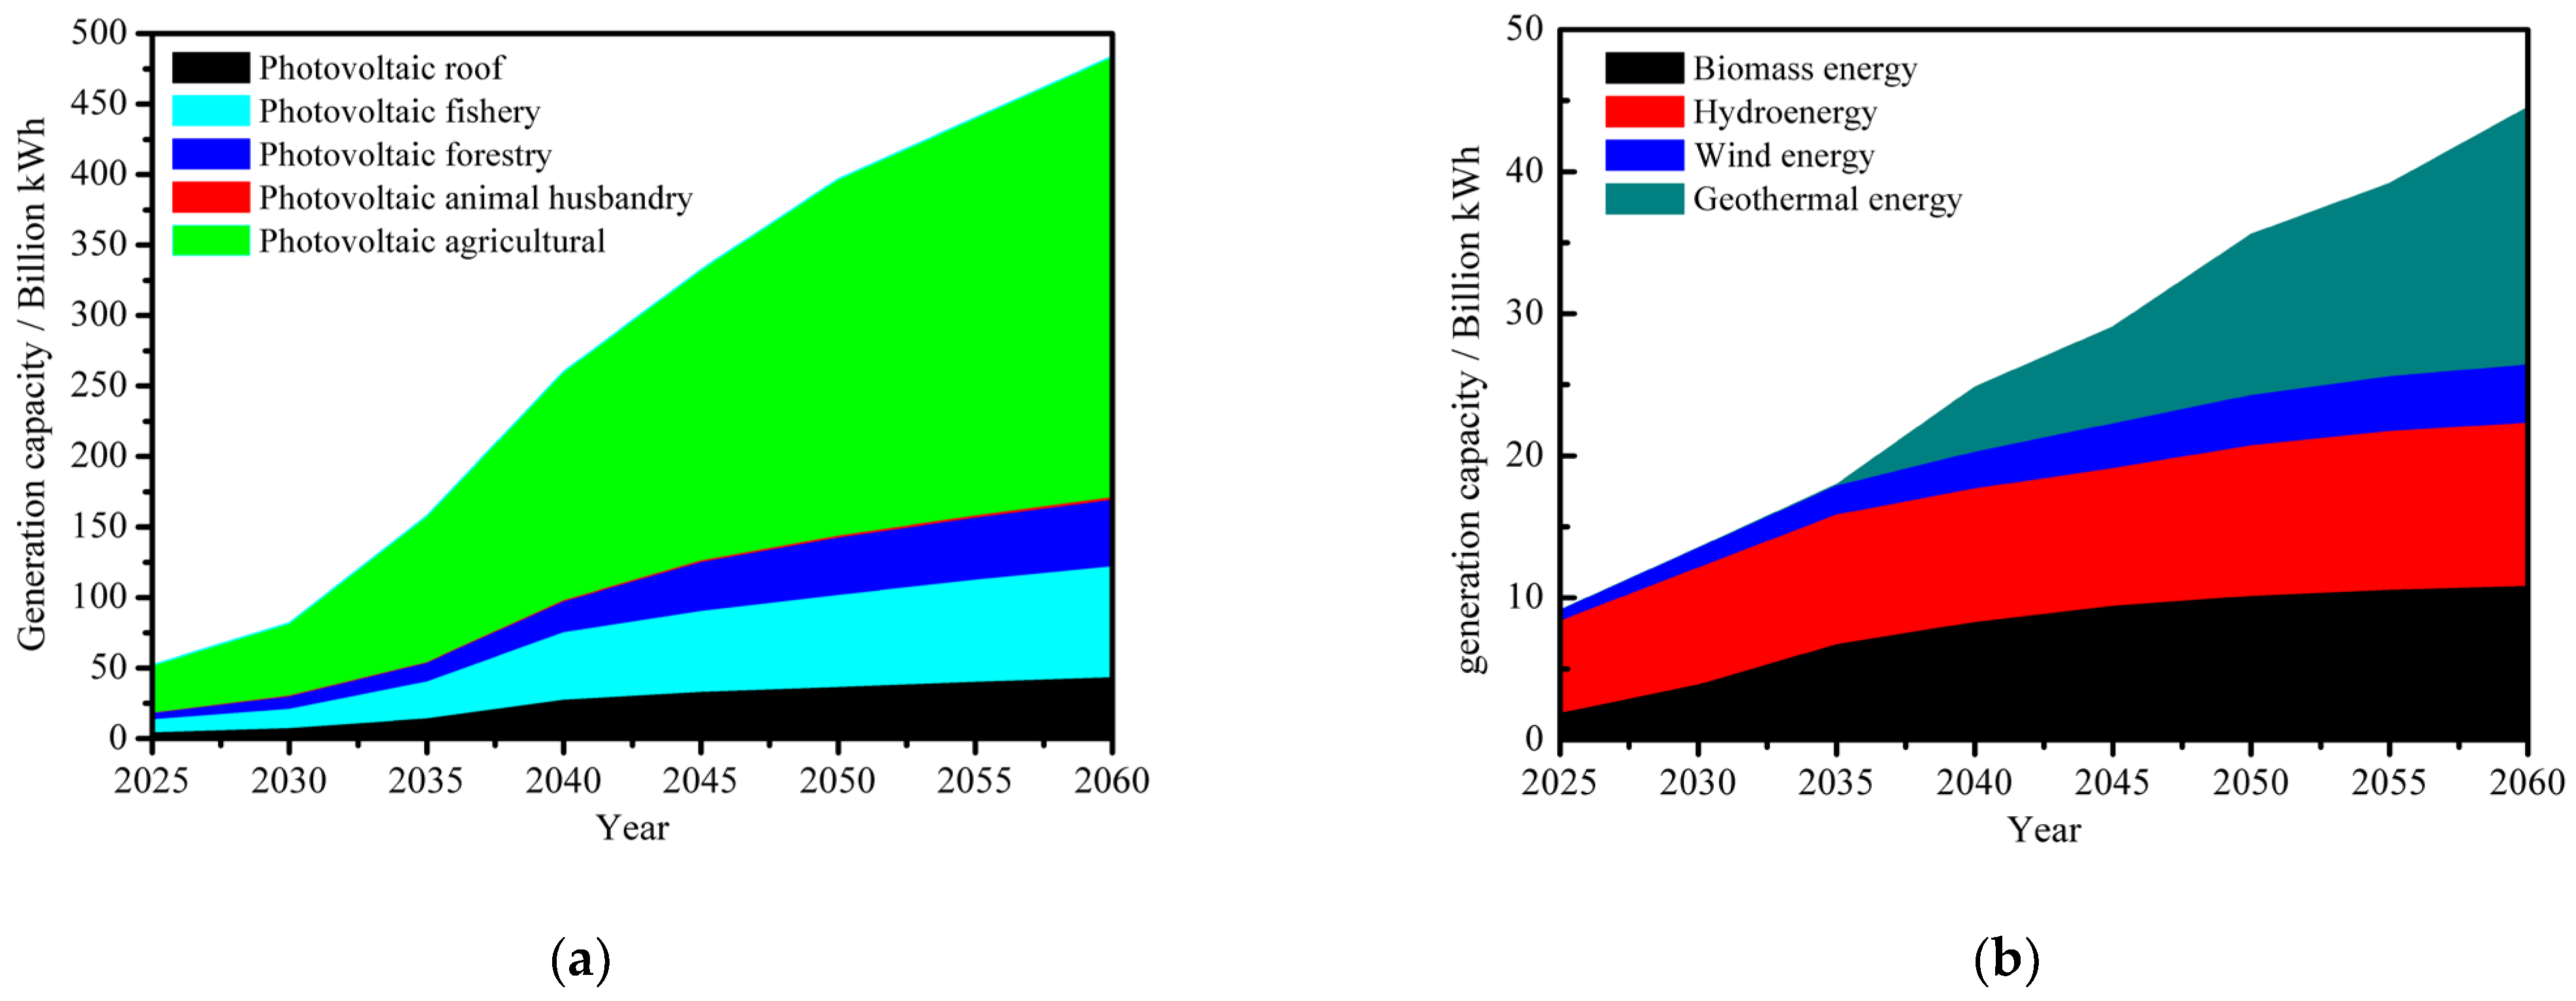
3.1. Development Potential of Renewable Energy

The development potential of renewable energy represents the theoretical maximum exploitable amount of renewable energy. In theory, the development potential of wind power in Guangdong is 31.88 million kW, with a technically exploitable capacity of 2.46 million kW and a potential technically exploitable capacity of 130,000 kW. The solar energy resources of Guangdong are relatively abundant in China, with about 2200 h of annual irradiation and total annual radiation of 4200–5800 MJ/m2. The total annual solar radiation in Guangdong is 2.66 × 10¹⁴ MJ. Biomass resources are abundant in rural areas of Guangdong. If the agricultural straw was used for direct-fired power generation in 2019, it could produce 50 kWh of electricity per ton of straw. Theoretically, the total amount of straw resources in Guangdong can generate 12.01 billion kWh of electricity, which can be converted into 4.852 million tce. Forestry waste can be used to produce biomass pellets, which can replace 4.55 million tce per year. Livestock waste can be used to produce biogas, which can theoretically produce 2.911 billion m3 of biogas and 1.455 billion m3 of purified biogas.
Guangdong is located on the Pacific Rim Geotropic, with multiple fracture zones in its geological structure and abundant geothermal resources. However, the current high cost and low efficiency of medium- to low-temperature geothermal water for power generation makes it unsuitable for large-scale commercial promotion. As the technology of geothermal power generation from hot, dry rock matures, and its application is promoted in the future, the amount of geothermal energy generation will increase rapidly. Guangdong has a wide distribution of medium- and low-temperature geothermal resources, with a total resource storage area of 1460 km2. Medium- and low-temperature geothermal resources can theoretically be installed with 260 MW, and the average annual power generation time of geothermal power generation is 4500–6000 h, with a potential of 1.17–1.56 billion kWh of geothermal power generation.
Guangdong is abundant in hydropower resources, with a theoretical water resource reserve of 10,728,300 kW. Currently, the developed capacity is 7,776,000 kW, generating 23.95 billion kWh of electricity. In terms of the development progress of Guangdong’s rural hydropower, the developed capacity accounts for 71.5%, which indicates that there is no remaining potential for the development of Guangdong’s rural hydropower.

3.2. Forecasting Methods of Rural Energy Supply in Guangdong

Now, the supply of energy in rural areas of Guangdong is dominated by fossil fuels, which include raw coal, coal products, petrol, diesel, kerosene and LPG (Liquefied Petroleum Gas), and the consumption of LPG and petrol is increasing. Under the constraints of the “peak carbon dioxide emission” and “carbon neutrality” targets, the consumption of fossil energy in the rural areas of Guangdong will be gradually reduced and eventually replaced by renewable energy products.
Most areas in Guangdong are relatively abundant in solar energy resources, and under the conditions of the “peak carbon dioxide emission” and “carbon neutrality” policy constraint, large-scale development of solar energy is the primary choice. It is expected that the solar industry will experience a rapid and steady development process from now until the middle of this century. According to the solar energy technology development path and economic forecasts, the development of solar power in the rural areas of Guangdong is forecasted as shown in Figure 7a. Based on the classification of solar energy development potential, the greatest potential for solar energy development is in the agriculture and solar energy complementary (plantation) industry, followed by the fishing industry. Solar photovoltaic power generation can be calculated by Equation (3):
E s = G t C G s K p
where Gt is the total solar radiation of the horizontal plane in Guangdong province of 1275.6 kWh/m2, C(kW) is the photovoltaic capacity calculated based on the installable photovoltaic area and the type of the photovoltaic cells, K is system correction factor range of 79–82%, p is the proportion of developed solar energy resources to the total solar resources that increases with time according to the energy needs of rural areas.
By 2030, agricultural solar photovoltaic power generation is expected to reach 42.5 billion kWh, forest solar photovoltaic power generation will reach 7.4 billion kWh, livestock solar photovoltaic power generation on livestock rooftops will reach 400 million kWh, fishery solar photovoltaic power generation will reach 11.1 billion kWh and solar photovoltaic power generation on rural residential rooftops will be 5.6 billion kWh. By 2060, the agricultural solar photovoltaic power generation is expected to reach 271.4 billion kWh, forest solar photovoltaic power generation will reach 38.9 billion kWh, livestock solar photovoltaic power generation on livestock rooftops will be 1.5 billion kWh, fishery solar photovoltaic power generation will be 64.8 billion kWh and solar photovoltaic power generation on rural residents’ rooftops will be 35.4 billion kWh.
Renewable energy generation is calculated according to the renewable energy development potential of Guangdong Province and Equations (4)–(6).
The calculation formula for agricultural straw power generation Estraw (kWh) is as follows:
E s t r a w = m s t r a w K s t r a w p s t r a w
where mstraw is the total amount of agricultural straw in tons, Kstraw is the straw power generation coefficient. As each ton of straw can produce 0.5 MWh of electricity, so the Kstraw is 0.5 MWh/t. pstraw is the proportion of electricity generated from agricultural straw in total exploitable capacity.
The calculation formula for wind power generation Ewind (kWh) is as follows:
E w i n d = C w i n d t w i n d p w i n d
where Cwind is installed capacity of wind power generation, twind is wind power generation time. Guangdong Province is not very rich in wind resources, so the annual power generation hours are 1700. twind is 1700 h/year in Guangdong. pwind is the proportion of developed wind power in total resources.
The calculation formula for geothermal power generation Egeo (kWh) is as follows:
E g e o = C g e o t g e o p g e o
where Cgeo is the Installed capacity of geothermal energy generation, tgeo is geothermal energy generation time, which is 4500 h/year in Guangdong, pgeo is the proportion of developed geothermal energy in total resources.
The future of rural biomass, hydropower, wind power and geothermal energy generation in Guangdong is shown in Figure 7b. Due to the limitation of the total land-based wind resources in Guangdong, wind power generation accounts for a relatively small amount. Currently, the extent of hydropower resource development in Guangdong has exceeded 70%, and hydropower development is close to saturation, which will not lead to a significant increase in hydropower generation in the future. With the development and promotion of hot, dry rock technology (enhanced geothermal technology), it is expected that the amount of geothermal power generation will gradually increase after 2035. With abundant biomass resources in Guangdong, biomass natural gas and biomass power generation technologies are in the development stage, and it is expected that biomass utilization will tend to develop in scale after 2030.

4. Analysis of the “Peak Carbon Dioxide Emission” and “Carbon Neutrality” Pathways in the Rural Areas of Guangdong

In terms of whole life cycle considerations, non-fossil energy sources are not 100% zero greenhouse gas emissions. Based on the results of household and international analyses of whole life cycle carbon emissions, the carbon emissions of various energy sources are valued within a certain range depending on technical, operational and management factors [18,19,20]. Coal-fired thermal power generation is in the range of 950–1300 g/kWh, natural gas power generation is in the range of approximately 622–688 g/kWh, non-fossil energy sources such as hydropower have carbon emissions in the range of 14–150 g/kWh, geothermal, solar power and wind power are at a maximum of 80 g/kWh, biomass power generation is in the range of 16–74 g/kWh and the smallest carbon emissions are from nuclear power at approximately 17–21 g/kWh. Increasing the share of renewable energy can significantly reduce CO2 emissions. The carbon emissions of the kerosene, LPG, coal, gasoline, diesel oil and electric energy production are listed in Table 3.
The conversion factors from physical units to coal equivalent are listed in Table 4.

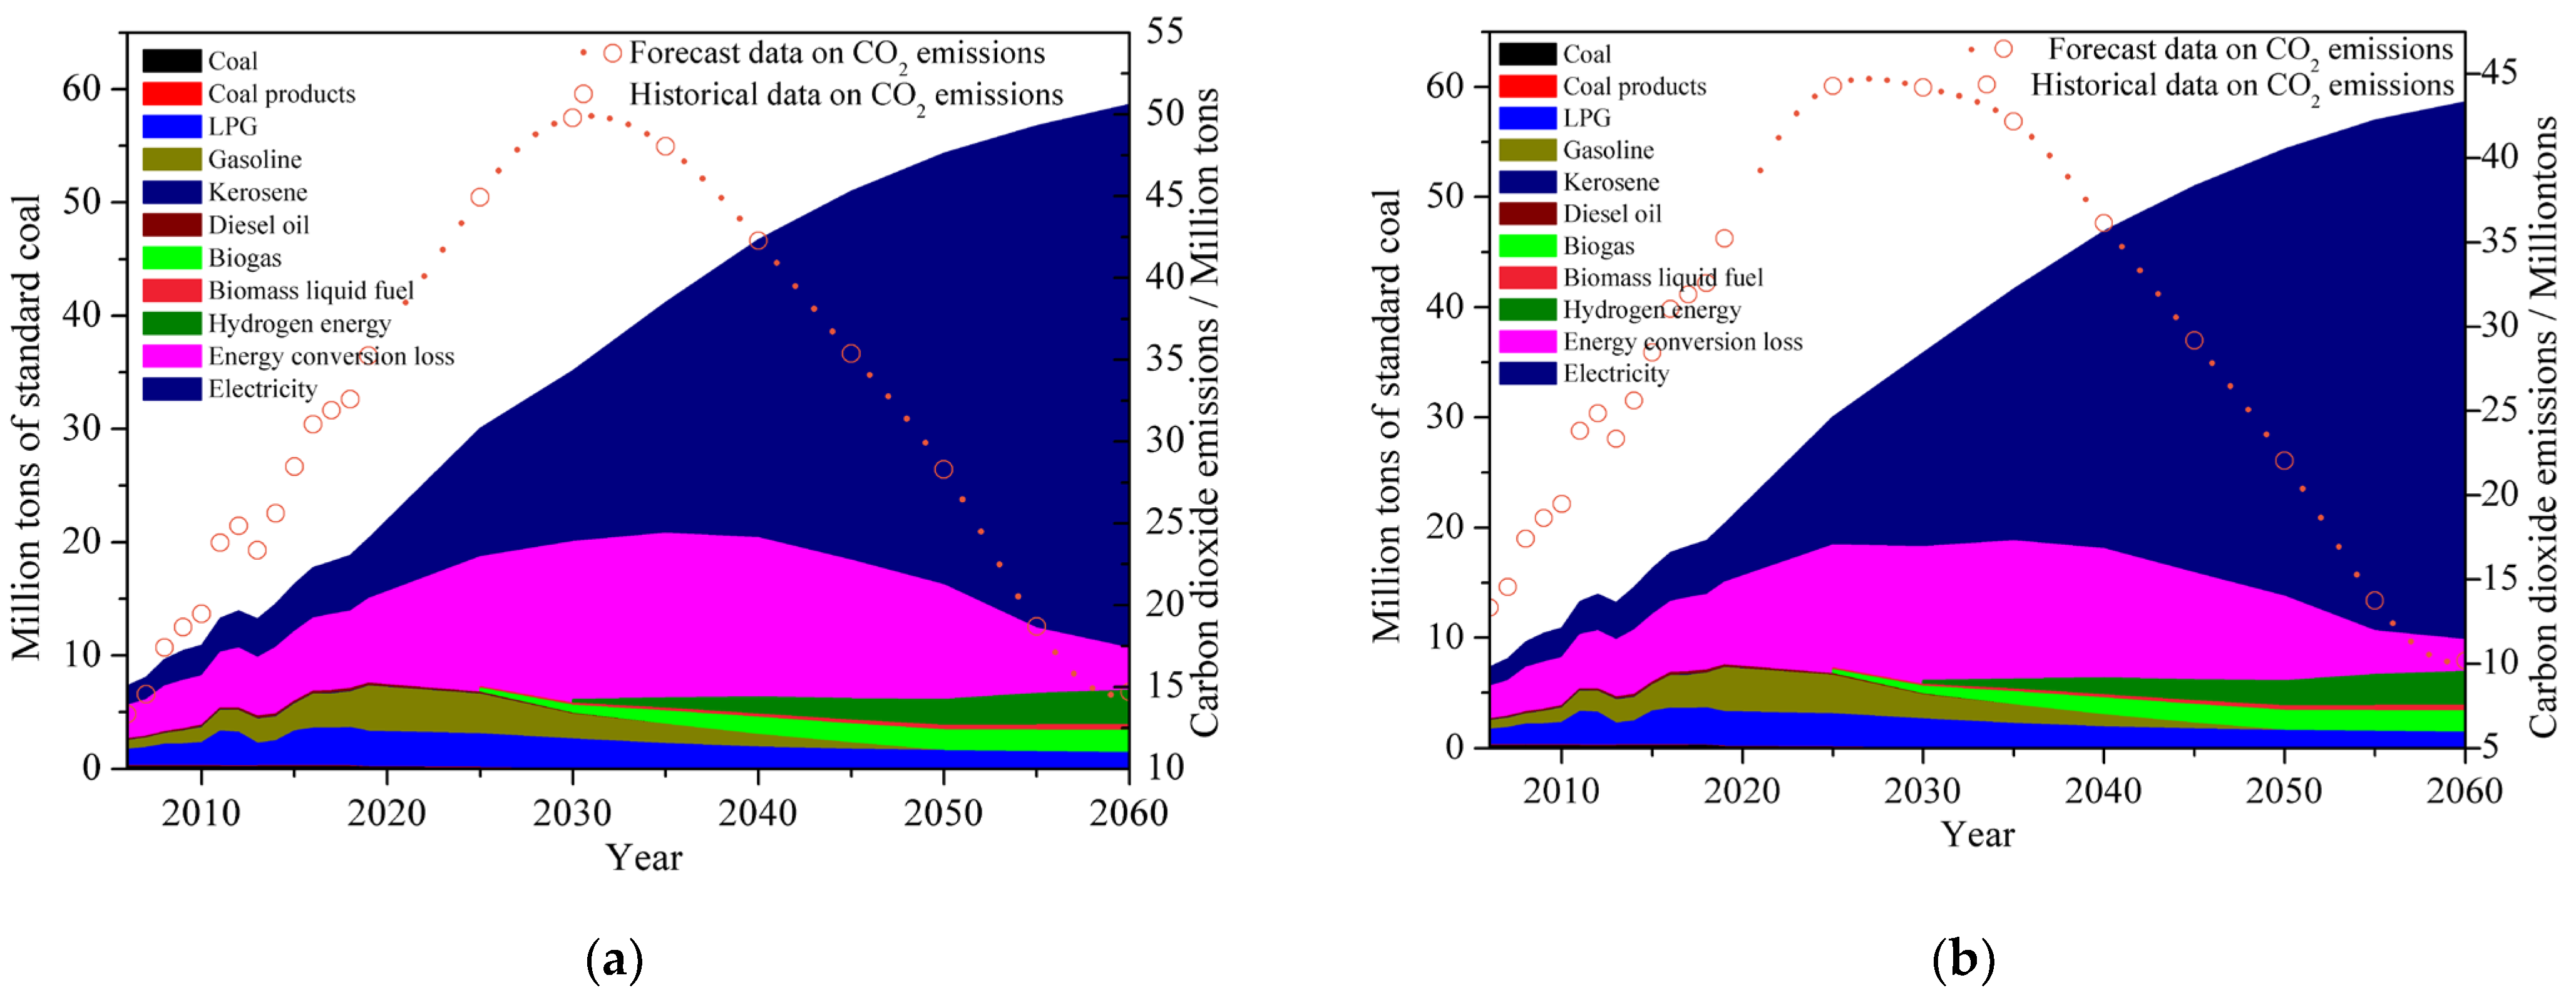
4.1. Analysis of the “Peak Carbon Dioxide Emission” and “Carbon Neutrality” Pathways for Rural Household Energy Consumption

This paper has designed two scenarios of carbon emission trends in the rural areas of Guangdong based on forecasts of total energy consumption, energy mix and renewable energy development. In the baseline scenario, there are no major changes in the existing energy policy and market environment, and the “peak carbon dioxide emission” and “carbon neutrality” policy is used as a guideline for rural energy development. In the radical scenario, the pressure to reduce carbon emissions is greater, and the new energy market is more aggressive, which requires the development of renewable energy at the expense of economic efficiency to achieve the goal of “peak carbon dioxide emission” in advance. The carbon dioxide emission is calculated by Equation (7):
m C O 2 = i = 1 n m i X i
where mi is the energy consumption based on the historical data and forecast data, Xi is the corresponding carbon dioxide emission [21]. The energy consumption is converted into standard coal to calculate rural household energy use.
The rural household energy use structure and carbon emission forecast under the base scenario are shown in Figure 8a. After 2025, fossil energy sources such as raw coal, coal products, gasoline and diesel will be gradually replaced by biomass liquid fuels, biogas and hydrogen energy. LPG will still account for a certain proportion of rural household energy use in the future, as rural bio-natural production in Guangdong is not enough to fully replace LPG. As renewable energy generation technologies are developed and promoted in the future, electricity will dominate rural household energy use. By 2030 and 2060, rural renewable energy generation in Guangdong will account for 50.1% and 92.5% of total electricity generation, respectively. By 2030 and 2060, the total CO2 emissions are expected to reach 49.785 million t and 14.704 million t, respectively. In comparison with other renewable energy sources, solar photovoltaic power generation has great potential and accounts for the largest share of power generation. By increasing the development of solar energy resources in the rural areas of Guangdong and increasing rural solar photovoltaic power generation, the carbon emission reduction effect can be increased, and the carbon peak for rural household energy use in Guangdong can be achieved in advance. Under the radical model, the structure of rural household energy use and carbon emissions are projected as shown in Figure 8b, with total carbon dioxide emissions expected to reach 44.187 million t and 10.182 million t in 2030 and 2060, respectively.
Rural household energy use structure and carbon emission from China Energy Statistical Yearbook (2007–2020) [14] and model calculation from the State Grid Energy Research Institute. Energy consumption is targeted to reach a carbon peak by 2030 and to be carbon neutral by 2060. Each energy consumption forecast is based on trends in energy consumption and energy technology. The calculation of carbon emissions is based on Equation (7);
The forecasted carbon emission from rural household energy use in Guangdong is shown in Figure 9. At the “peak carbon dioxide emission”, the total CO2 emissions of the base scenario and the radical model are estimated to be 49.785 million t and 44.702 million t, respectively, and the peak carbon dioxide emission under the radical model is 5.083 million t lower than that of the base scenario. At the “carbon neutral”, the total CO2 emission of the base scenario and the radical model is estimated to be 14.704 million t and 10.182 million t, respectively, and the carbon emission under the radical model is 4.522 million t lower than that of the base scenario. The carbon emission in the radical model is reduced by 452.2 million t compared to the base scenario.

4.2. Analysis of the “Peak Carbon Dioxide Emission” and “Carbon Neutrality” Pathways for Rural Energy Production

The structure of energy consumption and carbon emissions for rural agriculture production under the base scenario is forecasted in Figure 10a. After 2025, fossil energy sources such as raw coal, petrol and diesel will be replaced by biomass liquid fuels, biogas and hydrogen. By 2030 and 2060, the total CO2 emissions are expected to reach 13.652 million t and 7.704 million t, respectively.
In comparison with other renewable energy sources, solar photovoltaic power generation has great potential and accounts for the largest share of power generation. Increasing the development of solar energy resources in the rural areas of Guangdong and increasing rural solar photovoltaic power generation can enhance the carbon emission reduction effect and achieve the peak carbon dioxide emissions of rural production energy consumption in Guangdong in advance. The structure of rural production energy consumption and carbon emission forecast under the radical model is shown in Figure 10b. The peak carbon dioxide emissions are expected to reach 12.803 million t in 2028 and 5.417 million t in 2060.
Rural production energy consumption structure and carbon emissions, Energy consumption is targeted to reach a carbon peak by 2030 and to be carbon neutral by 2060. Each energy consumption forecast is based on trends in energy consumption and energy technology. The calculation of carbon emissions is based on Equation (7);
The comparative carbon emissions from rural agriculture energy consumption under different models are shown in Figure 11. At peak carbon dioxide emissions, the total CO2 emissions from rural agriculture energy production in the base scenario and the radical model reach 13.652 million t and 12.803 million t, respectively, while at carbon neutrality, the total CO2 emissions are 7.704 million t and 5.417 million t. At peak, carbon dioxide emissions in the radical model are 849,000 t lower than those in the base scenario, while at carbon neutrality, carbon emissions in the radical model are 1.587 million t lower than those in the base scenario.

5. Conclusions

In this paper, the carbon emission pathways in the rural areas of Guangdong province are forecasted. The main factors affecting rural household energy consumption and agricultural production energy consumption are investigated. The development potential and supply forecast of rural renewable energy are studied. The main conclusions are listed below:
1. In the base scenario, rural renewable energy generation accounts for 50.1% and 92.5% of total electricity generation in Guangdong in 2030 and 2060, respectively. In the radical model, rural renewable energy generation in Guangdong accounts for 56.5% and 95.5% of total electricity generation by 2030 and 2060, respectively. Electricity will dominate rural energy consumption.
2. By 2030, the solar photovoltaic power generation of agricultural, forest, livestock on livestock rooftops, fishery and rural residential rooftops are expected to reach 42.5 billion kWh, 7.4 billion kWh, 400 million kWh, 11.1 billion kWh and 5.6 billion kWh, respectively. By 2060, the solar photovoltaic power generation of agricultural, forest, livestock on livestock rooftops, fishery and rural residential rooftops are expected to reach 271.4 billion kWh, 38.9 billion kWh, 1.5 billion kWh, 64.8 billion kWh and 35.4 billion kWh, respectively. Changes in energy prices and breakthroughs in renewable energy technology will affect the forecast of renewable energy generation. National policy changes on renewable energy generation will also affect the amount of electricity generated.
3. In the base scenario, the total CO2 emissions from household energy consumption and agriculture production energy consumption in the rural areas of Guangdong are 49.785 million t and 13.652 million t, respectively. In the radical model, the total CO2 emissions from household energy consumption and agriculture production energy consumption in the rural areas of Guangdong are 44.702 million t and 12.803 million t, respectively. The radical model can achieve a carbon emission peak in advance and reduce the peak carbon emissions of household energy consumption and production energy consumption by 5.083 million t and 849,000 t, respectively.
4. The energy structure is conducive to finding alternative directions for clean energy. The potential of renewable energy development contributes to developing rural renewable energy. The carbon emission prediction helps to guide the low-carbon and green development of rural areas.
As the forecast time span is relatively long, the forecast results will inevitably be affected by future domestic policies, international situations, energy prices and the development of energy technology. Due to the uncertainties of the above factors, they are not considered in the forecast of this paper.

Author Contributions

Conceptualization, Z.T.; Writing—original draft, Z.T.; Writing—review & editing, D.L.; Project administration, H.G. All authors have read and agreed to the published version of the manuscript.

Funding

This research was funded by the Energy Bureau of Guangdong Province, grant number GZYL21FC051456.

Data Availability Statement

The data presented in this study are openly available in reference number [13,14,16,21].

Conflicts of Interest

The authors declare no conflict of interest. The funders had no role in the design of the study; in the collection, analyses, or interpretation of data; in the writing of the manuscript, or in the decision to publish the results.

References

  1. Bruckner, B.; Hubacek, K.; Shan, Y.; Zhong, H.; Feng, K. Impacts of poverty alleviation on national and global carbon emissions. Nat. Sustain. 2022, 5, 311–320. [Google Scholar] [CrossRef]
  2. Zeqiong, X.; Xuenong, G.; Wenhui, Y.; Jundong, F.; Zongbin, J. Decomposition and prediction of direct residential carbon emission indicators in Guangdong Province of China. Ecol. Indic. 2020, 115, 106344. [Google Scholar] [CrossRef]
  3. Wang, W.; Zhao, D.; Kuang, Y. Decomposition analysis on influence factors of direct household energy-related carbon emission in Guangdong province-Based on extended Kaya identity. Environ. Prog. Sustain. Energy 2016, 35, 298–307. [Google Scholar] [CrossRef] [Green Version]
  4. Hu, A. China’s Goal of Achieving Carbon Peak by 2030 and Its Main Approaches. J. Beijing Univ. Technol. 2021, 21, 3. [Google Scholar]
  5. Zhao, H.; Hu, J.; Hao, F.; Zhang, H. Determinants of Carbon Dioxide Emissions and Their Peaking Prospect: Evidence From China. Front. Environ. Sci. 2022, 10, 913835. [Google Scholar] [CrossRef]
  6. Deangelo, J.; Azevedo, I.; Bistline, J.; Clarke, L.; Luderer, G.; Byers, E.; Davis, S.J. Energy systems in scenarios at net-zero CO2 emissions. Nat. Commun. 2021, 12, 6096. [Google Scholar] [CrossRef] [PubMed]
  7. Ye, H.; Cheng, L.; He, J.; Dang, Z.; Chao, J.; Tan, C. Exploration of Guangdong Rural Distributed Photovoltaic Construction Model from the Perspective of "Innovative Carbon-Neutral Rural Area". South Archit. 2021, 4, 74–81. [Google Scholar]
  8. Zhang, S.; Chen, W. Assessing the energy transition in China towards carbon neutrality with a probabilistic framework. Nat. Commun. 2022, 13, 87. [Google Scholar] [CrossRef] [PubMed]
  9. Ma, X.; Wang, C.; Dong, B.; Gu, G.; Chen, R.; Li, Y.; Zou, H.; Zhang, W.; Li, Q. Carbon emissions from energy consumption in China: Its measurement and driving factors. Sci. Total. Environ. 2019, 648, 1411–1420. [Google Scholar] [CrossRef] [PubMed]
  10. Ren, J.; Yang, Y.; Chi, Y. Research on Straw-Based High-Quality Energy in China under the Background of Carbon Neutrality. Energies 2022, 15, 1724. [Google Scholar] [CrossRef]
  11. Zhang, X.; Xu, K.; He, M.; Wang, J. A Review on the Rural Household Energy in China From 1990s—Transition, Regional Heterogeneity, Emissions, Energy-Saving, and Policy. Front. Energy Res. 2022, 10, 907803. [Google Scholar] [CrossRef]
  12. Li, J.; Chen, C.; Liu, H. Transition from non-commercial to commercial energy in rural China: Insights from the accessibility and affordability. Energy Policy 2019, 127, 392–403. [Google Scholar] [CrossRef]
  13. Guangdong Rural Statistical Yearbook. Available online: https://data.cnki.net/yearbook/Single/N2022020097 (accessed on 31 February 2022).
  14. China Energy Statistical Yearbook 2020. Available online: https://data.cnki.net/yearbook/Single/N2021050066 (accessed on 31 May 2021).
  15. Wang, Y.; Yang, G.; Dong, Y.; Cheng, Y.; Shang, P. The Scale, Structure and Influencing Factors of Total Carbon Emissions from Households in 30 Provinces of China—Based on the Extended STIRPAT Model. Energies 2018, 11, 1125. [Google Scholar] [CrossRef] [Green Version]
  16. Guangdong Statistical Yearbook. Available online: https://data.cnki.net/Yearbook/Single/N2020110011 (accessed on 31 January 2020).
  17. Ribeiro, H.V.; Rybski, D.; Kropp, J.P. Effects of changing population or density on urban carbon dioxide emissions. Nat. Commun. 2019, 10, 3204. [Google Scholar] [CrossRef] [PubMed] [Green Version]
  18. Pehl, M.; Arvesen, A.; Humpenöder, F.; Popp, A.; Hertwich, E.G.; Luderer, G. Understanding future emissions from low-carbon power systems by integration of life-cycle assessment and integrated energy modelling. Nat. Energy 2017, 2, 939–945. [Google Scholar] [CrossRef]
  19. Yeh, S.; Mishra, G.S.; Morrison, G.; Teter, J.; Quiceno, R.; Gillingham, K.; Riera-Palou, X. Long-term shifts in life-cycle energy efficiency and carbon intensity. Environ. Sci. Techno.l 2013, 47, 2494–2501. [Google Scholar] [CrossRef] [PubMed]
  20. Weisser, D. A guide to life-cycle greenhouse gas (GHG) emissions from electric supply technologies. Energy 2007, 32, 1543–1559. [Google Scholar] [CrossRef]
  21. 2019 Refinement to the 2006 IPCC Guidelines for National Greenhouse Gas Inventories. Available online: https://www.ipcc-nggip.iges.or.jp/public/2019rf/index.html (accessed on 1 January 2019).
Figure 1. Rural energy supply and demand system division.
Energies 15 08886 g001
Figure 2. Energy consumption structure in the rural areas of Guangdong. (a) Energy consumption composition and proportion; (b) Energy consumption amount. From Guangdong Rural Statistical Yearbook (2002–2020) [13]; National Bureau of Statistics of China; China Energy Statistical Yearbook (2002–2020) [14].
Energies 15 08886 g002
Figure 3. Rural energy consumption structure in Guangdong, (a) Rural household energy consumption structure; (b) Rural import energy consumption structure. From Guangdong Statistical Yearbook (2007–2020) [16]; China Energy Statistical Yearbook (2007–2020) [14].
Energies 15 08886 g003
Figure 4. Multiple linear stepwise regression analysis of rural household energy consumption.
Energies 15 08886 g004
Figure 5. Multiple linear stepwise regression analysis of rural energy use in Guangdong.
Energies 15 08886 g005
Figure 6. (a) Rural population size, rural per capita disposable income and household energy consumption forecast in Guangdong; (b) Total power of agricultural machinery, total output value of agriculture, forestry, livestock and fishery, and energy consumption for production forecast in Guangdong. From Guangdong Rural Statistical Yearbook (2001–2020) [13].
Energies 15 08886 g006
Figure 7. Renewable energy development forecast in rural areas of Guangdong province. (a) solar power; (b) biomass, hydropower, wind and geothermal energy generation in the province from renewable energy technology development and economic forecasts.
Energies 15 08886 g007
Figure 8. (a) Energy consumption and total carbon emissions forecast under the base scenario. (b) Forecast under the radical model.
Energies 15 08886 g008
Figure 9. Carbon emission forecast for rural household energy consumption in Guangdong under different models.
Energies 15 08886 g009
Figure 10. (a) Forecast under the base scenario; (b) Forecast under the radical model (From China Energy Statistics Yearbook (2007–2020) [14] and model calculation data from the State Grid Energy Research Institute.).
Energies 15 08886 g010
Figure 11. Comparative carbon emissions from rural productive energy consumption under different models.
Energies 15 08886 g011
Table 1. Analysis of factors influencing rural household energy use in Guangdong.
Number of Household Water HeaterNumber of VehiclesHousehold Electrical AppliancesAverage Disposable IncomeEnergy Consumption Per capitaPopulationHousehold Energy
Consumption
Household energy consumption0.992 **0.971 **0.994 **0.986 **0.998 **−0.716 **1
Population−0.773 **−0.840**0.682 **−0.656 **−0.750 **1
Energy Consumption per capita0.997 **0.978**0.991 **0.985 **1
Average disposable income0.981 **0.933 **0.989 **1
Household electrical appliances0.987 **0.957 **1
Number of vehicles0.982 **1
Number of household water heater1
** Significant correlation at 0.01 level (two-tailed).
Table 2. Analysis of factors influencing energy consumption in rural agriculture production in Guangdong.
Fishery
Area
Gross Output Value of
Agriculture
Tea
Garden Area
Orchard AreaVegetable AreaAgricultural Sown AreaPeople
Employed in Primary Industry
Rural
Mechanical Power
Irrigation AreaEnergy
for
Production
Energy for
production
−0.650 *0.918 **0.831 **0.2160.628 **−0.650 **−0.843 **0.708 **0.557*1
Irrigation area−0.1580.708 **0.4400.2320.188−0.705 **−0.743 **0.853 **1
Rural
mechanical power
−0.2230.875 **0.615 **0.0930.414−0.801 **−0.901 **1
People
employed
in primary
industry
0.433−0.959**−0.854 *0.015−0.630 **0.677 **1
Agricultural sown area0.446 *−0.746 **−0.361−0.267−0.1971
Vegetable area−0.3260.679 **0.801 **−0.2851
Orchard area−0.2680.089−0.0611
Tea garden area−0.589 *0.868 **1
Gross output value of
agriculture
−0.534 *1
Fishery
area
1
* Significant correlation at 0.05 level (two-tailed); ** Significant correlation at the 0.01 level (two-tailed).
Table 3. The carbon emissions coefficient.
EnergyCarbon Emissions Coefficient
Kerosene3.1079 kgCO2/kg
LPG3.1013 kgCO2/kg
Coal1.9003 kgCO2/kg
Gasoline2.9251 kgCO2/kg
Diesel oil3.0959 kgCO2/kg
Electric energy production0.997 kgCO2/kWh
Table 4. The conversion factors from physical units to coal equivalent.
EnergyConversion Factor
Raw coal0.714 kgce/kg
Crude oil1.4286 kgce/kg
Gasoline1.4714 kgce/kg
Kerosene1.4714 kgce/kg
Diesel1.4571 kgce/kg
Liquefied petroleum gas 1.7143 kgce/kg
Natural gas1.1000–1.3300 kgce/cu.m
Electricity0.1229 kgce/kWh
Biogas0.714 kgce/cu.m
Hydrogen energy0.4361 kgce/cu.m
Publisher’s Note: MDPI stays neutral with regard to jurisdictional claims in published maps and institutional affiliations.

