
Peaking Carbon Emissions in a Megacity through Economic Restructuring: A Case Study of Shenzhen, China


Abstract
:1. Introduction
2. Methods
2.1. Input-Output Model
2.2. Optimization Model
2.2.1. Economic Development Constraints
2.2.2. Energy Constraints
2.2.3. Carbon Emission Constraints
2.2.4. Employment Constraints
2.2.5. Industrial Structure Adjustment Constraints
2.2.6. Consumption Constraints
2.2.7. Nonnegative Constraints
2.2.8. Objective Function
3. Study Area and Data
3.1. Study Area
3.2. City Input-Output Tables
3.3. Energy Data
3.4. City Carbon Dioxide Emissions
4. Scenario Analysis
4.1. Scenario Definition
4.2. Sectors Screening
5. Results and Discussion
5.1. Pathway to Peak CO2 Emissions
5.2. Industrial Restructuring Helps to Achieve a Carbon Peak
5.3. Industrial Restructuring Balances Carbon Peak and Economic Growth
5.4. Potential Carbon Emission Reduction of Industrial Restructuring
5.5. Validation of the Industrial Restructuring Reliability
6. Conclusions
Author Contributions
Funding
Data Availability Statement
Conflicts of Interest
Appendix A
Appendix A.1. Industrial Linkage Analysis
Appendix A.1.1. Influence Coefficient
Appendix A.1.2. Sensitivity Coefficient
Appendix A.2. Logarithmic Mean Divisor Index Analysis
Appendix A.3. Data Setting
Appendix A.3.1. Sectoral Classification
Appendix A.3.2. Exogenous Parameter Setting

| Para-Meter | Parameter Definition | Data Sources | Parameter Setting |
|---|---|---|---|
| Average annual growth rate of GDP | Shenzhen 14th Five-Year Plan [41], Reasonable assumption | GDP growth rate was 6.9% in 2019 and actual growth rate was 6.7% in 2021. Shenzhen plans to reach CNY 4 trillion at the end of the 14th Five-Year Plan. Based on this, it is reasonably assumed that the added value will linearly decrease by 0.1% every year. | |
| Energy structure | Guangdong 14th Five-Year Energy Plan [45], reasonable assumption | — | |
| Energy consumption growth rate | Mi et al. (2017) and Su et al. (2020) studies | It was 3.8% in 2019, and it is assumed that it will decrease linearly by 0.1% every year thereafter. | |
| Energy intensity decline rate | Shenzhen 14th Five-Year Plan, reasonable assumption | It was 2.8% in 2019, and it is assumed that it will decrease linearly by 0.1% every year thereafter. | |
| Emission factor | Existing data, China Southern Power Grid Report [39] | _ | |
| Carbon emission growth rate | Historical data | It was 2.8% in 2019, and it is assumed that it will decrease linearly by 0.1% every year thereafter and reach zero in 2026. | |
| Carbon intensity decline rate | Shenzhen 14th Five-Year Plan, reasonable assumption | The carbon emission intensity reduction target in the 14th FYP is 18%, and it is assumed that in the 15th FYP it is also 18%. | |
| Employment opportunities brought about by unit added value in sector i in period t | Historical data | During 2015–2019, the employment opportunities provided by a unit of manufacturing added value were 4.98% annually. It is assumed that it will decrease linearly by 0.2% annually during 2019–2030, assuming that the added value employment of other industries remains unchanged. | |
| Average annual growth rate of the resident population | Shenzhen 14th Five-Year Plan | — | |
| Structural adjustment cap for encouraged industries | Mi et al. (2017) and Su et al. (2020) studies, reasonable assumption | The upper limit of structural adjustment is assumed to be 4% in 2019 and will increase linearly by 0.2% per year. | |
| Structure adjustment floor for limited industries | Mi et al. (2017) and Su et al. (2020) studies | The upper limit of structural adjustment is assumed to be −4% in 2019 and will decrease linearly by 0.2% per year. | |
| Structural adjustment cap for other industries | Mi et al. (2017) and Su et al. (2020) studies, reasonable assumption | The average growth rate of industrial structure adjustment in 2015–2019 was 4.7% and is assumed that it will increase linearly by 0.2% every year thereafter. | |
| Structural adjustment floor for other industries | Mi et al. (2017) and Su et al. (2020) studies, reasonable assumption | The average growth rate of industrial structure adjustment in 2015–2019 was −4.7% and is assumed that it will decrease linearly by 0.2% every year thereafter. | |
| Lower limit of consumption in GDP | Historical data | Between 2015 and 2019, the minimum consumption proportion was 35%. | |
| Upper limit of consumption in GDP | Historical data | Between 2015 and 2019, the maximum consumption proportion was 45%. |
Appendix A.4. Additional Results


References
- Zheng, H.; Meng, J.; Mi, Z.; Song, M.; Shan, Y.; Ou, J.; Guan, D. Linking City-level Input-Output Table to Urban Energy Footprint: Construction Framework and Application. J. Ind. Ecol. 2019, 23, 781–795. [Google Scholar] [CrossRef]
- Zhou, Y.; Chen, M.; Tang, Z.; Mei, Z. Urbanization, Land Use Change, and Carbon Emissions: Quantitative Assessments for City-Level Carbon Emissions in Beijing-Tianjin-Hebei Region. Sustain. Cities Soc. 2021, 66, 102701. [Google Scholar] [CrossRef]
- Sun, D.; Zhou, L.; Li, Y.; Liu, H.; Shen, X.; Wang, Z.; Wang, X. New-Type Urbanization in China: Predicted Trends and Investment Demand for 2015–2030. J. Geogr. Sci. 2017, 27, 943–966. [Google Scholar] [CrossRef]
- Shan, Y.; Guan, D.; Hubacek, K.; Zheng, B.; Davis, S.J.; Jia, L.; Liu, J.; Liu, Z.; Fromer, N.; Mi, Z.; et al. City-Level Climate Change Mitigation in China. Sci. Adv. 2018, 4, eaaq0390. [Google Scholar] [CrossRef] [PubMed]
- Cheng, Z.; Li, L.; Liu, J. Industrial Structure, Technical Progress and Carbon Intensity in China’s Provinces. Renew. Sustain. Energy Rev. 2018, 81, 2935–2946. [Google Scholar] [CrossRef]
- Li, W.; Wang, W.; Wang, Y.; Qin, Y. Industrial Structure, Technological Progress and CO2 Emissions in China: Analysis Based on the STIRPAT Framework. Nat. Hazards 2017, 88, 1545–1564. [Google Scholar] [CrossRef]
- Mi, Z.; Meng, J.; Guan, D.; Shan, Y.; Liu, Z.; Wang, Y.; Feng, K.; Wei, Y.-M. Pattern Changes in Determinants of Chinese Emissions. Environ. Res. Lett. 2017, 12, 074003. [Google Scholar] [CrossRef]
- Guan, D.; Meng, J.; Reiner, D.M.; Zhang, N.; Shan, Y.; Mi, Z.; Shao, S.; Liu, Z.; Zhang, Q.; Davis, S.J. Structural Decline in China’s CO2 Emissions through Transitions in Industry and Energy Systems. Nat. Geosci. 2018, 11, 551–555. [Google Scholar] [CrossRef]
- Mi, Z.; Zheng, J.; Green, F.; Guan, D.; Meng, J.; Feng, K.; Liang, X.; Wang, S. Decoupling without Outsourcing? How China’s Consumption-Based CO2 Emissions Have Plateaued. iScience 2021, 24, 103130. [Google Scholar] [CrossRef]
- Duan, F.; Wang, Y.; Wang, Y.; Zhao, H. Estimation of Marginal Abatement Costs of CO2 in Chinese Provinces under 2020 Carbon Emission Rights Allocation: 2005–2020. Environ. Sci. Pollut. Res. 2018, 25, 24445–24468. [Google Scholar] [CrossRef]
- Wu, L.; Chen, Y.; Feylizadeh, M.R. Study on the Estimation, Decomposition and Application of China’s Provincial Carbon Marginal Abatement Costs. J. Clean. Prod. 2019, 207, 1007–1022. [Google Scholar] [CrossRef]
- Su, Y.; Liu, X.; Ji, J.; Ma, X. Role of Economic Structural Change in the Peaking of China’s CO2 Emissions: An In-put–Output Optimization Model. Sci. Total Environ. 2021, 761, 143306. [Google Scholar] [CrossRef] [PubMed]
- Liu, Y.; Bian, J.; Li, X.; Liu, S.; Lageson, D.; Yin, Y. The Optimization of Regional Industrial Structure under the Water-Energy Constraint: A Case Study on Hebei Province in China. Energy Policy 2020, 143, 111558. [Google Scholar] [CrossRef]
- Zhu, B.; Zhang, T. The Impact of Cross-Region Industrial Structure Optimization on Economy, Carbon Emissions and Energy Consumption: A Case of the Yangtze River Delta. Sci. Total Environ. 2021, 778, 146089. [Google Scholar] [CrossRef] [PubMed]
- Su, Y.; Wang, Y.; Zheng, B.; Ciais, P.; Wu, J.; Chen, X.; Wang, Y.; Wang, C.; Ye, Y.; Li, Q.; et al. Retrospect Driving Forces and Forecasting Reduction Potentials of Energy-Related Industrial Carbon Emissions from China’s Manufacturing at City Level. Environ. Res. Lett. 2020, 15, 074020. [Google Scholar] [CrossRef]
- Mi, Z.; Wei, Y.-M.; Wang, B.; Meng, J.; Liu, Z.; Shan, Y.; Liu, J.; Guan, D. Socioeconomic Impact Assessment of China’s CO2 Emissions Peak Prior to 2030. J. Clean. Prod. 2017, 142, 2227–2236. [Google Scholar] [CrossRef]
- Yu, S.; Zheng, S.; Li, X.; Li, L. China Can Peak Its Energy-Related Carbon Emissions before 2025: Evidence from Industry Restructuring. Energy Econ. 2018, 73, 93–107. [Google Scholar] [CrossRef]
- Zhang, C.; Su, B.; Zhou, K.; Yang, S. Decomposition Analysis of China’s CO2 Emissions (2000–2016) and Scenario Analysis of Its Carbon Intensity Targets in 2020 and 2030. Sci. Total Environ. 2019, 668, 432–442. [Google Scholar] [CrossRef]
- Zheng, H.; Song, M.; Guan, D. Chinese Provincial Multi-Regional Data Descriptor Input-Output Database for 2012, 2015, and 2017. Sci. Data 2021, 8, 244. [Google Scholar] [CrossRef]
- Zhang, S.; Li, H.; Zhang, Q.; Tian, X.; Shi, F. Uncovering the Impacts of Industrial Transformation on Low-Carbon Development in the Yangtze River Delta. Resour. Conserv. Recycl. 2019, 150, 104442. [Google Scholar] [CrossRef]
- Chatterjee, N.; Chatterjee, T. Effects of Labor Productivity and Growth of Manufacturing Sector on Overall Growth of the Nation—A Panel Data Analysis of the Major Economies. In Productivity Growth in the Manufacturing Sector; Emerald Publishing Limited: Bingley, UK, 2021; pp. 17–29. [Google Scholar] [CrossRef]
- Chang, N. Changing Industrial Structure to Reduce Carbon Dioxide Emissions: A Chinese Application. J. Clean. Prod. 2015, 103, 40–48. [Google Scholar] [CrossRef]
- Yu, S.; Zheng, S.; Zhang, X.; Gong, C.; Cheng, J. Realizing China’s Goals on Energy Saving and Pollution Reduct-ion: Industrial Structure Multi-Objective Optimization Approach. Energy Policy 2018, 122, 300–312. [Google Scholar] [CrossRef]
- Cass, D. Optimum Growth in an Aggregative Model of Capital Accumulation. Rev. Econ. Stud. 1965, 32, 233–240. [Google Scholar] [CrossRef]
- Rojas Sánchez, D.; Hoadley, A.F.A.; Khalilpour, K.R. A Multi-Objective Extended Input-Output Model for a Regional Economy. Sustain. Prod. Consum. 2019, 20, 15–28. [Google Scholar] [CrossRef]
- Ramsey, F.P. The Mathematical Theory of Saving. Econ. J. 1965, 38, 543–559. [Google Scholar] [CrossRef]
- Hu, G.; Ma, X.; Ji, J. Scenarios and Policies for Sustainable Urban Energy Development Based on LEAP Model—A Case Study of a Postindustrial City: Shenzhen China. Appl. Energy 2019, 238, 876–886. [Google Scholar] [CrossRef]
- 21st Century Business Report. China Net Zero Carbon City Development Report (2022). 2022. Available online: http://www.21jingji.com/article/20220602/a4641ce1d99c3971bca5a6522e4e8566.html (accessed on 9 August 2022).
- Zheng, H.; Többen, J.; Dietzenbacher, E.; Moran, D.; Meng, J.; Wang, D.; Guan, D. Entropy-Based Chinese City-Level MRIO Table Framework. Econ. Syst. Res. 2021, 1, 1–26. [Google Scholar] [CrossRef]
- Guangdong Provincial Bureau of Statistics. Guangdong Provincial Statistical Yearbook 2016–2020. 2021. Available online: http://stats.gd.gov.cn/gdtjnj/content/post_3557537.html (accessed on 9 August 2022).
- Lahr, M.; de Mesnard, L. Biproportional Techniques in Input-Output Analysis: Table Updating and Structural Analysis. Econ. Syst. Res. 2004, 16, 115–134. [Google Scholar] [CrossRef]
- Liu, Q.; Peng, Z. China’s Input-Output Tables in Constant Prices 1992–2005; China Statistics Press: Beijing, China, 2010; ISBN 978-7-5037-5893-5. [Google Scholar]
- Shenzhen Municipal Bureau of Statistics. Shenzhen Statistical Yearbook 2016–2020. 2021. Available online: http://tjj.sz.gov.cn/zwgk/zfxxgkml/tjsj/tjnj/ (accessed on 9 August 2022).
- Shan, Y.; Guan, D.; Liu, J.; Mi, Z.; Liu, Z.; Liu, J.; Schroeder, H.; Cai, B.; Chen, Y.; Shao, S.; et al. Methodology and Applications of City Level CO2 Emission Accounts in China. J. Clean. Prod. 2017, 161, 1215–1225. [Google Scholar] [CrossRef] [Green Version]
- Cai, B.; Wang, J.; Yang, S.; Mao, X.; Cao, L. Carbon Dioxide Emissions from Cities in China Based on High-Resolution Emission Gridded Data. Chin. J. Popul. Resour. Environ. 2017, 15, 58–70. [Google Scholar] [CrossRef]
- Liu, Z.; Cai, B. High-Resolution Carbon Emissions Data for Chinese Cities. Paper, Environment and Natural Resources Program, Belfer Center. 2018. Available online: https://www.belfercenter.org/publication/high-resolution-carbon-emissions-data-chinese-cities (accessed on 9 August 2022).
- NationalCenter for Climate Change Strategy and International Cooperation. Guidelines for the Compilation of Provincial Greenhouse Gas Inventories. 2011. Available online: http://www.ncsc.org.cn/SY/tjkhybg/202003/t20200319_769763.shtml (accessed on 9 August 2022).
- Guangdong Provincial Department of Ecological Environment. Guidelines for the Compilation of Greenhouse Gas Inventory in Cities and Counties (Districts) of Guangdong Province. 2020. Available online: http://gdee.gd.gov.cn/shbtwj/content/post_3019513.html (accessed on 9 August 2022).
- China Southern Power Grid. Social Responsibility Report of Southern Power Grid 2020. 2021. Available online: http://www.csg.cn/shzr/zrbg/ (accessed on 9 August 2022).
- Shenzhen Science and Technology Innovation Committee. 14th Five-Year Plan of Scientific and Technological Innovation in Shenzhen. 2022. Available online: http://stic.sz.gov.cn/xxgk/kjgh/content/post_9936177.html (accessed on 9 August 2022).
- Shenzhen Development and Reform Commission. Outline of the 14th Five-Year Plan (2021–2025) for National Economic and Social Development and Vision 2035 of Shenzhen. 2021. Available online: http://www.sz.gov.cn/cn/xxgk/zfxxgj/ghjh/content/post_8854038.html (accessed on 9 August 2022).
- Shenzhen Special Zone News. 14th Five-Year Plan” of Shenzhen’s Service Industry Development. 2022. Available online: http://www.sz.gov.cn/cn/xxgk/zfxxgj/zwdt/content/post_9560944.html (accessed on 9 August 2022).
- Hood, W.C.; Rasmussen, P.N. Studies in Inter-Sectoral Relations. J. Am. Stat. Assoc. 1956, 52, 115. [Google Scholar] [CrossRef]
- Jones, L.P. The Measurement of Hirschmanian Linkages. Q. J. Econ. 1976, 90, 323–333. [Google Scholar] [CrossRef]
- People’s Government of Guangdong Province. Guangdong 14th Five-Year Energy Plan. 2022. Available online: https://www.gd.gov.cn/xxts/content/post_3909373.html (accessed on 9 August 2022).


| Intermediate Matrix | Consum-Ption | Capital Formation | Net Export | OP-OD | OC-OP | Total Output | |
|---|---|---|---|---|---|---|---|
| Intermediate Matrix | |||||||
| Value Added | |||||||
| Total Input | |||||||
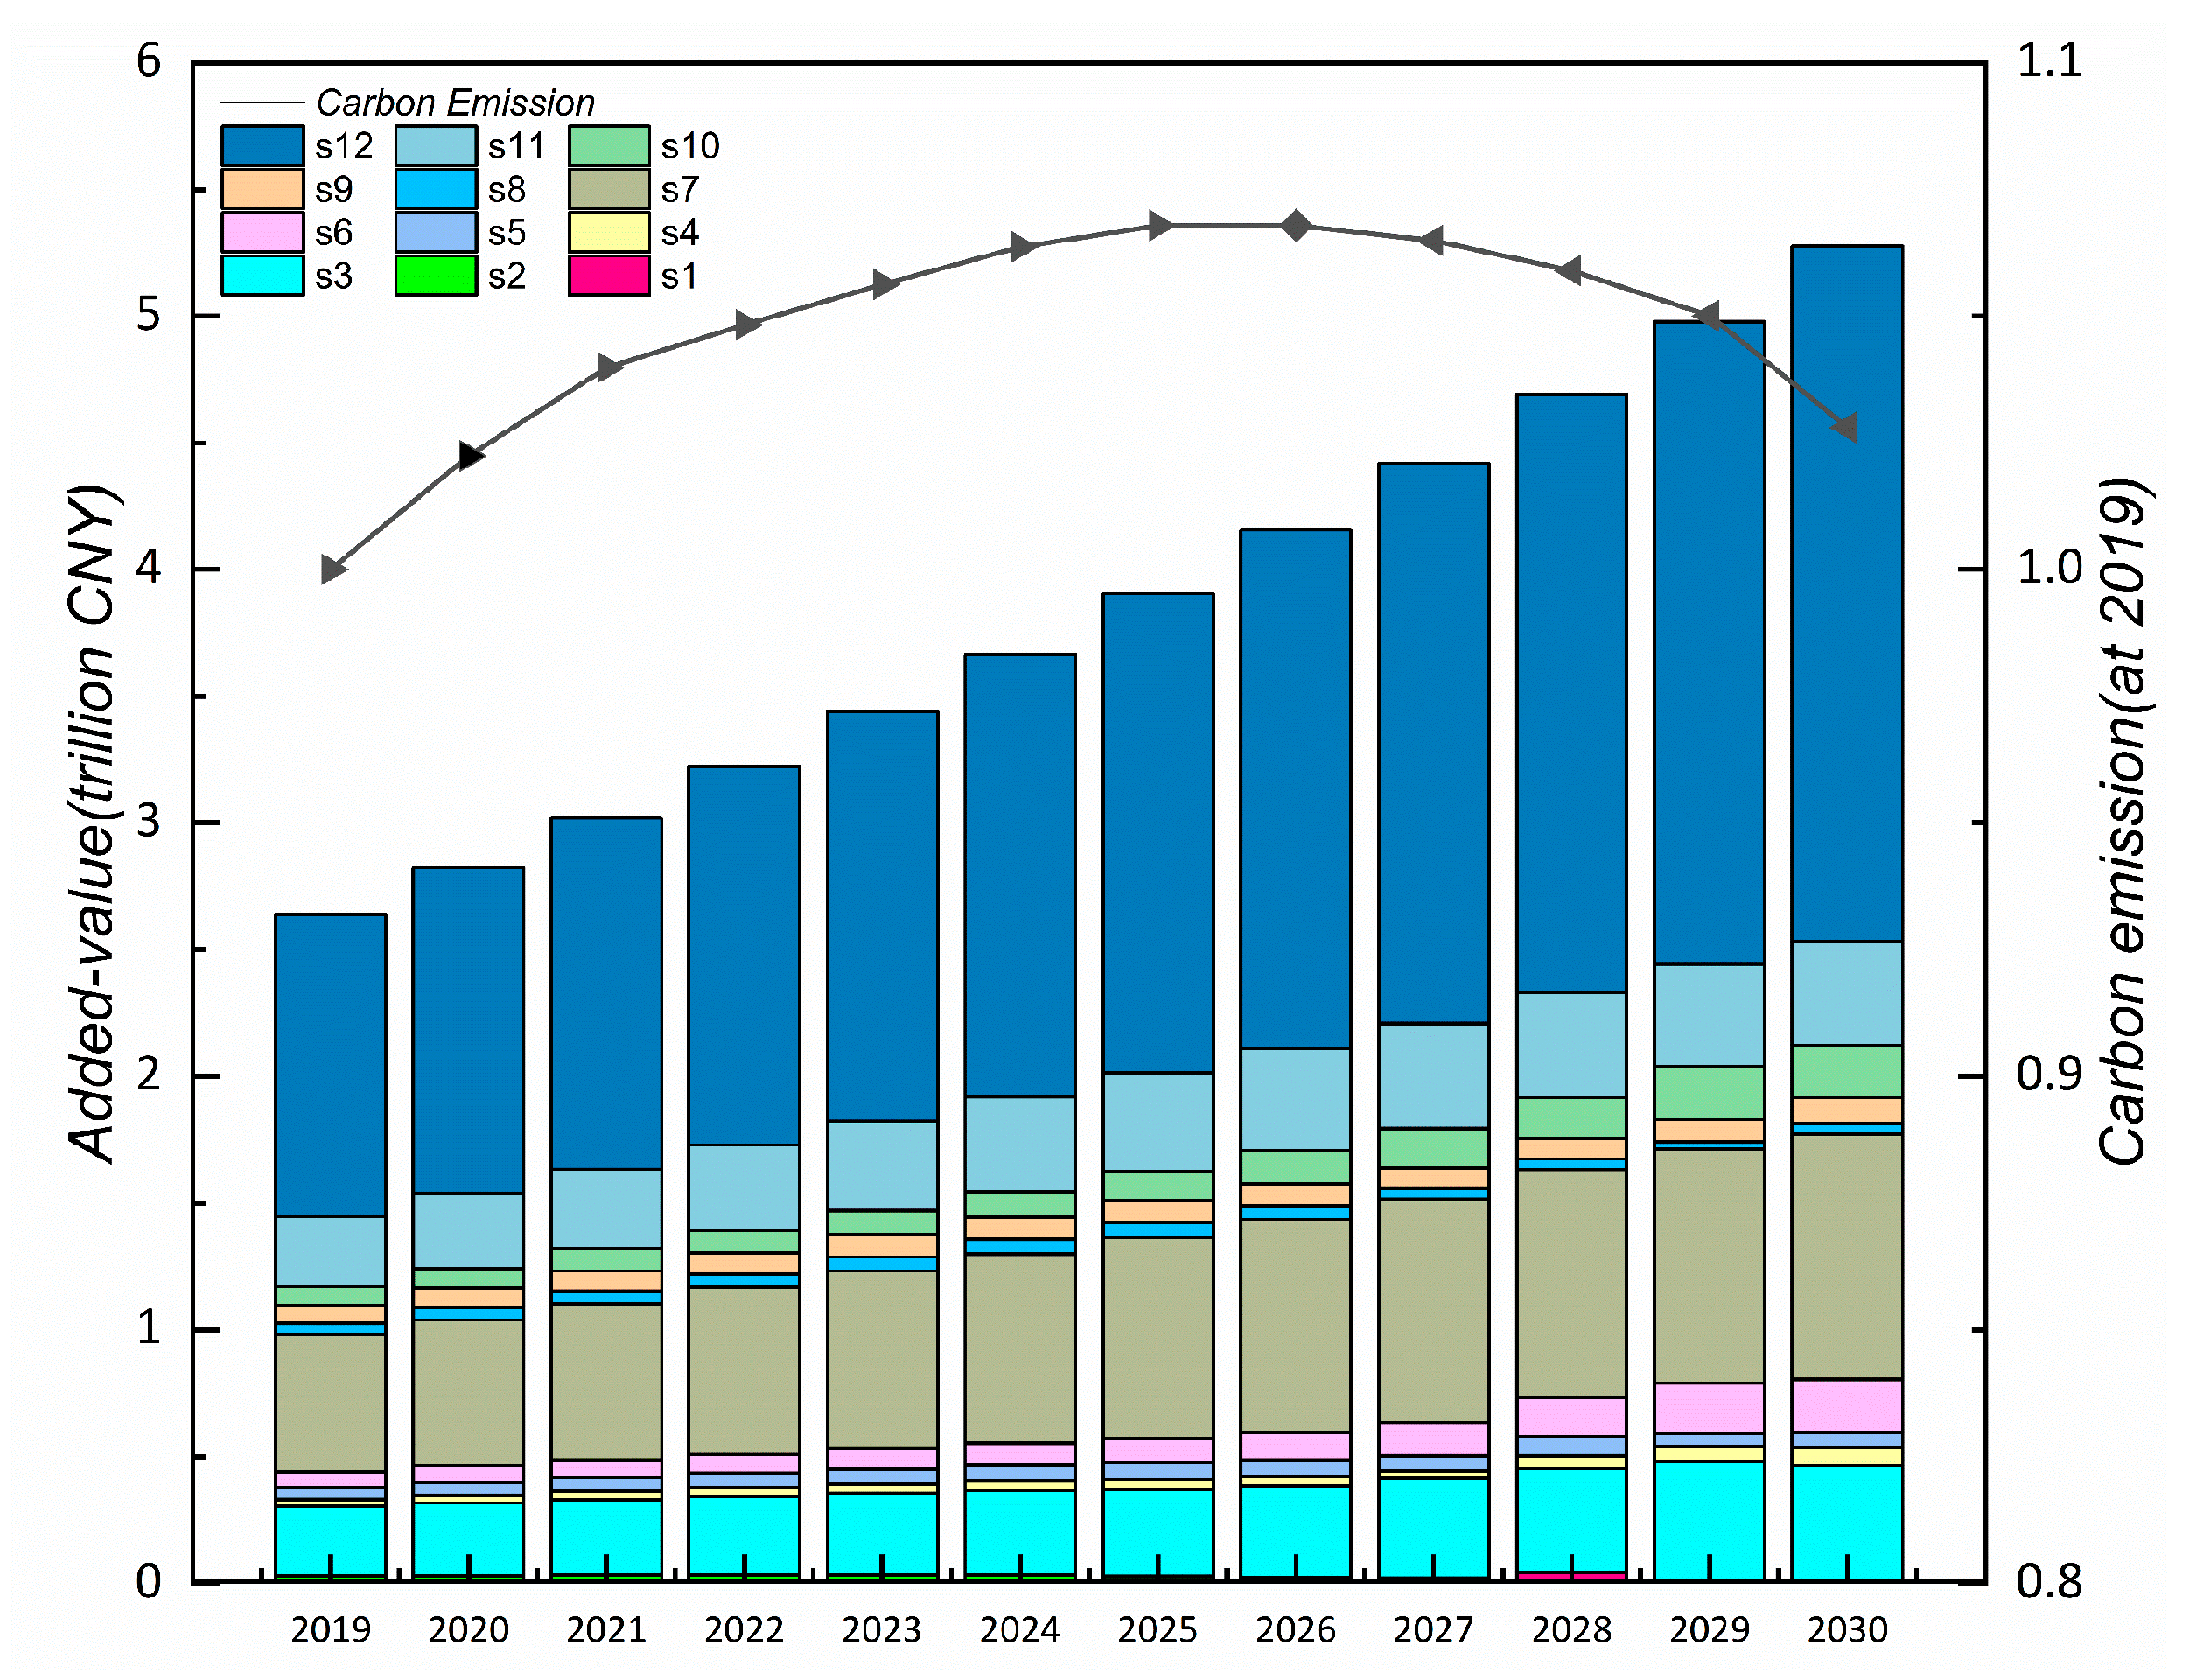
| Sectors | |
|---|---|
| s1 | Agriculture, forestry, hunting, and fishery |
| s2 | Mining industry |
| s3 | Other manufacturing industries |
| s4 | General equipment manufacturing |
| s5 | Special equipment manufacturing |
| s6 | Electrical machinery and equipment manufacturing |
| s7 | Communication, computer, and other electronic equipment manufacturing |
| s8 | Electricity, gas, and water supply |
| s9 | Construction |
| s10 | Transportation, warehousing, and postal |
| s11 | Wholesale and retail accommodation and catering |
| s12 | Other services |
Publisher’s Note: MDPI stays neutral with regard to jurisdictional claims in published maps and institutional affiliations. |
© 2022 by the authors. Licensee MDPI, Basel, Switzerland. This article is an open access article distributed under the terms and conditions of the Creative Commons Attribution (CC BY) license (https://creativecommons.org/licenses/by/4.0/).
Share and Cite
Yang, Y.; He, F.; Ji, J.; Liu, X. Peaking Carbon Emissions in a Megacity through Economic Restructuring: A Case Study of Shenzhen, China. Energies 2022, 15, 6932. https://doi.org/10.3390/en15196932
Yang Y, He F, Ji J, Liu X. Peaking Carbon Emissions in a Megacity through Economic Restructuring: A Case Study of Shenzhen, China. Energies. 2022; 15(19):6932. https://doi.org/10.3390/en15196932
Chicago/Turabian StyleYang, Yang, Fan He, Junping Ji, and Xin Liu. 2022. "Peaking Carbon Emissions in a Megacity through Economic Restructuring: A Case Study of Shenzhen, China" Energies 15, no. 19: 6932. https://doi.org/10.3390/en15196932
APA StyleYang, Y., He, F., Ji, J., & Liu, X. (2022). Peaking Carbon Emissions in a Megacity through Economic Restructuring: A Case Study of Shenzhen, China. Energies, 15(19), 6932. https://doi.org/10.3390/en15196932