Abstract
The current paper proposes a novel multi-generation system, integrated with compound parabolic collectors and a biomass combustor. In addition to analyzing the comprehensive system in a steady state, the feasibility of using nanofluids as heat transfer fluids in the solar cycle and their effect on the overall performance of the system was studied. The multi-generation system is generally designed for generating electricity, cooling, freshwater, drying, hot water, and hydrogen, with the help of six subsystems. These include a double stage refrigeration system, an organic Rankine cycle, a steam Rankine cycle, a dryer, a proton exchange membrane electrolyzer, and a multistage flash distillation system. Two types of nanoparticles (graphene, silver), which have various high-quality properties when used within ethylene glycol, were chosen as absorbing fluids in the solar cycle. The performance parameters of the base case thermodynamic analysis and some of the variable parameters were calculated, and their effect on system performance was determined. According to the results, a spike in solar irradiation, ambient temperature, output temperature of biomass combustor and nanofluids’ concentration positively affected the overall system performance. The results also clearly showed an improvement in system performance when using nanofluids as working fluids in solar collectors.
1. Introduction
There is a rise in the overall demand for energy, for most countries, to maintain socio-economic development and improve public health and economic well-being. Since the 1850s, global fossil fuel use (oil, coal, and gas) has exceeded the energy supply, resulting in excessive emissions of carbon dioxide [1,2]. Many options have been presented so far for reducing greenhouse gas emissions while still meeting the global energy demand. Renewable energies, such as solar and biomass energies, are considered the best alternatives to fossil fuels. Biomass is an organic matter such as wood, animal waste, seaweed, and crops that can be used as an energy resource [3]. Biomass is obtained from living or dead materials that exist in the world. Improving the overall energy system is possible by integrating several energy systems. The multi-generation systems connect three or more subsystems, each giving one or more useful outputs in the form of fresh water, electricity, cooling, and heating [4,5,6,7]. Concentrated solar power (CSP) is a viable option among solar energy technologies and provides an ideal alternative to fossil fuels [8]. A compound parabolic collector (CPC) is another viable option because of its good thermal performance and low cost. Actually, a CPC collects both direct and indirect solar radiation without any tracking system [9,10]. The multi-generation systems offer a promising application [11,12], as already mentioned in this study. The application of hybrid biomass-solar systems as an energy source for the multi-generation system is an interesting option, and it is currently an important goal for researchers [13,14,15,16,17]. The solar systems’ efficiencies have not reached the desired operational level, so they need further improvement [18,19]. Researchers have solved the problem of low thermal efficiency faced in solar energy conversion systems, by using nano-fluids as operating fluids in solar-thermal systems [20,21]. Nanofluids have shown improved thermal properties compared to base fluids, to enhance the solar thermal systems’ heat transfer properties [22,23].
To date, a few studies are available on using solar energy as the main energy source, especially when nanofluids are used as working fluids. Boyaghchi et al. [24] proposed a multi-generation solar and geothermal system using water/CuO nanofluid to transfer heat. They used the organic Rankine cycle to compare four working fluids, including R134a, R1234ze, R1234yf, and R423A. Results proved that R134a is a superior working fluid for ORCs. Additionally, utilizing a nanofluid as a medium of heat transfer, rather than pure water, was declared effective because it increased the system’s thermal and energy efficiencies. Li et al. [25] analyzed the economic and thermodynamic performances of the two combined heating and power (CHP) systems coupled with a vapor compression cycle (VCC) and an organic Rankine cycle (ORC). It was indicated that the optimal evaporation temperature changed between 130 and 140 °C, to optimize system performance. Additionally, the energy utilization rate is high, and the exergetic efficiency of the two systems can be achieved at more than 60%, which means the cascade utilization mode is acceptable. Ji et al. [26] investigated a working fluid assessment for a biomass ORC power generation system, under different conditions (expansion ratio and evaporation pressure). The mathematical model of the system is constructed and simulated with Aspen Plus V11 software. Five organic working fluids (R11, R113, R123, R141b, R245fa) were used. The selection of the working fluid in the biomass ORC system was investigated for different conditions. The highest exergy and thermal efficiency were seen when the R11 working fluid was used. Khan and Kim [27] reported the thermodynamic analysis of a high-temperature recuperative ORC compromising water heating, domestic hot water, and electricity generation. According to the detailed energy and exergy analysis, chlorobenzene in S-ORC and R601 in R-ORC have the best performance. The maximum electricity production was 585.7 kW. Abid et al. [28] conducted a comparative thermodynamic analysis of a parabolic trough solar thermal power plant using two nanofluids (Al2O3, Fe2O3) and two different types of thermal fluids, Glycerol and Therminol 66. They noticed that a nanofluid improves the solar thermal plant’s net power. Tzivanidis and Bellos [29] evaluated an absorption cooling system consisting of flat plate collectors based on nanofluids and powered by solar collectors. LiBr/H2O was the working fluid in the absorption chiller, while the solar system was run using water/CuO nanofluid. The researchers found that using nanofluids in a solar collector can improve the system’s daily exergetic performance by 3.99%, and refrigeration production by 0.84%.
Faizal et al. [30] tested the effect of using metal oxides, including SiO2, Al2O3, CuO, and TiO2 nanoparticles, with water, on the power generation and cost of a solar collector for obtaining the targeted product temperature. According to the results, low specific heat and high density of nanoparticles lead to improved thermal efficiency, while the CuO nanofluid shows a higher value, compared to other nanofluids. A comparative analysis performed by Ibrahim and Kayfeci [31], to analyze the thermodynamics of a trigeneration system that used graphene and ferrofluid nanoparticles, shows that the system efficiency was enhanced when 0.1–0.6% volumetric fraction of nanofluids was used. The researchers found that the performance of graphene nanoparticles was better when a comparison was made with that of ferrofluid nanoparticles. Lu et al. [32] conducted experiments on the CuO-water nanofluid to investigate its thermal performance in the CPC. They reported the greatest heat transfer coefficient as almost 30%, with a nanofluid at 1.2% mass concentration. In another experimental study [33], the same researchers revealed that the improvement in the CPC thermal efficiency was almost 12.7% when the same nanofluid was used. The performances of multiple production systems depend on their design; therefore, increasing system efficiency by choosing different designs is as important as using the latest technologies in research. The current multi-generation system is practical and feasible because it uses modern technologies and existing systems. In this paper, we designed and analyzed a novel multi-generation system that uses biomass and solar energy. To the best of our knowledge and after conducting a comprehensive literature review, we can claim that there is no previous study in which researchers used a compound parabolic collector to collect the solar irradiation for the multi-generation system, in addition to using graphene and silver nanoparticles within the base fluid. In addition to analyzing and assessing the overall system according to several criteria, a comparative study was conducted to analyze two different nanofluids as heat transfer fluids in the solar cycle, to evaluate their effect on the overall performance. We calculated useful outputs of the system, including energy and exergy efficiencies, and determined the exergy destruction value for each subsystem, checked the possible improvements, and studied the effects of significant parameters. The examined system produces hydrogen, electricity, drying effects, fresh and hot water, and cooling.
2. Methodology
In this section, the proposed multi-generation system and a simplified explanation of its working mechanism are presented. The mathematical relationships used for the thermodynamic analysis and the input data used for the process modeling are also clearly demonstrated. To maintain simplicity, this section is divided into additional subsections including system description, assumptions, and mathematical modeling.
2.1. System Description
Figure 1 shows the suggested multi-generation system. It is evident that the integrated system benefits from solar and biomass systems as two independent energy sources. This combined plant includes a compound parabolic collector (CPC) with hot and cold energy storage tanks, steam Rankine cycle (SRC), biomass combustor, proton exchange membrane electrolyzer (PEM), organic Rankine cycle (ORC), multi-stage flash distillation (MSF), dryer process, and the double-effect absorption cycle (DEAC). Two types of nanoparticles, graphene and silver (Ag), were chosen as working fluids and used in ethylene glycol (EG) as a base fluid in the solar system. These nanofluids possess excellent and diverse physical properties that help to provide the thermal energy needed to contribute to driving the subsystems.
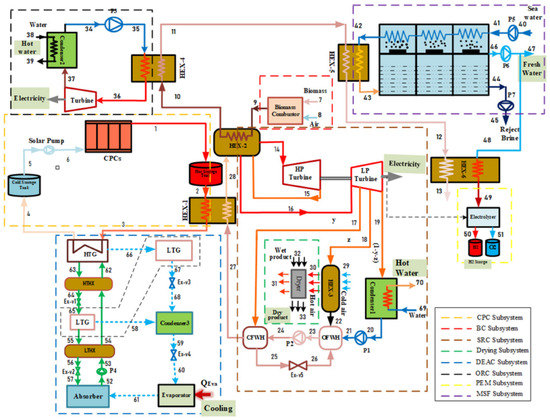
Figure 1.
Schematic diagram of the solar and biomass energy integrated cycle for a multi-generation system.
It is clear in the system schematic that solar radiation falls on the solar system and it is concentrated by a CPC. The heat transfer fluid enters the CPC to receive solar energy and leaves the solar collectors at a comparatively high temperature. After leaving the hot energy storage tank, this hot fluid flows in the first heat exchanger (HEX-1) to exchange heat with water from a closed-feed water heater in the SRC and leaves the HEX-1 at a relatively lower temperature. The residual heat in the absorption fluid is used to heat the LiBr/H2O solution in a DEAC’s high-temperature generator (HTG). The pump returns the relatively low-temperature fluid from the cold energy storage tank to the CPC to increase its temperature, and the cycle begins again. The steam produced by the HEX-1 outlet has high-quality energy that is usable again, to improve the system efficiency.
To complement the energy requirements of the entire system, air and biomass are mixed in a biomass combustor to produce thermal energy. The steam Rankine cycle is operated using the thermal energy generated and used in HEX-2, to heat a medium-temperature fluid from HEX-1. For more effective energy recovery, high-pressure and low-pressure turbines are combined in an SRC that has an appropriate temperature range.
The high-temperature steam leaves the HEX-2 (used as a boiler for the SRC) and is used to generate electricity by sending it to a high-pressure turbine (HPT), and later it is passed back to HEX-2 for reheating. When the steam is reheated at low pressure, it is sent to a low-pressure turbine (LPT) to generate electricity. The regeneration process occurs in the SRC, by bleeding the steam from the LPT at various points. This steam is used to heat the feedwater by a regenerator or a feedwater heater (FWH). Single-stage reheating, process heater (HEX-3), closed feed water heater (CFWH), and open feed water heater (OFWH) are used in SRC because of their benefits, perhaps the most important of which is raising the cycle efficiency, and thus improving the overall efficiency of the system.
Some proportion of the generated electricity is utilized in the PEM electrolyzer to produce hydrogen, which is shifted to a hydrogen storage tank. Extra heat (state 18) is shifted to HEX-3, which is used in the drying subsystem to dry the wet products. Since the working fluid that leaves HEX-1 still has energy, it is reused to power the DEAC, which uses wasted heat. DEAC combines a couple of single-effect absorption-cooling systems. This system has two generators, which are available in different designs. For this research, we used Lithium Bromide solution (LiBr-H2O) as a working fluid because water acts as a refrigerant while LiBr acts as an absorber. In this cycle, the dilute lithium bromide solution first flows to the HTG, while the concentrated lithium bromide solution passes through a solution expansion valve, before it enters the LTG. The refrigerant vapor condenses in the condenser and reaches the cooling temperature. Then, chilled water gets into the evaporator to provide a cooling load. The weak H2O-LiBr solution enters the absorber and absorbs the vapor from the evaporator by releasing heat into the environment. The ORC is integrated into the system to utilize biomass energy for further power generation. The main benefit of this cycle is converting low- and medium-temperature heat sources into electricity. The organic fluid isobutane was tested. In order to take advantage of the waste heat of the condenser, it was used to obtain hot water.
The requirements for MFS reheating are fulfilled by using the steam generated from the biomass combustor when it leaves HEX-3. The remaining part of the heat is utilized for warming up the water before it enters the PEM. MSF performs thermal desalination that passes hot brine from several vacuum stages. A standard MSF system consists of 24 instillation stages in a series configuration [34]. During these stages, the brine evaporates, which is called “flashing”. When the flashed vapors condense on the preheating tubes’ surfaces, it simultaneously produces distillates and transfers heat to the incoming feed water, which is supplied through the tubes. The rejected brine comes out of the desalination system at a 178.1 kg/s mass flow rate and discharges the fresh water at a 21.89 kg/s flow rate. Some freshwater obtained through the MSF is transferred to the electrolyzer to produce hydrogen.
2.2. Assumptions
Before moving on to the mathematical model, we present the general assumptions consistent throughout the integrated system analysis. They are listed below:
- All system parts operate under steady-state conditions.
- Reference pressure and temperature are 101.3 kPa and 25 °C.
- We neglected all kinetic and potential changes to the entire system.
- Pressure and heat losses are not considered in the flow channels [35,36].
- Pump and turbine isentropic efficiency is assumed as 0.85.
- The contents of sulfur, chlorine and ash are trivial, and thus ignored in the biomass energy calculations.
- At the entrance to the MSF, the seawater has a 25 °C constant temperature.
- Heat loss at each desalination stage is ignored.
- At every desalination stage, there is an equal temperature increase in the preheated feed water.
- The temperature of the hot brine equally reduces at each desalination stage.
2.3. Modelling and Analysis
The current section presents the mathematical model of our proposed multi-generation system. All the equations of thermodynamic equilibrium pertaining to energy, mass, and exergy are mentioned, for all the integrated system components. The equations have been solved by Engineering Equation Solver (EES) software [37]. In Table 1, the input data for the study are given.

Table 1.
Input data used in the system analysis.
Balance Equations
To estimate the system’s overall efficiency, the first and second laws of thermodynamics are used for each system component, assuming appropriate parameters. In steady state, the balance equation for mass flow rate is given below:
Disregarding potential and kinetic energy, the energy balance equation for every unit in the system can be formulated as:
Exergy balance equation:
where h represents specific enthalpy, while stands for the exergy destruction. The physical exergy per mass flow rate is:
Table 2 shows the thermodynamic balance equations of the components of our proposed system. Considering the continuity equation, the energy and exergy balance equations of all subsystems and their components, listed in Table 2, are entered into the EES program. They are then solved for the input parameters in Table 1, in accordance with the thermodynamic properties of the fluids. The details of the thermodynamic properties of the subsystems and their efficiency are provided in the remainder of the section.
Table 2.
Thermodynamic balance equalities of multi-generation system components.
It is a non-imaging form of concentrator that has the ability to focus light on a small absorber surface. It is designed as a fixed solar collector to achieve cost-effectiveness with a relatively higher temperature. The nanofluid, which passes through the solar collectors, absorbs heat from solar energy and is directly fed to other integrated subsystems for power generation. The CPC analysis in this section is based on the equations presented by Kalogirou [18]. The CPC’s energy efficiency can be computed using the given formula:
where () is the thermal efficiency of a CPC, is the useful energy, is the total incident radiation and () is the aperture plane. The useful energy provided by a CPC is calculated as follows:
The absorbed radiation (S) is obtained from:
where is the transmissivity of the cover glass, is the receiver absorptivity, CPC effective transmissivity is , is the specular reflectivity of the CPC walls and the diffusion radiation correction factor, and n represents the average number of reflections.
where the factor () represents the diffused radiation wastage outside the acceptance angle of the CPC at concentration C, and C is the concentration ratio of collector . The GD/Gt ratio varies from about 0.11 on a clear sunny day, to about 0.23 on a foggy day.
This useful energy can also be calculated from:
where and are, respectively, the outlet and inlet temperature of the solar collectors, is the mass flow rate of heat transfer fluid inside the receiver, and is the specific heat of the heat transfer fluid. For N number of solar collectors, the total solar irradiation will be:
The inlet exergy can be calculated by:
Finally, the heat stored in hot and cold thermal storage tanks can be calculated using the enthalpy of the heat transfer fluid and solar sunbathing time (SST) [38]:
where SST depends on the season and clouds. The time duration of this study was 11.71 h, which resulted in the choice of energy storage for a permanent operation at night.
The nanofluids of our study include graphene/ethylene glycol, and silver/ethylene glycol. A main reason for selecting these nanoparticles is their excellent and varied physical properties, which are higher in comparison with base fluids. The thermodynamic properties of base fluid “ethylene glycol” were obtained using EES software. Table 3 shows the thermodynamic properties of nanoparticles. In the present study, the volumetric concentration (φ) is equal to 6%. We calculated the thermal properties of nanofluids by applying the following Equations (13)–(16) [39,40]:
Table 3.
Thermal properties of the examined nanoparticles and base fluid [41,42].
As shown in Figure 1, both air and biomass, respectively, enter the biomass combustor at stage 7 and 8. Table 4 shows the biomass (rice husk) composition examined in this study. The chemical formula for complete biomass combustion with air is as follows:
where represents the fuel’s moisture content. For biomass fuel, the molar mass flow rate is as follows:
where, represents the molar mass of biomass and the energy supplied to an integrated system comes from solar system and biomass combustor. Biomass energy depends on the type of fuel and its mass flow rate.
where, lower heating value (LHV) of the biomass depends on the ultimate elemental composite and the moisture content in the biomass [43].
where HHV represents the higher heating value of the selected biomass [44].
where C, O, H, N and S show the elemental mass fractions in the selected biomass. The exergy of heat supplied by a biomass combustor can be calculated as follows:
Table 4.
Composition of Rice husk biomass [45].
The electrolyzer’s mathematical modeling is significant to estimate the hydrogen production rate using electrolysis, and we have used the equations to investigate the electrolyzer, which are given in a previous study [46]. When electrolysis is initiated, both heat and electricity are supplied to the electrolyzer for splitting water, as Figure 1 shows. For PEM electrolyzer, pure water is supplied using the desalinated water, which is provided by the MSF after heating in HEX-6, while the SRC turbines supply the electricity. The typical parameter values used in the PEM electrolyzer analysis are summarized in Table 5.
Table 5.
Input parameters used in PEM electrolyzer.
The output flow rate of produced hydrogen and oxygen from the electrolysis reaction can be computed as given below:
where F is the Faraday’s constant, and J is the current density. The PEM electrolyzer voltage can be expressed as follows:
where is the reversible potential, is the activation overpotential of the cathode, and is the activation over-potential of the anode. represents the electrolyte ohmic over-potential, and it is obtained as follows:
The overall ohmic resistance:
J0 represents the exchange current density.
where, is the activation energy of the anode and cathode, and is the pre-exponential factor.
To evaluate the proposed system’s performance, its energy efficiency is calculated. The current section shows the energy efficiencies of the subsystems and the integrated system, which can be described as follows:
To find the expression for exergy efficiency, we can substitute the energy terms in the above expressions. We can use the following relationships to determine the exergy efficiency for the overall system, and each subsystem.
3. Validation
In the absence of the experimental and theoretical results for a system similar to the proposed multigenerational system, it is difficult to show how accurate the results of total the studied system are. Consequently, the obtained results for the subsystems have been confirmed individually using theoretical and experimental data in the relevant literature. Accordingly, the effect of nanoparticle volume concentration on nanofluid thermal conductivity has been compared with experimental studies [48,49], as shown in Figure 2, and the effects of mass flow rate on CPC thermal efficiency have been compared with published experimental works [50,51], as shown in Figure 3. Thermal conductivity of nanofluids has 86% accuracy for graphene and 62.5% for silver, while for thermal efficiency between 0.01 kg/s and 0.07 kg/s flow rates, there is 97% accuracy for graphene and 79% for silver. The validity of results for the MSF desalination subsystem has also been compared with the results obtained by Eldessouky and Ettouney [34], as shown in Table 6. In addition, the required PEM Electrolyzer voltage has been compared with the results of Ioroi et al. [48], as depicted in Figure 4. Referring to mentioned results, good agreement is observed between the results obtained in the present study, and those reported previously in the literature.
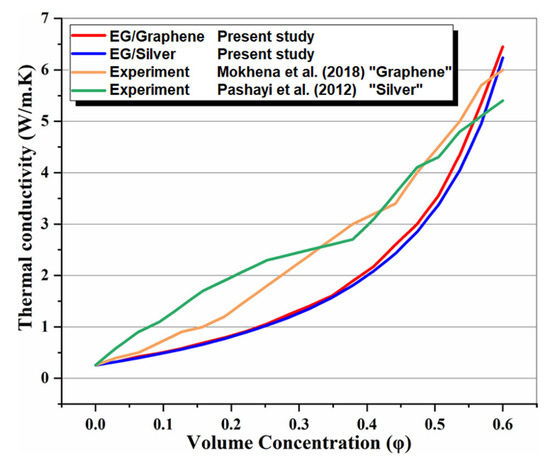
Figure 2.
Comparison of effect of nanoparticle volume concentration on nanofluid thermal conductivity with experimental studies [48,49].
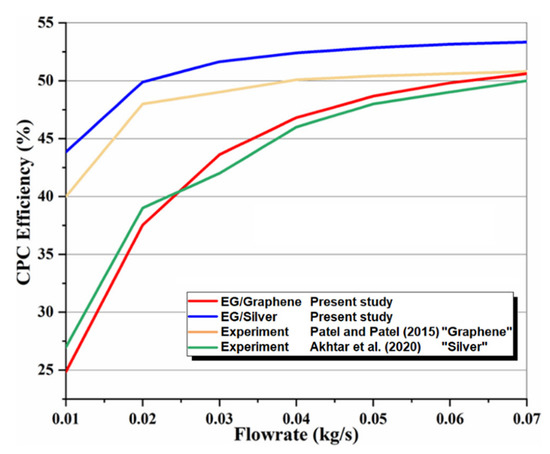
Figure 3.
Comparison of effect of mass flow rate on thermal efficiency with published experimental work [50,51].
Table 6.
Comparison of present study results with work of Eldessouky and Ettouney [34], to validate the MSF desalination subsystem.
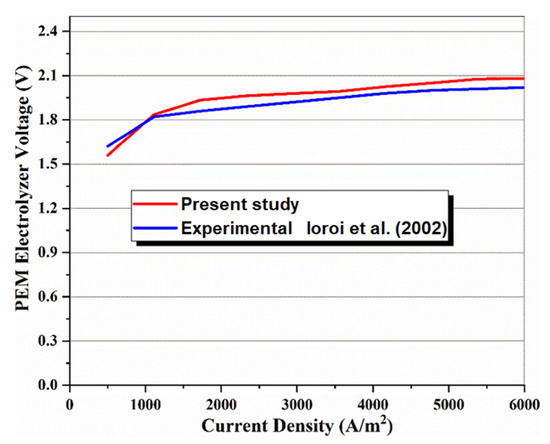
Figure 4.
Comparison of the present model with experimental data [52] to validate the PEM electrolyzer model [52].
4. Results and Discussion
The current section describes the numerical analysis of a biomass-solar energy driven multi-generation system, using the mathematical models presented in the previous section. The analyses were performed using the EES software under steady-state conditions. First, the performance parameters were calculated to conduct the system’s thermodynamic analysis. Then, the variable parameters were separately tested to determine their impact on the multigenerational system performance, which was analyzed in detail keeping in view the following conditions: ambient temperature 25 °C, ambient pressure 101.3 kPa, ORC and SRC turbine inlet pressure 12,500 kPa; isobutane as the working fluid in the ORC, and ethylene glycol (EG) as the base fluid in the solar cycle. The solar direct normal irradiation intensity (Gt) is 0.96 kW/m2; the monthly average daily maximum irradiation during the summer season, obtained during experimental work at the University of Karabuk. The mass flowrate, pressure, enthalpy, temperature, exergy, and entropy for all states in the multi-generation system, were calculated and presented in Table 7. Table 8 shows the results of the thermodynamic evaluation for the integrated system and the subsystems.
Table 7.
Thermodynamic properties at each state of the proposed system under the basic design conditions.
Table 8.
Thermodynamic assessment results for the multi-generation system.
As shown in Table 9, comparisons are made between two types of nanofluids and pure thermal oil for the solar cycle, including graphene, silver and EG base fluid. It becomes clear that the existence of nanoparticles in a base fluid positively affects the solar system in particular, and the integrated system in general. The outlet temperature and mass flow rate increase within the CPC receiver tube because nanoparticles are added to the base fluid. The output temperature increased from 170 °C with EG, to 197.6 °C with graphene–EG. Likewise, the mass flow inside the solar collector increased from 0.01429 kg/s with EG, to 0.09322 kg/s with silver–EG. Both energy and exergy efficiencies were tested for a multi-generation system using different working fluids of the solar system, respectively, which were 34.72% and 20.73% with EG, 35.6% and 21.15% with graphene–EG, and 35% and 20.86% with silver–EG.
Table 9.
Thermodynamic assessment results with different heat transfer fluids in CPC.
Exergy destruction describes the magnitude, location, and effect of irreversibility in a system and its subsystems. The exergy destruction in sub-systems at the base operation conditions is shown in Figure 5. It is an indication of whether the system is properly functioning or not. In other words, identifying and reducing the source of high exergy destruction can improve system performance. The greatest exergy destruction rate occurred in the SRC at approximately 15.5 MW (49.4%), which the ORC follows at more than 9 MW (29.3%). In contrast, the other subsystems have fewer values of exergy destruction. Obviously, some results stay the same when the absorbing fluid used in the solar cycle is changed because solar energy is not our proposed system’s only form of energy. In general, graphene–EG working fluid gives the best results for the solar cycle.
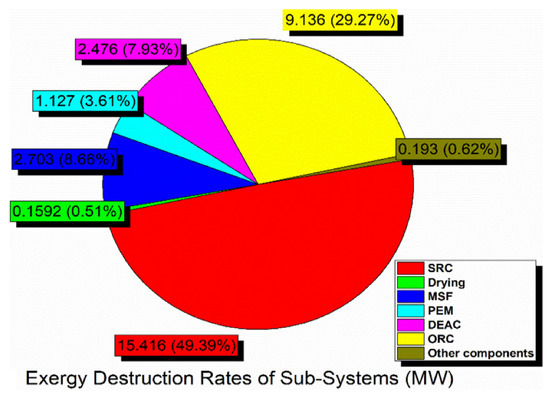
Figure 5.
Exergy destruction pie diagram in the various subsystems of the integrated system.
4.1. Effect of Nanoparticles’ Volume Concentration
The effect of nanoparticle volume concentration on the thermal conductivity of nanofluid is illustrated in Figure 6 and compared with the results achieved by previous studies. It is obvious that increasing the concentration of nanoparticles, increases the thermal conductivity of the nanofluid. The trend of this thermal property is due to the fact that the thermal conductivity of the nanoparticles, is higher than that of the base fluid (EG). It can also be observed that a graphene-based nanofluid has higher thermal conductivity than silver.
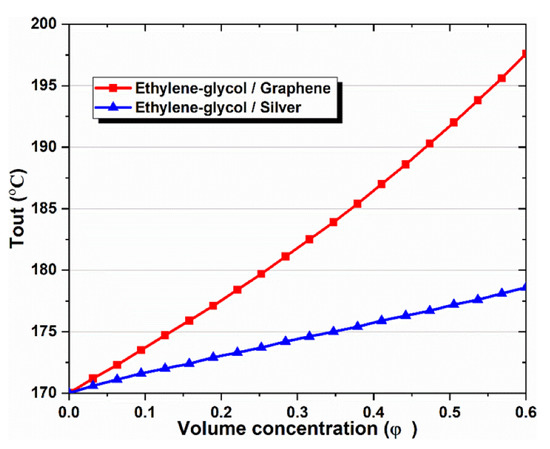
Figure 6.
Effect of nanoparticle volume concentration on the outlet temperature of CPC.
It is important to note that both nanofluids have higher thermal conductivity than pure thermal oil (φ = 0%). This observation shows that using metallic nanoparticles within the base fluid increases thermal conductivity, and therefore increases the rate of heat transfer in the flow. Moreover, the trend of the present study results is in agreement with Ref’s [48,49], and confirms the accuracy of the present model.
After determining the results of the multi-generation system for basic operating parameters, we investigated the effect of using two nanofluid types (Graphene–EG, Silver–EG) on the overall system. The volume fraction ranged between 0% and 6%. Zero concentration means using base fluid.
Figure 7a–d show curves that exhibit similarities and can be analyzed in comparison with each other. These figures indicate the collector outlet temperature, energy efficiency, exergy efficiency, cooling production, power production, and heat. It should be noted that nanofluids improve all the indicators in all cases, and an increase in their concentration also increases the values of indicators. Moreover, it is important to state that graphene–EG is the best nanofluid and its increase is significantly larger than silver–EG, which shows relatively little improvement. This result is obtained because graphene-based nanofluid shows the highest thermal conductivity and relatively high specific heat, while silver shows the highest density value.
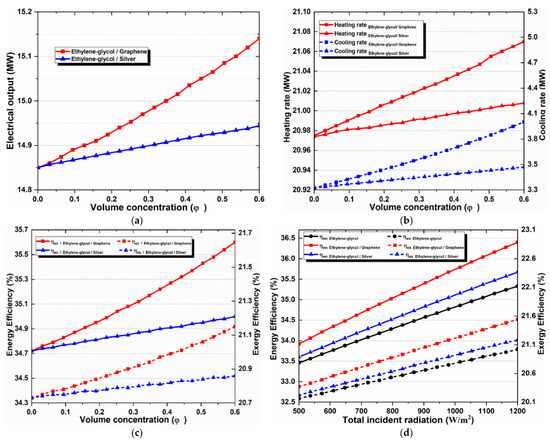
Figure 7.
Effects of (a) nanoparticle volume concentration on the net electricity production, (b) nanoparticle volume concentration on heating and cooling loads, (c) nanoparticle concentration on overall energy and exergy efficiencies, and (d) solar irradiation on overall energy and exergy efficiencies.
4.2. Effect of Solar Irradiation
The impact of total incident radiation on the system performance is another significant parameter. Figure 8 compares pure thermal oil and two different types of nanofluids, which shows the effect of the total incident radiation on a multi-generation system’s exergy and energy efficiencies. It is obvious that both system efficiencies increase when solar radiation rises from 500 to 1200 W/m2. We expected a spike in overall efficiencies because higher solar irradiation results in greater heat transmission to the selected working fluid, which also increases temperature transfer to the subsystems, resulting in higher system performance. Moreover, we can observe that the energy and exergy efficiencies improved with nanofluids, and the effect of graphene nanoparticles was the best. This happens because graphene nanoparticles have relatively high specific heat capacity and thermal conductivity, which increases the energy absorption efficiency of the solar collector and assures a higher outlet temperature, as shown in Table 8. Consequently, greater useful energy will be gained, and the overall efficiency of the multi-generation system will increase more than the energy it will gain, when other absorption fluids are applied.
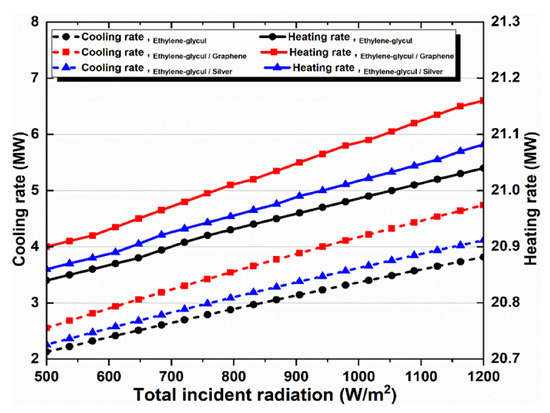
Figure 8.
Effect of solar irradiation on heating and cooling loads.
Figure 8 illustrates how solar radiation affects cooling and heating rates for all the investigated working fluids in the solar system. Higher solar radiation results in a linear rise in cooling and heating. The cooling and heating rates curves are shown in Figure 8, which are similar to the energy and exergy efficiency curves shown in Figure 7c. It proves that a direct relationship exists between their values.
4.3. Effect of Ambient Temperature
Ambient temperature affects exergy destruction rates, so we studied the overall energy and exergy efficiencies for a detailed analysis of the subsystems and the overall system. In this study, the ambient temperature ranged from 10 °C to 40 °C, and the effect of this increase on the subsystems’ exergy destruction rates is shown in Figure 9. Obviously, the SRC and ORC subsystems exhibited the top exergy destruction rates, followed by the MSF and DEAC subsystems, but both PEM and drying subsystems had the lowest rates.
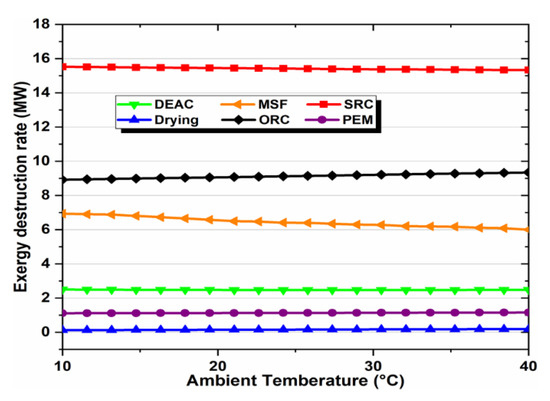
Figure 9.
Effect of ambient temperature on exergy destruction rates of subsystems.
The ambient temperature affects the multi-generation system’s performance by applying different working fluids, as shown in Figure 10. It is obvious that rising ambient temperature increases the overall exergy efficiency, irrespective of the type of absorbent fluid, while showing an inconsiderable impact on the system’s overall energy efficiency; therefore, the overall energy efficiency remained almost constant despite increasing ambient temperature, as only changing the ambient temperature in response to a single value of all parameters causes this. In addition, when nanofluid types were compared, graphene–EG showed superior exergy efficiency. It can also be noted that nanoparticles in the base fluid positively affect the multi-generation system performance.
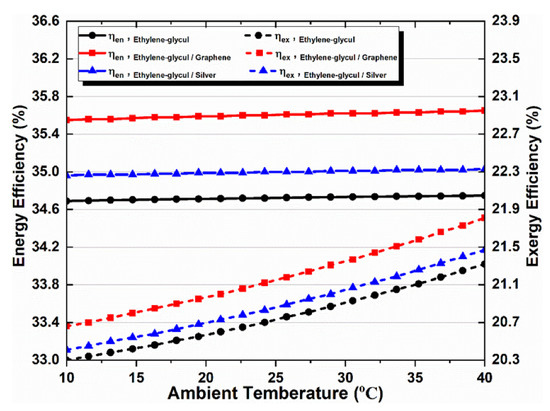
Figure 10.
Effect of ambient temperature on overall energy and exergy efficiencies.
4.4. Effect of Output Temperature of Biomass Combustor
The outlet temperature of a biomass combustor is very important for the multi-generation system design. We noted this temperature and analyzed the effect of its change on the system performance. The outlet temperature remained within the range of 600–800 °C. The energy and exergy efficiencies increase when it increases, which satisfies thermodynamic principles. In addition, we noticed that raising the output temperature of a biomass combustor and using nanofluids in the solar cycle improves the proposed system performance, compared to the basic fluid’s performance. We can also observe that the nanofluid behavior, shown in Figure 11, matches the behavior which has been depicted in the given figures. Graphene-based nanofluids showed peak performance enhancement, followed by silver-based nanofluids and the EG base fluid.
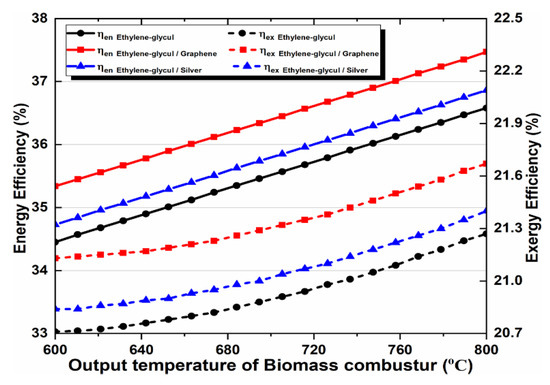
Figure 11.
Effect of biomass combustor outlet temperature on energy and exergy efficiency.
5. Conclusions
This study aims to conduct the energy and exergy analyses of a new biomass-solar multi-generation system, which produces power, hydrogen, cooling, drying, fresh water, and hot water. We conducted a comparative analysis to assess the nanofluids’ effectiveness in the solar cycle on the integrated system performance, the impact of ambient conditions, and some significant parameters. Graphene and silver are the selected nanoparticles in an ethylene glycol base fluid in the solar field. Several parameters, such as solar irradiation, biomass combustor outlet temperature, ambient temperature, and nanoparticle volume concentration, were also individually investigated to assess their effects on the overall system performance. The summary of the main results is given below:
- Nanofluids have been observed to increase a solar collector’s outlet temperature, compared to thermal oils. The highest CPC outlet temperature was achieved with graphene–EG at 197.6 °C, while the lowest temperature was obtained with the EG base fluid at 170 °C.
- The highest exergy destruction rate in the SRC subsystem was 15 MW, while the lowest value was approximately 0.16 MW in the drying system; therefore, the integrated system’s overall exergy performance can be improved by working on certain subsystems that have higher exergy destruction rates.
- The highest efficiencies were achieved for the system as a whole and its subsystems when the following substances were used in the working fluids:
- The SRC subsystem’s energy and exergy efficiencies using graphene–EG were 40.21% and 79.08%, respectively.
- The multi-generation system’s overall energy and exergy efficiencies using graphene–EG were 35.6% and 21.15%, respectively.
- The CPC subsystem’s energy and exergy efficiencies using graphene–EG were 50.75% and 15.82%, respectively.
- The drying subsystem’s energy and exergy efficiencies were 71.17% and 38.57%, respectively.
- The DEAC subsystem’s COP and exergy efficiencies using EG were 0.9922 and 24.77%, respectively.
- The ORC subsystem’s energy and exergy efficiencies were 29.45% and 40.2%, respectively.
- The MSF subsystem’s energy and exergy efficiencies were 38.72% and 8.233%, respectively.
- The PEM subsystem’s energy and exergy efficiencies were 67.94% and 56.93%, respectively.
- In the proposed system, the SRC subsystem is the main exergy destruction source, which loses nearly 50% of the total exergy, therefore, it is necessary to carefully modify its design to improve the overall system’s performance.
- The freshwater production by the desalination subsystem is 37.83 kg/s, and the hydrogen production by PEM electrolyzer is 44.78 kg/h.
- As shown by parametric studies, ambient temperature, solar irradiation, output temperature of biomass combustor, types of nanofluids and their volume concentration have a highly considerable effect on the proposed system’s overall efficiency.
Author Contributions
Conceptualization, A.G.G. and M.K.; methodology, A.A.I. and G.K.D.; software, A.A.I.; validation, A.A.I.; formal analysis, A.A.I. and M.K.; investigation, M.K., A.G.G. and A.K.; resources, A.A.I. and M.K.; data curation, M.K.; writing—original draft preparation, G.K.D.; writing—review and editing, A.A.I., M.K., A.G.G., G.K.D. and A.K.; visualization, A.K.; supervision, M.K. and A.G.G.; funding acquisition, M.K. All authors have read and agreed to the published version of the manuscript.
Funding
This research received no external funding.
Data Availability Statement
Not applicable.
Conflicts of Interest
The authors declare no conflict of interest.
Nomenclature
| A | Area, m2 |
| Cp | Specific heat capacity, kJ/kg·K |
| Ėx | Exergy rate, kW |
| FR | Heat removal factor |
| Gt | Total solar irradiation, W/m2 |
| h | Enthalpy, kJ/kg |
| HHV | Higher heating value, MJ/kg |
| k | Thermal conductivity, W/m·K |
| LHV | Lower heating value, MJ/kg |
| Heat transfer rate, kW | |
| S | Absorbed radiation, W/m2 |
| UL | Heat loss coefficient, W/m2·K |
| Subscripts | |
| abs | Absorber |
| bf | Base fluid |
| en | Energy |
| ex | Exergy |
| nf | Nanofluid |
| np | Nanoparticle |
| Greek Letters | |
| ρ | Density, kg/m3 |
| η | Efficiency, % |
| μ | Viscosity, kg/m·s |
| Transmissivity | |
| φ | Nanoparticle volume concentration |
| Acronyms | |
| CPC | Compound parabolic collector |
| CSP | Concentrated solar power |
| CFWH | Closed feed water heater |
| DEAC | Double effect absorption cycle |
| EG | Ethylene glycol |
| Expansion valve | |
| HEX | Heat exchanger |
| HPT | High pressure turbine |
| HTG | High temperature generator |
| HTHEX | High temperature heat exchanger |
| LiBr-H2O | Lithium Bromide solution |
| LPT | Low pressure turbine |
| LTHEX | Low temperature heat exchanger |
| MSF | Multi-stage flash distillation |
| ORC | Organic Rankine cycle |
| OFWH | Open feed water heater |
| SRC | Steam Rankine cycle |
References
- Owusu, P.A.; Sarkodie, S.A. A Review of Renewable Energy Sources, Sustainability Issues and Climate Change Mitigation. Cogent Eng. 2016, 3, 1167990. [Google Scholar] [CrossRef]
- Dincer, I. Renewable Energy and Sustainable Development: A Crucial Review. Renew. Sustain. Energy Rev. 2000, 4, 157–175. [Google Scholar] [CrossRef]
- Panwar, N.L.; Kaushik, S.C.; Kothari, S. Role of Renewable Energy Sources in Environmental Protection: A Review. Renew. Sustain. Energy Rev. 2011, 15, 1513–1524. [Google Scholar] [CrossRef]
- Kumar, M. Social, Economic, and Environmental Impacts of Renewable Energy Resources. In Wind Solar Hybrid Renewable Energy System; Okedu, K.E., Tahour, A., Aissaou, A.G., Eds.; IntechOpen: London, UK, 2020. [Google Scholar] [CrossRef]
- McCrone, A.; Ajadi, T.; Boyle, R.; Strahan, D.; Kimmel, M.; Collins, B.; Cheung, A.; Becker, L. Global Trends in Renewable Energy Investment 2019; Bloomberg New Energy Finance: London, UK, 2019; Volume 76. [Google Scholar]
- Dincer, I.; Zamfirescu, C. Renewable-energy-based Multigeneration Systems. Int. J. Energy Res. 2012, 36, 1403–1415. [Google Scholar] [CrossRef]
- Azhar, M.S.; Rizvi, G.; Dincer, I. Integration of Renewable Energy Based Multigeneration System with Desalination. Desalination 2017, 404, 72–78. [Google Scholar] [CrossRef]
- Fernández-García, A.; Zarza, E.; Valenzuela, L.; Pérez, M. Parabolic-Trough Solar Collectors and Their Applications. Renew. Sustain. Energy Rev. 2010, 14, 1695–1721. [Google Scholar] [CrossRef]
- Xu, D.; Qu, M. Compound Parabolic Concentrators in Solar Thermal. Energy Sustain. 2013, 55515, V001T01A013. [Google Scholar]
- Pranesh, V.; Velraj, R.; Christopher, S.; Kumaresan, V. A 50 Year Review of Basic and Applied Research in Compound Parabolic Concentrating Solar Thermal Collector for Domestic and Industrial Applications. Sol. Energy 2019, 187, 293–340. [Google Scholar] [CrossRef]
- Cioccolanti, L.; Hamedani, S.R.; Villarini, M. Environmental and Energy Assessment of a Small-Scale Solar Organic Rankine Cycle Trigeneration System Based on Compound Parabolic Collectors. Energy Convers. Manag. 2019, 198, 111829. [Google Scholar] [CrossRef]
- Cioccolanti, L.; Villarini, M.; Tascioni, R.; Bocci, E. Performance Assessment of a Solar Trigeneration System for Residential Applications by Means of a Modelling Study. Energy Procedia 2017, 126, 445–452. [Google Scholar] [CrossRef]
- Shahid, U.B.; Bicer, Y.; Ahzi, S.; Abdala, A. Thermodynamic Assessment of an Integrated Renewable Energy Multigeneration System Including Ammonia as Hydrogen Carrier and Phase Change Material Energy Storage. Energy Convers. Manag. 2019, 198, 111809. [Google Scholar] [CrossRef]
- Jiangjiang, W.; Yang, Y. Energy, Exergy and Environmental Analysis of a Hybrid Combined Cooling Heating and Power System Utilizing Biomass and Solar Energy. Energy Convers. Manag. 2016, 124, 566–577. [Google Scholar] [CrossRef]
- Sarkis, R.B.; Zare, V. Proposal and Analysis of Two Novel Integrated Configurations for Hybrid Solar-Biomass Power Generation Systems: Thermodynamic and Economic Evaluation. Energy Convers. Manag. 2018, 160, 411–425. [Google Scholar] [CrossRef]
- Hashemian, N.; Noorpoor, A. Assessment and Multi-Criteria Optimization of a Solar and Biomass-Based Multi-Generation System: Thermodynamic, Exergoeconomic and Exergoenvironmental Aspects. Energy Convers. Manag. 2019, 195, 788–797. [Google Scholar] [CrossRef]
- Cao, Y.; Rad, H.N.; Jamali, D.H.; Hashemian, N.; Ghasemi, A. A Novel Multi-Objective Spiral Optimization Algorithm for an Innovative Solar/Biomass-Based Multi-Generation Energy System: 3E Analyses, and Optimization Algorithms Comparison. Energy Convers. Manag. 2020, 219, 112961. [Google Scholar] [CrossRef]
- Soteris, K. Solar Energy Engineering: Processes and Systems, 2nd ed.; Elsevier: Amsterdam, The Netherlands, 2013. [Google Scholar] [CrossRef]
- Kim, D.S.; Infante Ferreira, C.A. Solar Refrigeration Options—A State-of-the-Art Review. Int. J. Refrig. 2008, 31, 3–15. [Google Scholar] [CrossRef]
- Neeraj, K.; Singh, P.; Redhewal, A.K.; Bhandari, P. A Review on Nanofluids Applications for Heat Transfer in Micro-Channels. Procedia Eng. 2015, 127, 1197–1202. [Google Scholar] [CrossRef]
- Farhana, K.; Kadirgama, K.; Rahman, M.M.; Ramasamy, D.; Noor, M.M.; Najafi, G.; Samykano, M.; Mahamude, A.S.F. Improvement in the Performance of Solar Collectors with Nanofluids—A State-of-the-Art Review. Nano-Struct. Nano-Objects 2019, 18, 100276. [Google Scholar] [CrossRef]
- Moradi, A.; Sani, E.; Simonetti, M.; Francini, F.; Chiavazzo, E.; Asinari, P.; Torino, P. CFD Modeling of Solar Collector with Nano-Fluid Direct Absorption for Civil Application. In Proceedings of the MicrogenIII: The 3rd International Conference on Microgeneration and Related Technologies, Napoli, Italy, 15–17 April 2013. [Google Scholar]
- Toghyani, S.; Afshari, E.; Baniasadi, E.; Shadloo, M.S. Energy and Exergy Analyses of a Nanofluid Based Solar Cooling and Hydrogen Production Combined System. Renew. Energy 2019, 141, 1013–1025. [Google Scholar] [CrossRef]
- Boyaghchi, F.A.; Chavoshi, M.; Sabeti, V. Optimization of a Novel Combined Cooling, Heating and Power Cycle Driven by Geothermal and Solar Energies Using the Water/CuO (Copper Oxide) Nanofluid. Energy 2015, 91, 685–699. [Google Scholar] [CrossRef]
- Li, T.; Li, X.; Gao, H.; Gao, X.; Meng, N. Thermodynamic Performance of Geothermal Energy Cascade Utilization for Combined Heating and Power Based on Organic Rankine Cycle and Vapor Compression Cycle. Energies 2022, 15, 7294. [Google Scholar] [CrossRef]
- Ji, J.; Zhang, J.; Jia, X.; Ji, R.; Sheng, Z.; Qin, J.; Zhao, H.; Tang, J.; Su, J.; Wang, Y. A Working Fluid Assessment for a Biomass Organic Rankine Cycle under Different Conditions. Energies 2022, 15, 7076. [Google Scholar] [CrossRef]
- Khan, B.; Kim, M.H. Energy and Exergy Analyses of a Novel Combined Heat and Power System Operated by a Recuperative Organic Rankine Cycle Integrated with a Water Heating System. Energies 2022, 15, 6658. [Google Scholar] [CrossRef]
- Muhammad, A.; Ratlamwala, T.A.H.; Uğur, A. Comparative Energy, Exergy, and Environmental Analyses of Parabolic Trough Solar Thermal Power Plant Using Nanofluids. In Exergy for a Better Environment and Improved Sustainability 1; Aloui, F., Dincer, I., Eds.; Green Energy and Technology; Springer: Cham, Switzerland, 2018; pp. 943–967. [Google Scholar]
- Evangelos, B.; Tzivanidis, C. Performance Analysis and Optimization of an Absorption Chiller Driven by Nanofluid Based Solar Flat Plate Collector. J. Clean. Prod. 2018, 174, 256–272. [Google Scholar] [CrossRef]
- Faizal, M.; Saidur, R.; Mekhilef, S.; Alim, M.A. Energy, Economic and Environmental Analysis of Metal Oxides Nanofluid for Flat-Plate Solar Collector. Energy Convers. Manag. 2013, 76, 162–168. [Google Scholar] [CrossRef]
- Ibrahim, A.; Kayfeci, M. Comparative Analysis of a Solar Trigeneration System Based on Parabolic Trough Collectors Using Graphene and Ferrofluid Nanoparticles. Therm. Sci. 2020, 25, 164. [Google Scholar] [CrossRef]
- Lin, L.; Liu, Z.H.; Xiao, H.S. Thermal Performance of an Open Thermosyphon Using Nanofluids for High-Temperature Evacuated Tubular Solar Collectors. Part 1: Indoor Experiment. Sol. Energy 2011, 85, 379–387. [Google Scholar] [CrossRef]
- Liu, Z.H.; Hu, R.L.; Lu, L.; Zhao, F.; Xiao, H.S. Thermal Performance of an Open Thermosyphon Using Nanofluid for Evacuated Tubular High Temperature Air Solar Collector. Energy Convers. Manag. 2013, 73, 135–143. [Google Scholar] [CrossRef]
- El-Dessouky, H.T.; Ettouney, H.M. Fundamentals of Saltwater Desalination, 1st ed.; Elsevier: Amsterdam, The Netherlands, 2002. [Google Scholar]
- Li, Z.; Wu, W.; Wang, J.; Zhang, B.; Zheng, T. Transmission-Constrained Unit Commitment Considering Combined Electricity and District Heating Networks. IEEE Trans. Sustain. Energy 2016, 7, 480–492. [Google Scholar] [CrossRef]
- Zheng, W.; Zhu, J.; Luo, Q. Distributed dispatch of integrated electricity-heat systems with variable mass flow. IEEE Trans. Smart Grid 2022, 1. [Google Scholar] [CrossRef]
- Klein, S.A. Operating Systems 2017. EES: Engineering Equation Solver (Version 10.190) [Computer Software]. Available online: http://www.fchartsoftware.com (accessed on 1 January 2020).
- Hamoda, G.; Ozcan, H. Multi-Objective Optimization of a Concentrated Solar Energy Driven Trigeneration Plant with Thermal Energy Storage: A Case Study for Turkey. Case Stud. Therm. Eng. 2020, 20, 100642. [Google Scholar] [CrossRef]
- Subramani, J.; Nagarajan, P.K.; Mahian, O.; Sathyamurthy, R. Efficiency and Heat Transfer Improvements in a Parabolic Trough Solar Collector Using TiO2 Nanofluids under Turbulent Flow Regime. Renew. Energy 2018, 119, 19–31. [Google Scholar] [CrossRef]
- Ebaid, M.S.Y.; Ghrair, A.M.; Al-Busoul, M. Experimental Investigation of Cooling Photovoltaic (PV) Panels Using (TiO2) Nanofluid in Water-Polyethylene Glycol Mixture and (Al2O3) Nanofluid in Water- Cetyltrimethylammonium Bromide Mixture. Energy Convers. Manag. 2018, 155, 324–343. [Google Scholar] [CrossRef]
- Bellos, E.; Tzivanidis, C. A Review of Concentrating Solar Thermal Collectors with and without Nanofluids. J. Therm. Anal. Calorim. 2019, 135, 763–786. [Google Scholar] [CrossRef]
- Pop, E.; Varshney, V.; Roy, A.K. Thermal Properties of Graphene: Fundamentals and Applications. MRS Bull. 2012, 37, 1273–1281. [Google Scholar] [CrossRef]
- Koppejan, J.; Loo, S.V. The Handbook of Biomass Combustion and Co-Firing, 1st ed.; Routledge: London, UK, 2007; p. 464. [Google Scholar]
- Capareda, S.C. Biomass Energy Conversion. In Sustainable Growth and Applications in Renewable Energy Sources; Nayeripour, M., Kheshti, M., Eds.; IntechOpen: London, UK, 2011; pp. 209–226. [Google Scholar]
- Basu, P. Combustion and Gasification in Fluidized Beds, 1st ed.; CRC Press: Boca Raton, FL, USA; Taylor and Francis: Abingdon, UK, 2006. [Google Scholar]
- Ni, M.; Leung, M.K.H.; Leung, D.Y.C. Electrochemistry Modeling of Proton Exchange Membrane (PEM) Water Electrolysis for Hydrogen Production. In Proceedings of the 16th World Hydrogen Energy Conference (WHEC16), Lyon, France, 13–16 June 2006; pp. 33–39. [Google Scholar]
- Yosaf, S.; Ozcan, H. Exergoeconomic Investigation of Flue Gas Driven Ejector Absorption Power System Integrated with PEM Electrolyser for Hydrogen Generation. Energy 2018, 163, 88–99. [Google Scholar] [CrossRef]
- Mokhena, T.C.; Mochane, M.J.; Sefadi, J.S.; Motloung, S.V.; Andala, D.M. Thermal Conductivity of Graphite-Based Polymer Composites. In Impact of Thermal Conductivity on Energy Technologies; Shahzad, A., Ed.; IntechOpen: London, UK, 2018; Volume 181. [Google Scholar] [CrossRef]
- Pashayi, K.; Fard, H.R.; Lai, F.; Iruvanti, S.; Plawsky, J.; Borca-Tasciuc, T. High Thermal Conductivity Epoxy-Silver Composites Based on Self-Constructed Nanostructured Metallic Networks. J. Appl. Phys. 2012, 111, 104310. [Google Scholar] [CrossRef]
- Patel, D.S.; Patel, D.K. Thermal Analysis of Compound Parabolic Concentrator. Int. J. Mech. Prod. Eng. Res. Dev 2015, 5, 117–126. [Google Scholar]
- Akhtar, F.; Ali, M.; Sheikh, N.; Shehryar, M. Experimental Investigation of Solar Compound Parabolic Collector Using Al2O3/H2O Nanofluid in a Subtropical Climate. Therm. Sci. 2020, 25, 201. [Google Scholar] [CrossRef]
- Ioroi, T.; Yasuda, K.; Siroma, Z.; Fujiwara, N.; Miyazaki, Y. Thin film electrocatalyst layer for unitized regenerative polymer electrolyte fuel cells. J. Power Sources 2002, 112, 583–587. [Google Scholar] [CrossRef]


Publisher’s Note: MDPI stays neutral with regard to jurisdictional claims in published maps and institutional affiliations. |
© 2022 by the authors. Licensee MDPI, Basel, Switzerland. This article is an open access article distributed under the terms and conditions of the Creative Commons Attribution (CC BY) license (https://creativecommons.org/licenses/by/4.0/).