Article

Experimental Investigation on the Effect of the Staggered Impeller on the Unsteady Pressure Pulsations Characteristic in a Pump

1
School of Energy and Power Engineering, Jiangsu University, Zhenjiang 212013, China
2
Shanghai Kaiquan Pump (Group) Co., Ltd., Shanghai 201800, China
3
Shanghai Marine Equipment Research Institute (SMERI), Shanghai 200031, China
*
Author to whom correspondence should be addressed.
Energies 2022, 15(23), 8912; https://doi.org/10.3390/en15238912
Submission received: 3 October 2022 / Revised: 20 November 2022 / Accepted: 23 November 2022 / Published: 25 November 2022
(This article belongs to the Special Issue Complex Flow in Fluid Machinery)

Abstract

:
High−energy pressure pulsation induced by rotor−stator interaction (RSI) is the primary source of flow−induced vibration noise in the pump, affecting the pump’s stability and system operation. In order to find an effective method to suppress the pressure pulsation in the pump caused by RSI, a new staggered impeller is proposed in this paper, which can significantly suppress the pressure pulsation energy. The unsteady pressure pulsation characteristic of the original impeller and the staggered impeller scheme are measured and analyzed under different working flow conditions. The results show that although the hydraulic performance of the model pump decreases to a certain extent when the staggered impeller is used, the pressure pulsation energy in the pump decreases significantly. Under 0.8QN–1.2QN working flow conditions, the energy suppression effect of the blade passing frequency (fbpf) amplitude is higher than 80% with the staggered impeller scheme. The Root Mean Square (RMS) values for distribution of pressure pulsation in different frequency bands varies greatly, and the pressure pulsation energy near the tongue is prominent. On a broader frequency band (0–6 fbpf), the pressure pulsation energy of the staggered impeller scheme is smaller than that of the original impeller scheme. With the expansion of the frequency band, the pressure pulsation energy decreased steadily, with a minimum decrease of 37.33%.

1. Introduction

As the essential equipment for energy conversion, pumps are widely used in various industries, which require high stability during operation to meet the diversity of working environments [1,2]. For centrifugal pumps, the pressure pulsation caused by unsteady hydraulic excitation induced by rotor−stator interaction (RSI) is the primary source of pump vibration and radiation noise [3]. The high−energy pressure pulsation of the interference frequency may directly affect the entire system’s stability and endanger the concealment of related underwater equipment [4,5]. Therefore, in the design process of the centrifugal pump, how to effectively suppress the pressure pulsation intensity while ensuring high efficiency has always been the focus of research.
Frequency spectrum analysis is the most commonly used method for analyzing unsteady signals in pumps. Many scholars obtain pressure pulsation characteristics in pumps through frequency spectrum analysis. Spence R, et al. [6,7] used the frequency spectrum to analyze the pressure fluctuation signals of centrifugal pumps measured by numerical calculation and experiment, and extracted the characteristic frequency. Through the analysis of spectrum characteristics, it was found that the pressure pulsation intensity near the impeller outlet and the tongue is larger, which can better reflect the pressure pulsation characteristics inside the pump. Zhang, et al. [8] studied the pressure fluctuation characteristics of a centrifugal pump with a side−wall pressurized water chamber under the rotating stall condition by frequency spectrum analysis. Friedrichs J, et al. [9] studied the spectral characteristics of pressure pulsation before and after cavitation in centrifugal pumps. Gonzalez J, et al. [10] studied the distribution of pressure pulsation amplitude along the circumferential direction of the volute at the blade frequency. The spectrum distribution shows that the pressure pulsation amplitude is the largest in the downstream area near the tongue. With the increase in the cross−sectional area of the volute, the pressure pulsation amplitude decreases.
After continuous research, various technical means and methods for suppressing the pressure pulsation in the pump have been formed. Johann Friedrich Gülich [11] proposed the matching method between the moving and stationary blades based on the RSI theory, which has a strong representative significance. As confirmed by many researchers, it has gradually become a mature theory applied to centrifugal pump design [12,13]. Scholars researched the matching of impeller and stator and found that using a unique impeller structure can effectively improve the internal pressure pulsation of a centrifugal pump [14,15,16,17]. AlQutb, et al. [18] conducted V−shaped cutting on the blade’s trailing edge. They studied its influence on pressure pulsation in the centrifugal pump, indicating that this method can effectively reduce the energy of pressure pulsation in the pump. Gao B, et al., [19] also cut the blade trailing edge at five different angles to explore the influence of different trailing edge shapes on the pressure pulsation in the pump. Research showed that the pressure pulsation amplitude decreases by about 7% at the blade passing frequency (fbpf). Kergourlay G, et al. [20] confirmed that using long and short blades can effectively improve the jet−wake structure at the impeller outlet, thereby reducing the pressure pulsation energy of the pump. In addition, Zhang, et al. [21,22] proposed a special slope volute. Through the experimental comparison with the traditional spiral volute, the positive effect of the volute on suppressing the pressure pulsation in the pump was verified.
The pressure pulsation energy in the pump can be suppressed to a certain extent by the above−mentioned various technical means. However, the suppression effect of the high−amplitude low−frequency interference pressure pulsation energy induced by the impeller−tongue RSI is not apparent. Therefore, the primary purpose of this study is to find an impeller structure with staggered blades and to explore the energy distribution characteristics of pressure pulsation in the pump under different working conditions. This kind of staggered arrangement of blades has achieved well−tested results in double−suction impellers. R. Spence, et al. [6,7] studied the double−suction pump original impeller and two different staggered angles impellers based on the experimental method. It was found that the uniform staggered blades can effectively suppress the pressure pulsation energy in the pump, but the effect of the staggered structure in the single−suction pump needs to be further confirmed.
In this paper, a low specific speed single−suction centrifugal pump is taken as the research object, and the experimental research on the unsteady pressure pulsation characteristics of the original impeller and staggered impeller model pump is carried out under various working flow conditions. The pressure signal is obtained through 20 high−precision pressure pulsation sensors installed on the wall of the volute, and the signal components are analyzed in detail. Further, a comparative analysis of the pressure pulsation energy distribution in the pump with different impeller models is carried out. The experimental results can provide an effective reference for the optimal pump design with low−pressure pulsation energy.

2. Experimental Setup

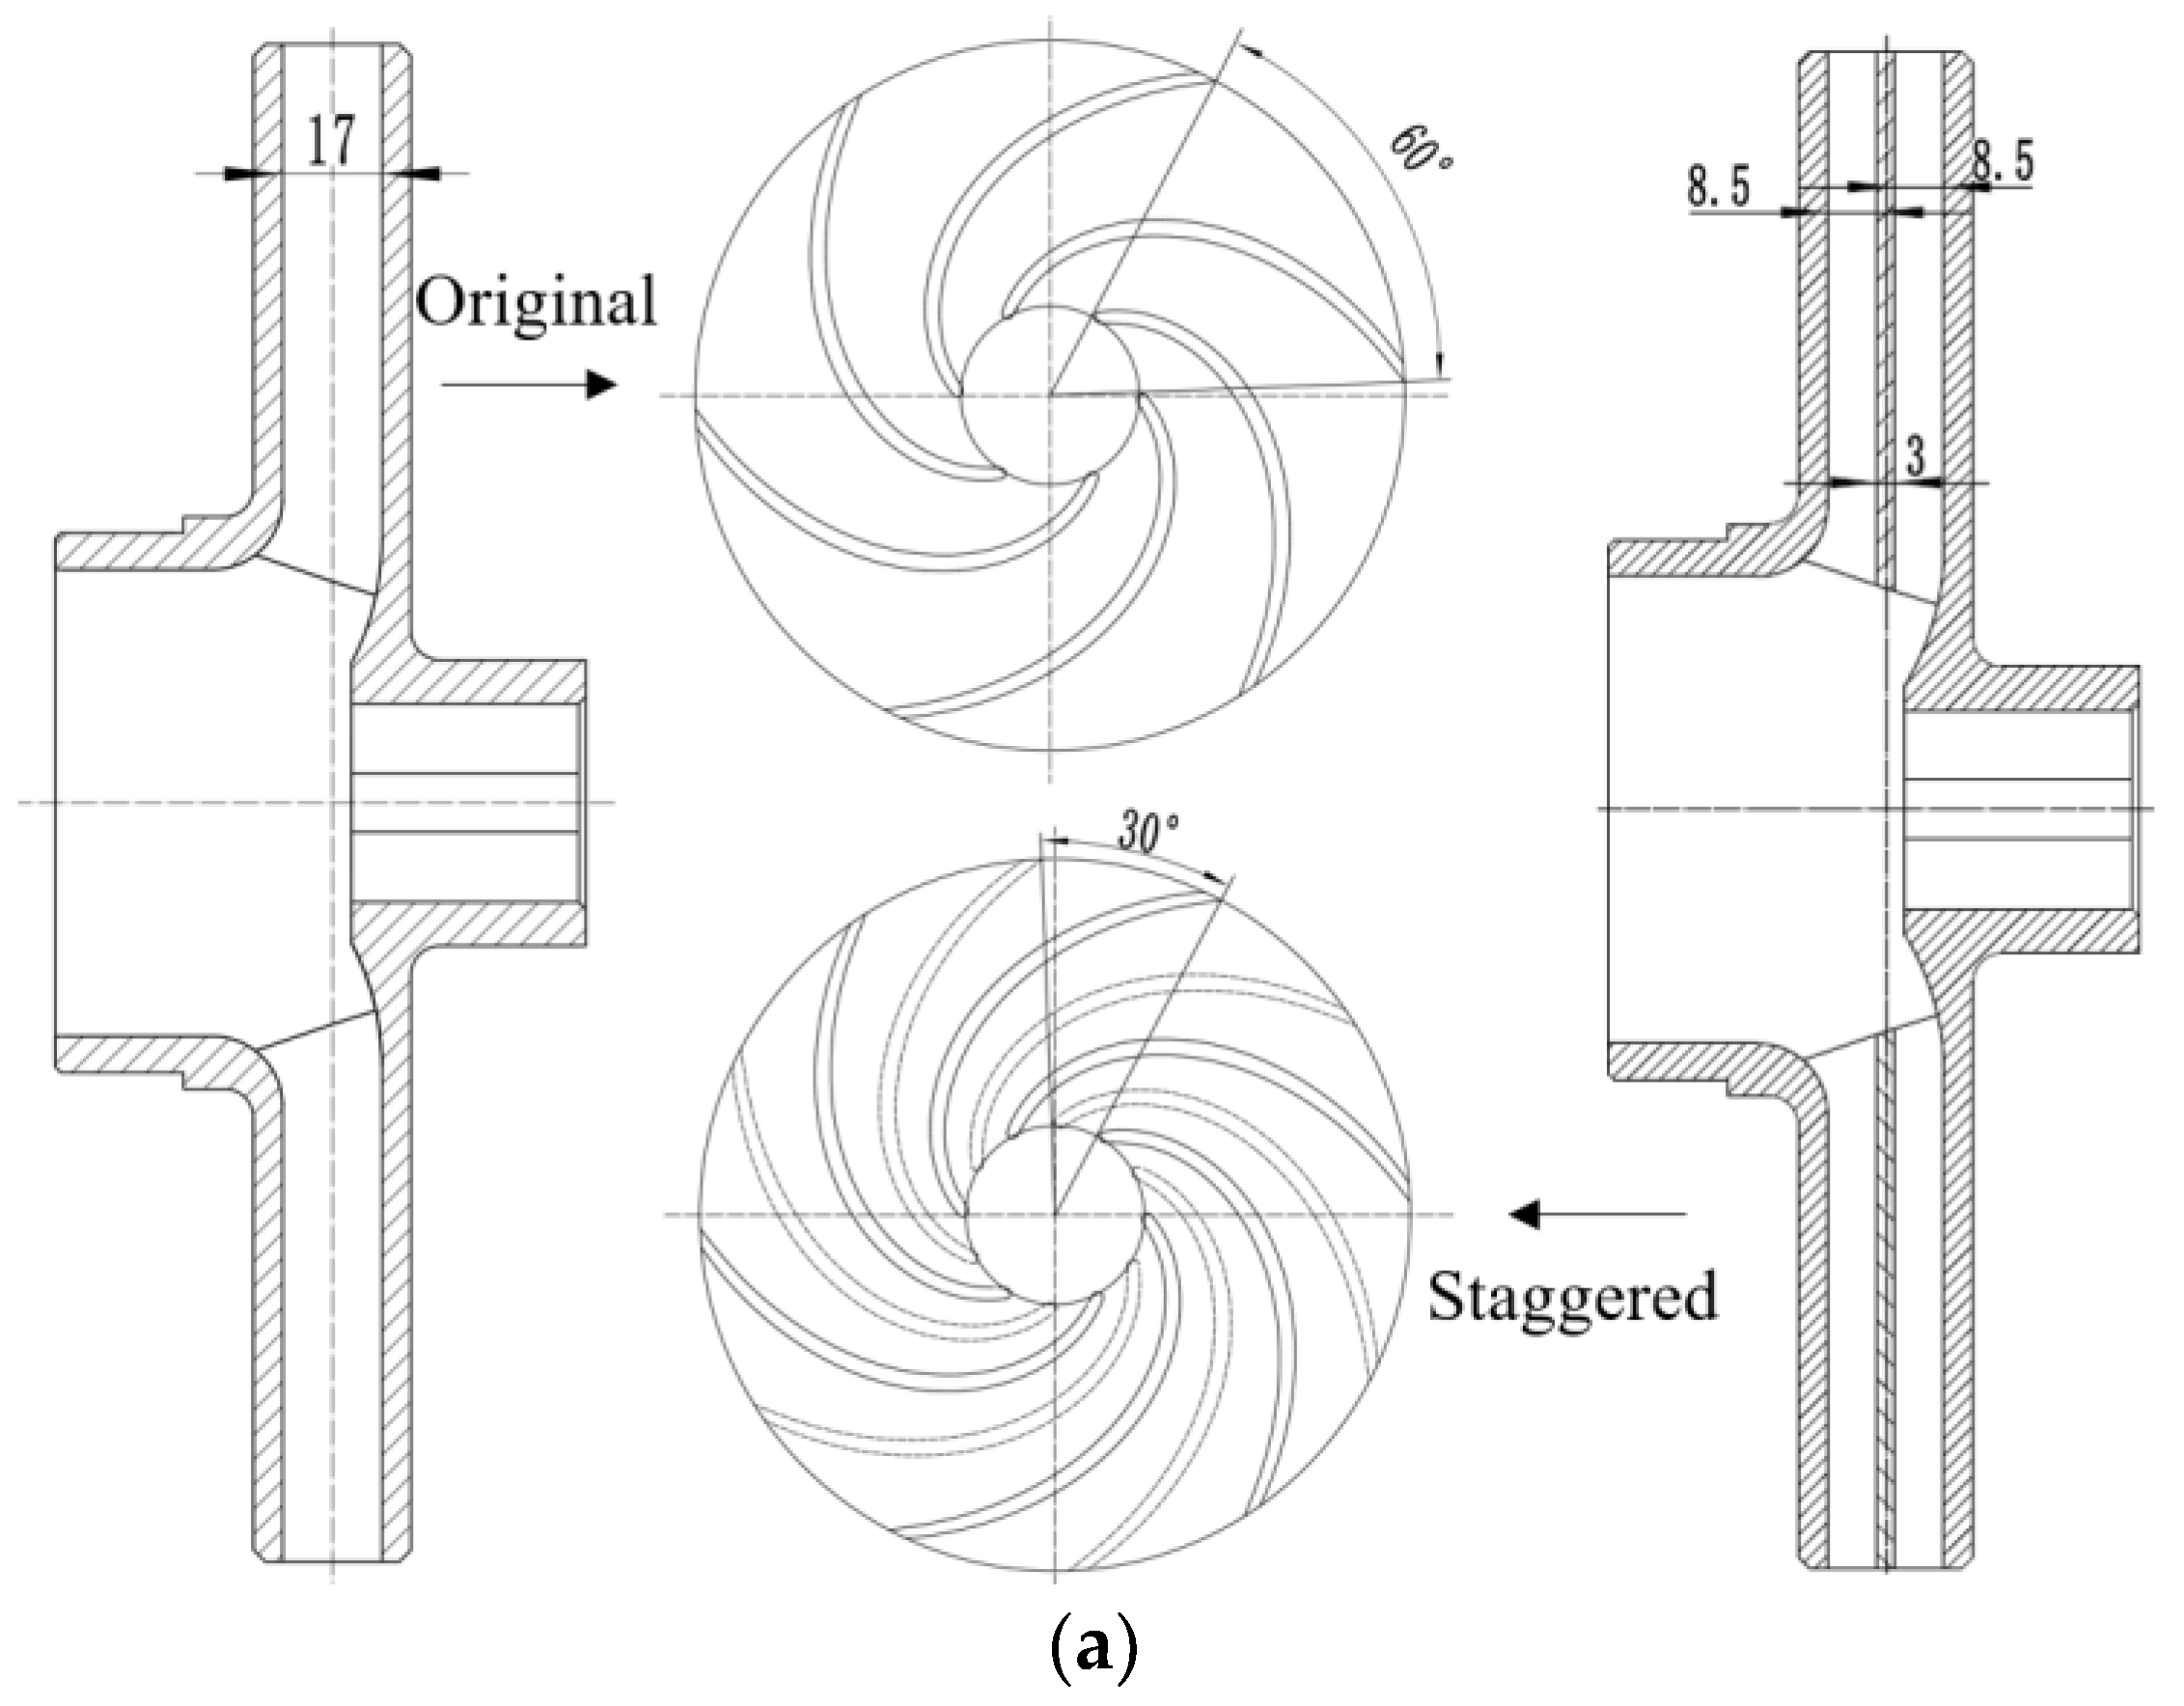
2.1. Model Test Pump with Staggered Impeller

In this study, a low−specific speed centrifugal pump with two−dimensional cylindrical blades is designed, and its main parameters are shown in Table 1.
The impeller blades of the original model pump are divided into half along the middle axis section, cut to form the front layer blades and the rear layer blades. The best effect of reducing pressure pulsation in double suction pump when blades are evenly staggered [6,7], so the two layers of blades are staggered by 30°. The two−layer blades are divided and connected by the middle partition plate. After the strength check, the thickness of the two−layer blade connecting the partition plate is δ = 3 mm. Because the flow passage area of the low specific speed centrifugal pump impeller is relatively small, after the blades are staggered in half, the flow passage area in the front and rear layers of the staggered impeller is reduced. Therefore, considering the flow channel area and improving the inlet inflow of the staggered impeller, the inner diameter of the connecting baffle is set to φ = 90 mm. as shown in Figure 1a. The original impeller and staggered impeller are shown in Figure 1b. In order to accurately obtain the characteristics of the centrifugal pump with different impeller models, the impeller parts are processed by five−axis numerical milling, and the experimental impeller is shown in Figure 1c.

2.2. Test Rig Setup

The hydraulic performance and pressure pulsation characteristics tests of the centrifugal pump are carried out in the DN150 pump closed test bench. The test bench is shown in Figure 2. The water temperature is maintained at around 25° throughout the test. The electromagnetic flowmeter was used to obtain the model pump flow under different working conditions, and its measurement accuracy was ±0.2%. The flow of the model pump can be adjusted by a valve installed at the inlet of the tank. The pressure measurement error of the model pump is ±0.075%. An AC frequency conversion cabinet controls the motor used in the model pump, and its speed is stabilized at the rated value of n = 1450 rpm.

2.3. Pressure Pulsations Measurement

The 24−channel LMS multi−channel vibration and noise test system (SCM05 type, Belgium LMS International Company, Leuven, Belgium) is used, and the pressure sensor is a miniature high−frequency dynamic sensor (PCB113B27X type, PCB Piezotronics, Inc., New York, NY, USA). In order to make the sampling signal meet the analysis requirements, the sampling frequency range is set to 0–12,800 Hz, the sampling resolution is set to 0.5 Hz, the sampling time is 4.8 s, and the sampling time interval is 0.3 s. The sampled signal is truncated using the Hanning window function.
In order to obtain the pressure pulsation characteristics in the pump with different impeller models, 20 pressure pulsation measuring points are evenly distributed on the circumference of the volute wall. The measuring point interval angle is 18°, which gradually increases counterclockwise. The radial position of the measuring point is 2/3 of the gap between the impeller outlet and the volute base circle. Figure 3 is a schematic diagram of the measuring point layout.

2.4. Test System Error

When the performance test is carried out, the test system is continuously tested three times without any human interference. The difference between the maximum and minimum values of the three test efficiencies is less than 0.3 %, and the intermediate value of the three measurements is taken as the final test result. In the pressure pulsation experiment, the dynamic calibration is carried out by using the special pulse step pressure signal system of the PCB pressure pulsation sensor. In order to carry out the repeatability analysis, each stable working condition is measured 3 times, and the test result adopts 97% confidence double amplitude. The comprehensive measurement uncertainty ES of the test system is composed of head measurement uncertainty EH = ±0.1%, shaft power measurement uncertainty EP = ±0.1%, flow measurement uncertainty EQ ≤ ±0.21%. After calculation and experiment, the comprehensive uncertainty:
E S = E H 2 + E Q 2 + E P 2 = ± 0.256 %
which conforms to the relevant provisions of IEC [22,23].

3. Result and Discussion

3.1. Performance Analysis

The comparison diagram of the head coefficient and efficiency of pumps with two impeller models under experimental measurement is given in Figure 4. The results show that the head coefficient of the staggered impeller model pump decreases at all measured conditions. From the comparison of efficiency curves, it can be found that the efficiency difference in the staggered impeller model is slight under minor flow conditions (0.2QN–0.5QN), and the efficiency decrease is noticeable under large flow conditions (1.0QN–1.4QN). Table 2 shows the drop range of the head coefficient and the efficiency of the staggered impeller model pump under 1.0QN, in which the head coefficient decreases by 5.29% and efficiency decreases by 5.60%. The clapboard connects the staggered blades. Compared with the original impeller, the inflow liquid moves to the back of the blade under the work of the blade, and the inflow impact at the baffle after the liquid enters the staggered impeller is large. After impacting the clapboard, it flows into the front and rear impellers respectively, which is easy to interact with the liquid that obtains the working energy of the blade. The diffusion in the flow channel is disordered, the theoretical diffusion angle is halved, and the diffusion loss increases. At the same time, when staggered blades squeeze the liquid, the friction loss between the two sides of the blade and the partition is much larger than that of the original impeller, weakening the working ability of the impeller, resulting in a decreased in the performance of the pump. Overall, the staggered impeller affects the pump’s operating curve, which reduces the head and efficiency to a certain extent. Therefore, from a performance perspective, staggered impellers do not have advantages when designing a centrifugal pump. The following section will analyze whether staggered impellers have advantages from the perspective of pressure pulsation signals.

3.2. Time Domain and Frequency Domain Analysis

Five main operating conditions from 0.8QN to 1.2QN are selected to analyze the pressure pulsation characteristics. In a centrifugal pump, the high−energy pressure pulsation caused by the RSI between the impeller and the tongue is the primary source of flow−induced vibration. Therefore, this paper analyzes the distribution characteristics of pressure pulsation near the tongue. Figure 5 shows the time domain distribution of pressure pulsation under different working conditions at three pressure pulsation measuring points (P1, P2, P3) near the tongue of different schemes. Studies have shown that the unsteady flow at point P2 (near the tongue) is complex, and the pressure pulsation signals are composed of many components [3,24]. The time domain result shown in Figure 5 is the instantaneous data collected after a period of stable operation of the pump. The sampling time is greater than one impeller rotation cycle, and the data is dimensionless. It can be found that there are apparent differences in the distribution of the time domain signal characteristics of the three measuring points from the test results. In the original impeller scheme, the pressure pulsation of each measuring point is the most stable under the design flow condition. The pressure pulsation has a certain regularity under the off−design flow condition. However, in the 0.8QN and 1.2QN working flow conditions, the pulsation peaks and troughs amplitude values are obviously inconsistent. In the staggered impeller scheme, the pressure pulsation amplitudes under the given conditions are smaller than those of the original impeller scheme, and the pulsation peaks and troughs are dense. In the same sampling time, the number of peaks and troughs increases in the staggered impeller scheme.
In order to further analyze the frequency domain characteristics of pressure pulsation under different working flow conditions of three monitoring points, FFT transformation is performed on the pressure pulsation signal. Figure 6 shows pressure pulsation’s frequency domain distribution characteristics under different flow working conditions at three measuring points of different schemes. The number of blades in the original impeller model pump is six. In the frequency domain, the peak value is six times the axial frequency, that is, the main frequency is the impeller passing frequency. After the blades are staggered, the number of impeller tongue interferences is doubled. The twelve blades in the staggered impeller interfere with the tongue, and the main frequency becomes twelve times the axial frequency, that is, twice times the blade frequency. It can be seen from Figure 6 that the amplitudes of the characteristic frequency of each measuring point under different flow working conditions are pretty different, and the primary characteristic frequency is the blade passing frequency (fbpf = 145 Hz) and its higher harmonics. Especially at P1, the amplitude of the 2fbpf has the most significant variation with the working flow conditions. It can be found that the primary characteristic frequency of the staggered scheme is 2fbpf under different flow working conditions at the same measuring point, and the fbpf amplitude is almost completely suppressed, especially at P3. The characteristic frequency amplitude of point P3 sharply increases under the development of RSI, while the characteristic frequency amplitude is almost completely suppressed in the staggered impeller scheme. This remarkable effect is brought about by the phase difference between the front and rear impellers, and the tongue separation after the blades are staggered. The vibration noise caused by hydraulic excitation in the pump system mainly comes from RSI. After the blades are staggered, the outflow of the two layers of impellers interferes with the tongue respectively, resulting in a phase difference in the vibration waveform. After superposition, the vibration energy is greatly reduced. Therefore, we can see the waveform with small amplitude and dense amplitude in the time domain diagram, and the amplitude energy of the characteristic frequency is also greatly reduced. This is also an effective means to suppress the source of pump vibration and noise.
The variation law of the primary characteristic frequency of each monitoring point of the two−impeller scheme is similar. Moreover, the amplitude of the characteristic frequency decreases first and then increases with the increase in the working flow condition, and the amplitude of the characteristic frequency is the smallest at the design condition. The shaft frequency signal fr = 24.16 and its higher harmonics with similar distribution characteristics can be captured under each working flow condition. Under different working flow conditions, fr, 2fr and 3fr are captured by both impeller schemes. The reason is that the rotor is not centered during the assembly process. The three monitoring points in the staggered impeller scheme captured the higher harmonics signals 4fr and 5fr.
In order to analyze the influence on the overall pressure pulsation characteristics of the staggered impellers, the amplitude values of fbpf at 20 measuring points mounted on the volute are extracted in Figure 7. The figure shows that the amplitude of fbpf in the original scheme presents six peaks and troughs, while the magnitude of the amplitude of fbpf is significantly reduced after the impeller is staggered, so that its value is too small to show the number of regular peaks. The amplitudes of the two schemes at fbpf are the highest at point P3, which is downstream of the tongue. The amplitude of fbpf in the staggered scheme is significantly reduced, and all the measured values of the 20 measuring points are smaller than in the original scheme. The distribution characteristics of the amplitude of each measuring point under different working flow conditions are similar. As the flow rate increases, the amplitude of fbpf first decreases and then increases, and it is the lowest at the design flow condition.
Table 3 shows the average value and variation of fbpf amplitude at 20 monitoring points under 0.8QN–1.2QN. At the same time, the suppressing effect of the staggered impeller scheme on the fbpf amplitude is further quantified. The calculation method of the amplitude average value is listed in Equation (2). The expression of the fbpf reduction amplitude is shown in Equation (3). It can be seen from the table that the staggered impeller at fbpf has a significant inhibitory effect on each working flow condition. Moreover, the drop rate is greater than 80%.
A P ¯ = i = 1 n A p θ / n
Δ = ( A P ¯ ( Original ) A P ¯ ( Staggered ) ) / A P ¯ ( Original )   ×   100 %
AP−θ represents the pressure pulsation amplitude at fbpf with different angles, and Δ represents the reduction values of the fbpf amplitude of the staggered scheme compared with the original scheme.
As seen from Figure 6 above, the primary excitation frequency of the staggered impeller scheme will move to the 2fbpf after staggered. Moreover, the 2fbpf of the staggered impeller scheme is dominant in the frequency spectrum near the tongue. Therefore, the amplitude distribution of 20 measuring points on the volute at 2fbpf is further extracted to explore the main frequency characteristics of the staggered impeller, as shown in Figure 8. It can be found that the amplitude of the original scheme is smaller at 1.0QN at each measuring point and more prominent during 0.8QN–0.9QN. Under the staggered scheme, the amplitude increases at 2fbpf with the flow rate increase at each measuring point. Table 4 shows the average value and variation of the 2fbpf amplitude. At 0.8QN, the staggered impeller scheme has a certain inhibitory effect on the amplitude at 2fbpf. However, the 2fbpf amplitude of the staggered impeller scheme at 1.0QN and 1.2QN has a larger increase than the original scheme.

3.3. RMS Analysis

The Root Mean Square (RMS) is used to judge the overall energy value of the pressure pulsation spectrum, and the RMS processing is performed on the spectrum signal. The leakage of spectral energy during the test could be considered. Thus, the specific calculation method of the RMS value is as shown in Equation (4) [25]:
R M S = 1.63 2 1 2 ( 1 2 A .0 2 + n 2 n 1 A n 1 2 + 1 2 A n 2 )
where A0 and An are the pressure pulsation amplitudes at the beginning and end of the sampling frequency band, respectively, and An−1 are the amplitudes at different frequencies in the sampling frequency band.
The previous analysis shows that the high-frequency band has almost no high−amplitude excitation frequency. Therefore, the signal in the frequency band of 4fbpf = 580 Hz is selected for the RMS analysis of pressure pulsation energy. In the frequency spectrum of the two impeller schemes, fr and its high harmonic frequency signal are captured. Therefore, Figure 9 firstly shows the pressure pulsation energy at each monitoring point in the 0–fbpf frequency band under 0.8QN–1.2QN. This frequency band includes multiple low−frequency signals, which are nfr (n = 1, 2, 3, 4, 5). In the original impeller scheme (Figure 9a), the pressure pulsation energy under each working flow condition is stable in the 0–fr frequency band, and the pressure pulsation energy of the P1−P20 measuring points shows a trend of first increasing and then decreasing. The pressure pulsation energy of 0.8QN–0.9QN is obviously higher than that of 1.0QN–1.2QN. It can be proved that the shaft frequency pulsation energy is larger under the small flow rate. It can be seen from Figure 9b that, compared with the original impeller scheme, the monitoring points at the upstream and downstream of the tongue in the staggered impeller scheme have a larger difference in pressure pulsation energy under the partial working conditions. The RSI between the staggered blades and the tongue strengthens the amplitude energy at 0–fbpf, so the pressure pulsation energy with the staggered impeller scheme is higher in this frequency band.
In order to analyze the energy characteristics as a whole, Figure 10 shows the pressure pulsation energy distribution of each measuring point of the two schemes in the frequency band of 0–4fbpf, which contains multiple characteristic frequency signals (nfr, nfbpf). In the original impeller scheme, the overall energy of the pressure pulsation at the monitoring point near the tongue is relatively large, and the pressure pulsation energy shows a gradually weakening trend at the measuring points around the volute. However, from 0.8QN to 1.2QN, the staggered impeller scheme dramatically reduces the pressure pulsation energy, and the overall energy amplitude is the lowest at 1.0QN.
The suppression effect of the staggered impeller scheme on the pressure pulsation energy in different frequency bands is further quantified in detail. Table 5 shows the two impeller schemes in different frequency bands (0–5fr, 0–fbpf, 0–2fbpf, 0–4fbpf, 0–6fbpf) RMS average value and the change relative to the original scheme under 1.0QN, where the variation values calculation method of variation values is consistent with the Equation (4). The analysis found that the RMS energy average values of the staggered scheme are significantly larger than that of the original scheme in the 0–5fr frequency band. In addition to the influence of shaft frequency (including some shaft misalignment and installation problems), the reason is that the RSI effect of the staggered impeller and tongue is stronger than the original scheme, which increases the low−frequency excitation signal. However, in the frequency band including nfbpf (n = 1–6), the staggered impeller scheme has a significant suppression effect. Moreover, the suppression effect gradually weakens with the increase in high blade passing frequency, which decreases from 42.98% to 37.33%. The variation values Δ in the 0–4fbpf and the 0–6fbpf frequency band are almost the same, which indicates that the 4fbpf–6fbpf amplitude is small and has little effect on the pressure pulsation energy. It can be seen from the above analysis that the staggered impeller has a strong ability to suppress pressure pulsation energy and can be applied to the design of low vibration and noise pumps.
Figure 11 compares RMS average values in different frequency bands under the two schemes from 0.8QN to 1.2QN, further showing more details of the pressure pulsation energy distribution under different working conditions. It can be seen from Figure 11a that in the frequency band of 0–5fr, the pressure pulsation energy of the staggered impeller scheme is higher than that of the original impeller scheme under 0.8QN–1.2QN. At the same time, the nfr signal excitation source has been strengthened under 1.1QN–1.2QN. It can be seen from Figure 11b–d that the nfbpf signal is included in the other frequency bands, and the pressure pulsation energy of the staggered impeller scheme is smaller than that of the original impeller scheme. With the expansion of the frequency band, the energy suppression effect of the staggered schemes under five working conditions is gradually stable. In general, the staggered impeller scheme significantly inhibits the pressure pulsation energy in the pump.

4. Conclusions

This paper innovatively adopts the staggered impeller scheme to reduce the pressure pulsation characteristics of the centrifugal pump. Based on the LMS multi−channel vibration and noise test system, pressure pulsation test measurements of the original impeller scheme and the staggered impeller scheme are carried out in a low specific speed centrifugal pump. The time domain and frequency domain analysis methods are used, and the pressure pulsation test values of the two impeller schemes under different working flow conditions are compared and analyzed. The following main conclusions are as follows.
  • The impeller blades are divided into half, cut and staggered, then connected by a partition with a specific inner diameter, negatively impacting the pump’s external characteristics to a certain extent.
  • The test measures the pressure pulsation signal in the same sampling time, the pressure pulsation amplitude of the staggered impeller scheme decreases, the number of peaks and troughs of the pulsation curve increases significantly, and the fluctuations are dense.
  • The staggered impeller scheme significantly reduces blade passing frequency (fbpf) amplitude energy. The fbpf energy suppression effect is higher than 80% under 0.8QN–1.2QN. However, it has a specific increasing effect on 2fbpf, the highest increase is 44.52%, especially in 1.2QN.
  • The RMS energy distribution of pressure pulsation in different frequency bands is quite different, and the energy of pressure pulsation near the tongue is prominent under 0.8QN–1.2QN. In the 0–5fr frequency band, the pressure pulsation amplitude of the staggered impeller scheme is larger. On a broader frequency band (0–6fbpf), the pressure pulsation energy of the staggered impeller scheme is smaller than that of the original impeller scheme. With the expansion of the frequency band, the pressure pulsation energy decreased steadily, with a minimum decrease of 37.33%.
In engineering applications, if low noise is the primary development goal, staggered impellers can be used, but it is necessary to measure whether the reduction in performance exceeds the operating power of the motor.

Author Contributions

Methodology, D.N.; Validation, Y.Z.; Investigation, F.W.; Resources, F.W.; Data curation, S.H.; Supervision, B.G. All authors have read and agreed to the published version of the manuscript.

Funding

This research was funded by the Fundamental Science Research Project of Jiangsu Higher Education Institutions (22KJB570002), National Natural Science Foundation of China (51476070, 51706086, 51576090, 51706087), a Project Funded by the Industrial Science and Technology of Taizhou (22gyb43), a Project Funded by Six Talent Peaks Project in Jiangsu Province (KTHY−060), a Project Funded by the Priority Academic Program Development of Jiangsu Higher Education Institutions (PAPD), and the Key Research and Development Program of Zhenjiang (Grant No. G0Y2018023).

Conflicts of Interest

The authors declare no conflict of interest.

Abbreviations

Acronyms
ECTEt cetera
RMSThe Root Mean Square
Symbols
A P ¯ The average value of fbpf amplitude
b2Impeller outlet width
CpPressure coefficient
D1Impeller inlet diameter
D2Impeller outlet diameter
ESComprehensive measurement uncertainty
EHHead measurement uncertainty
EPShaft power measurement uncertainty
EQFlow measurement uncertainty.
frShaft frequency signal
fbpfBlade passing frequency
HNNominal head
nNominal rotational speed
nsSpecific speed
QNNominal flow rate
u2Circumferential velocity of impeller outlet
ZBlades number
ηEfficiency of pump
ΨNNominal head coefficient
δThickness of the partition plate

References

  1. Qian, H.; Wu, D.; Xiang, C.; Jiang, J.; Zhu, Z.; Zhou, P.; Mou, J. A Visualized Experimental Study on the Influence of Reflux Hole on the Double Blades Self−Priming Pump Performance. Energies 2022, 15, 4617. [Google Scholar] [CrossRef]
  2. Yuan, J.; Shi, J.; Fu, Y.; Chen, H.; Lu, R.; Hou, X. Analysis of Fluid-Structure Coupling Dynamic Characteristics of Centrifugal Pump Rotor System. Energies 2022, 15, 2133. [Google Scholar] [CrossRef]
  3. Li, D.; Zhang, N.; Jiang, J.; Gao, B.; Akurugo, A.; Zhou, W. Numerical Investigation on the Unsteady Vortical Structure and Pressure Pulsations of a Centrifugal Pump with the Vaned Diffuser. Int. J. Heat Fluid Flow 2022, 98, 109050. [Google Scholar] [CrossRef]
  4. Yao, Z.; Wang, F.; Qu, L.; Xiao, R.; He, C.; Wang, M. Experimental Investigation of Time−Frequency Characteristics of Pressure Fluctuations in a Double−Suction Centrifugal Pump. J. Fluids Eng. Trans. ASME 2011, 133, 101303. [Google Scholar] [CrossRef]
  5. Rodriguez, C.G.; Egusquiza, E.; Santos, I.F. Frequencies in the Vibration Induced by the Rotor Stator Interaction in a Centrifugal Pump Turbine. J. Fluids Eng. Trans. ASME 2007, 129, 1428–1435. [Google Scholar] [CrossRef] [Green Version]
  6. Spence, R.; Amaral−Teixeira, J. Investigation into Pressure Pulsations in a Centrifugal Pump Using Numerical Methods Supported by Industrial Tests. Comput. Fluids 2008, 37, 690–704. [Google Scholar] [CrossRef]
  7. Spence, R.; Amaral−Teixeira, J. A CFD Parametric Study of Geometrical Variations on the Pressure Pulsations and Performance Characteristics of a Centrifugal Pump. Comput. Fluids 2009, 38, 1243–1257. [Google Scholar] [CrossRef] [Green Version]
  8. Zhang, N.; Yang, M.; Gao, B.; Li, Z.; Ni, D. Unsteady Pressure Pulsation and Rotating Stall Characteristics in a Centrifugal Pump with Slope Volute. Adv. Mech. Eng. 2014, 2014, 710791. [Google Scholar] [CrossRef]
  9. Friedrichs, J.; Kosyna, G. Rotating Cavitation in a Centrifugal Pump Impeller of Low Specific Speed. J. Fluids Eng. Trans. ASME 2002, 124, 356–362. [Google Scholar] [CrossRef]
  10. González, J.; Fernández, J.; Blanco, E.; Santolaria, C. Numerical Simulation of the Dynamic Effects Due to Impeller−Volute Interaction in a Centrifugal Pump. J. Fluids Eng. Trans. ASME 2002, 124, 348–355. [Google Scholar] [CrossRef]
  11. Gülich, J.F. Centrifugal Pumps; Springer: Berlin/Heidelberg, Germany, 2014; ISBN 0−387−23262−1. [Google Scholar]
  12. Fu, Y.; Yuan, J.; Yuan, S.; Pace, G.; D’Agostino, L.; Huang, P.; Li, X. Numerical and Experimental Analysis of Flow Phenomena in a Centrifugal Pump Operating under Low Flow Rates. J. Fluids Eng. Trans. ASME 2015, 137, 011102. [Google Scholar] [CrossRef]
  13. Barrio, R.; Blanco, E.; Parrondo, J.; González, J.; Fernández, J. The Effect of Impeller Cutback on the Fluid−Dynamic Pulsations and Load at the Blade−Passing Frequency in a Centrifugal Pump. J. Fluids Eng. Trans. ASME 2008, 130, 1111021–11110211. [Google Scholar] [CrossRef]
  14. Kurniawan, K.E.; Santoso, B.; Tjahjana, D.D.D.P. Improvement of Centrifugal Pump Performance through Addition of Splitter Blades on Impeller Pump. AIP Conf. Proc. 2018, 1931, 030053. [Google Scholar] [CrossRef]
  15. Capurso, T.; Bergamini, L.; Torresi, M. Design and CFD Performance Analysis of a Novel Impeller for Double Suction Centrifugal Pumps. Nucl. Eng. Des. 2019, 341, 155–166. [Google Scholar] [CrossRef]
  16. Wang, F.J.; Qu, L.X.; He, L.Y.; Gao, J.Y. Evaluation of Flow−Induced Dynamic Stress and Vibration of Volute Casing for a Large−Scale Double−Suction Centrifugal Pump. Math. Probl. Eng. 2013, 2013, 764812. [Google Scholar] [CrossRef] [Green Version]
  17. Tao, R.; Xiao, R.; Wang, Z. Influence of Blade Leading−Edge Shape on Cavitation in a Centrifugal Pump Impeller. Energies 2018, 11, 2588. [Google Scholar] [CrossRef]
  18. Al−Qutub, A.M.; Khalifa, A.E.; Al−Sulaiman, F.A. Exploring the Effect of V−Shaped Cut at Blade Exit of a Double Volute Centrifugal Pump. J. Press. Vessel Technol. Trans. ASME 2012, 134, 021301. [Google Scholar] [CrossRef]
  19. Gao, B.; Zhang, N.; Li, Z.; Ni, D.; Yang, M.G. Influence of the Blade Trailing Edge Profile on the Performance and Unsteady Pressure Pulsations in a Low Specific Speed Centrifugal Pump. J. Fluids Eng. Trans. ASME 2016, 138, 051106. [Google Scholar] [CrossRef]
  20. Kergourlay, G.; Younsi, M.; Bakir, F.; Rey, R. Influence of Splitter Blades on the Flow Field of a Centrifugal Pump: Test−Analysis Comparison. Int. J. Rotating Mach. 2007, 2007, 085024. [Google Scholar] [CrossRef] [Green Version]
  21. Zhang, N.; Yang, M.; Gao, B.; Li, Z.; Ni, D. Experimental Investigation on Unsteady Pressure Pulsation in a Centrifugal Pump with Special Slope Volute. J. Fluids Eng. Trans. ASME 2015, 137, 061103. [Google Scholar] [CrossRef]
  22. US−ANSI.ISO 9906; Rotodynamic Pumps: Hydraulic Performance Acceptance Tests−Grades 1 and 2. BSI: Milton Keynes, UK, 1999.
  23. ISO/TAG4/WG3; Guide to the Expression of Uncertainty in Measurement. ISO: Geneva, Switzerland, 1993.
  24. Zhang, N.; Liu, X.; Gao, B.; Xia, B. DDES Analysis of the Unsteady Wake Flow and Its Evolution of a Centrifugal Pump. Renew. Energy 2019, 141, 570–582. [Google Scholar] [CrossRef]
  25. Ni, D.; Zhang, N.; Gao, B.; Li, Z.; Yang, M. Dynamic Measurements on Unsteady Pressure Pulsations and Flow Distributions in a Nuclear Reactor Coolant Pump. Energy 2020, 198, 117305. [Google Scholar] [CrossRef]
Figure 1. Original impeller and Staggered impeller. (a) Two−dimensional diagram of different impeller schemes; (b) Different blades scheme; (c) Tested impeller.
Energies 15 08912 g001aEnergies 15 08912 g001b
Figure 2. Closed test platform.
Energies 15 08912 g002
Figure 3. Measuring position of the pressure sensor.
Energies 15 08912 g003
Figure 4. Performances of the model pump.
Energies 15 08912 g004
Figure 5. Time domain comparison of measured values of different schemes.
Energies 15 08912 g005
Figure 6. Frequency domain comparison of measured values of different scheme.
Energies 15 08912 g006
Figure 7. Comparison of fbpf amplitude of pressure pulsation under 0.8QN–1.2QN.
Energies 15 08912 g007
Figure 8. Comparison of 2fbpf amplitude of pressure pulsation under 0.8QN–1.2QN.
Energies 15 08912 g008
Figure 9. RMS of each measuring point in 0–fbpf frequency band.
Energies 15 08912 g009
Figure 10. RMS of each measuring point in 0–4fbpf frequency band.
Energies 15 08912 g010
Figure 11. Comparison of pressure pulsation energy in different frequency bands under 0.8QN–1.2QN.
Energies 15 08912 g011
Table 1. Design parameters of the tested pump.
Main Geometric DataValue
Nominal flow rate QN/m3/h55
Nominal head HN/m20
Nominal rotational speed n/rpm1450
Impeller inlet diameter D1/mm80
Impeller outlet diameter D2/mm260
Impeller outlet width b2/mm17
Blades number Z6
Exit circumferential velocity u2/m/s19.74
Specific speed ns69
Table 2. Drop range of head coefficient and efficiency of the staggered impeller model pump.
ProjectOriginalStaggeredDeviation/%
ΨN0.6050.5735.29%
η/%72.767.15.60%
Table 3. Average values and variation values of fbpf amplitude.
Flow Rate A ¯ P   ( Original ) A ¯ P   ( Staggered ) Δ/100%
0.8QN0.013830.0025481.63%
0.9QN0.011180.0020681.55%
1.0QN0.015680.0027482.47%
1.1QN0.017620.0029983.01%
1.2QN0.018620.0028384.77%
Table 4. Average values and variation values of 2fbpf amplitude.
Flow Rate A ¯ P   ( Original ) A ¯ P   ( Staggered ) Δ/100%
0.8QN0.0034020.00303110.91%
0.9QN0.0030760.0029982.543%
1.0QN0.0022940.003275−42.78%
1.1QN0.003040.0029473.062%
1.2QN0.0024090.003481−44.52%
Table 5. RMS average values and variation values in frequency band under design condition.
Frequency Band R M S ¯   ( Original ) R M S ¯   ( Staggered ) Δ/100%
0–5fr0.0065630.007794−15.79%
0–fbpf 0.0143720.00819442.98%
0–2fbpf0.0147500.00889339.71%
0–4fbpf 0.0149370.00934537.43%
0–6fbpf 0.0150910.00945837.33%
Publisher’s Note: MDPI stays neutral with regard to jurisdictional claims in published maps and institutional affiliations.

