Article

Geological Structure Features of Carbonate Formations and Their Impact on the Efficiency of Developing Hydrocarbon Deposits

by
Vadim Aleksandrovich Grishchenko
1,
Vyacheslav Sharifullovich Mukhametshin
1,* and
Ruslan Uralovich Rabaev
2
1
Institute of Oil and Gas, FSBEI of HE “Ufa State Petroleum Technological University”, (Branch in the City of Oktyabrsky), 54a, Devonskaya St., 452607 Oktyabrsky, Republic of Bashkortostan, Russia
2
Scientific Department, FSBEI of HE “Ufa State Petroleum Technological University”, 1, Kosmonavtov St., 450064 Ufa, Republic of Bashkortostan, Russia
*
Author to whom correspondence should be addressed.
Energies 2022, 15(23), 9002; https://doi.org/10.3390/en15239002
Submission received: 14 October 2022 / Revised: 3 November 2022 / Accepted: 21 November 2022 / Published: 28 November 2022

Abstract

:
The development of deposits with a complex geological structures is often accompanied by a set of problems associated with optimal decision making. The efficiency of the entire development system depends on the completeness and the quality of the analysis of reservoir parameters. This paper presents methodological approaches for the study of carbonate deposits, and the development of further steps to increase the efficiency of reserve recovery. The secondary transformation of reservoir rocks, resulting in channels of increased conductivity, cracks, and caverns, plays a special role in the nature of the recovery of hydrocarbon reserves from such deposits. Secondary cavernosity leads to violations of the linear laws of fluid filtration in a porous medium, and complicates the field performance prediction based on geological and hydrodynamic modeling. The studied geological structure was detailed using the example of carbonate deposits composed of oil and water- saturated formations, taking into account the results of core studies and the interpretation of geophysical well studies. Furthermore, the parameters of production wells made it possible to confirm that the oil saturated and underlying water saturated formations have hydrodynamic connectivity due to the presence of vertical micro cracks. At the same time, the thickness of the bridge between the reservoirs directly affects the initial water cutting of well production, and further growth dynamics of the water ratio are associated with the structural factors determining the initial oil content of the reservoir. The combination of the obtained dependencies and the distribution model of the reservoir properties along the area made it possible to build a complex map reflecting the predicted development efficiency in certain areas. The integration of the results of various field studies on the injection well stock established that a significant part of the water flows was injected into the water saturated formation, which reduces the efficiency of formation pressure maintenance in the target formation. As a result, in order to reduce the low efficiency injection volume, switching to a more rigid waterflooding system, in terms of the ratio of production and injection wells, is proposed with a further decrease in the injection pressure inside the wells.

1. Introduction

As a rule, complex carbonate formations have many features that complicate the conditions for their development [1,2,3]. The peculiarities of these productive deposits influence studying these deposits due to the need for additional research. The peculiarities involve an expanded geophysical complex, detailed study of the core material, field experiments at production, and injection wells [4,5,6,7]. The complex structure of the pore space shows a flagrant necessity for combining different approaches to the indirect study of reservoir characteristics [8]. In view of this, the study of the geological structure of carbonate deposits is continuous, and should be constantly updated with new information that allows for clarifying the distribution of geological parameters of the studied object [9,10].
The key parameters determine the successful development of the reservoirs under conditions of permeability and net reservoir thickness are the number of reservoir beds, discontinuity, secondary cavernosity, anisotropy of the properties in various directions, etc. [11,12]. Each indicator has a certain influence on the movement of hydrocarbon to the bottomhole of production wells, thus forming a general characteristic of the object’s development [13,14,15]. Due to the high variability of properties even within a single reservoir, the reserve recovery nature is often unique for each field, and requires a targeted approach to improve oil recovery efficiency. A number of parameters are difficult to measure; they are determined by indirect indicators including data on the operation of production and injection wells [16,17,18], as well as mathematical modeling.
The fact that terrigenous reservoirs, being more productive, are gradually depleted [19,20,21], and the contribution to the production and growth of the resource potential due to carbonate oil deposits annually increases, attracts great attention to carbonate objects. As a rule, such objects are developed by taking into account a set of geological and technical measures [22,23,24]. Today, the most high-tech are various modifications of acid hydraulic fracturing and drilling horizontal wells with multistage hydraulic fracturing, including complex wells such as Fishbone and Birch Leaf. The choice of well completion and stimulation methods should be based on a detailed study of the geological structure [8,25]. An equally important issue is the selection of optimal operating modes for production and injection wells, the solution of which is designed to ensure development system balance and the uniform advancement of the displacement front throughout the formation pore volume [26,27]. These directions are indicative of the successful development of complex geological objects, the effective management of which is aimed at increasing the production degree of hard-to-recover reserves.
Geological features of carbonate formations are the source of an emergence of non-standard currents when developing oil deposits. The presence of macro- and micro cracks, cavities, and other changes in the rock matrix, as well as low values of filtration-volumetric parameters, significantly complicates forecasting the operational performance and prevents determining the optimal development strategy by common techniques. It is necessary to introduce additional characteristics and analytical dependencies, based on the features of the object under study, into the analytical procedure.
The goal of this study was to form a strategy for the effective recovery of reserves of a carbonate object having a number of complicating factors. A number of tasks were solved to achieve the set goal:
-
Geological factors having a significant influence on the process of developing the object in question were identified;
-
The influence of the formed development system on the reserve recovery efficiency was established;
-
Reasons for the low efficiency of flooding were identified, and the direction to increase it for maintaining the optimal regime of oil displacement to the faces of producing wells was elaborated.
As a result, an integrated strategy for developing the object was drawn up, which considers both geological features of productive formations and technological solutions, such as a well density grid and waterflooding pattern rigidity.

2. Materials and Methods

The experimental works were carried out in the following order:
  • At the first stage, the geological structure features that may influence the process of recovering hydrocarbon reserves were analyzed in detail.
  • Then, based on the operating characteristics of the well performance, the influence of a number of geological properties on the development indicators was confirmed.
  • Then, based on the complexation of the established influencing parameters, the entire area of the object under study was divided in terms of the potential efficiency of the development.
  • At the next stage, the dependence of the predictive oil recovery factor on the well density grid was determined using the hydrodynamic modeling results. The results of items 3 and 4 above allow for determining the optimal system of well locations, taking into account its predictive efficiency.
  • At the final stage, the results of the research and field studies of water-injection wells were summarized, which allowed the establishment of the pattern efficiency in general, factors influencing this efficiency, and determining methods for improving its productivity.
Let us consider the case of the Tournaisian stage deposits in one of the fields in the Volga-Ural oil and gas province. The Tournaisian stage deposits include three productive beds: Kizilovsky (C1ksl), Cherepetsky (C1crp) and Upino-Malevsky (C1ml-up). The oil content is confirmed in the Kizelovsky formation; the rest are water saturated. The oil content distribution in the Tournaisian stage zones is presented in Figure 1.
The reservoir has a complex geological structure. The main characteristics of the C1ksl reservoir are shown in Table 1.
According to Table 1, the C1ksl reservoir is low permeable and heterogeneous, with high-viscosity oil. The pay zones are structurally consistent. The deposits are characterized by the presence of secondary cavernosity. Figure 2 shows core images with characteristic signs of secondary cavernosity.
Photographs of the core material show disturbances in the structure of the pore space associated with secondary processes of rock transformation, as a result of which cracks and caverns are formed The geological features influence the object development indicators. One of the distinguishing features of the well operation is the presence of water from the start-up. The average water cut is 35%, while the C1ksl reservoir itself has an extensive net oil pay zone. Several factors influence the initial water cut and its further dynamics.

3. Results

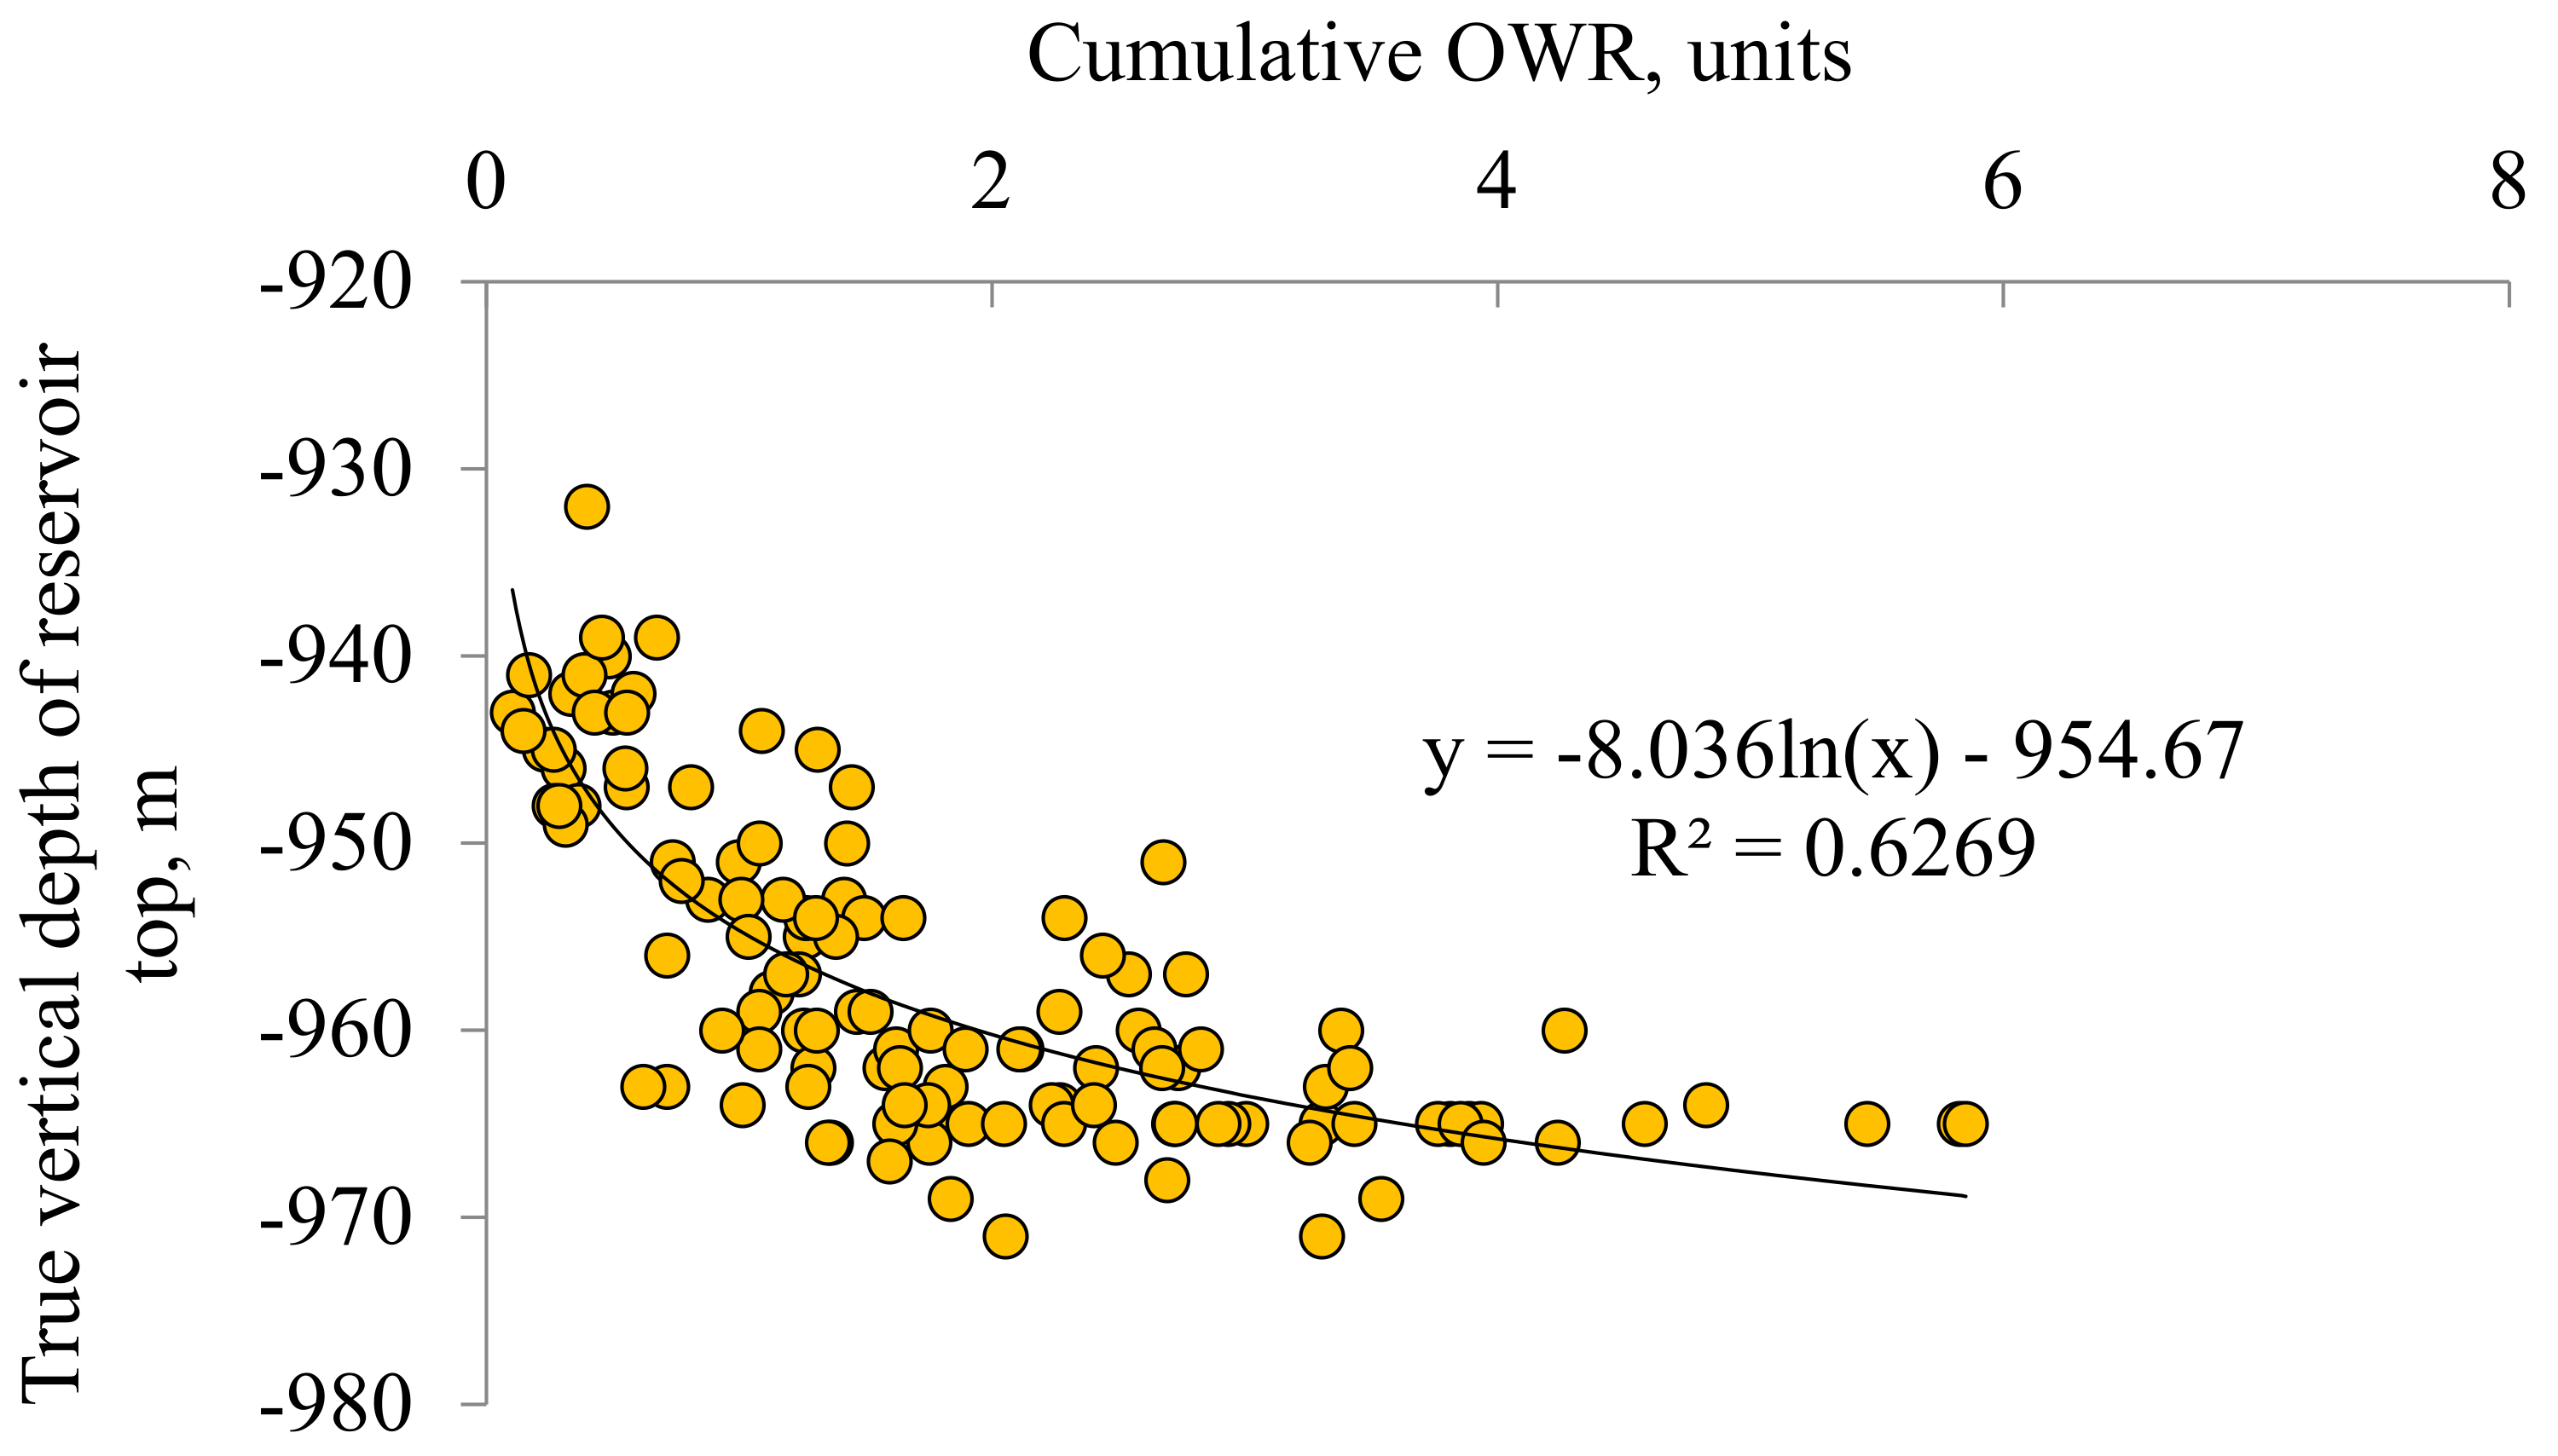
One of the key indicators affecting water cut dynamics during development is the true vertical depth of the reservoir, i.e., the lower the structural elevation, the lower the initial oil content and, accordingly, the lower the reserves in the area. The performance indicators of producing wells, uncovering productive sediments at various absolute depth marks of the Kizilovsky top occurrence, were analyzed to study the above mentioned issue. Figure 3 shows the impact of the structural factor on the cumulative oil-water ratio (OWR) obtained from well operation data.
According to Figure 3, the structural factor directly influences the water cut during the operation.
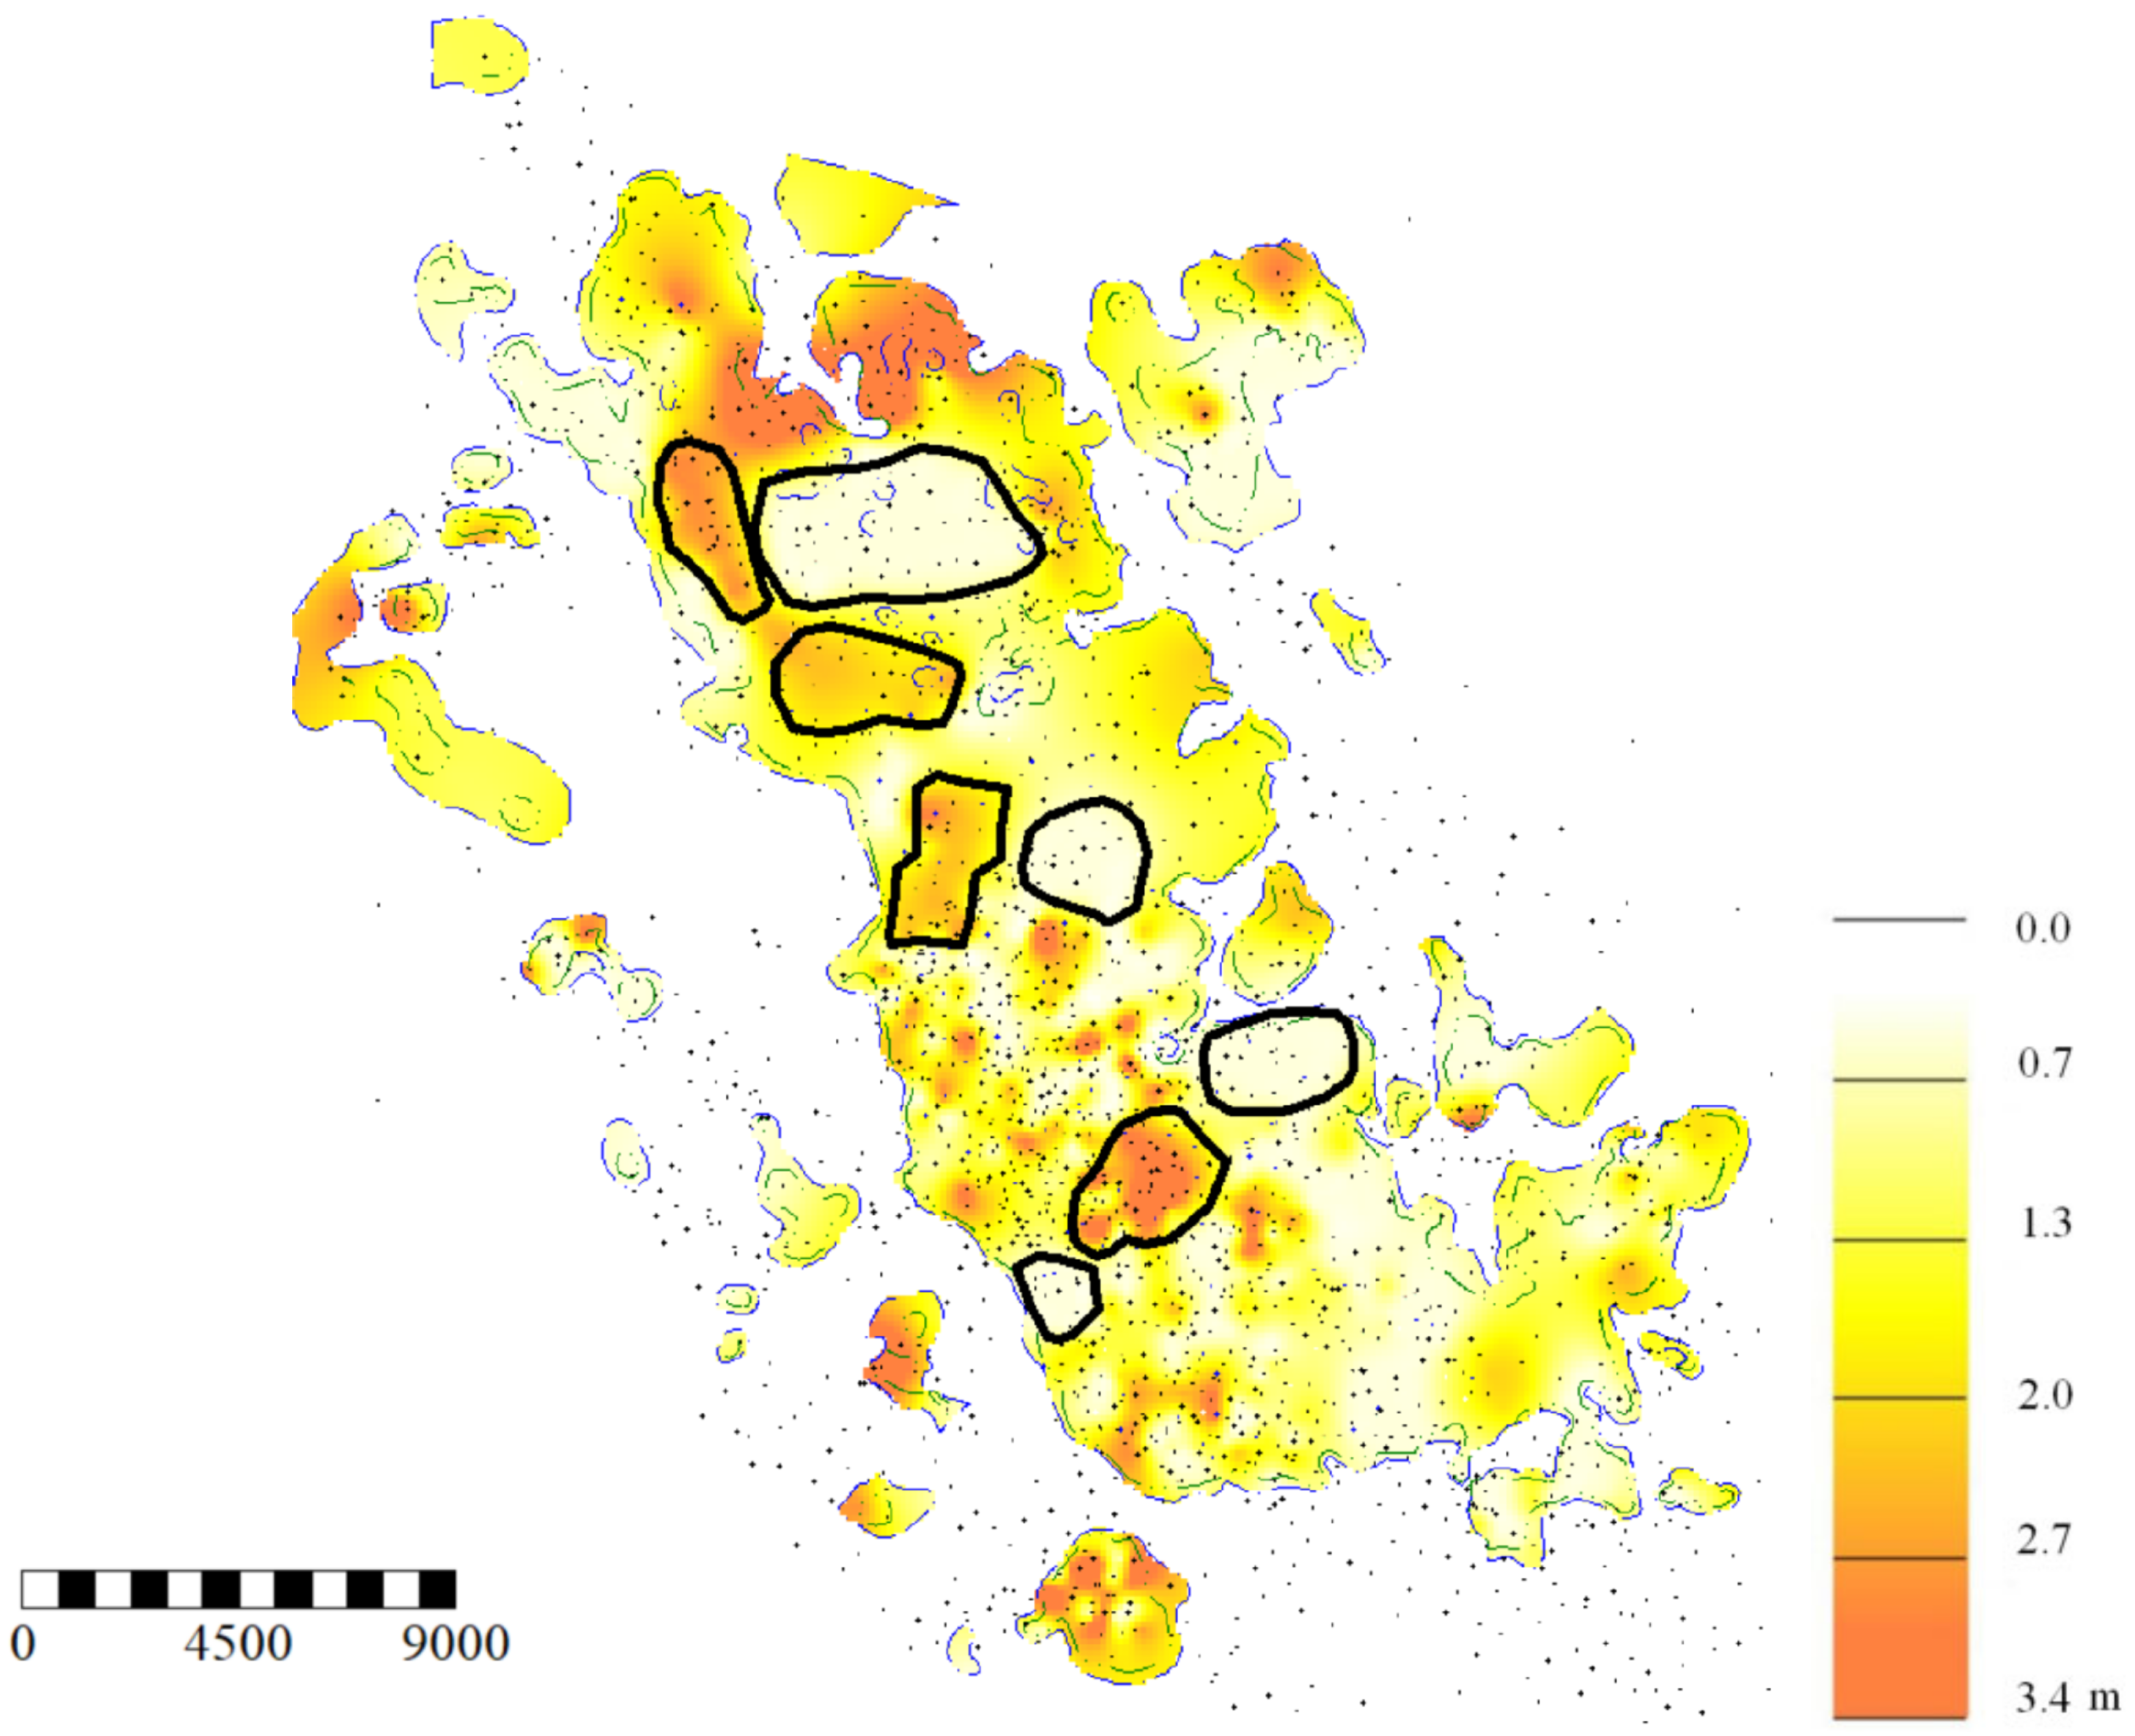
The presence of water during commissioning is mainly explained by the hydrodynamic connectivity between the layers of the Tournaisian stage. According to field geophysical studies, there are multiple inter formational cross flows from the water saturated C1crp formation to the oil saturated C1ksl, obtained over almost the entire area of the object. The beds are separated from each other by a shale barrier with a thickness of 0.5 to 4.0 m. At the same time, due to the presence of fracture noted according to core data, the barrier becomes permeable in case of a pressure drop. The additional load on the barrier is the man-made impact taking place during drilling. Figure 4 shows a map of the shale barrier thickness obtained from the well logging data.
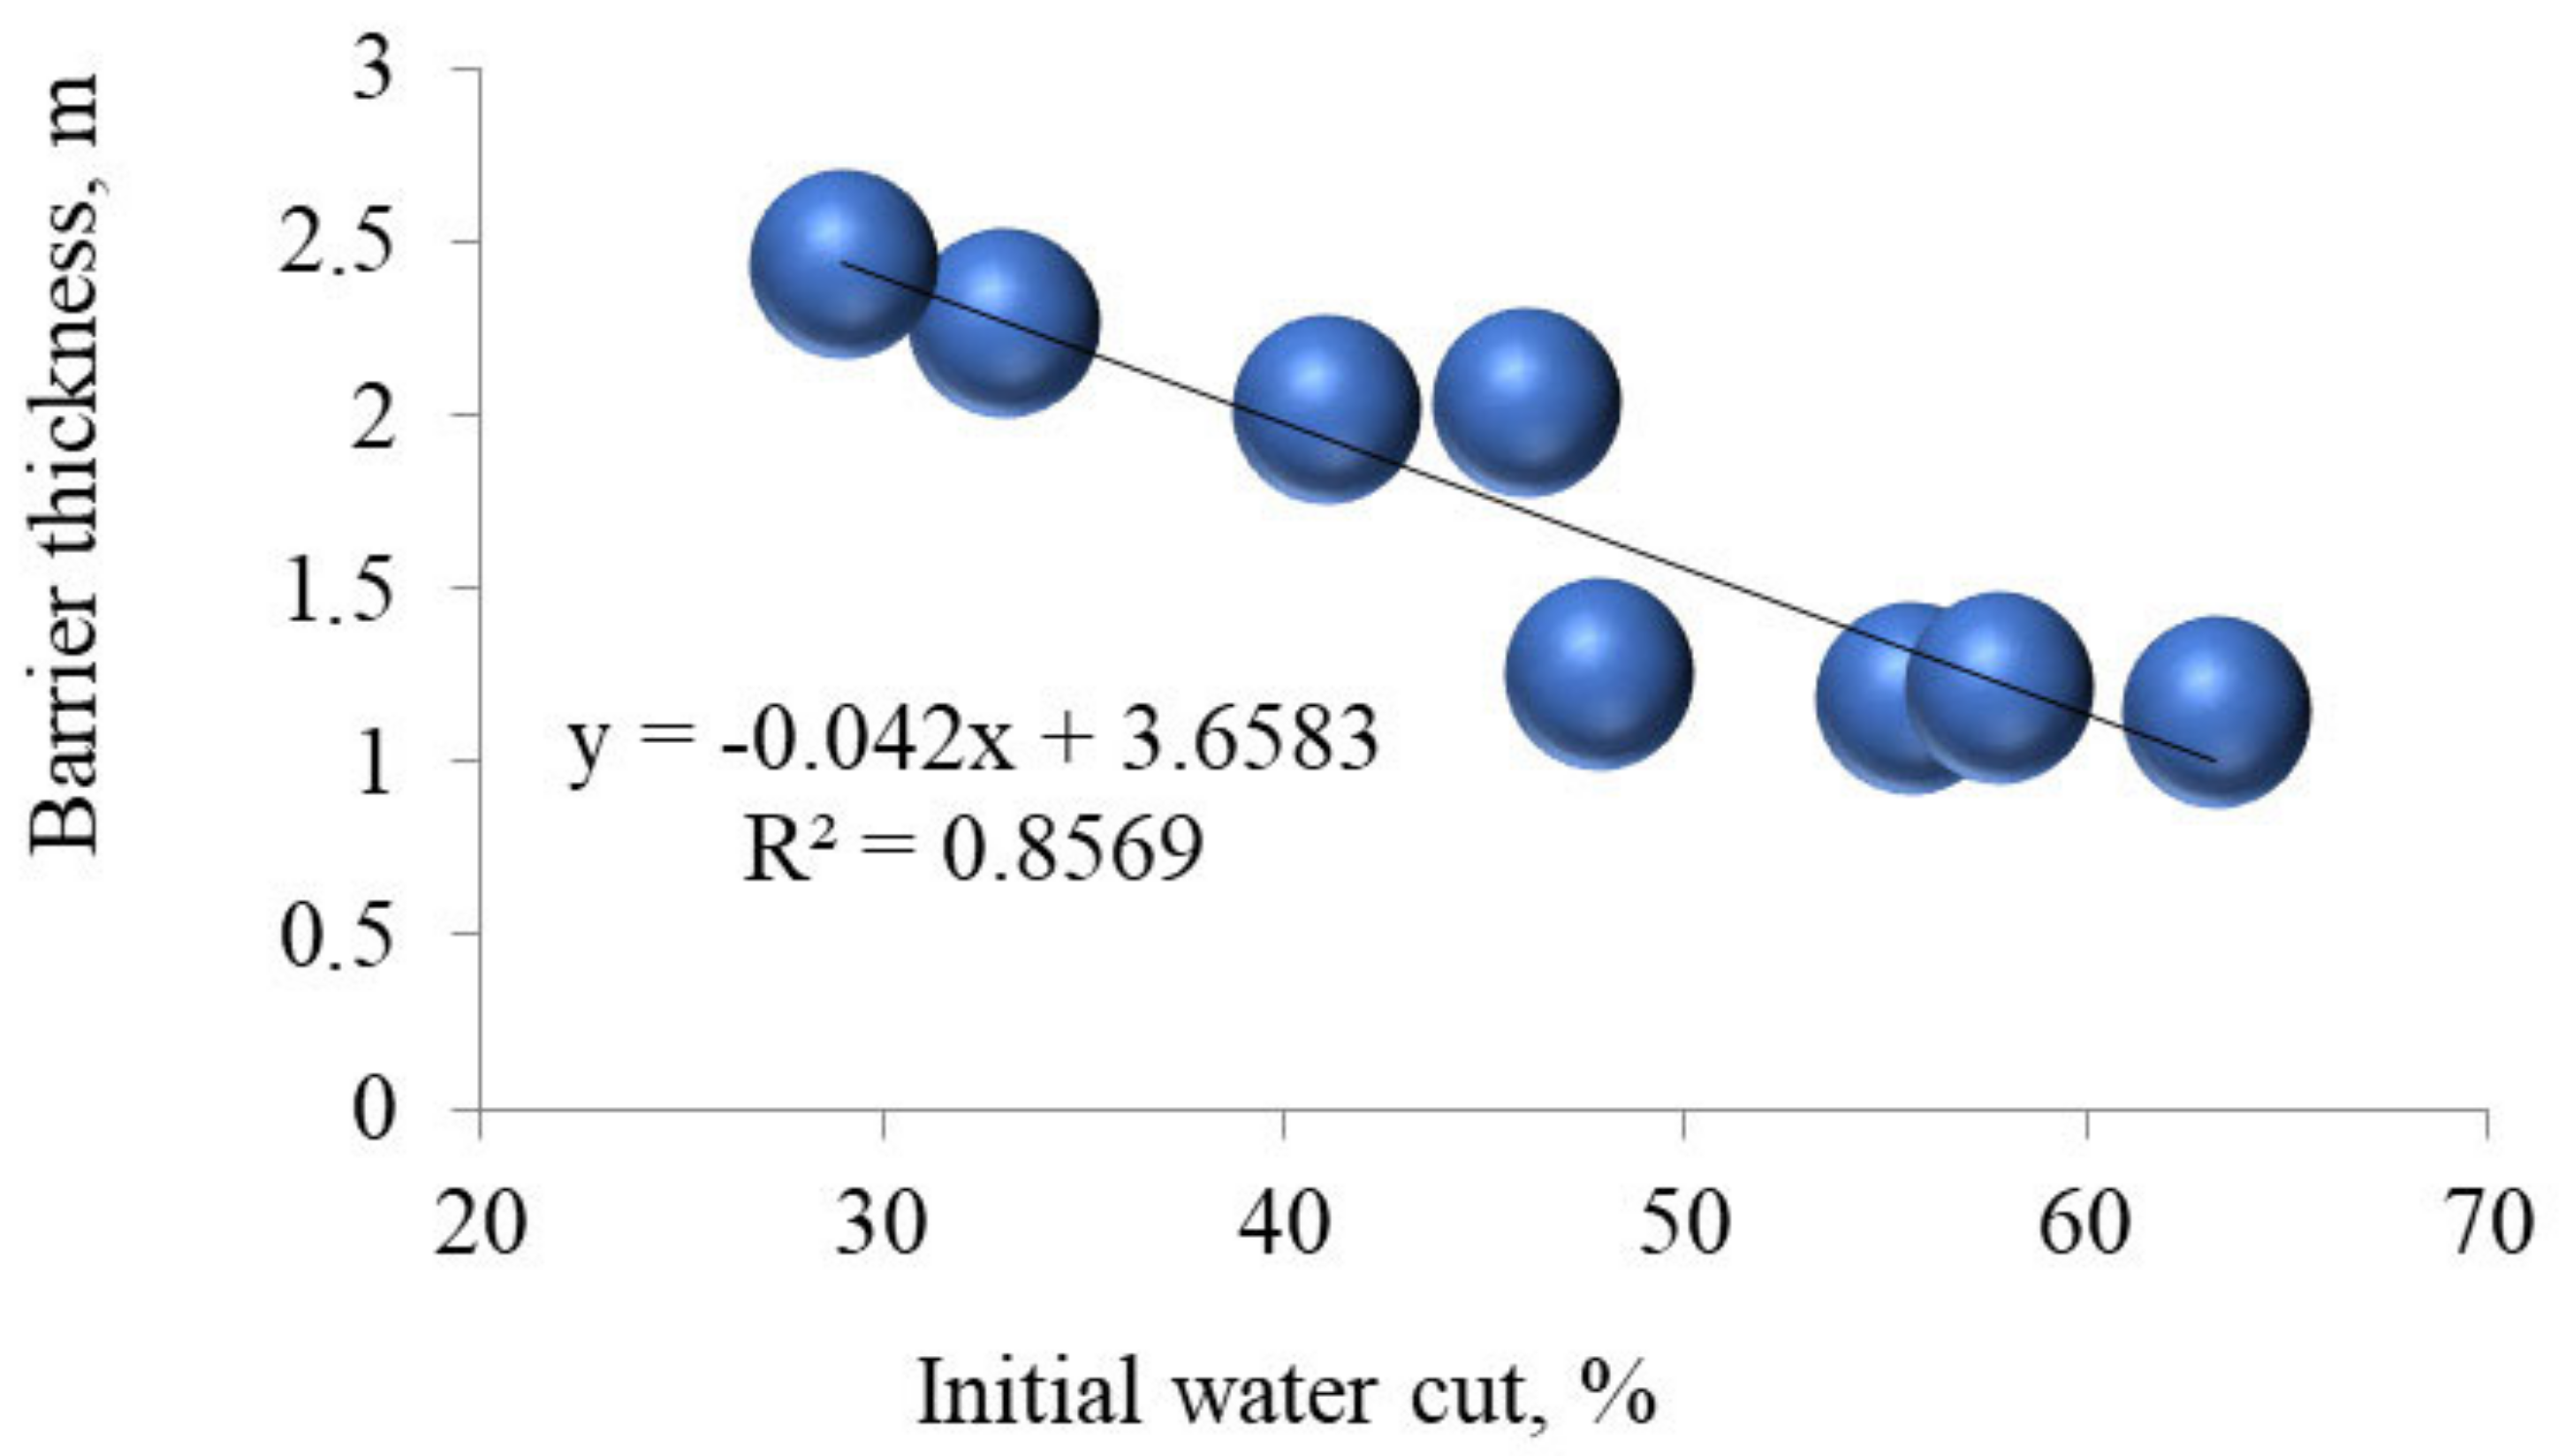
The obtained map shows several characteristic areas, differing in the absolute size of the shale bridge between the oil saturated Kizilovsky horizon and water saturated Cherepetsky horizon of the Tournaisian stage. To determine the influence of the inter stratal interface thickness on the development efficiency, there are water cut indicators, obtained when commissioning production wells, which were subsequently averaged within the allocated blocks. Figure 5 shows a graph of the mean initial water cut across the area depending on the water cut thickness to analyze the impact of the barrier thickness on the water cut.
According to Figure 5, the barrier thickness directly affects the mean initial water cut, which will further characterize the reserve recovery efficiency.
In order to identify the most promising areas from the point of view of reserve development efficiency, the mapping considered three factors: shale barrier thickness, structural factor, and productivity in the form of a conductivity parameter; the product of permeability by the reservoir net thickness. This problem was solved using the results of geophysical studies, obtained during well drilling, correlation of productive sediments, and construction of petrophysical models based on the results of laboratory studies of the core material. In this way, the maximum values were normalized according to the following formulas:
B i p o t = B i n p e r e B i n s t r B i n k H ,
where B i p o t is the coefficient of the area potential efficiency, unit fraction; B i n p e r e is the standard shale barrier thickness, unit fraction; B i n s t r is the standard coefficient of the structural reservoir barrier top, unit fraction; B i n k H is the standard conductivity factor, unit fraction.
The standard coefficients, in turn, are calculated using the following formulas:
B i n p e r e = B i p e r e B max p e r e ,
B i n s t r = C S B i s t r C S B i s t r max ,
B i n k h = B i k h B max k h ,
where B i p e r e is the thickness of the shale barrier at the studied point, m; B max p e r e is the maximum thickness of the shale barrier in the reservoir, m; B i s t r is the absolute elevation at the studied point, m; CS is the conditional planation surface. In this case, it is assumed equal to 1000 m. B i k h is the reservoir conductivity at the studied point, μm2·m; B max k h is the maximum reservoir conductivity, μm2·m.
The calculation of potential efficiency factors according to Formula (1) made it possible to build a map shown in Figure 6.
The highest values on the obtained map characterize the potential for high development efficiency: low initial water cut and accumulated OWR, as well as high productivity. These areas are a priority for planning activities, including development drilling.
In order to assess the full potential for reserve development, there is a need to asses the impact of the well density on the final oil recovery factor to enable further evaluation of economic profitability. The object is divided into several areas, each differing in development systems. A triangular grid with a distance between wells of 400 m is formed on the drilled part. The formation pressure maintenance (FPM) system is a selective pattern system. The identified areas differ in density of the formed system. Table 2 shows the key indicators by areas and forecast results.
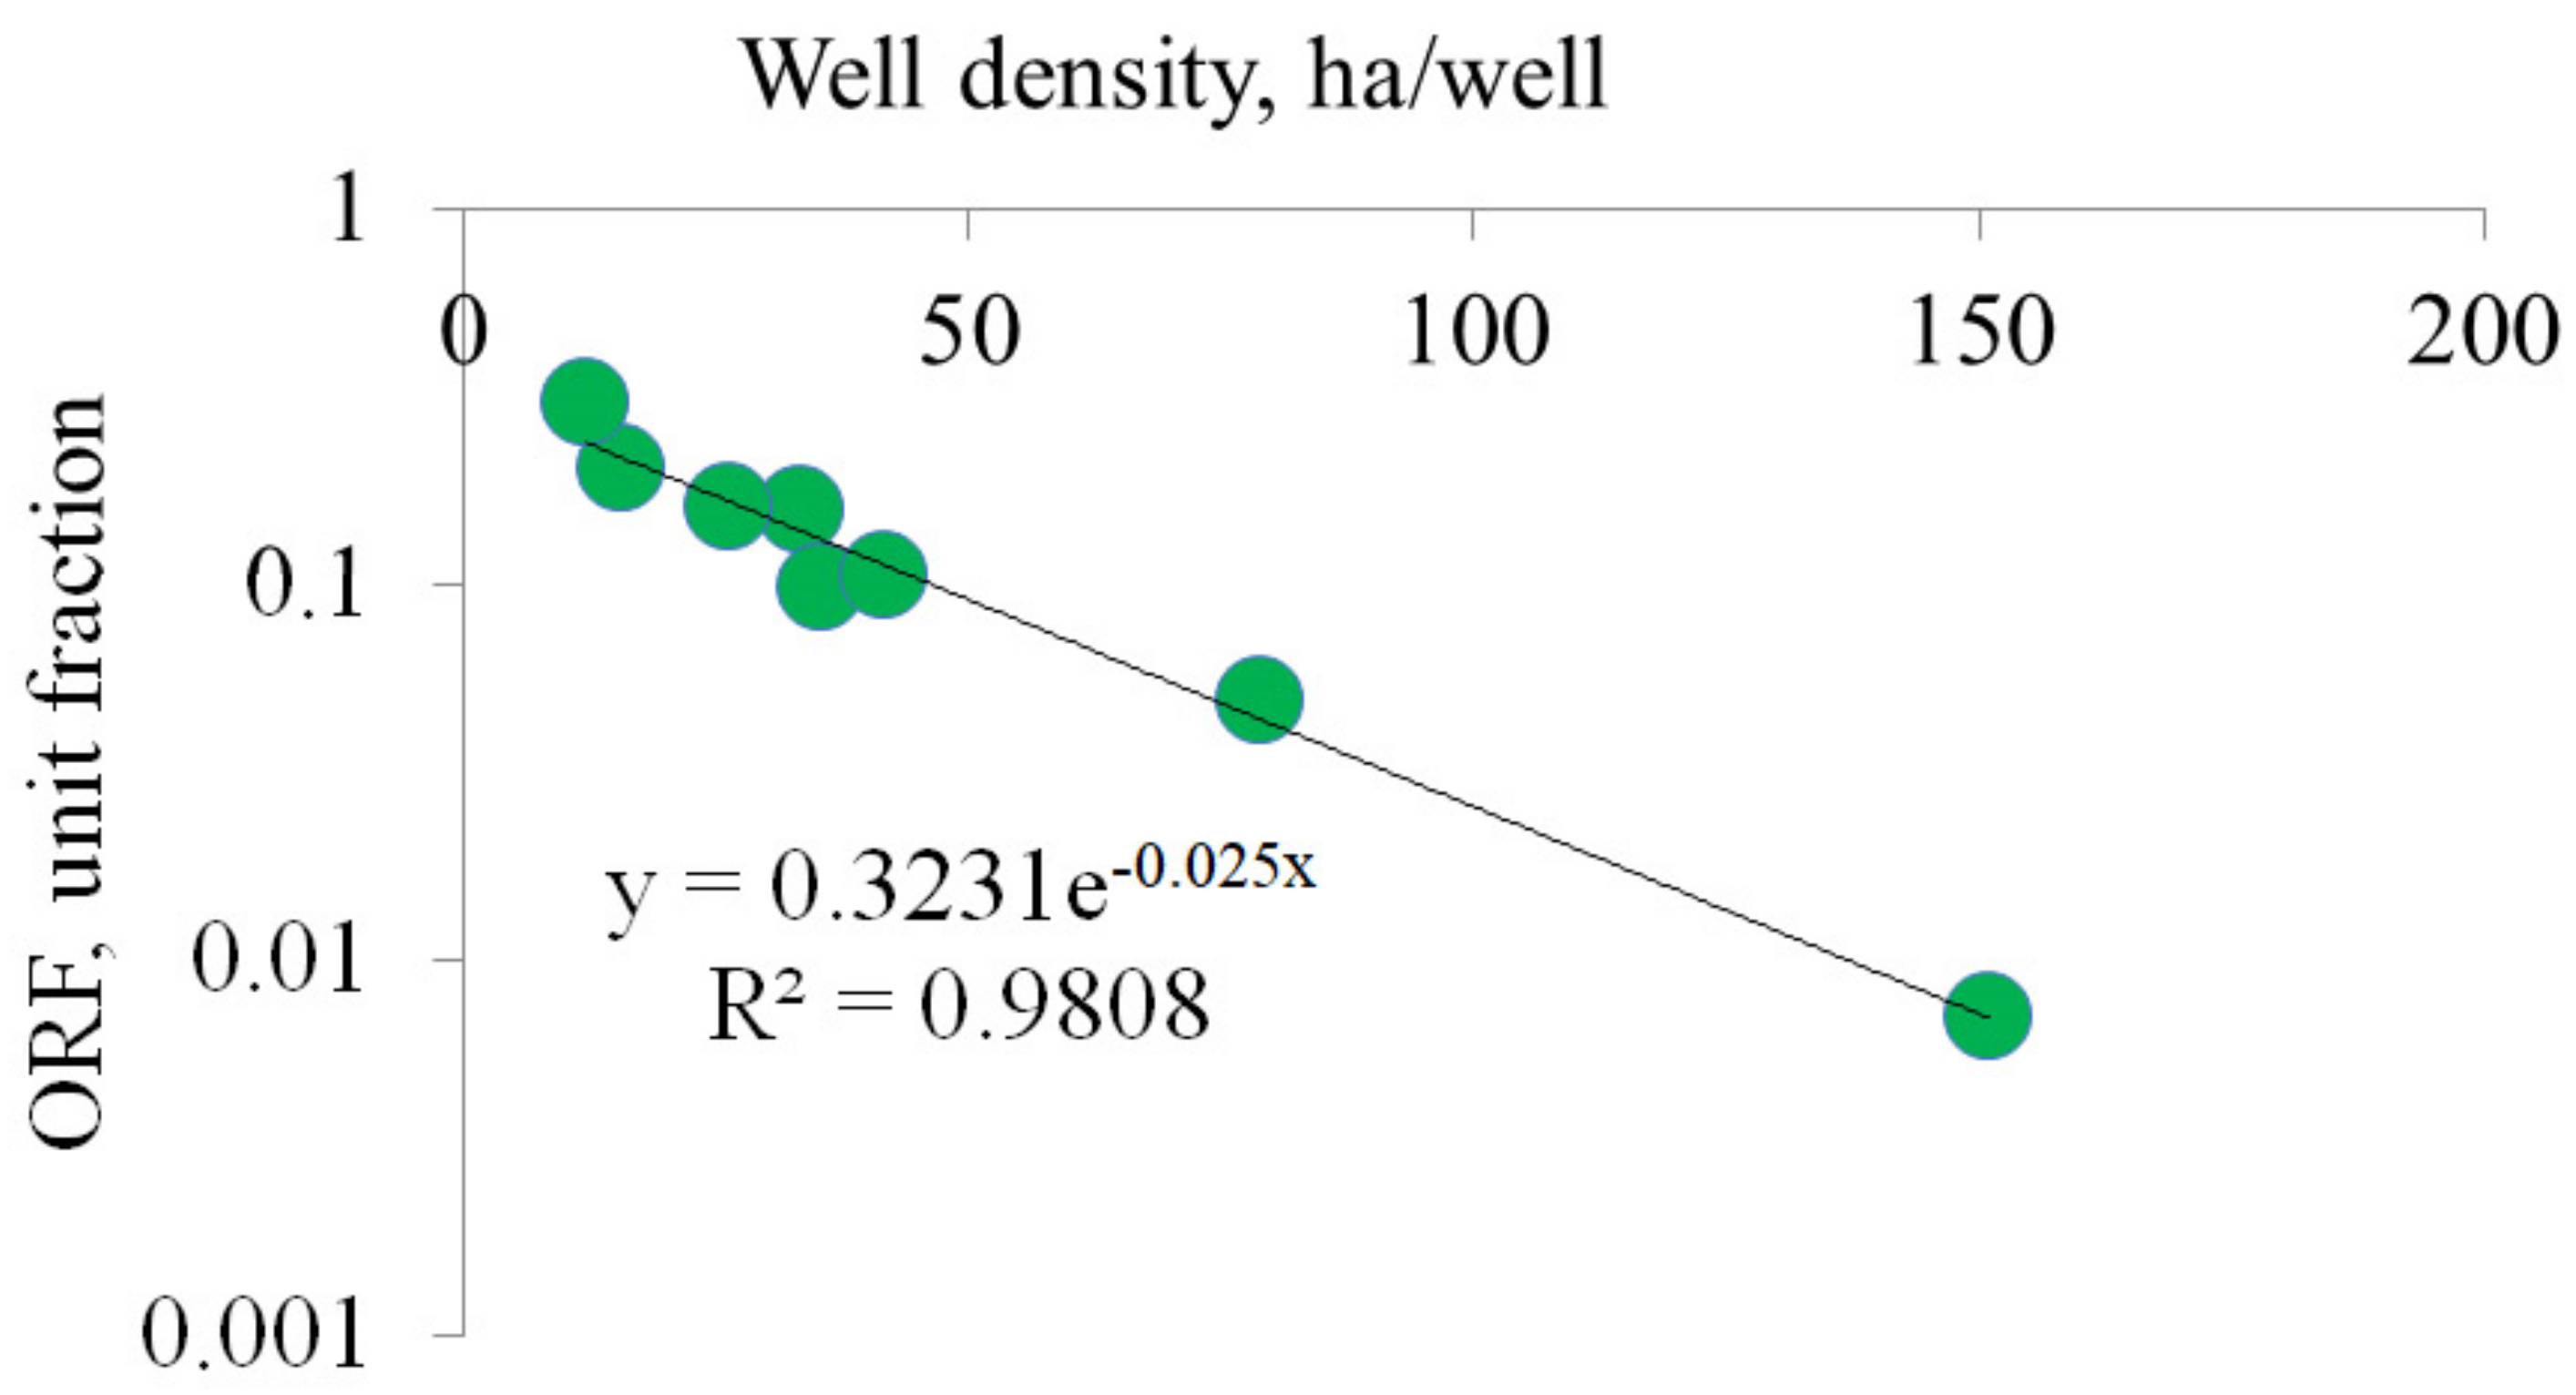
According to Table 2, the ORF, determined by the results of predicting reserve recovery under the conditions of the existing development system using hydrodynamic simulation, is exponentially dependent on the well density. The dependence is as follows:
In view of this, it is possible to perform a prompt estimate of the final oil recovery factor by selecting different well densities and substituting them into the equation presented in Figure 7.
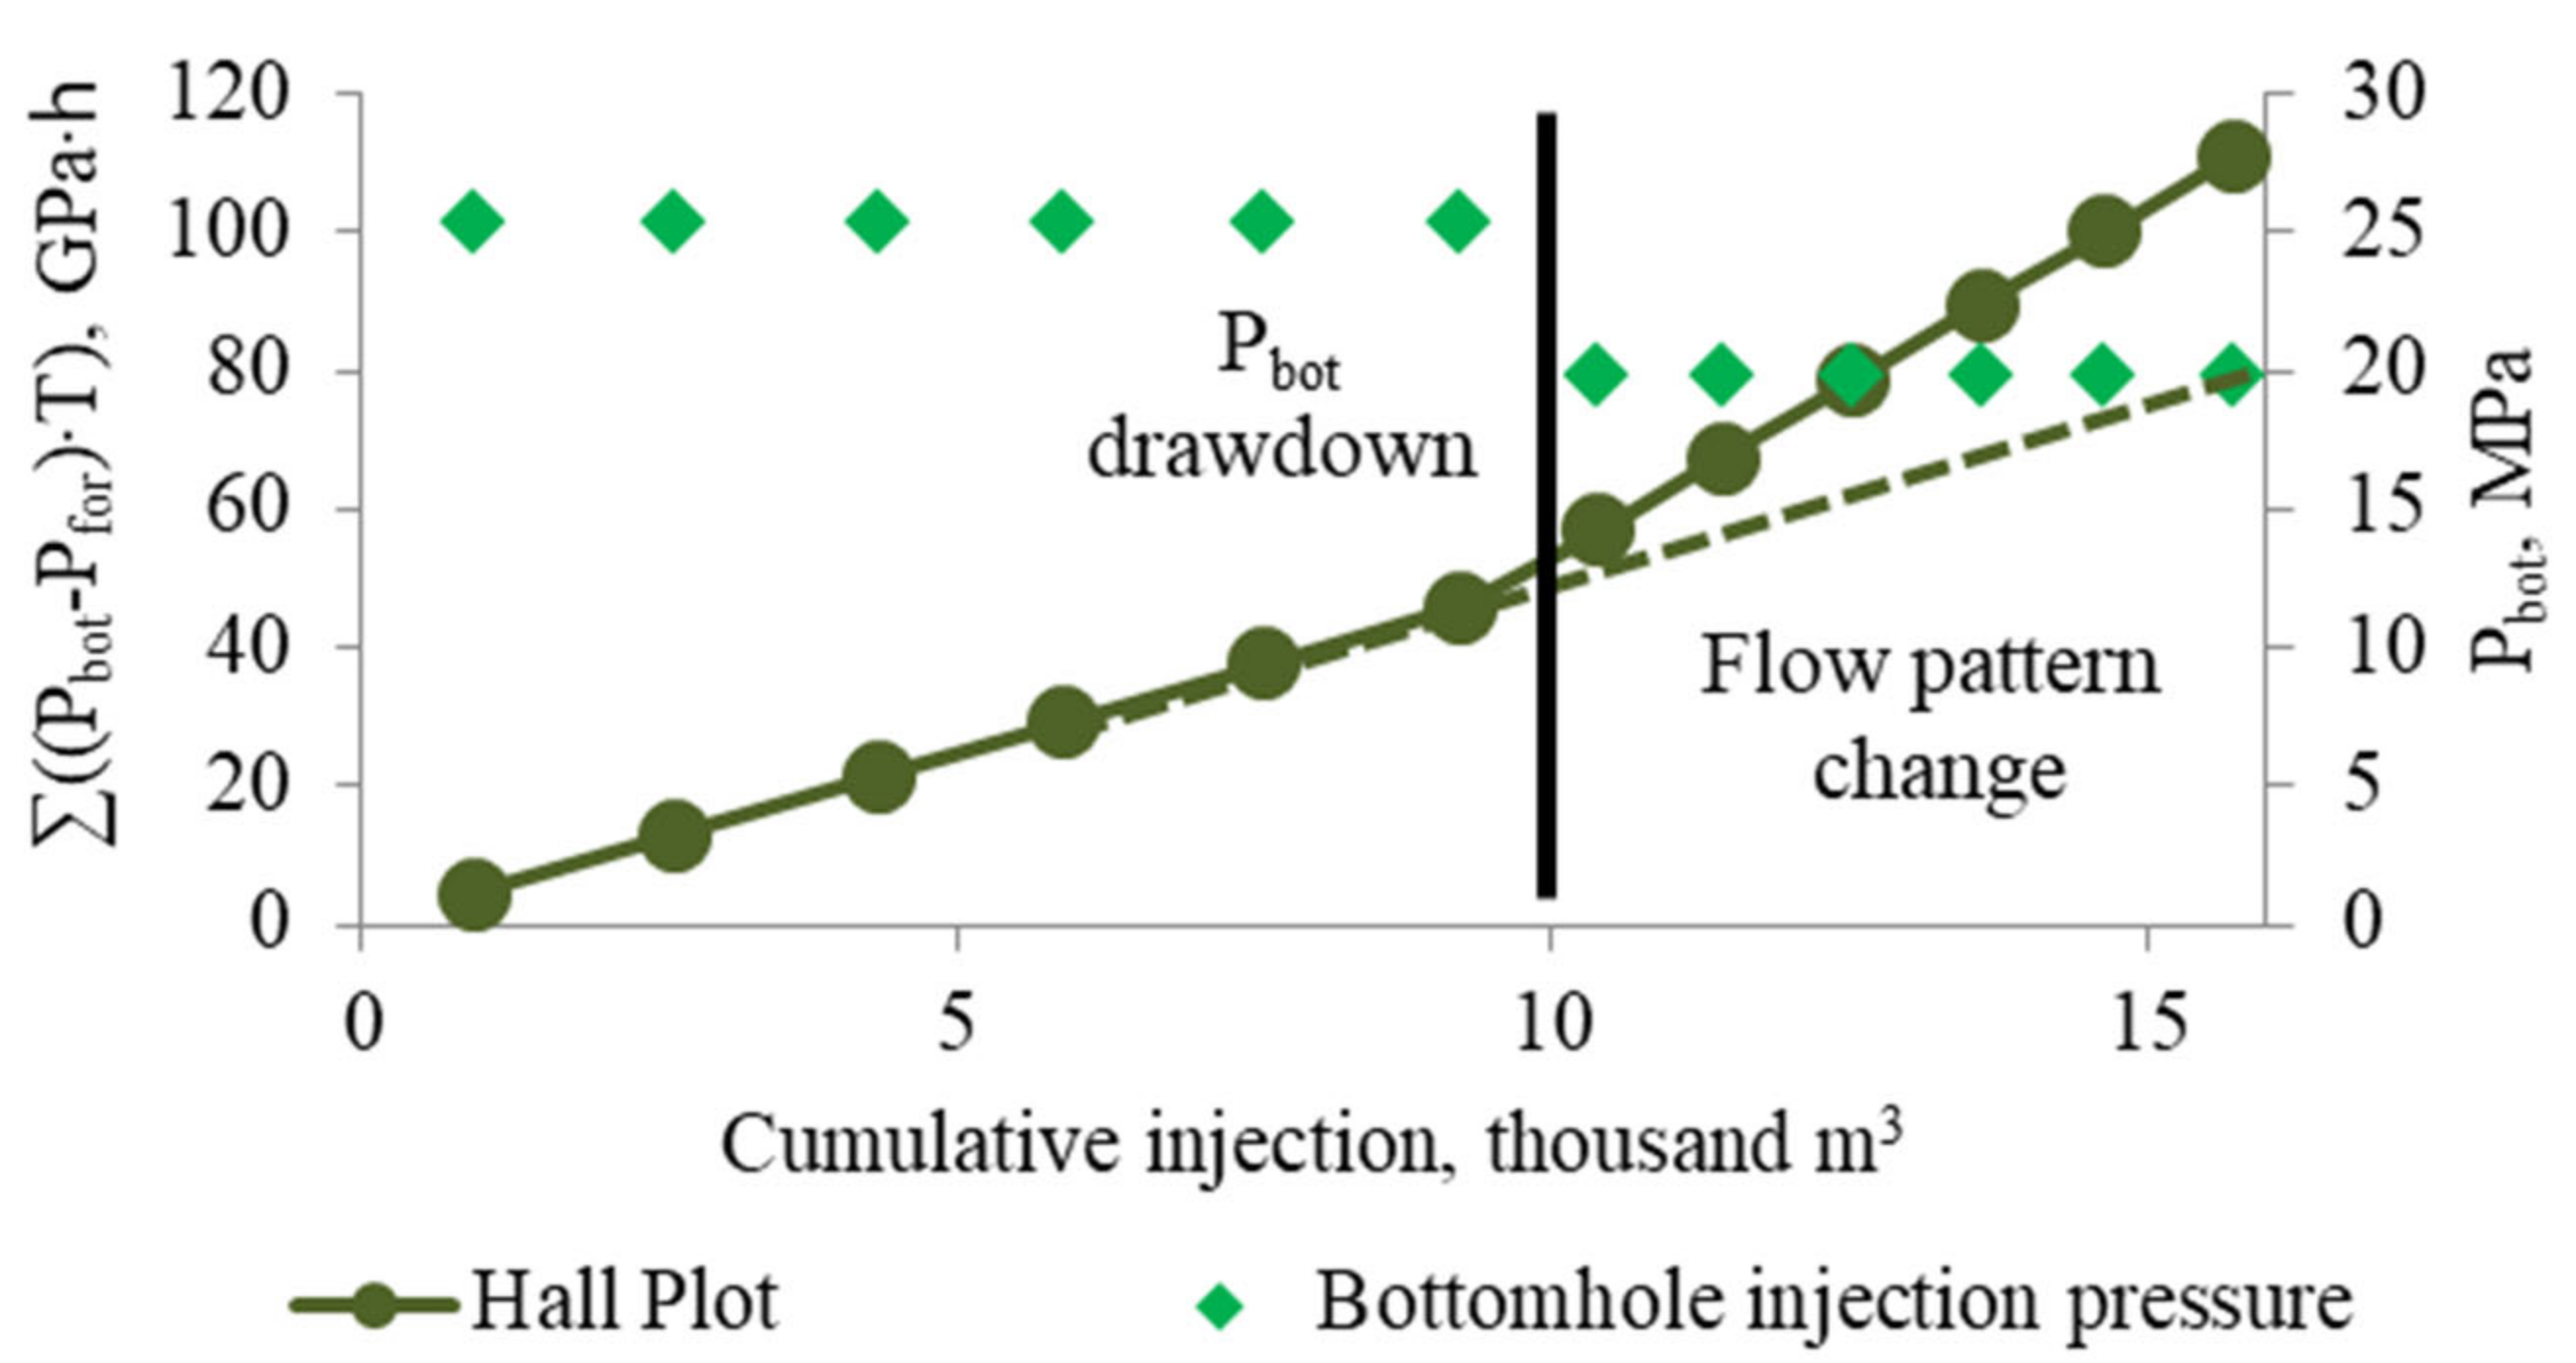
Geology also affects the efficiency of reservoir pressure maintenance. To study this process, the performance indicators of the injection wells in dynamics are considered in detail, including changes in operating regimes when adjusting wellhead injection pressures. In addition, the results of the field studies of wells and numerical methods of analysis are involved. The connectivity between the C1ksl and C1crp zones has a negative impact on waterflooding, since some of the water flows are injected into the non target, water saturated C1crp formation. Fracture filtration of the injected water is confirmed by the results of field geophysical studies through inter formational cross flows between formations; hydrodynamic studies showed the presence of linear flows to the fracture, as well as analytical methods: Hall plots [4] and the material balance method [5]. An example of the analysis of the injection well operation according to the Hall Plot is shown in Figure 8.
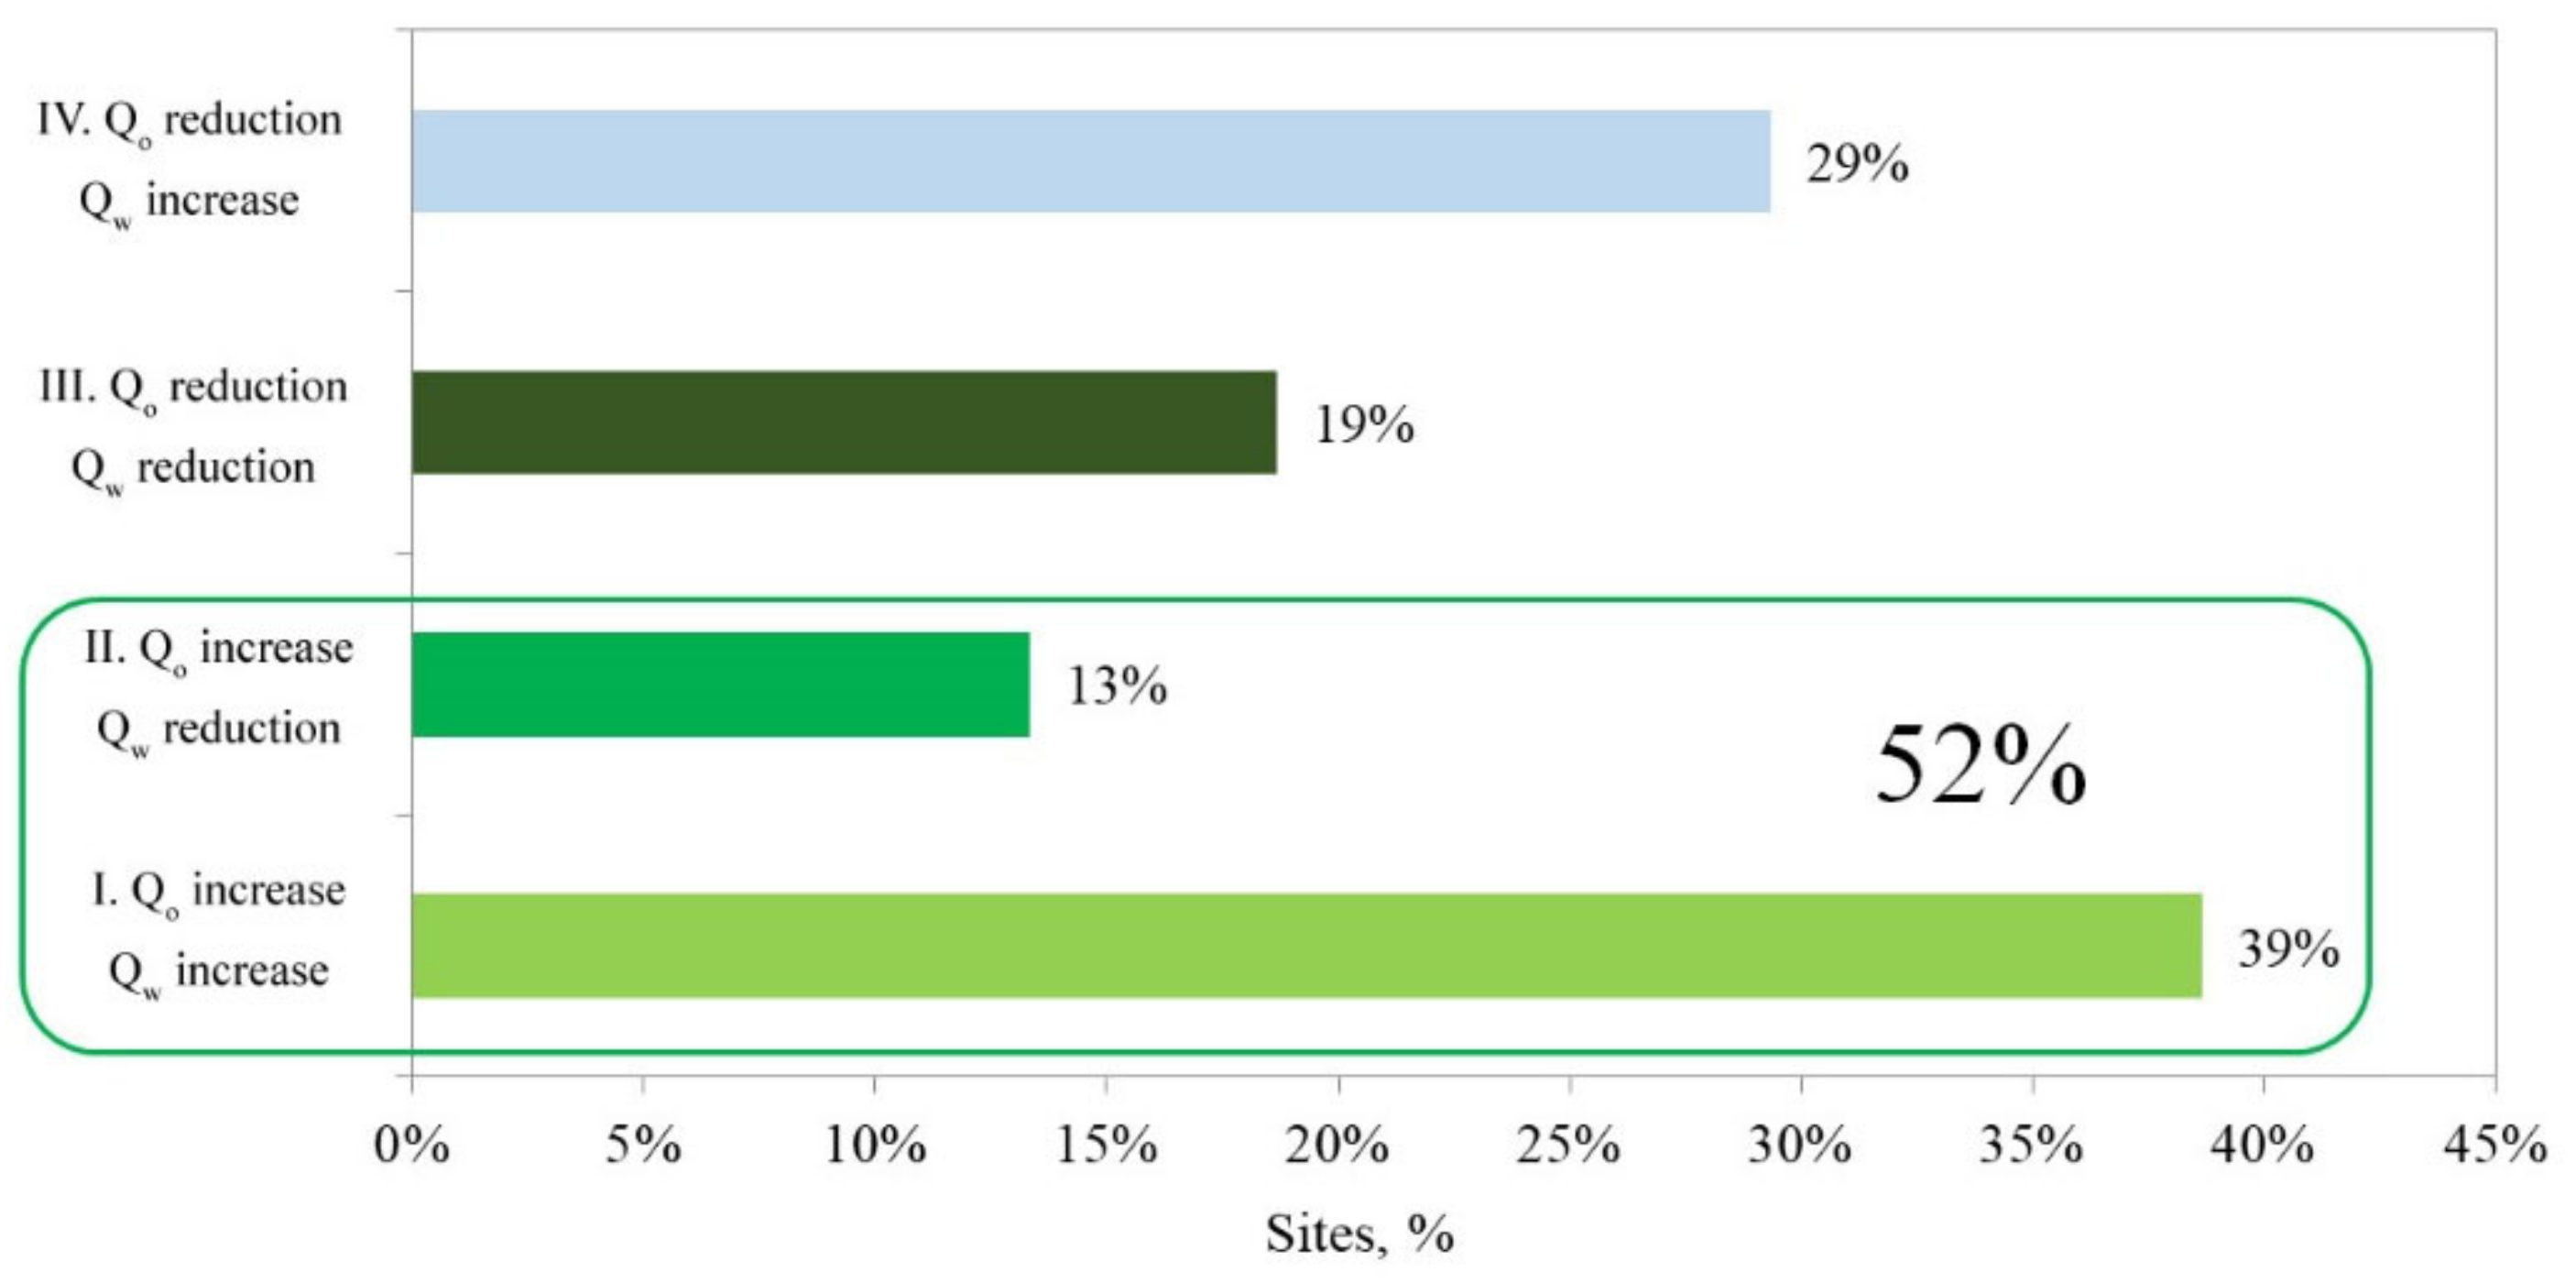
Figure 8 shows that the curve slope changed when the injection was limited by a bottomhole pressure drawdown, i.e., the flow mode changed, which is typical of the operation in the fracturing mode. According to the calculations, when using the material balance method, the proportion of water injected into non target intervals is 60–70%. At the same time, according to the analysis of the well operation dynamics, there is a positive impact of the injection established by changing the measurements of fluid yields, bottomhole pressures, and water cut on the production well stock. Figure 9 shows the statistics on changes in the performance of production wells after establishing the injection site.
According to the statistics presented in Figure 9, 52% of the sites had increased oil production rates in the first year of FPM. For the main part of the remaining sites, changes are insignificant; the effect is observed as the stabilization of indicators. Hence, injection is generally effective, but to maintain its efficiency, a high current compensation must be maintained; for this object, the compensation should be at a level of 200%, since part of the injection goes into the underlying water saturated formation. To improve the injection efficiency, there is a need to reduce the pressure on the barrier, thus reducing the amount of flow. In this regard, we developed a strategy to improve the injection efficiency for this target, which included the reduction of injection pressure and average injectivity in the injection wells. At the same time, an increase in the waterflooding coverage by the area should be planned at the expense of additional injection sites, i.e., the transition to a more rigid pressure maintenance system in terms of the ratio of production and injection wells: the current ratio is 5/1, and the target ratio is 3/1. The injection of blocking compounds must also be scheduled in order to reduce leaks and redistribute the injection across the area.

4. Conclusions

The conducted studies made it possible to establish the following:
-
The main geological feature of the considered deposits of the Tournaisian stage is the presence of fracturing, which provides a hydrodynamic connectivity between oil and water-saturated formations;
-
The shale barrier thickness between the beds, determined by logging, affects the initial water cut;
-
The structural factor has a significant impact on the change in the cumulative oil-water ratio;
-
In order to determine the most promising areas in planning priority measures to intensify the development of reserves, it is necessary to build maps that take into account the barrier thickness, the structural factor and the potential productivity of the area;
-
Well density significantly affects the oil recovery factor, and the resulting regression equation can be used to estimate the ORF for the undeveloped areas, as well as for other fields with similar geological conditions;
-
The injection efficiency of the object is also influenced by secondary cavernosity, which causes the inter formational cross flows confirmed by the data of various studies and analytical assessment methods;
-
In order to improve waterflooding efficiency, it is necessary to reduce the pressure on the barrier to reduce the leakage of the injected water. Organization of additional waterflooding sites with a more stringent development system in terms of the ratio of production and injection wells should be planned.

Author Contributions

Conceptualization, V.A.G. and V.S.M.; methodology, V.A.G. and V.S.M.; software, R.U.R.; formal analysis, V.A.G.; investigation, R.U.R.; resources, V.S.M.; data curation, V.S.M.; writing—original draft preparation, V.A.G. and R.U.R.; writing—review and editing, V.S.M.; visualization, R.U.R. All authors have read and agreed to the published version of the manuscript.

Funding

This research received no external funding.

Institutional Review Board Statement

Not applicable.

Informed Consent Statement

Not applicable.

Data Availability Statement

Not applicable.

Conflicts of Interest

The authors declare no conflict of interest.

References

  1. Suchkov, B.M. Oil Production from Carbonate Reservoirs. In Regular and Chaotic Dynamics; Izhevsk: Moscow, Russia, 2005; 688p. [Google Scholar]
  2. Dmitrievsky, A.N.; Eremin, N.A. Modern scientific-technical revolution (STR) and the shift of paradigm of hydrocarbon resources development. Equip. Technol. Oil Gas Complex 2015, 6, 10–16. [Google Scholar]
  3. Khisamov, R.S.; Khabibrakhmanov, A.G.; Podavalov, V.B.; Kemaeva, Y.P.; Mironova, L.M. Geological features and prospects for development of low-permeability carbonate reservoirs of Rodveryuskoye oil field. Oil Ind. 2016, 11, 84–87. [Google Scholar]
  4. Long, H.; Thang, V.T.; Truong, H.T.; Quy, M.N.; Ngoc, Q.P.; Hien, H.D.; Linh, H. Study and apply the advanced analysis algorithm to screen the optimal enhanced oil recovery solution for oil and gas fields in Viet Nam. J. Min. Earth Sci. 2021, 62, 17–29. [Google Scholar] [CrossRef]
  5. Piantanida, M.; Bonamini, E.; Caborni, C.; Bergero, F.; Staar, P.; Dolfi, M.; Auer, C.; Saturnino, V. Using knowledge graphs to navigate through geological concepts extracted from documents. In Proceedings of the 15th OMC Med Energy Conference and Exhibition, Ravena, Italy, 28–30 September 2021; pp. 1–10. [Google Scholar]
  6. Yuanjun, L.; Robello, S. Reservoir ranking map sketching for selection of infill and replacement drilling locations using machine learning technique. In Proceedings of the Abu Dhabi International Petroleum Exhibithion and Conference, Abu Dhabi, United Arab Emirates, 12–15 November 2018. [Google Scholar] [CrossRef]
  7. Fathy, D.; Wagreich, M.; Sami, M. Geochemical evidence for photic zone euxinia during greenhouse climate in the Tethys Sea, Egypt. In Advances in Geophysics, Tectonics and Petroleum Geosciences; Springer: Cham, Switzerland, 2022; pp. 373–374. [Google Scholar] [CrossRef]
  8. Abouhenidi, M.; Fadul, R.; Tadamarry, F.; Rahdi, Y. Streamlining and automating geological requirements for development wells. In Proceedings of the SPE Middle East Oil and Gas Show and Conference, Manama, Bahrain, 18–21 March 2019. [Google Scholar] [CrossRef]
  9. Lianhua, H.; Zhichao, Y.; Xia, L.; Senhu, L.; Zhongying, Z.; Zhi, Y.; Songtao, W.; Jingwei, C.; Lijun, Z. Key geological factors controlling the estimated ultimate recovery of shale oil and gas: A case study of the Eagle Ford shale, Gulf Coast Basin, USA. Pet. Explor. Dev. 2021, 48, 762–774. [Google Scholar] [CrossRef]
  10. Grishchenko, V.A.; Gareev, R.R.; Tsiklis, I.M.; Mukhametshin, V.V.; Yakupov, R.F. Expanding the amount of preferential royalty facilities with hard-to-recover oil reserves. SOCAR Proc. 2021, 2, 8–18. [Google Scholar] [CrossRef]
  11. Khisamiev, T.R.; Bashirov, I.R.; Mukhametshin, V.S.; Kuleshova, L.S.; Yakupov, R.F.; Vagizov, A.M. Results of the development system optimization and increasing the efficiency of carbonate reserves extraction of the turney stage of the Chetyrmansky deposit. SOCAR Proc. 2021, 2, 131–142. [Google Scholar] [CrossRef]
  12. Setya Wardhana, B.A.; Titaley, G.S.; Purwatiningsih, N. An integrated geological approach for a successful waterflood implementations and EOR planning: Lesson learned from T field development, Barito Basin, Indonesia. In Proceedings of the SPE/IATMI Asia Pacific Oil & Gas Conference and Exhibition, Bali, Indonesia, 29–31 October 2019. [Google Scholar] [CrossRef]
  13. Feder, J. Artificial Intelligence-Driven Timelines Help Optimize Well Life Cycle. J. Pet. Technol. 2020, 72, 50–51. [Google Scholar] [CrossRef]
  14. Tanzharykov, P.A.; Sarabekova, U.Z.; Tulegen, A.E. Risk assessment in oil and gas production. Oil Gas 2021, 1, 95–107. [Google Scholar] [CrossRef] [PubMed]
  15. Mardashov, D.V.; Rogachev, M.K.; Zeigman, Y.V.; Mukhametshin, V.V. Well killing technology before workover operation in complicated conditions. Energies 2021, 14, 654. [Google Scholar] [CrossRef]
  16. Zoveidavianpoor, M.; Samsuri, A.; Shadizadeh, S.R. Development of a fuzzy system model for candidate-well selection for hydraulic fracturing in a carbonate reservoir. In Proceedings of the SPE Oil and Gas India Conference and Exhibition, Mumbai, India, 28–30 March 2012; 25p. [Google Scholar] [CrossRef] [Green Version]
  17. Kudryashov, S.I.; Belkina, E.Y.; Khasanov, M.M.; Pavlov, V.A.; Tarasov, P.A. Quantitative approach of using of analogs in exploration and field development. Oil Ind. 2015, 4, 43–47. [Google Scholar]
  18. Khuzin, R.R.; Bakhtizin, R.N.; Andreev, V.E.; Kuleshova, L.S.; Mukhametshin, V.V.; Sultanov, S.K. Oil recovery enhancement by reservoir hydraulic compression technique employment. SOCAR Proc. 2021, 1, 98–108. [Google Scholar] [CrossRef]
  19. Muslimov, R.K. A new strategy for the development of oil fields in modern Russi—Optimization of production and maximization of KIN. Oil Gas. Innov. 2016, 4, 8–17. [Google Scholar]
  20. Minnikhanov, R.N.; Maganov, N.U.; Khisamov, R.S. On creation of research and testing facilities to promote study of nonconventional oil reserves in Tatarstan. Oil Ind. 2016, 8, 60–63. [Google Scholar]
  21. Mukhametshin, V.S.; Khakimzyanov, I.N.; Bakhtizin, R.N.; Kuleshova, L.S. Differentiation and grouping of complex-structured oil reservoirs in carbonate reservoirs in development management problems solving. SOCAR Proc. 2021, 1, 88–97. [Google Scholar] [CrossRef]
  22. Zakaria, A.S.; Nasr-El-Din, H.A. A novel polymer-assisted emulsified-acid system improves the efficiency of carbonate matrix acidizing. SPE J. 2016, 21, 14. [Google Scholar] [CrossRef]
  23. Back, M.J.; Kirk, G. An integrated portfolio management approach for more effective business planning. In Proceedings of the SPE Hydrocarbon Economics and Evaluation Symposium, Calgary, AL, Canada, 24–25 September 2012; p. 12. [Google Scholar] [CrossRef]
  24. Rogachev, M.K.; Mukhametshin, V.V. Control and regulation of the hydrochloric acid treatment of the bottomhole zone based on field-geological data. J. Min. Inst. 2018, 231, 275–280. [Google Scholar] [CrossRef]
  25. Husein, N.; Malyavko, E.; Novikov, I.; Drobot, A.; Buyanov, A.; Potapova, E.; Upadhye, V. Recovery improvement using geological, technical and operational factors of field development that influence the character of inflow profiles in horizontal laterals. In Proceedings of the SPE Middle East Oil & Gas Show and Conference, Virtual, 28 November–1 December 2021. [Google Scholar] [CrossRef]
  26. Economides, J.M.; Nolte, K.I. Reservoir Stimulation; John Wiley and Sons: West Sussex, UK, 2000; 856p. [Google Scholar]
  27. Nurov, S.R.; Yakupov, R.F.; Mukhametshin, V.V.; Gareev, A.T.; Kuleshova, L.S.; Faizov, I.A. Increasing the efficiency management of carbonate oil deposits development in the Kashiro-Podolsk deposits of the Birsk saddle. SOCAR Proc. 2022, 1, 91–99. [Google Scholar] [CrossRef]
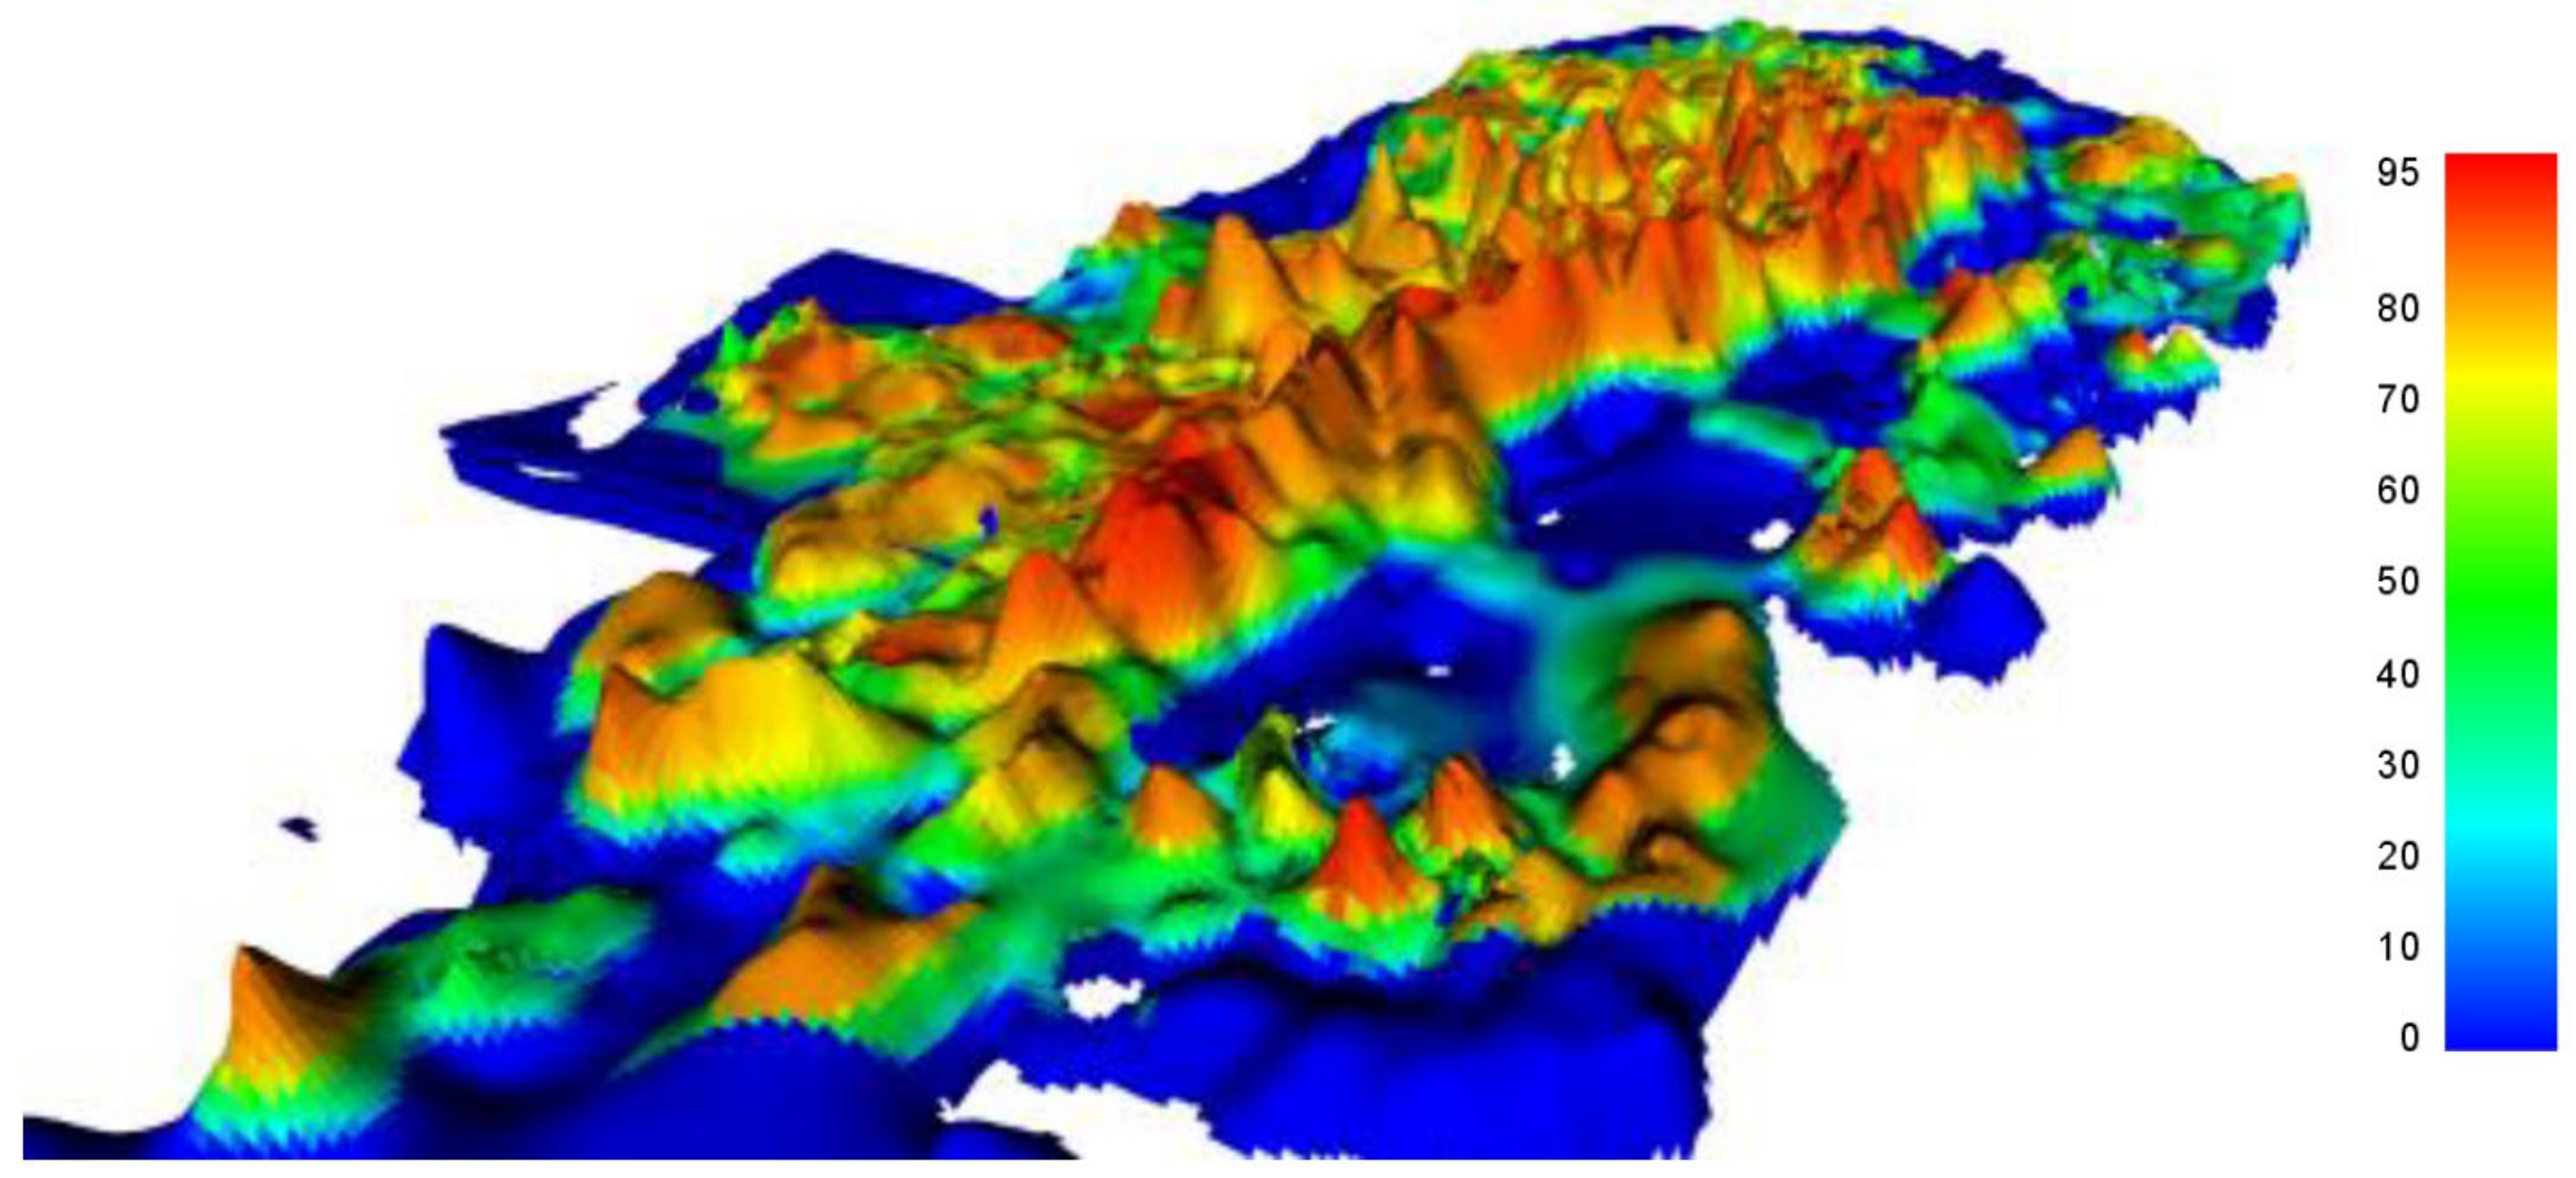
Figure 1. Change in the oil content of the Kizilovsky reservoir.
Energies 15 09002 g001
Figure 2. Images of the core of the Tournaisian stage; (a)-image of cavities and microcracks; (b)-display of traces of rock leaching and small caverns; (c)-chaotic distribution of small cavities and horizontal microcracks; (d)-photograph of a large cavity.
Energies 15 09002 g002
Figure 3. Impact of the true vertical depth of the reservoir top on the accumulated OWR.
Energies 15 09002 g003
Figure 4. Map of the shale barrier thickness of the shale bridge between Kizilovsky and Cherepetsky horizons.
Energies 15 09002 g004
Figure 5. Impact of the shale barrier thickness on the initial water cut.
Energies 15 09002 g005
Figure 6. Change in the potential efficiency by areas.
Energies 15 09002 g006
Figure 7. Dependence of the oil recovery factor on the well density.
Energies 15 09002 g007
Figure 8. Impact of the bottomhole pressure in the injection well on the change of the cumulative water injection (Pfor is the initial formation pressure; Pbot is the bottomhole pressure).
Energies 15 09002 g008
Figure 9. Distribution of sites by changes in the parameters after injection (Qo, Qw are production well oil and water flowrates).
Energies 15 09002 g009
Table 1. Comparison of boundary and mean values of the main petrophysical parameters.
Indicator Value
Average net oil thickness, m6.3
Porosity, unit fraction0.1
Oil content, unit fraction0.76
permeability, 10−3 µm28.0
Net sand, unit fraction0.6
Sand-to-shale ratio2.5
Table 2. Development indicators for selected areas.
ParameterArea
123456Other
Initial oil in place, thousand tons2078834913,1487018729347787775
Initial recoverable reserves, thousand tons384212035631902189610991938
Remaining recoverable reserves, thousand tons374963524130415197011681
Cumulative oil production, thousand tons1011573039598377398257
Cumulative fluid production, thousand tons8930938314172911121107760
Water cut, %7672.874.968.476.574.876.3
Current ORF, unit fraction0.0050.1390.2310.0850.0520.0830.033
Recovery of initial recoverable reserves (IRR), %3558531203613
Cumulative injection, thousand m3-965717,97342562383773.6852
Exhausted production/injection well stock, number of wells11/-205/39349/6366/993/1271/661/3
Well density, ha/well150.915.51233.535.441.679
Predicted ORF by HDM, unit fraction0.0070.2030.3040.1560.0970.1060.048
Publisher’s Note: MDPI stays neutral with regard to jurisdictional claims in published maps and institutional affiliations.