Article

Detailing the Pore Structure of Productive Intervals of Oil Wells Using the Color 3D Imaging

by
Vladislav B. Zaalishvili
1,*,
Adalat B. Hasanov
2,
Elmeddin Y. Abbasov
3 and
Dildar N. Mammadova
4
1
Geophysical Institute, Vladikavkaz Scientific Center RAS (GPI VSC RAS), 362002 Vladikavkaz, Russia
2
Oil and Gas Institute, ANAS, Azerbaijan 9, F.Amirov Str., Baku AZ1000, Azerbaijan
3
Socar, Mining Geophysics Department, Heydar Aliyev, 83A, Baku AZ1033, Azerbaijan
4
Institute of Geology and Geophysics, ANAS, H.Javid Ave. 119, Baku AZ1143, Azerbaijan
*
Author to whom correspondence should be addressed.
Energies 2023, 16(1), 217; https://doi.org/10.3390/en16010217
Submission received: 14 November 2022 / Revised: 10 December 2022 / Accepted: 20 December 2022 / Published: 25 December 2022

Abstract

:
The article describes an approach to expanding the methodology for applying hydraulic fracturing in oil fields by adding the possibilities of 3D modeling with color imaging of the pore structure of the productive intervals of wells. As an applied example, the geological and geophysical section of the productive level of one of the wells of the Moscudinskoye oil field, with known data on the integrated interpretation of the results of well-logging and microcomputer tomography, was chosen. According to well-logging data, the productive reservoir in the analyzed section of the section is characterized by a high degree of heterogeneity. Tomographic studies of a full-size core made it possible to identify four lithotypes here with different pore structure features. Accounting for the identified reservoir heterogeneity, as well as data on the thickness and other characteristics of reservoir properties of individual lithotypes that make up the section, made it possible to significantly increase the detail of the final geological model of the wellbore section. A distinctive feature of this final geological model is the use of the method of enlargement of the initial data array by adding intermediate values that were calculated theoretically. The visibility of the final geological model of the borehole walls is provided by color 3D imaging of the calculated data of the enlarged massif and makes it possible to judge the presence of areas with good and weak fluid conductivity on the lateral surface of the borehole walls. According to this model, intrastratal transverse and longitudinal fluid-conducting “corridors” are observed in the circumwell zone that determine the hydro-dynamic movements of natural and artificial fluids in the space of productive reservoirs.

1. Introduction

The development of the modern global oil industry is largely determined by the fact that the long history of exploitation of most easily recoverable reserves has led to a noticeable depletion of known large fields [1,2,3,4]. An example is the long-term exploited well-known oil fields of Azerbaijan, the Volga-Ural oil and gas basin, and many others, where terrigenous oil deposits with the best porosity and permeability properties (PPP) of watered horizons are situated. In this regard, the creation of new combined environmentally friendly and efficient technologies for intensifying oil production is of particular importance, as this will increase the oil recovery factor, significantly save material resources, and reduce environmental impact. Such technologies can be based both on new theoretical approaches and on the development of best practices for the development of depleted oil and gas fields. As an example of the theoretical approach to predicting the stability of the reservoir properties of sediments at great depths, the use of fuzzy logic methods and flexible computing can be noted. In particular, there are studies in which fuzzy petrophysical models of reservoir rocks were discussed in terms of representing experimental data on polygon scattering and phase space parameters [5,6]. A number of papers consider the possibility of modeling shale porosity based on the methods of correlation–regression analysis [7]. The method of predicting petrophysical parameters based on well-logging data is also mentioned in [8], where the authors use the artificial intelligence method. In addition, reference [9] discusses the result of applying fuzzy logic in petrophysical studies and outlines the main concepts compiling the method. Another study emphasizes that the observed uncertainty of the initial parameters is associated with the heterogeneity of the studied geological objects, which is quantified by the level of confidence [5]. This approach, taking into account the relationship between the parameters, makes it possible to predict the reliability of graphical models and schemes. Among the innovative methods for the development of depleted oil and gas fields, the proppant method of hydraulic fracturing [10] and radial drilling technology [11,12] are especially noteworthy. Although hydraulic fracturing technology is more expensive and more often used for well penetration, nevertheless, this technology has long been used worldwide in the development of hard-to-recover oil reserves [13,14]. The analysis of the use of hydraulic fracturing in individual oil fields is given in several papers [15,16,17]. As follows from the above-mentioned and other publications [18], as a result of hydraulic fracturing, the reservoir is destroyed along planes of minimum strength. After pressure is removed, cracks are fixed with proppant and become reliable and long-term oil pipelines. The overall efficiency of the proppant hydraulic fracturing technology is determined by the number of fractures, their length, shape, degree of opening, etc. Thus, the degree of fluid conductivity of the reservoir is estimated by the value of the dimensionless fracture conductivity [17], and the fracture geometry during hydraulic fracturing is characterized by half-length, height and width [19]. In turn, these parameters depend on the material composition and pore structure of the reservoir. In addition, it is necessary to take into account the structural features of the oil reservoir [20,21,22]. Despite the apparent clarity of the issue, appropriate algorithms and computer programs have not yet been developed to predict the consequences of hydraulic fracturing [23]. In particular, the development of microfractures is most often carried out by standard studies of core samples. At the same time, scanning electron microscopy (Quattro-C, ThermoScientific, Waltham, MA, USA) is considered the most modern and detailed method. Often, the results of electron microscopy are supplemented by X-ray tomography of the core [24,25]. In these latter investigations, a Nikon Metrology 125 × 180 XT scanning unit was used, which makes it possible to check cracks with an opening of 20–30 µm or more on a standard-size core.
Nevertheless, such problems can be solved using data from laboratory and field experiments with core samples. Examples of such studies are given in a number of articles [26,27,28]. A certain experience in the use of hydraulic fracturing is described also in publications on the development of productive deposits of the Vereisky horizon of the Moscudinskoye oil field [10]. Here, studies carried out by the authors are based on a comprehensive study of full-size core samples by electron microscopy and microcomputed tomography.
The above review of the state of the issue on the methodologies for applying the hydraulic fracturing method in oil fields in different countries shows how relevant the task of increasing the intensification of oil production, with a high oil recovery factor, is, with significant savings in material resources and reducing the impact on the environment. With this in mind, the creation of new combined environmentally friendly and efficient technologies is of particular importance. Such technologies should be based both on new theoretical approaches and on the development of best practices for the development of depleted oil and gas fields.
The structure of this article includes an introduction, research methodology, a discussion of the results, conclusions, and 32 references.

2. Materials and Methods

The authors of the present article have attempted to expand the research methodology described in the above papers by adding the possibilities of color 3D imaging of the pore structure of the productive intervals of wells. The productive horizon of one of the wells of the Moscudinskoye oil field was used as a testing polygon (Figure 1). The identification of oil-bearing intervals in the well section was assessed by the method of neutron lifetime logging (NLL).
The oil-bearing interval of the considered field, represented by the Vereisky carbonate reservoir, was identified according to well-logging data and is characterized by a high degree of heterogeneity. The section consisted of limestones with different properties [29]. The average value of porosity in the productive part of the reservoir is 16.5%, but the porosity in the oil-saturated part reaches 17.7% (with a maximum value of 28%). The average permeability is 160 and 172 mD (with a maximum of 745 mD).
Based on these data, four lithotypes can be distinguished in the productive horizon B3B4, differing in the features of the pore structure [29]:
  • Lithotype 1 is represented by a highly permeable reservoir with a core and well-logging porosity of more than 20% (Figure 2a).
  • Lithotype 2 is interpreted by well logging as a reservoir with porosity in the range of 12–13%. According to core data, lithotype 2 is represented by alternating layers (3–10 cm) of porous and dense varieties of carbonate rocks (Figure 2b).
  • Lithotypes 3 (Figure 2c) and 4 (Figure 2d), according to well-logging data, are interpreted as non-reservoirs with porosity values of less than 7%. However, lithotype 3 is characterized by the presence of “traces” of oil, which (with active external influence) can be involved in the production process.
  • Lithotype 4 (Figure 2d) is represented by denser limestones; no oil shows were found in it.
Further experiments conducted on cores, in general, can be compared with hydraulic fracturing in the reservoir; however, some features of the tests should be pointed out. So, for the identified four rock lithotypes, cubic samples with a side of 40 mm were made, and then subjected to multiaxial loading [30,31]. Each cycle of the experiment was carried out under a condition of all-round pressure, and for lithotypes 1, 2, and 3, the pressure was maintained in the range from 10 to 20 MPa, while for lithotype 4, it did not exceed 10 MPa. Taking into account the effective pressure during the formation of the Kashira-Vereya deposits (about 12 MPa), the pressure created in the experiments is comparable to the real reservoir conditions. According to the conditions of the experiments, at constant all-round pressure, an additional load was created along the third axis. This load did not exceed the limit of elastic deformation and amounted to 40 MPa for lithotype 1; 80 MPa—for lithotype 2; 100 MPa for lithotype 3; and 140 MPa for lithotype 4. Scanning electron microscopy of the core after the loading experiments showed the relationship between permeable channels-fluid pipelines, providing the most complete extraction of oil from the reservoir.
According to [29,32], the combination of well logging with X-ray tomography and scanning electron microscopy of a full-sized core cylinder (100 mm in diameter) taken from some interval made it possible to determine the type of reservoir and the structure of the pore space. At the same time, it was found that the interval of the geological section, represented by a fractured-porous lithotype (lithotype 3), is capable of containing commercial oil reserves [29,32].

3. Results and Discussion

Taking into account the above data, the open porosity of a heterogeneous core sample can be represented as the sum of the porosities of its permeable and impermeable (dense) parts [30]:
KpFL = Dperm·KPperm + (1 – Dperm) KPop,
where KpFL is the open porosity of a heterogeneous sample; Dperm is the proportion of permeable reservoirs (estimated by X-ray tomography); KPperm is the open porosity of the permeable part of the sample; and KPop is open porosity.
It has been established that the intervals of the geological section, represented by a fractured-porous lithotype, are capable of containing commercial oil reserves [29,32]. Taking into account the heterogeneity of reservoirs, as well as data on the thickness and other characteristics of reservoir properties (RP) of the established lithotypes, can significantly increase the information content of the final geological model.
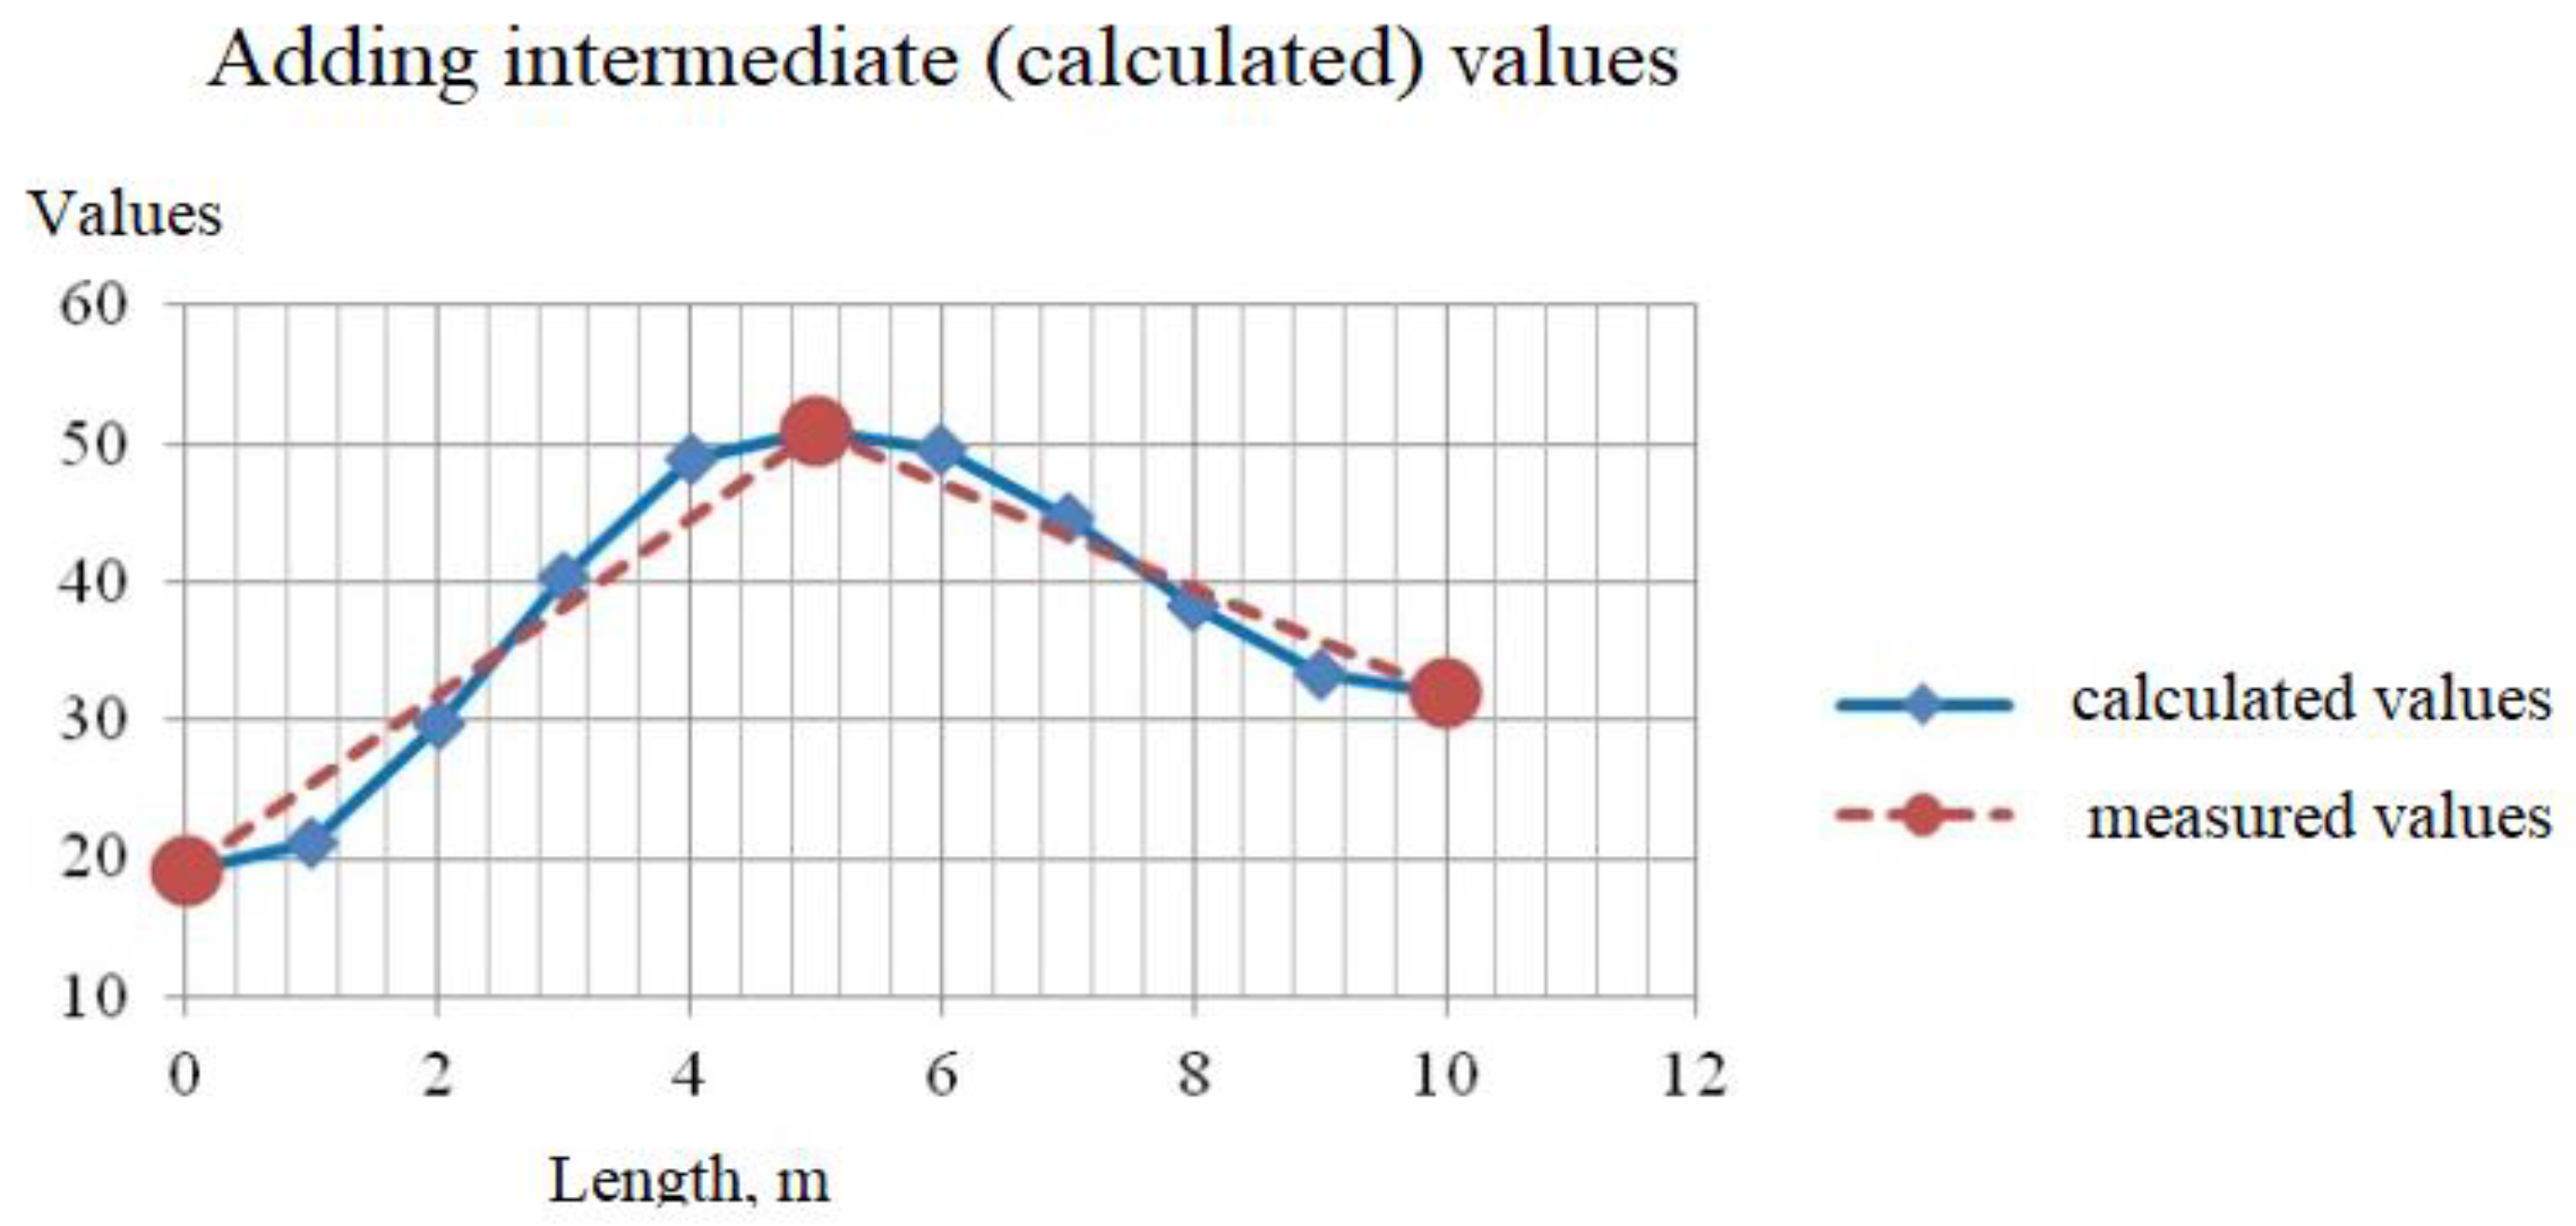
A geological model cannot be considered complete without 3D studies of reservoir properties, which are also key physical and chemical parameters. Reservoir properties are usually determined experimentally using special devices called CTUs (Core Testing Units). At the same time, with a significant discreteness of data on the variability of the filtration capacity of the productive horizon, it is possible to supplement the missing material by the method of enlarging the data array [23]. Enlarging the data array is carried out using the standard MS Excel software product, by adding intermediate data not measured directly, but determined graphically (see Figure 3).
In the case of our example and data from tomographic studies of the core representing some interval of the Mokudinskoye field [29], it is possible to create an enlarged array based on the limited actual data.
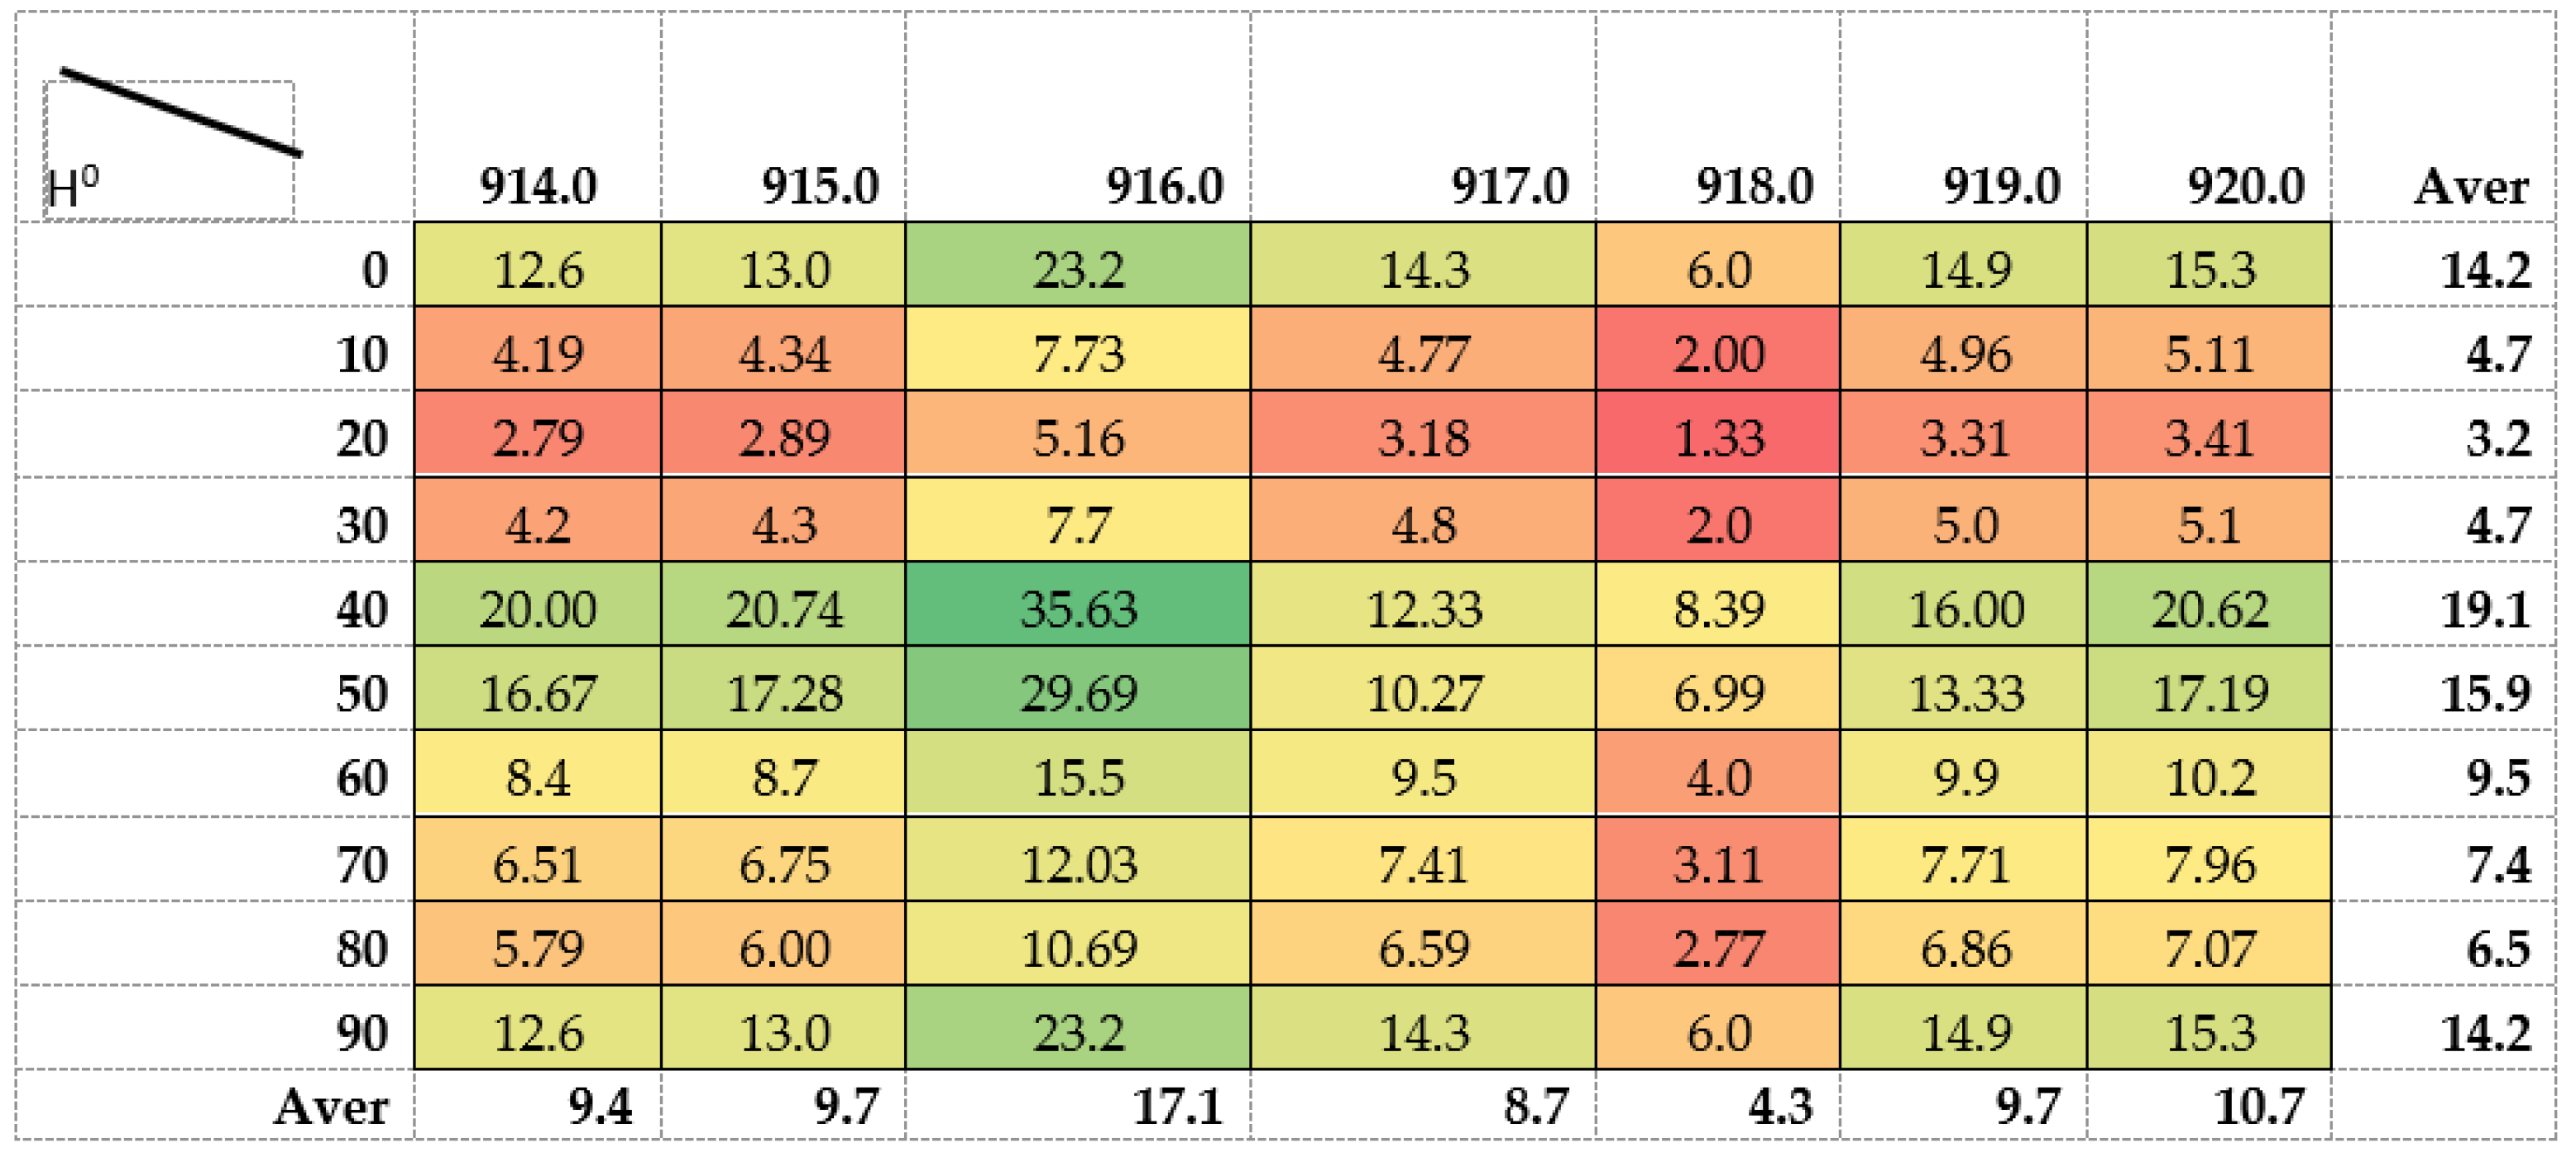
By using a larger array with an increased number of cells and splits, and assigning a value to each cell, one can visualize the complete data by assigning a color to each cell depending on the value it contains. This procedure is also easily implemented using the MS Excel software product. Figure 4 shows an enlarged array with a color imaging of the calculated data. In other words, as a result of the calculations, a flat image is obtained, corresponding to the development of the lateral surface of the core cylinder.
The scale (0) of scans shown in Figure 4 corresponds to the angles of rotation of the core cross-section (with a step of 100) and allows one to reflect the internal variation of the porosity values of the tested core. In other words, the color imaging model described above makes it possible to evaluate the features of the distribution of open pores in the core volume, and the calculated average values of porosity along and across the core cylinder. They indicate the presence of transverse and longitudinal fluid-conducting capillaries inside the core volume of the reservoir. Our color rendering model shows one transverse fluid-conducting interval at 916 m (average porosity 17.1%) and three longitudinal fluid-conducting intervals with cross-sectional angles of 40°, 50°, and 90° (average open porosity is 19.1%, 15.9%, and 14.2% respectively).
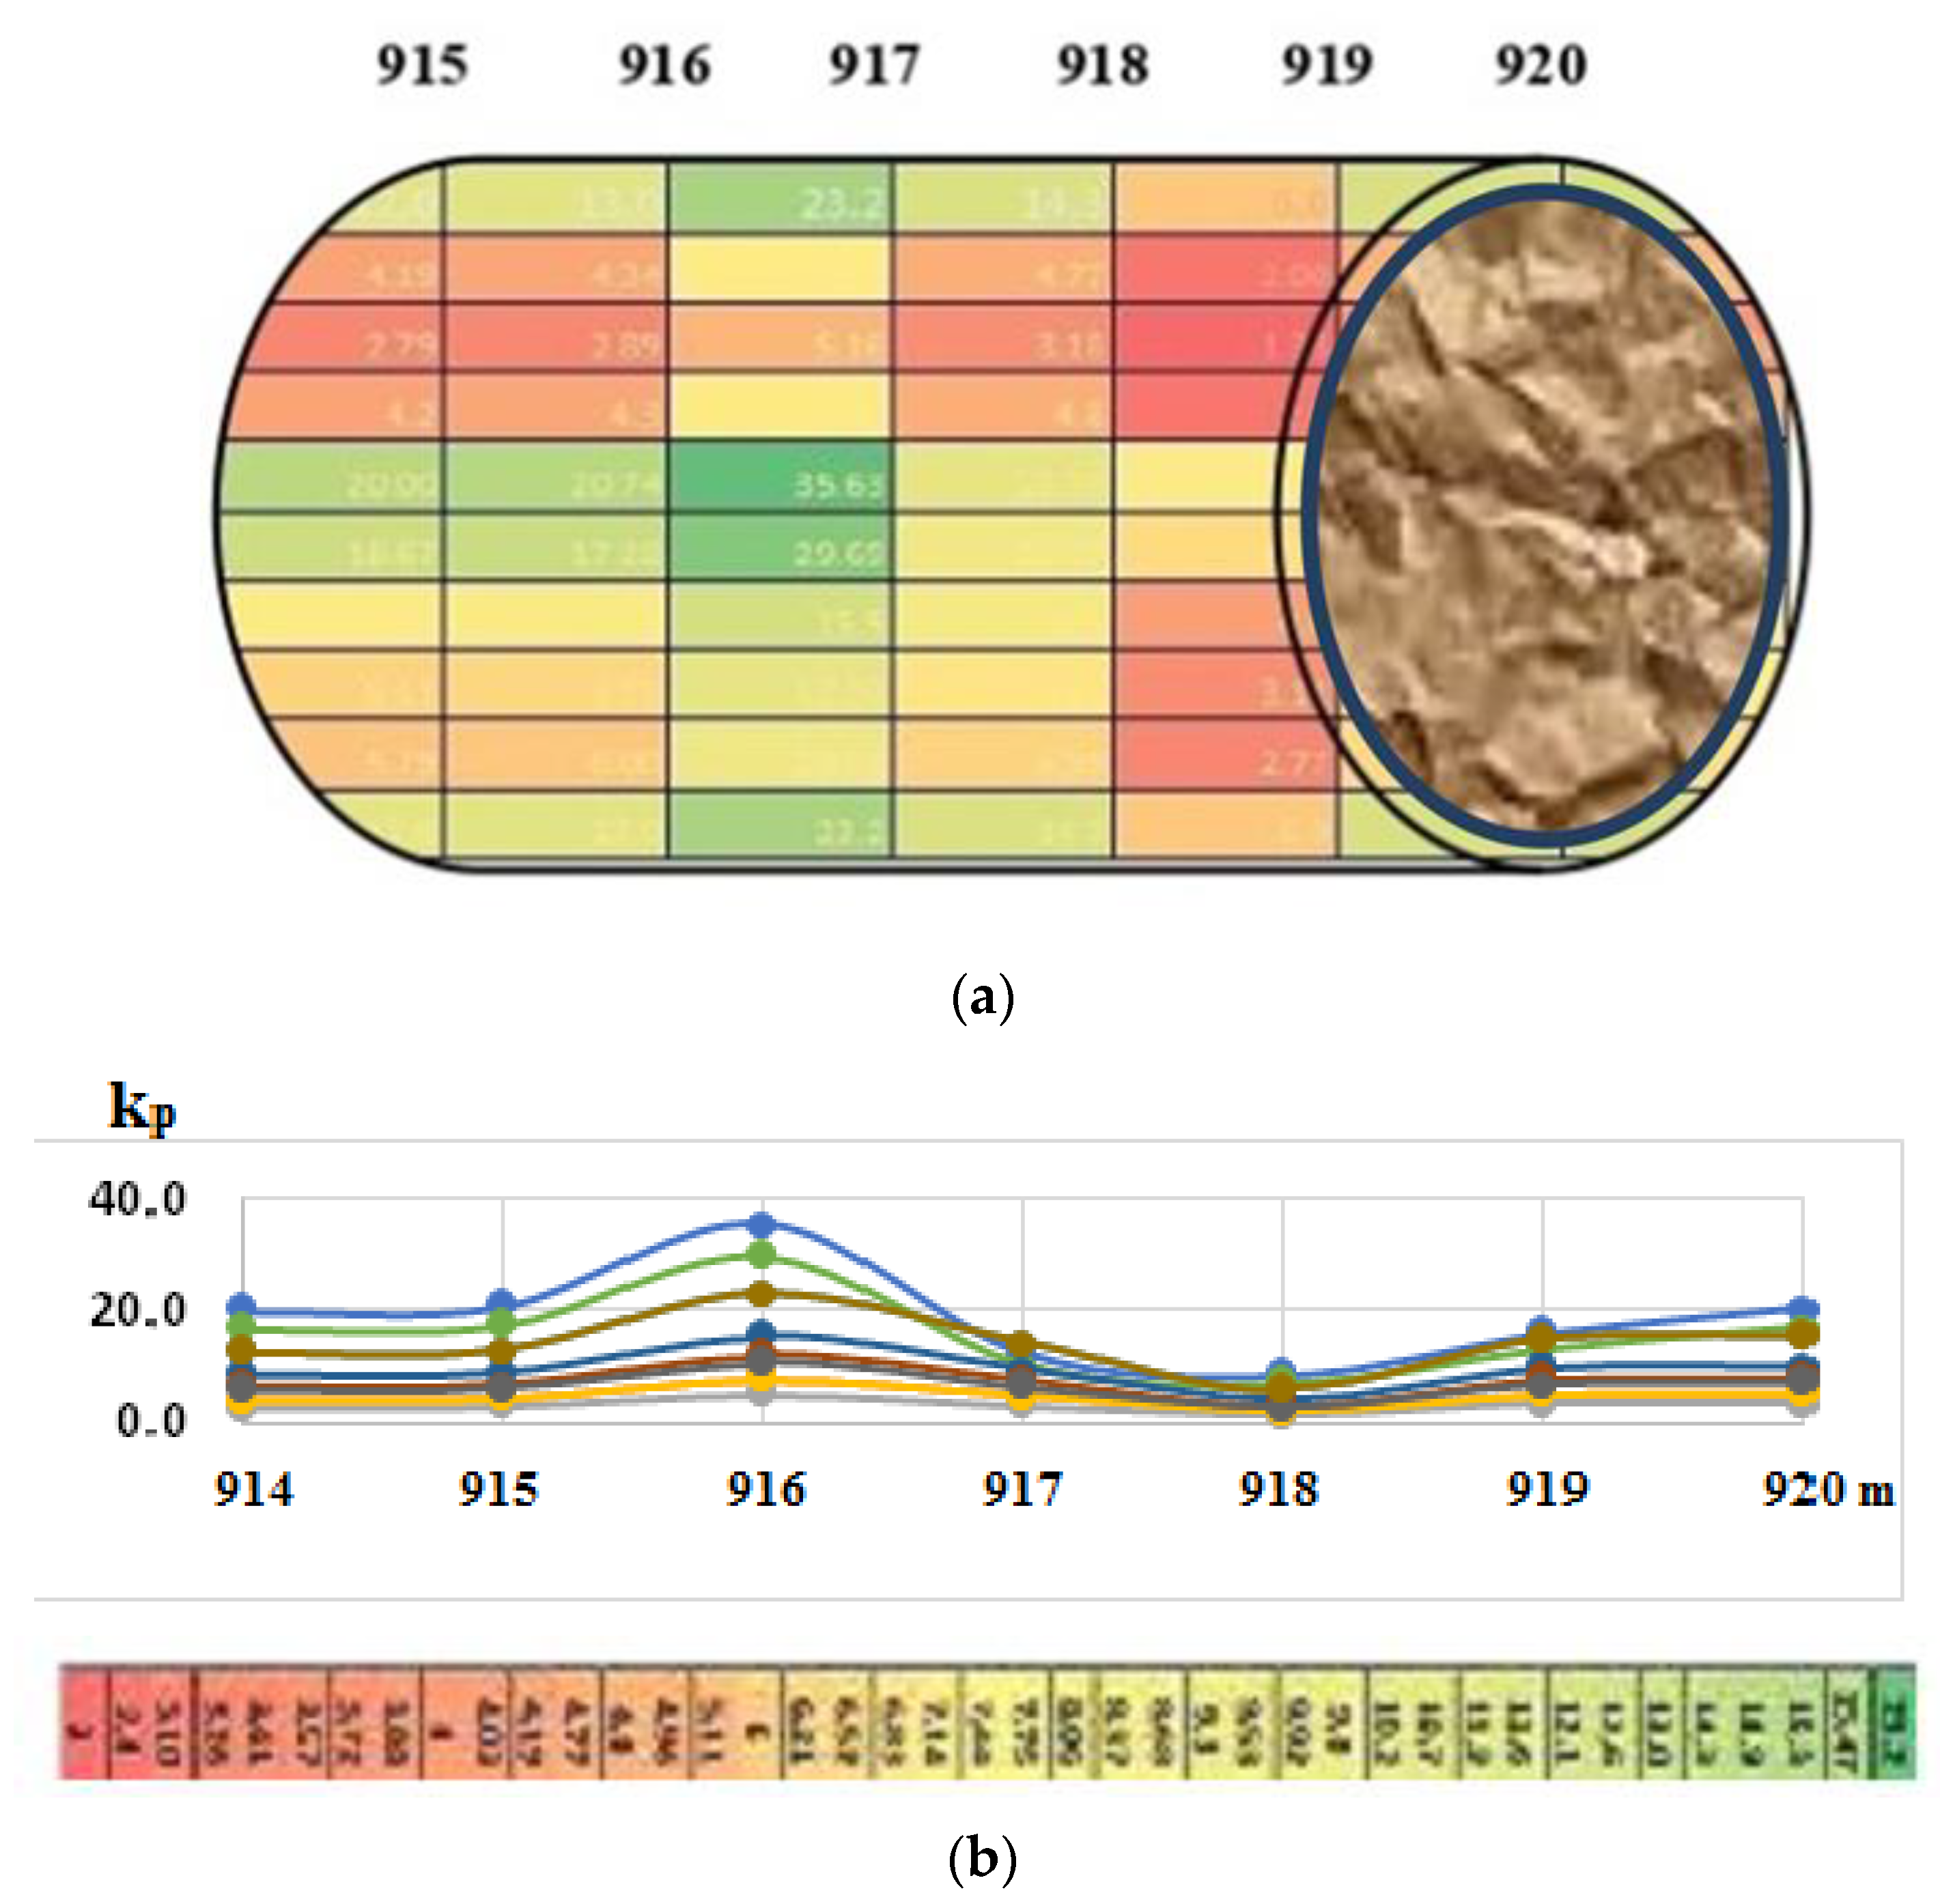
Similarly, one can judge the presence in the core volume of the reservoir of areas that weakly conduct pore fluids (Figure 4). In our color imaging example, there is one transverse in the least conductive section at 918 m (average open porosity 4.3%) and four longitudinal sections with cross-sectional angles of 10°, 20°, 30°, and 80° (average open porosity is respectively 4.7%, 3.2%, 4.7%, and 6.5%). The depth corresponding to the highly fluid-conductive and weakly fluid-conductive parts of the reservoir can be estimated from the graph shown in Figure 5b.
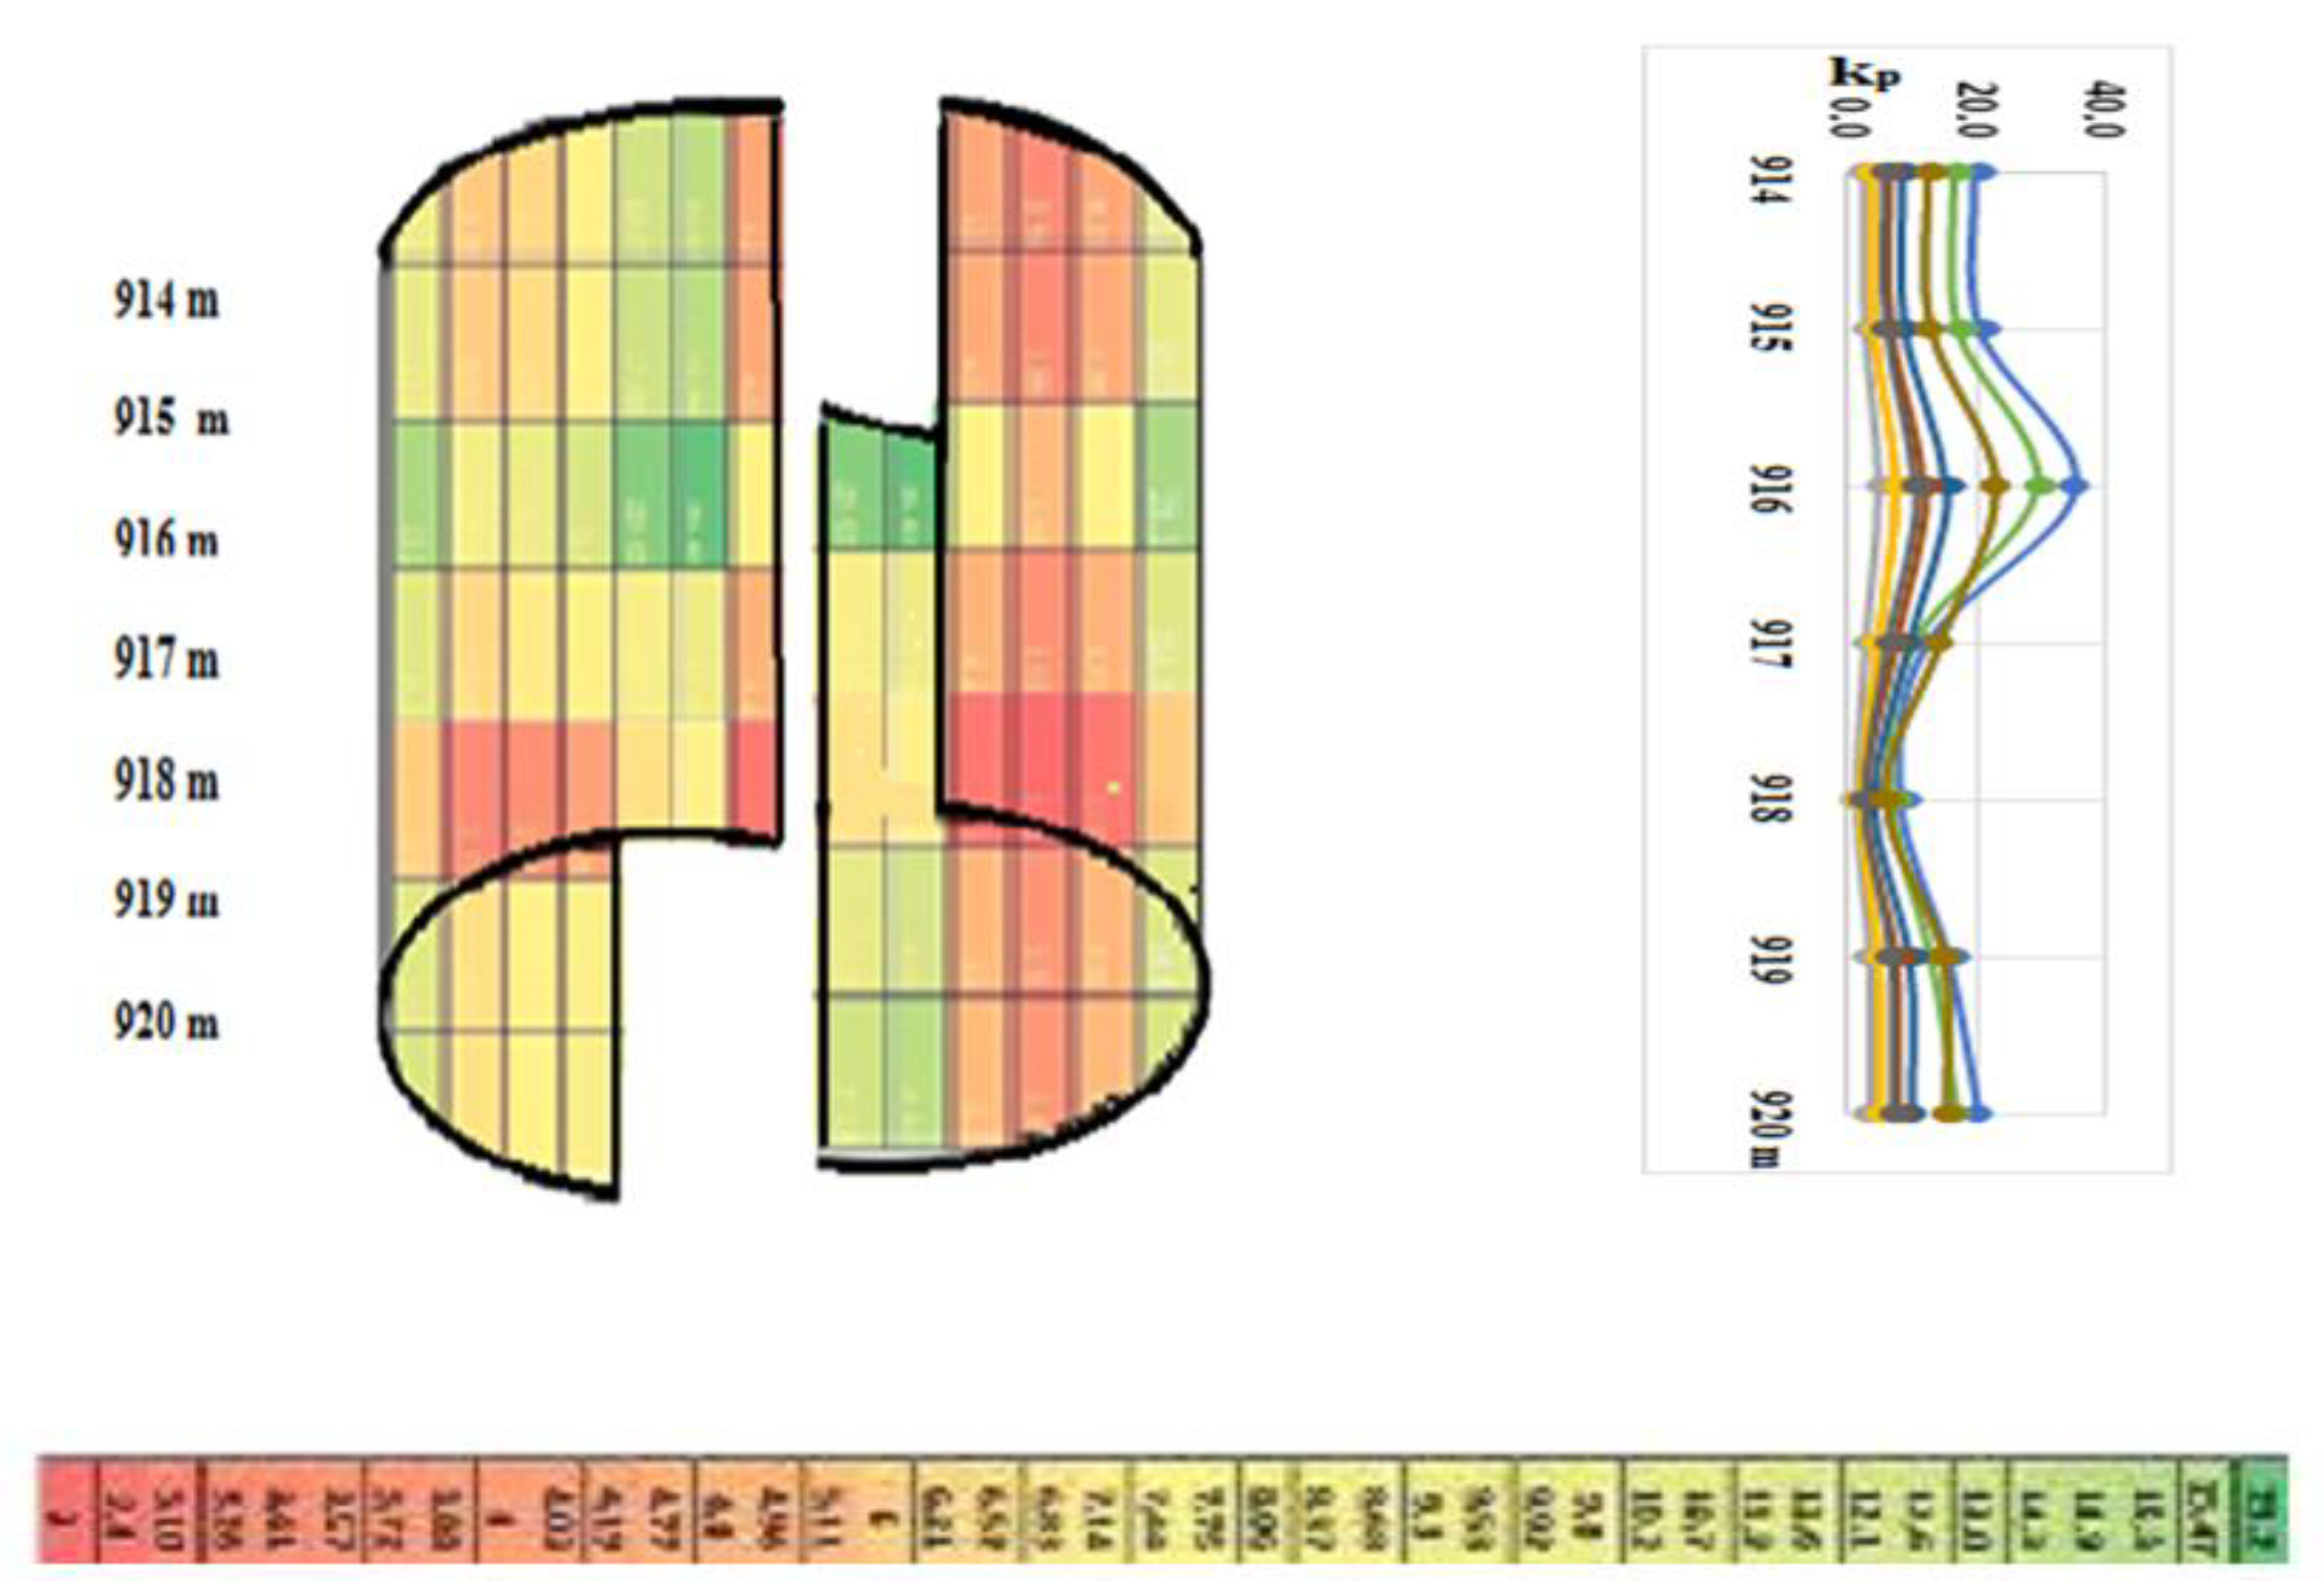
Taking into account the interval of coring in the well, it is possible to identify the lateral surface of the core with the borehole wall (Figure 6). The resulting value variation model of open porosity on the surface and in the sections of the well wall gives a visual representation of the in-situ structure of the pore space of the oil-bearing reservoir.
According to this model, in situ transverse and longitudinal fluid-conducting “corridors” are observed in the wellbore zone that determine the hydrodynamic movements of natural and artificial fluids in the space of productive reservoirs. The model can be used both in organizing a waterflooding scheme in the additional development of depleted oil fields and in hydraulic fracturing.

4. Conclusions

An approach to expanding the research methodology on the use of hydraulic fracturing in oil fields is proposed. It supposes the use of the possibilities of 3D modeling with color imaging of the pore structure of productive intervals of wells.
The geological and geophysical section of the productive horizon B3B4 of one of the wells of the Moscudinskoye oil field with known data on the integrated interpretation of the results of well logging, X-ray tomography, and scanning electron microscopy was chosen as a polygon.
According to logging data, the productive reservoir in the interpreted part of the section is characterized by a high degree of heterogeneity, and tomographic studies of a full-sized core. This made it possible to distinguish four lithotypes here, differing in the features of the pore structure. Accounting for the identified heterogeneity of the reservoir, as well as data on the thickness and other characteristics of reservoir properties of individual lithotypes that make up the section, made it possible to significantly increase the detail in the final geological model. A distinctive feature of this model is the use of the method of enlarging the actual array by adding intermediate data calculated theoretically using the MS Excel software product. The visualization of the final geological model is provided by color 3D imaging of the calculated data of the enlarged array and makes it possible to judge the presence of areas with good and low fluid conductivity in the core volume of the reservoir and on the lateral surface of the well walls. According to this model, in situ transverse and longitudinal fluid-conducting “corridors” are observed in the wellbore zone that determine the hydrodynamic movements of natural and artificial fluids in the space of productive reservoirs.

Author Contributions

Conceptualization, V.B.Z. and A.B.H.; Data curation, A.B.H.; Formal analysis, A.B.H.; Investigation, V.B.Z. and E.Y.A.; Methodology, A.B.H.; Resources, E.Y.A. and D.N.M.; Validation, V.B.Z., E.Y.A. and D.N.M.; Visualization, A.B.H., E.Y.A. and D.N.M.; Writing—original draft, A.B.H. All authors have read and agreed to the published version of the manuscript.

Funding

This research received no external funding.

Data Availability Statement

Not applicable.

Conflicts of Interest

The authors declare no conflict of interest.

References

  1. Gasanov, A.B.; Mamedova, D.N.; Abbasov, E.Y. Geological and Geophysical Knowledge of the PT Section of the South Caspian Depression (Some Issues of Predictive Assessment of the Sedimentary Complex); Lambert Academic Publishing: Moscow, Russia, 2017; Volume 109. (In Russian) [Google Scholar]
  2. Guliyev, I.S.; Shikhaliev, O.A.; Feyzullaev, A.A.; Kocharli, S.S. To the Concept of Geological Exploration for the Preparation of Hydrocarbon Resources in Azerbaijan; Academy of National Economy: Moscow, Russia, 2014; Volume 9, pp. 8–15, (In Russian). [Google Scholar] [CrossRef]
  3. Kocharli, S.S. Problematic issues of oil and gas geology of Azerbaijan; Mars Print NPF: Baku, Azerbaijan, 2015; p. 280. [Google Scholar]
  4. Yusifov, K.M.; Aslanov, B.S. Oil and Gas Bearing Basins in Azerbaijan; Mars Print NPF: Baku, Azerbaijan, 2018; p. 324. (In Russian) [Google Scholar]
  5. Aliyarov, R.Y.; Hasanov, A.B.; Ibrahimli, M.S.; Ismayilova, Z.E.; Jabiyeva, A.J. Forecasting of qualitative characteristics of oil reservoirs. In Proceedings of the Materials of the Republican Scientific-Practical Conference devoted to the 95th Anniversary of H. Aliyev: Unity of Science, Education and Production at the Present Stage of Development, Lenkaran, Azerbaijan, 20 April 2018; pp. 22–31. [Google Scholar]
  6. Aliyarov, R.Y.; Ramazanov, R.A. Prediction of multivariable properties of reservoir rocks byusing fuzzy clustering. In Proceedings of the 12th International Conference on Application of Fuzzy Systems and Soft Computing, ICAFS 2016, Vienna, Austria, 29–30 August 2016; pp. 424–431. [Google Scholar] [CrossRef] [Green Version]
  7. Buryakovsky, L.A.; Chilingar, G.V.; Aminzadeh, F. Petroleum Geology of the South Caspian Basin; Gulf Professional Publishing: Houston, TX, USA, 2001; p. 341. [Google Scholar] [CrossRef]
  8. Anifowose, F.; Abdulraheem, A. Prediction of porosity and permeability of oil and gas reservoirs using hybrid computational intelligence models. In Proceedings of the North Africa Technical Conference and Exhibition, Cairo, Egypt, 14–17 February 2010; p. 126649. [Google Scholar] [CrossRef]
  9. Cuddy, S. The Application of the mathematics of fuzzy logic to petrophysics. In Proceedings of the 38th Annual Logging Symposium SPWLA, Houston, TX, USA, 15–18 June 1997; p. 125959936. [Google Scholar]
  10. Votinov, A.S.; Drozdov, S.A.; Malysheva, V.L.; Mordvinov, V.A. Recovery and increase of the productivity of wells of Kashirskiy and Podolskiy reservoirs of the certain Perm region oil field. Perm J. Pet. Min. Eng. 2018, 18, 140–148. [Google Scholar] [CrossRef]
  11. Kochnev, A.A.; Zotikov, V.I.; Galkin, S.V. Analysis of the influence of geological and technological indicators on the efficiency of radial drilling technology on the example of production facilities in the Perm Territory. Izv. TPU Georesour. Eng. 2018, 329, 20–29. (In Russian) [Google Scholar]
  12. Chi, H.; Li, G.; Huang, Z.; Tian, S.; Song, X. Maximum drillable length of the radial horizontal micro-hole drilled with multiple high-pressure water jets. J. Nat. Gas Sci. Eng. 2015, 26, 1042–1049. [Google Scholar] [CrossRef]
  13. Penny, G.S.; Canway, M.L.; Wellington, L. Control and modeling of fluid leakoff during hydraulic fracturing. J. Pet. Technol. 1985, 37, 1071–1081. [Google Scholar] [CrossRef]
  14. Kanevskaya, R.D. Foreign and Russian Experience in the Use of Hydraulic Fracturing; JSC VNIIOENG: Moscow, Russia, 1998; p. 37, (In Russian). [Google Scholar] [CrossRef]
  15. Zdolnik, S.E.; Nekipelov, Y.V.; Gaponov, M.A. Implementation of new hydraulic fracturing technologies at the carbonate objects of the fields of PJSC ANK Bashneft. Oil Ind. 2016, 7, 92–95. (In Russian) [Google Scholar]
  16. Topal, A.Y.; Usmanov, T.S.; Zorin, A.M.; Khaidar, A.M.; Gorin, A.N. Application of acid-proppant hydraulic fracturing at the fields of OJSC Udmurtneft. Oil Ind. 2018, 3, 34–37. (In Russian) [Google Scholar] [CrossRef]
  17. Economides, M.J.; Nolte, K.G. Reservoir Stimulation; J. Wiley and Sons: New York, NY, USA, 2006; p. 856. [Google Scholar]
  18. Wright, R.; Muma, R.D. High Volume Hydralic Fracturing and Human Health Outcomes: A Scoping Review. J. Occup. Environ. Med. 2018, 60, 424–429. [Google Scholar] [CrossRef]
  19. Muther, T.; Nizamani, A.A.; Ismail, A.R. Analysis on the effect of different fracture geometries on the productivity of tight gas reservoirs. Malays. J. Fundam. Appl. Sci. 2020, 16, 201–211. [Google Scholar] [CrossRef]
  20. Aliyeva, E.; Mustafayev, K. Petrographic and filtration-volume features of Miocene deposits of the western flank of the South Caspian basin. ANAS Trans. Earth Sci. 2021, 1, 3–15. [Google Scholar] [CrossRef]
  21. Gurbanov, V.S.; Hasanov, A.B.; Abbasova, G.G. Depth Distribution of Petrophysical Properties of Mesozoic Sediments of Khizi Tectonic Zone; European Association of Geoscientists & Engineers: Moscow, Russia, 2021; pp. 1–6. [Google Scholar] [CrossRef]
  22. Gurbanov, V.S.; Narimanov, N.R.; Nasibova, G.J.; Mukhtarova, K.Z.; Narimanov, R.N.; Huseynova, S.M. Qualitative assessment of compressional stresses within the South Caspian Megadepression and their impact upon structure formation and hydrocarbon generation. ANAS Trans. Earth Sci. 2021, 2, 39–49. [Google Scholar] [CrossRef]
  23. Kaushansky, D.A.; Bakirov, N.R.; Demyanovsky, V.B. Studies of the strength characteristics of the core, as an indicator of the distribution of the polymer-gel system “Temposcreen-plus” by volume. SOCAR Proc. Spec. Issue 2021, 2, 12–16. [Google Scholar] [CrossRef]
  24. Efimov, A.A.; Galkin, S.V.; Savitckiy, I.V.; Galkin, V.I. Estimation of heterogeneity of oil & gas field carbonate reservoirs by means of computer simulation of core X-ray tomography data. Ecol. Environ. Conserv. Spec. Issue 2015, 21, 79–85. [Google Scholar]
  25. Pakzad, A.; Iacoviello, F.; Ramsey, A.; Speller, R.; Griffiths, J.; Freeth, T.; Gibson, A. Improved X-ray computed tomography reconstruction of the largest fragment of the Antikythera Mechanism, an ancient Greek astronomical calculator. PLoS ONE 2018, 13, e0207430. [Google Scholar] [CrossRef] [PubMed] [Green Version]
  26. Laubach, S.E.; Reed, R.M.; Olson, J.E.; Lander, R.H.; Bonnel, L.M. Coevolution of crack-seal texture and fracture porosity in sedimentary rocks: Cathodoluminescence observations of regional fractures. J. Struct. Geol. 2004, 26, 967–982. [Google Scholar] [CrossRef]
  27. Fjær, E.; Holt, R.; Horsrud, P.; Raaen, A. Petroleum Related Rock Mechanics, 2nd ed.; Elsevier: Amsterdam, The Netherlands, 2008; p. 491. [Google Scholar] [CrossRef]
  28. Ibatullin, R.R.; Salimov, V.G.; Nasybullin, S.V.; Salimov, O.V. Experimental study of rock crackness. Neft. Khozyastvo 2009, 6, 54–57. (In Russian) [Google Scholar]
  29. Galkin, S.V.; Savitsky, Y.V.; Kolychev, I.Y.; Votinov, A.S. Prospects for the use of proppant hydraulic fracturing at the Kashiro-Vereisk production facilities of the Volga-Ural oil and gas province. SOCAR Proc. Spec. Issue 2021, 2, 257–265. [Google Scholar] [CrossRef]
  30. Karev, V.I.; Klimov, D.M.; Kovalenko, Y.F.; Ustinov, K.B. Fracture of sedimentary rocks under a complex triaxial stress state. Mech. Solids 2016, 51, 522–526. [Google Scholar] [CrossRef]
  31. Karev, V.I.; Kovalenko, Y.F.; Ustinov, K.B. Modeling deformation and failure of anisotropic rocks nearby a horizontal well. J. Min. Sci. 2017, 53, 425–433. [Google Scholar] [CrossRef]
  32. Galkin, S.V.; Savitskiy, Y.V.; Osovetski, B.M.; Kazımov, K.P.; Gurbanov, V.Ş.; Abbasova, Q.Q.; Kazımov, R.R. Detailed study of hydraulic fracturing of Kashiro-Verey rocks by electron microscopy. ANAS Trans. Earth Sci. 2022, 17–27. [Google Scholar] [CrossRef]
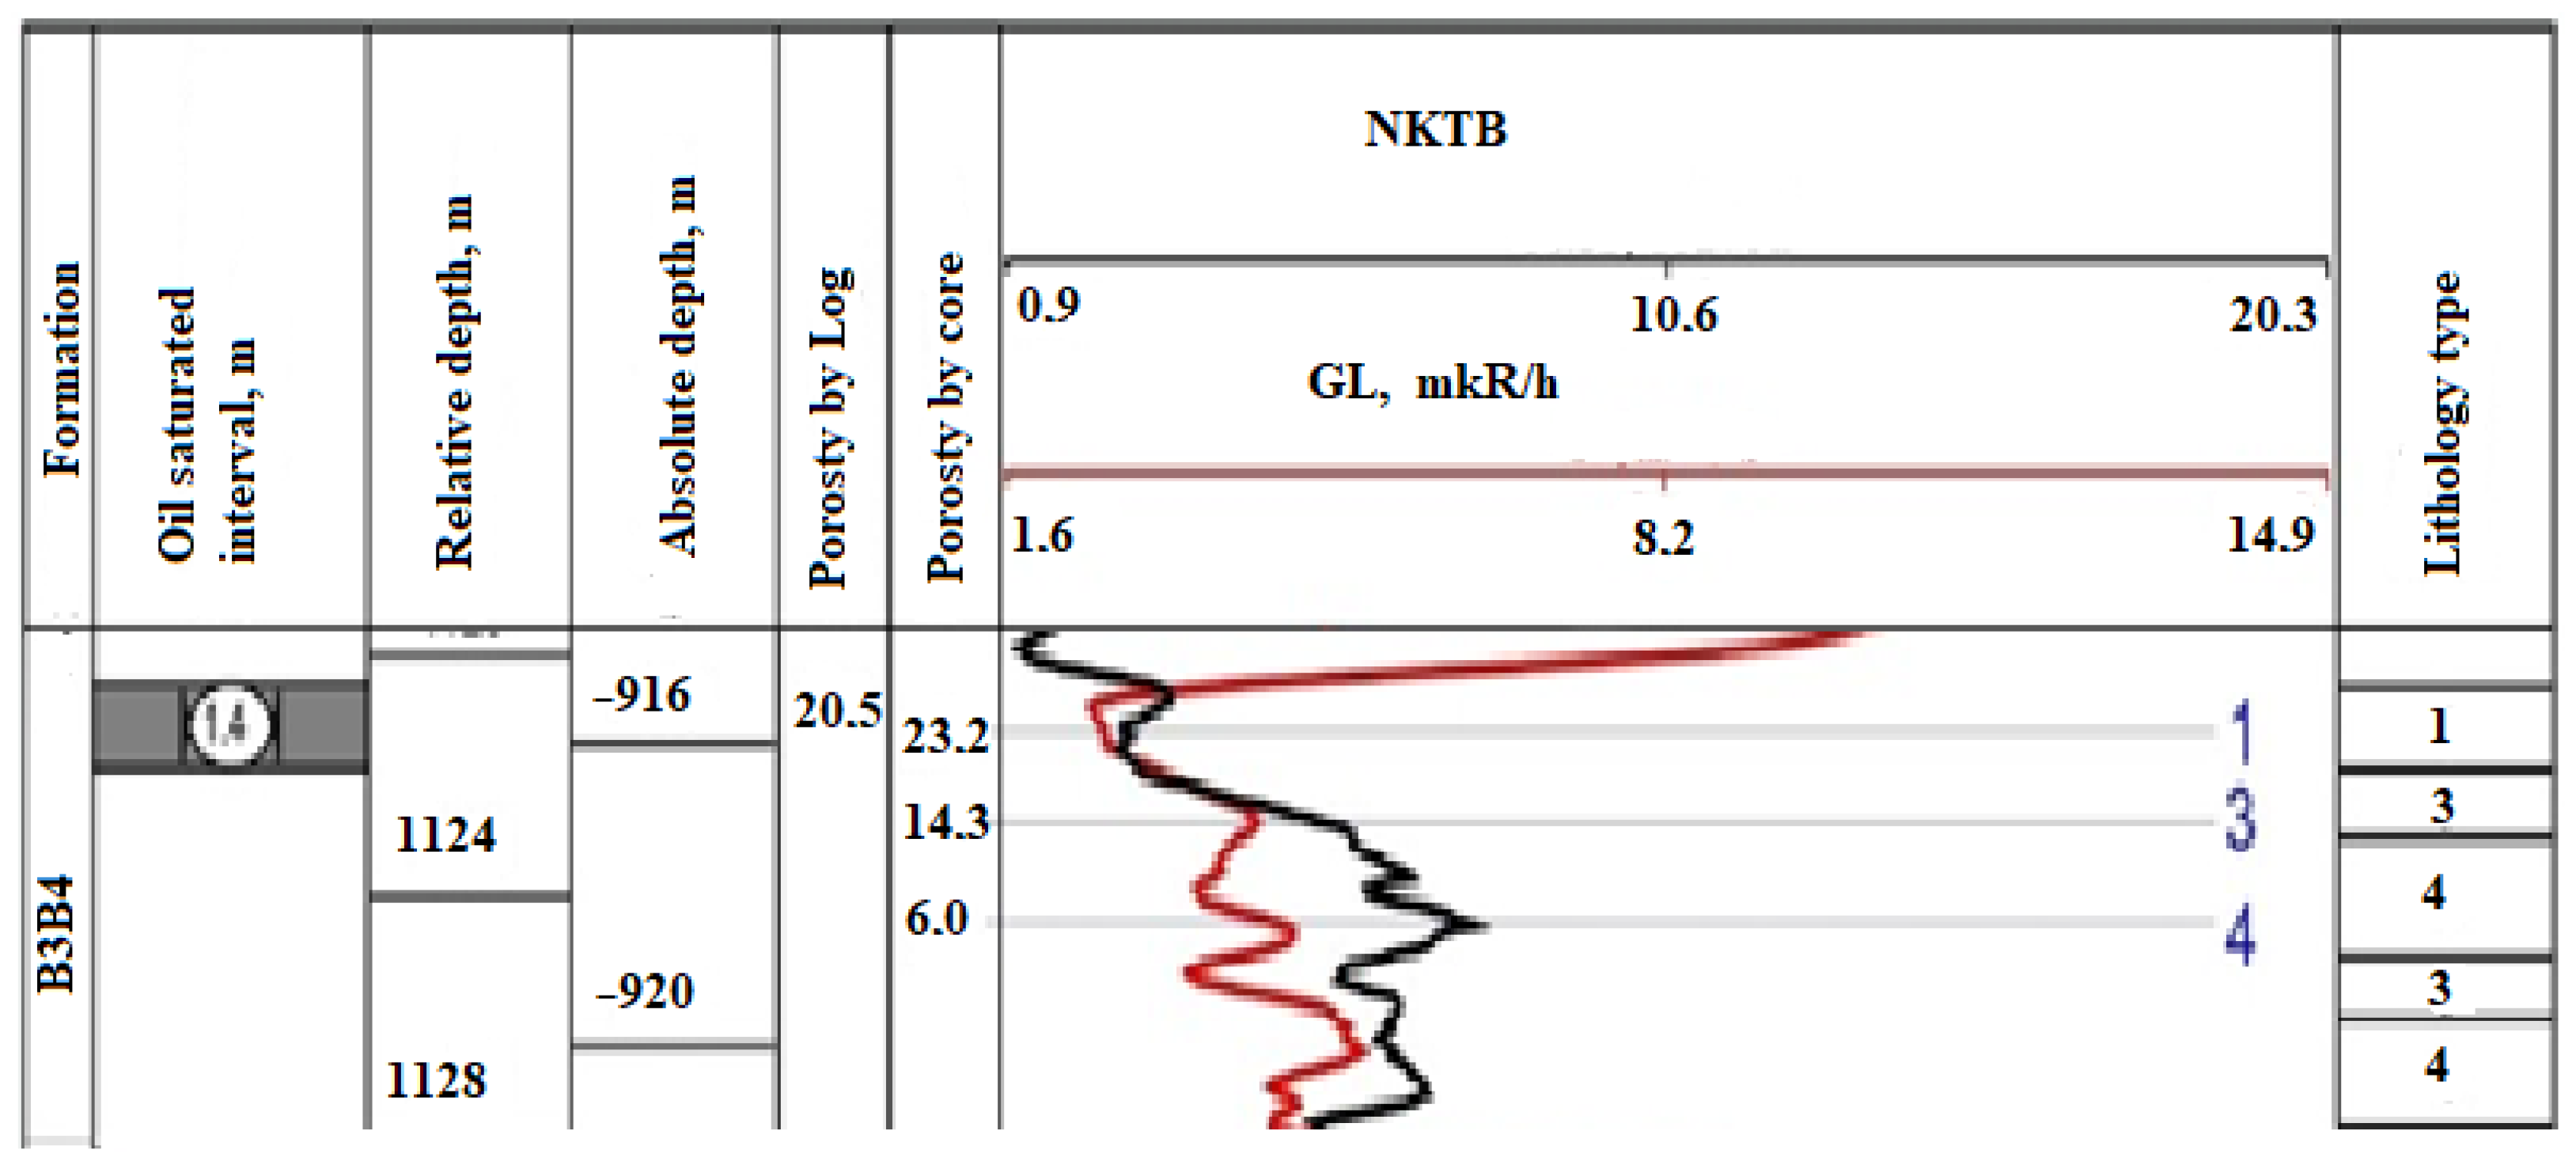
Figure 1. Characteristics of the well section of the Mokudinskoye field in one of the intervals [29].
Energies 16 00217 g001
Figure 2. Tomograms of samples of various rock lithotypes [29]. (a) lithotype 1; (b) lithotype 2; (c) lithotype 3; (d) lithotype 4.
Energies 16 00217 g002
Figure 3. Enlargement of the data array using the MS Excel software product.
Energies 16 00217 g003
Figure 4. Color imaging of a flat scan of the change in porosity values along the lateral surface and along the cross sections of the core (H is the depth of the well; 0 is the angle of the cross-section; Aver is the average values of Kp (open porosity coefficient) along the lateral surface and along the cross sections of the core).
Energies 16 00217 g004
Figure 5. Changes in the values of open porosity along the lateral surface (a) and along the core sections (b).
Energies 16 00217 g005
Figure 6. Changes in the values of open porosity over the surface and in the sections of the borehole wall.
Energies 16 00217 g006
Disclaimer/Publisher’s Note: The statements, opinions and data contained in all publications are solely those of the individual author(s) and contributor(s) and not of MDPI and/or the editor(s). MDPI and/or the editor(s) disclaim responsibility for any injury to people or property resulting from any ideas, methods, instructions or products referred to in the content.