Article

Investigation of Supercritical Power Plant Boiler Combustion Process Optimization through CFD and Genetic Algorithm Methods

by
Gavirineni Naveen Kumar
1 and
Edison Gundabattini
2,*
1
School of Mechanical Engineering, Vellore Institute of Technology (VIT), Vellore 632 014, India
2
Department of Thermal and Energy Engineering, School of Mechanical Engineering, Vellore Institute of Technology (VIT), Vellore 632 014, India
*
Author to whom correspondence should be addressed.
Energies 2022, 15(23), 9076; https://doi.org/10.3390/en15239076
Submission received: 26 October 2022 / Revised: 16 November 2022 / Accepted: 21 November 2022 / Published: 30 November 2022

Abstract

:
One of the main energy sources utilized to produce power is coal. Due to the lack of combustion enhancement, the main issue with coal-based power plants is that they produce significant amount of pollutants. The major problem of slagging formation within the boiler; it sticks to the water tube walls, superheater, and reheater. Slagging might decrease the heat transferred from the combustion area to the water or steam inside the tubes, increasing the amount of coal and extra air. The abrupt fall of slag on the tube surface into the water-filled seal-trough at the bottom of the furnace might occasionally cause boiler explosions. In order to maximize heat transmission to the water and steam tubes by reducing or eliminating slag formation on the tube surface, the work presented here proposes an appropriate computational fluid dynamics (CFD) technique with a genetic algorithm (GA) integrated with conventional supercritical power plant operation. Coal usage and surplus air demand are both decreased concurrently. By controlling the velocity and temperatures of primary air and secondary air, the devised technique could optimize the flue gas temperature within the furnace to prevent ash from melting and clinging to the water and steam tube surfaces. Heat transmission in the furnace increased from 5945.876 W/m2 to 87,513.9 W/m2 as a result of the regulated slag accumulation. In addition to reducing CO2 emissions by 8.55 tonnes per hour and saving close to nine tonnes of coal per hour, the boiler’s efficiency increased from 82.397% to 85.104%.

1. Introduction

Due to the ever-growing demand for power in the world, power plants have been attracting systemic interest. Coal is one of the essential resources among conventional fuels, such as natural gas and diesel. Thermal power plants generate considerable power at a stable frequency with less construction space than other power generation units. On the other hand, coal-fired power plants generate different pollutants, such as CO2, CO, SPM, NOX, and SOX, which are harmful to the environment; for the generation of 1 MW of electric power, for which 0.65 to 0.69 tonnes of coal is needed, this may generate 0.635–0.685 tonnes of CO2. These generated emissions could be reduced to some extent via combustion optimization inside the furnace, but combustion optimization is a highly complicated process. Coal has different elements, such as VM, carbon, moisture, and ash; the detailed proximate and elemental analyses are presented in Table 1 and Table 2. Coal comes from the coal handling plant in large blocks; these blocks pass through the crusher house and are reduced to the size of 25-mm. The 25-mm-sized blocks further pass through the bowl mills to be reduced to the required size of 14 microns.
The hot PA from the rotary air preheater takes coal from the bowl mill to the boiler for combustion. Combustion is a highly complicated process; rapid fuel oxidation takes place during heat and light production. Complete fuel combustion is only possible with a sufficient supply of oxygen in the furnace. Elements such as hydrogen, carbon, and sulphur are present in coal, and together with the oxygen present in the air, they form water vapour, Sulphur dioxide, and carbon dioxide, and release heat for the values of 121,009.65 kJ/kg, 33,823.46 kJ/kg, and 9305.216 kJ/kg. In some cases, instead of two molecules, one molecule of oxygen combines with carbon to form carbon monoxide instead of carbon dioxide and releases 10,167.12 kJ/kg [1]. There are three types of heat modes, namely, conduction, convection, and radiation, to transfer heat from the boiler furnace to the tubes inside the panels. A major portion of heat transfer occurs via radiation in the radiation section due to the lack of medium in the boiler. The heat transfer to the boiler tubes depends upon the luminosity of the flame and tube surface [2]. There are many factors that affect combustion inside the furnace, such as the particle properties of coal, the char ignition conditions, gas-particle circulation, the ash percentage in coal, and the utilization of waste heat [3,4]. Open-source optimization schemes are used to evaluate the combustion conditions inside the furnace using low loads (50% of MCR), medium loads (75% of MCR), and high loads (95–100% of MCR) [5].

1.1. Significance of Emission Control

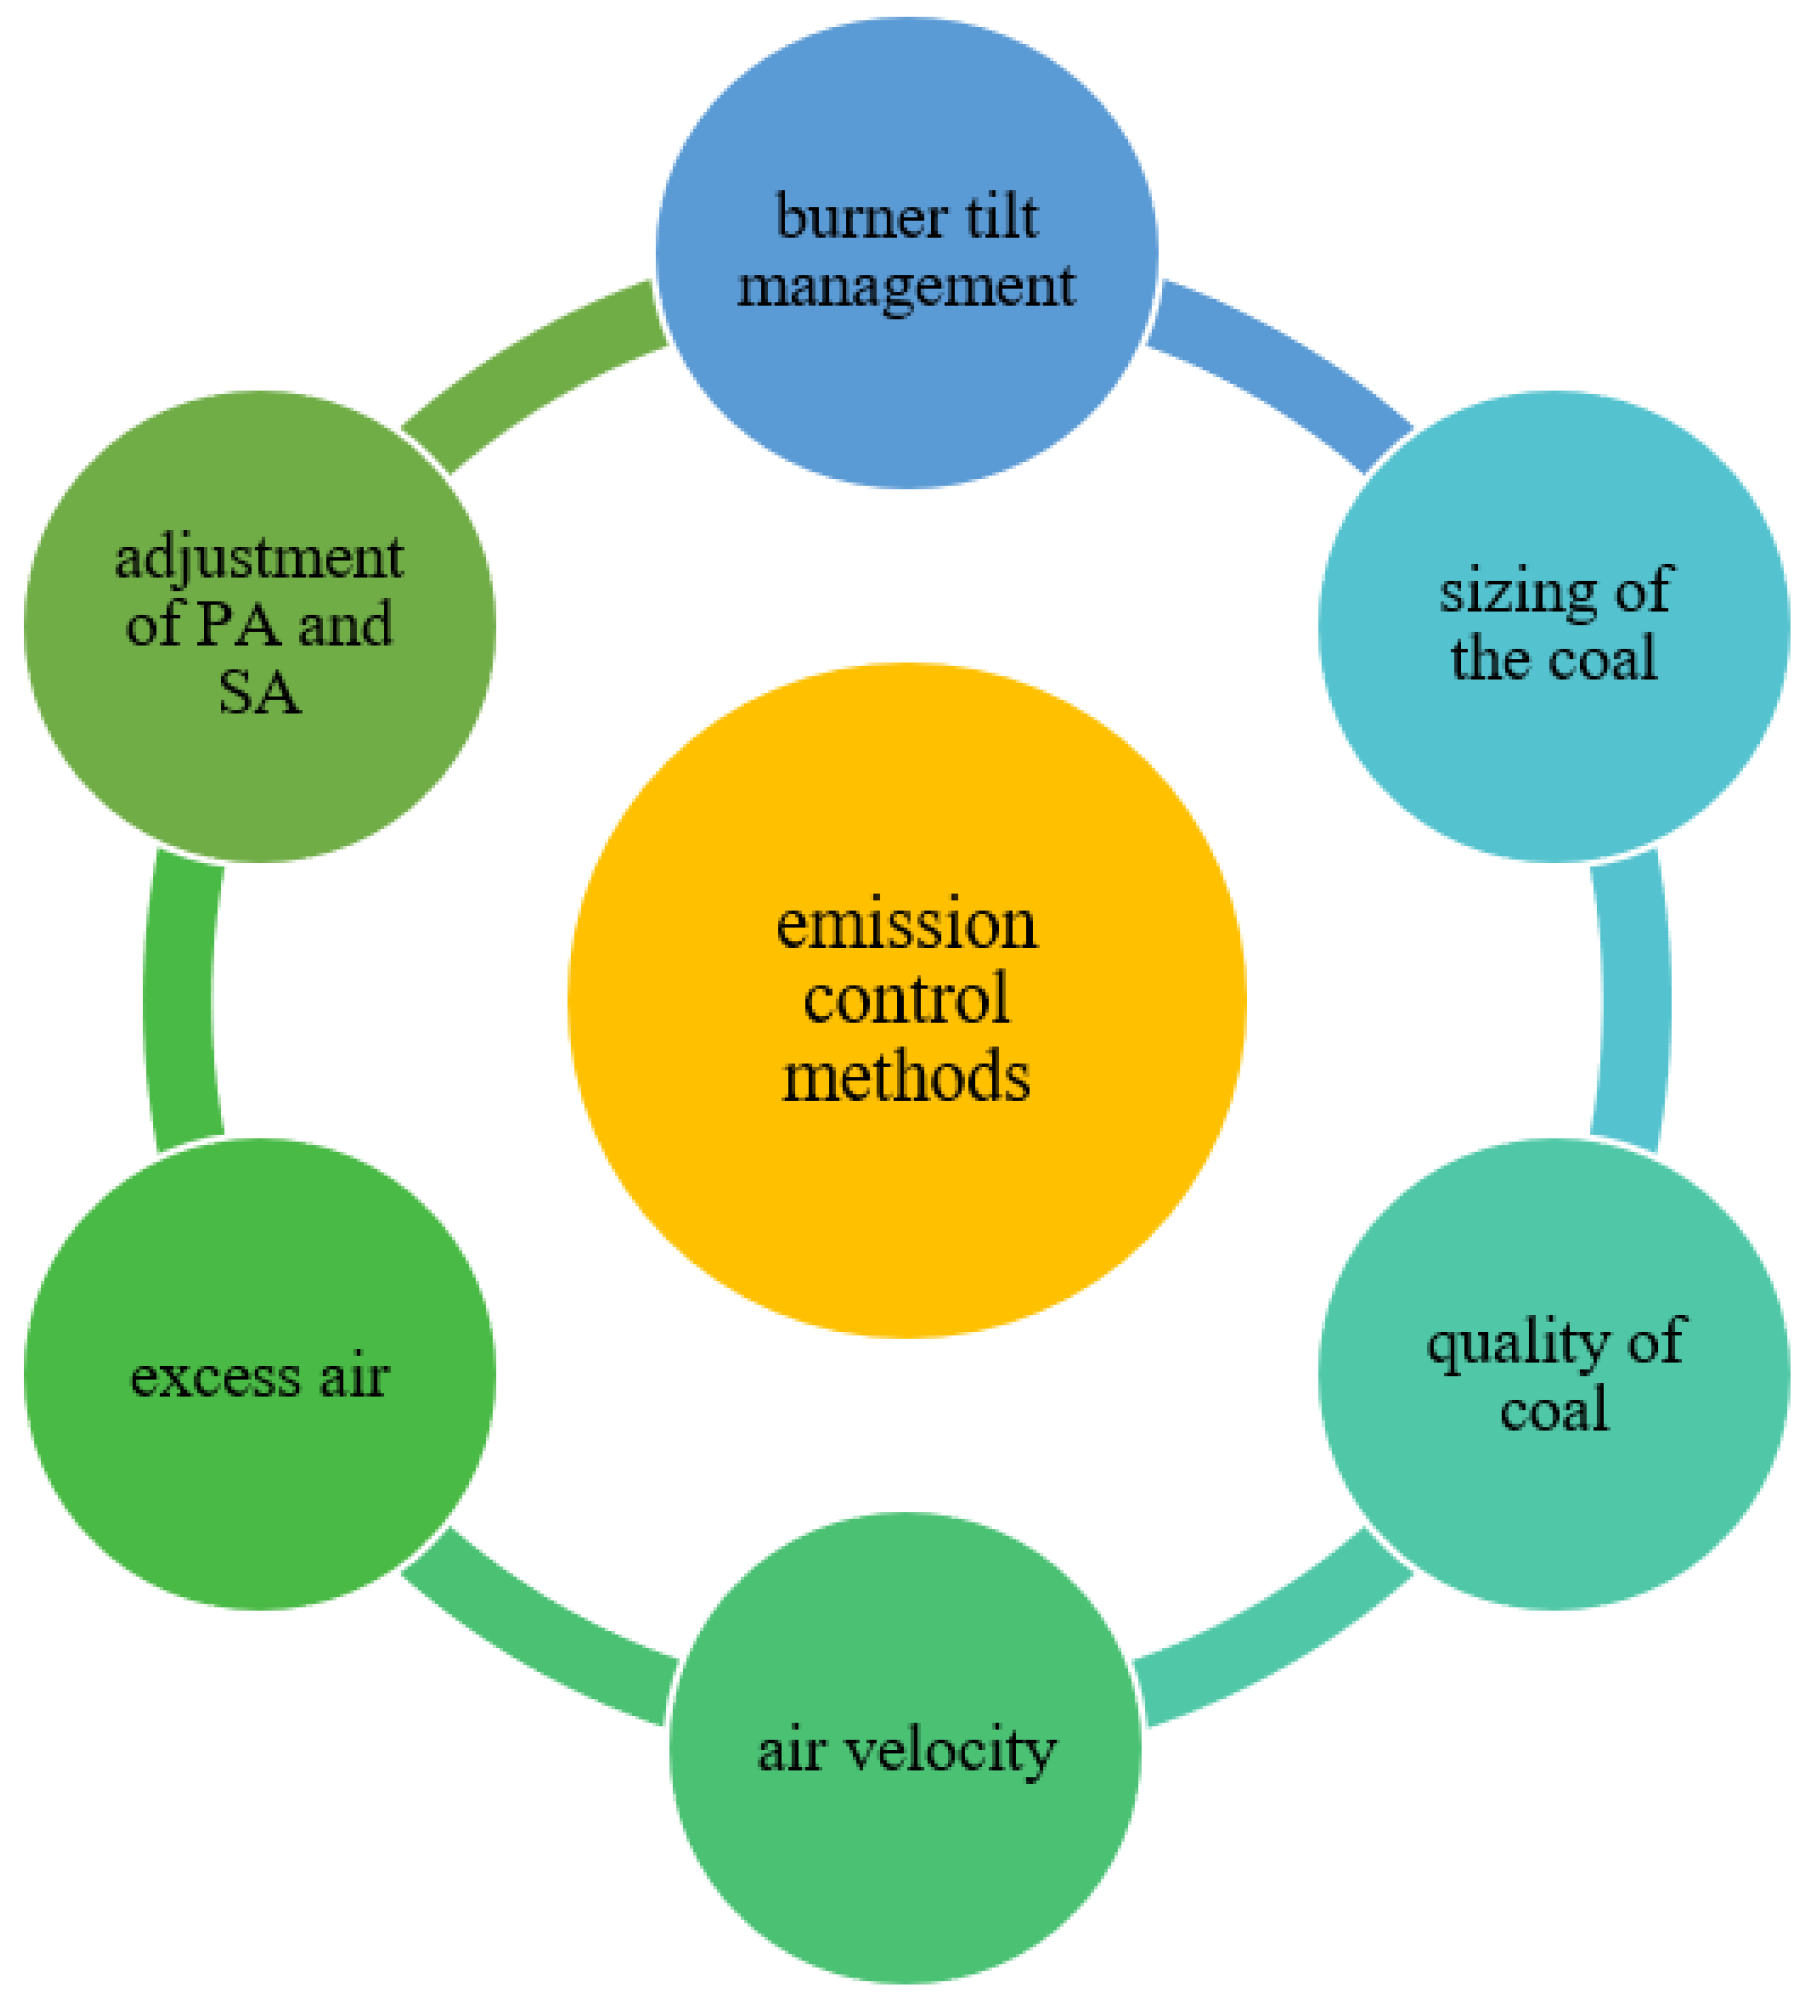
The gases emitted from a furnace after the combustion of fuel, such as SO2, NO2, CO2, CO, and SPM, are hazardous. These emissions can be controlled using methods such as burner tilt management, employing the proper sizing of the coal, and the adjustment of PA and SA through wind box damper controlling [6,7,8]. Out of these emission control techniques, PA and SA optimization through the damper controlling of the wind box play an important vital role in controlling emissions. By increasing the SOFA damper from 0° to 40°, carbon monoxide (CO) decreases, but NOX emissions increase [9], and by increasing the air velocity to 40 m/s from 20 m/s when using low coal quality, the emission levels reduce to some extent [10]. Burner tilt management could increase combustion performance and decrease pollution levels to some extent, as the burner tilt management burner angle increases or decreases according to the combustion conditions inside the furnace [11]. Combustion improvement and emission control could also be performed by increasing or decreasing excess air by altering the relevant drive speed and dampers (Figure 1) [12,13,14].

1.2. Enhancing the Performance through Simulation Tools

Power plant efficiency could be improved by online optimization techniques such as ANN, GA, and various multi-objective optimization techniques. A genetic algorithm-based computer system defines the optimal operating parameters for combustion improvement inside the furnace and low NOX emission generation from the boiler by comparing actual operating parameters from the plant [15,16,17]. ANN scheme is adopted to increase boiler performance, reduce NOX emission, and improve turbine heat rate by optimizing the soot blowing system, where the steam for the soot blowing is taken from the main steam pipe [18,19]. Optimization based on non-sorting GA (NSGA-II) is one of the optimization schemes in terms of optimization of operating parameters and airflow adjustment [20,21,22]. Online optimization combustion improvement techniques such as ANN, GA, and multi-objective optimization do not deal effectively with the slag buildup on the tube’s surface due to the lack of data available from the furnace. Whereas the slag buildup problem could be identified using CFD.
Slagging and fouling problems are associated with the temperature of furnace exit gas, during the combustion of coal with a stoichiometric air ratio inside the furnace huge quantity of the flue gas is released from the furnace and also releases fly ash and bed ash. Depending upon the temperature of the flue gas, fly ash may stick to the tubes of the water wall, reheater, and superheater tubes and restrict the heat transfer from the furnace to the inside medium of tubes [23]. The developed slag from the combustion in the furnace deposition is higher in the rear tubes than in the other side tubes due to the intensity of the flame and airflow [24]. Due to this fact, a reasonable temperature should be maintained at the furnace boundaries; adding suitable additives and helping the incoming particles not to stick to the wall could reduce slag up to some extent [25] and increase the boiler efficiency.
The CFD tool is one of the best optimization tools for combustion improvement inside the furnace and measures the heat transfer through the wall of the water tubes, reheater, and superheater [26,27]. The formations of slag build-up and the amount of heat restriction due to slag formation are also effectively known from the Computational fluid dynamic. With this tool, online optimization is possible by changing operating parameters [28,29] such as excess air ratios, coal flow, airflow, and air velocities, and knowing the emission values from the system without wasting time. By combining results from CFD with artificial intelligence (AI) such as GA and Non-sorting genetic algorithm (NSGA-II) better combustion optimization is possible, slag buildup could be reduced to some extent, and there could be an improvement in boiler performance [22,30]. With advanced computer technology’s advantage, integrating CFD with ANN and GA could eliminate combustion problems such as slagging and fouling. Based on this, a new method has been developed by integrating GA with computation fluid dynamics to improve boiler performance, reduce pollution by controlling different emissions, improve turbine heat rate and decrease or eliminate slag buildup on the tube surfaces of the water wall, reheater, and superheater, Figure 2.
Souhirechi et al. [28] have developed a 3D model for knowing the heat transfer and fluid circulation inside the boiler and it is further evaluated with the data from the experiment and performed meshing operation further, finally with the CFD tool they understood the fluid flow behaviour and combustion condition by adjusting operating conditions. Viljami Maakala et al. [31] have developed a full superheater region model (FSR) with two sets namely A and B presented for temperature and flow of flue gas measurement in the region of the superheater. The two sets of solutions were compared with convergence from the grid. They have concluded that when comparing two results with the grid, the error that comes from the grid convergence index (GCI) is very deficient. Cong Yu et al. [32,33] have promoted a combined model of steam heating and coal combustion in a 660 MW supercritical boiler using CFD and MATLAB. They have concluded that SOFA burners tilting angle of +30° reduces the emissions of NOX and CO formation. Jan Taler et al. [34] experimental and numerical simulations (Ansys-Fluent software analysis) indicated that the emissions generated from boiler combustion are less than the European country norms. Results also revealed that the NOX emissions are less than 350 mg/m3 at 100% load; less than 217.3 mg/m3 at 40% load.
Kumar and Gundabattini [35] have done the irreversibility study of various equipment in a 660 MW thermal power plant at various atmospheric conditions. They have concluded that the exergy destruction of equipment depends on atmospheric behavior. They finally conclude that the irreversibility is more on boiler than the turbine.
In this paper, the boiler furnace model was developed, and the heat transfer between the flame generated from the middle of the furnace to the water wall, steam wall, and slag build-up with the help of the CFD module was studied, later integrating the CFD module with the GA module for better results of effective heat transfer and avoidance of slag build-up. Later, the optimized case from the CFD and GA was applied to one tube to know the tube’s characteristics and the efficiency of the boiler by finding the overall boiler losses from the boiler. Later, the generated results were compared with the plant operation data, from the optimized condition case the physical condition of boiler performance has been improved with the generated results from integrated CFD with GA. This research is done on slag build-up, heat transfer to the tube, and performance improvement of the boiler by finding various losses that were not done earlier.

2. A 660 MW Coal-Fired Supercritical Power Plant—Description

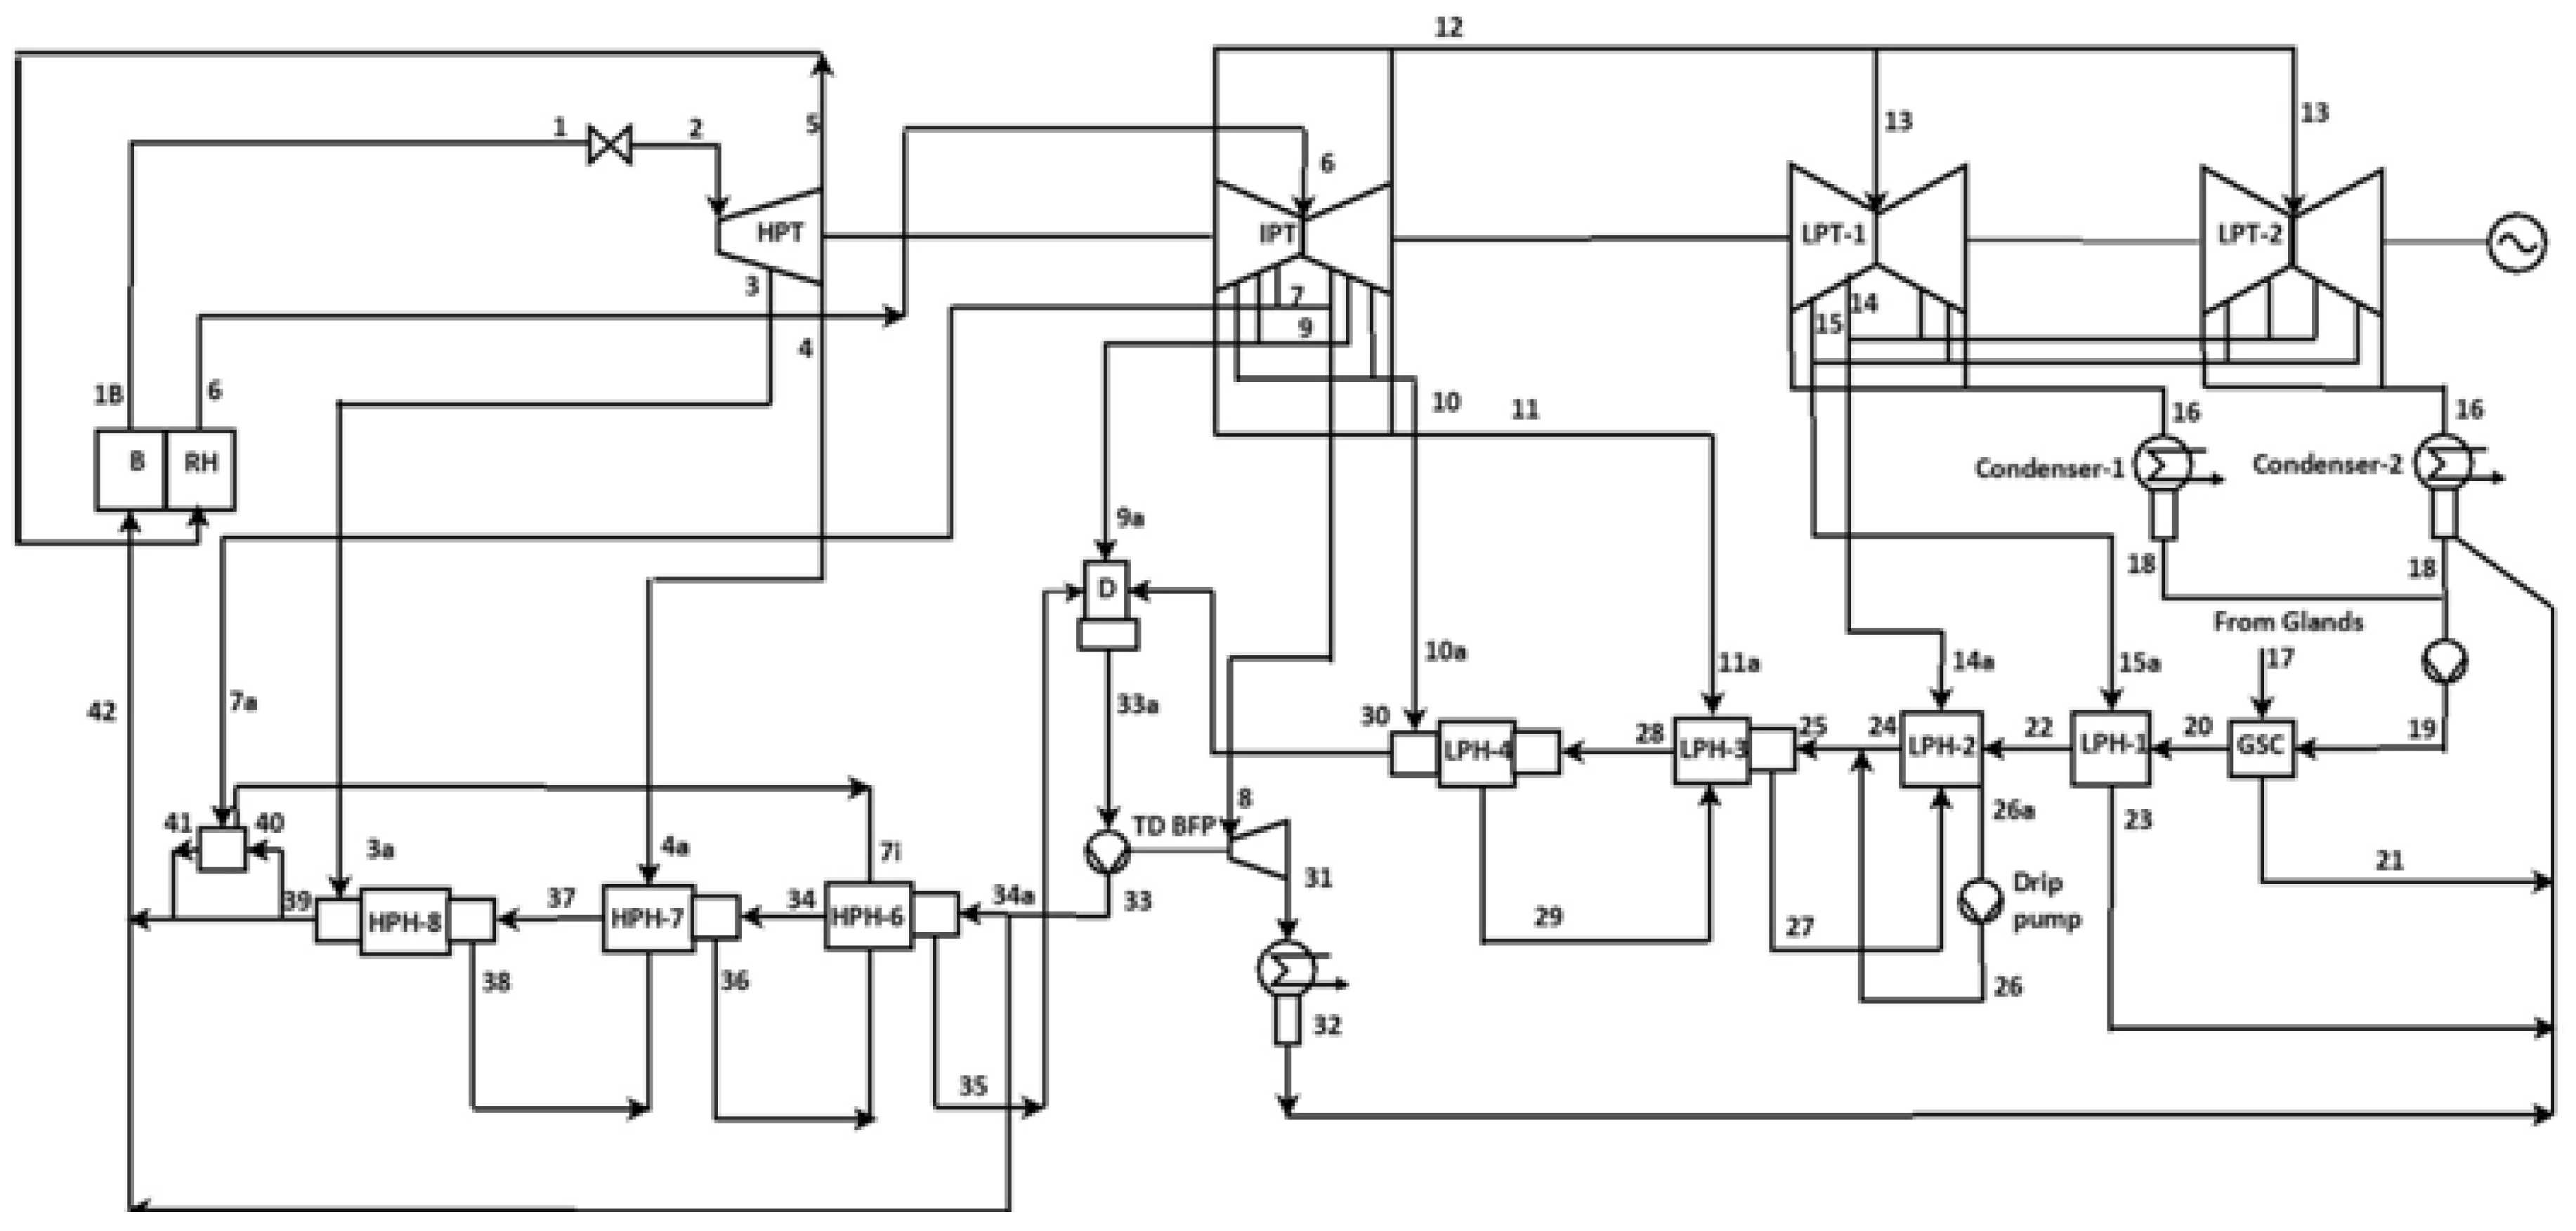
The supercritical and ultra-supercritical drum-less units give maximum cycle performance, reduce pollution levels, and power generation cost minimization. Figure 3 and Figure 4 show the schematic diagram and detailed diagram of a supercritical plant. In some countries due to a broad supply-demand imbalance, the highly varying grid frequency from the external grids, at that instant generators to decrease their constant generation too far below their committed loads, resulting in efficiencies of plant reduces. A supercritical drum-less plant is very beneficial for flexible load generation.
Currently, the exegetical evaluation is being considered based on the thermodynamic second law for various stages of the plan such as design, analysis, evaluation, and optimization. It gives a clear picture of the efficiency assessment of plant components. Second law efficiency is a very potent tool in analyzing plants; this could be used for understanding the quantity as well as the quality of coal-based power plants for finding the performance, type, and destruction of exergy for a particular location of the plant.
The supercritical drumless boiler generates a pressure of steam of 253 bar with a temperature of 568 °C at 532.5 kg/s steam flow. Both CRH and HRH stages are available with an inlet temperature of 300 °C and an outlet of 596 °C. The main aim of these stages is for moisture content avoidance purposes at the last stages of the Low-pressure turbine (LPT). Various LP heaters and HP heaters extractions were available at various turbine stages. All LP heaters extractions were taken from both LP and IP turbine stages, and all HP heaters extractions were taken from HP turbine stages. All these extractions were taken for the regeneration of feed water; Figure 2 shows a clear diagram of all parts including HP and LP heaters.

3. Boiler Combustion Process Modeling

CFD is one of the effective simulation technologies for reconstructing or estimating the physical behavior of an engineering product under exact or assumed conditions of boundary (shape, starting state, end state, applied load, etc.). By applying this technology to simulate highly complex industrial processes, Firstly, the thermal power plant model was developed with all furnace dimensions, and then analyzed the furnace exit gas density and temperature fields. Finally, the results of the simulation of furnace exit gas from the experiment were compared with the results from the operation of the supercritical boiler. The results obtained from this simulation, such as flue gas temperature, velocities of PA, and SA, are close to the boiler optimization results.

3.1. Supercritical Boiler Furnace Geometry

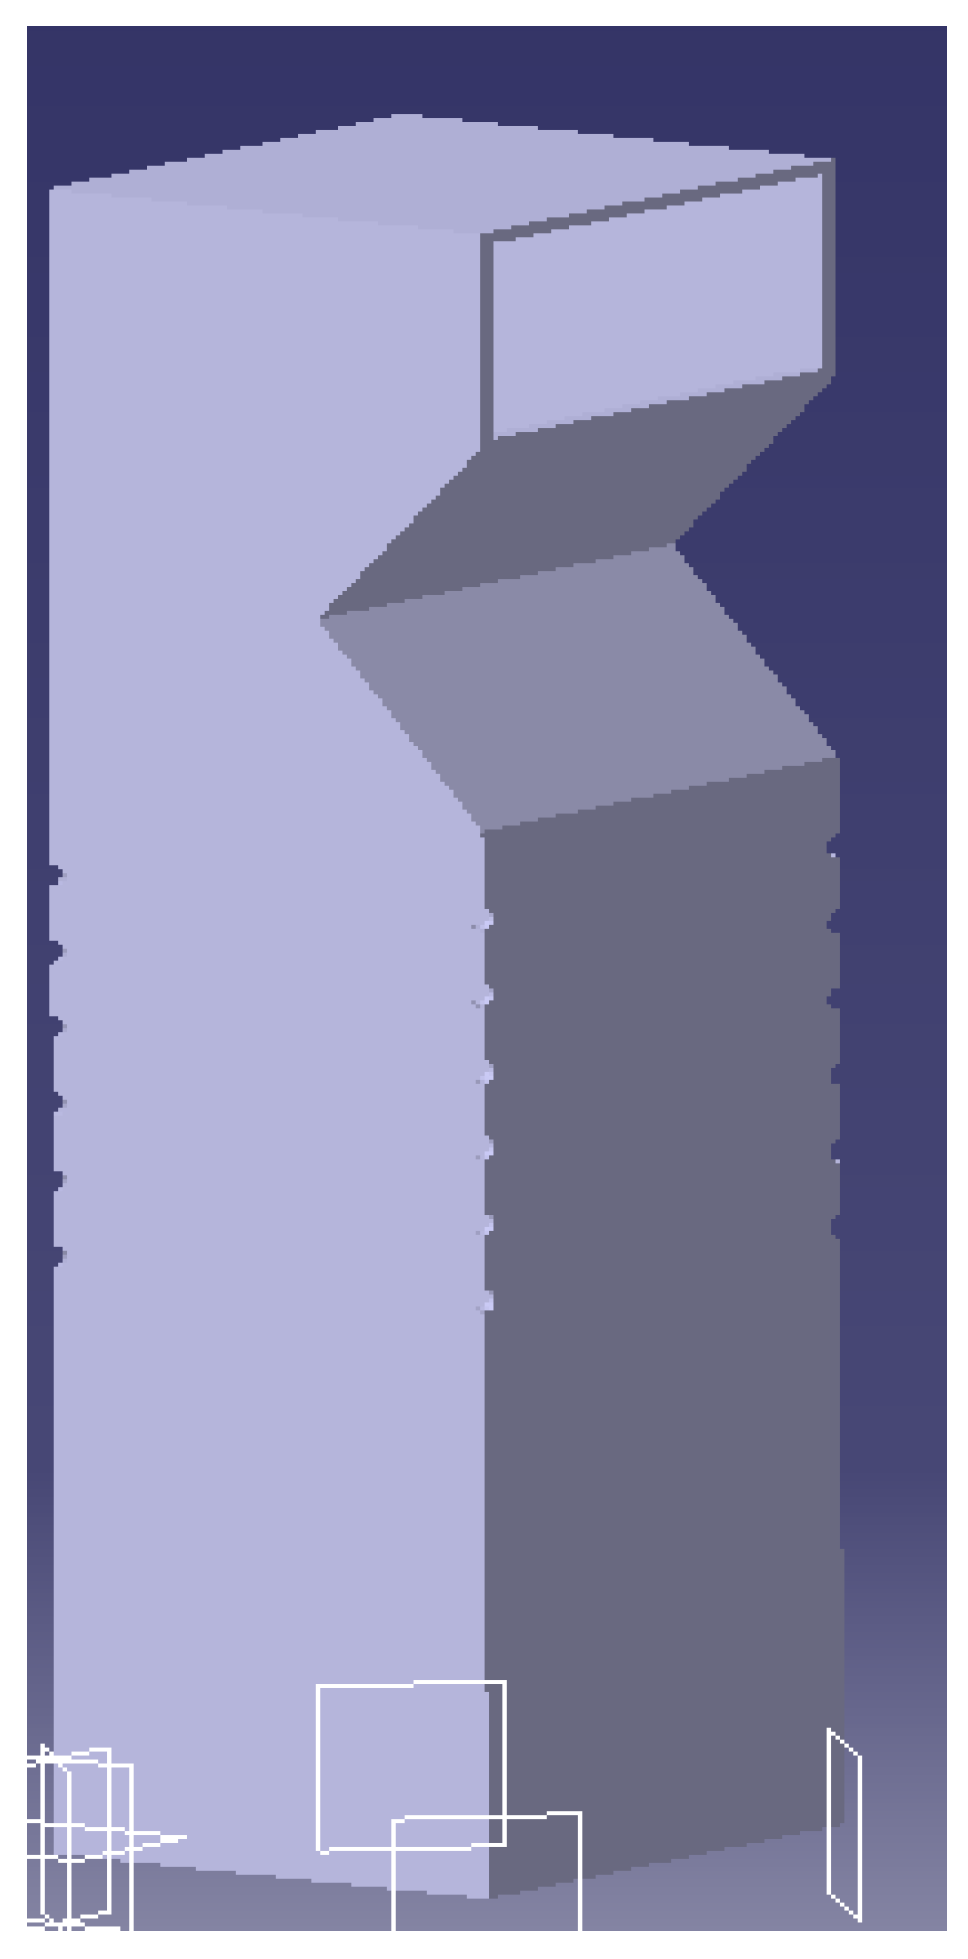
A coal-fired three-dimensional model is developed in CATIA V5 software based on the physical data of the plant with 20.988 m width, 18.444 m depth, and 64.481 m height having a generation of 1884 tones flow. This model is further simulated and analyzed in ANSYS Fluent 14.5 to know the flue gas characteristics such as density and temperature. After the implementation, the obtained results were matched with the physical results from the plant by implementing this experiment. Figure 5 and Figure 6 show the geometry of the supercritical boiler.
The combustion occurs from six elevations containing four corner burners in each elevation; a total of 24 no’s burners were placed in the combustion space. Each burner has two ports for supplying air to the furnace. The mixing of fuel with primary air supplies from the bowl mill to the bottom port to supply ignition fuel to the furnace. The second port is provided on the top of the burner for supplying enough SA to the boiler furnace.
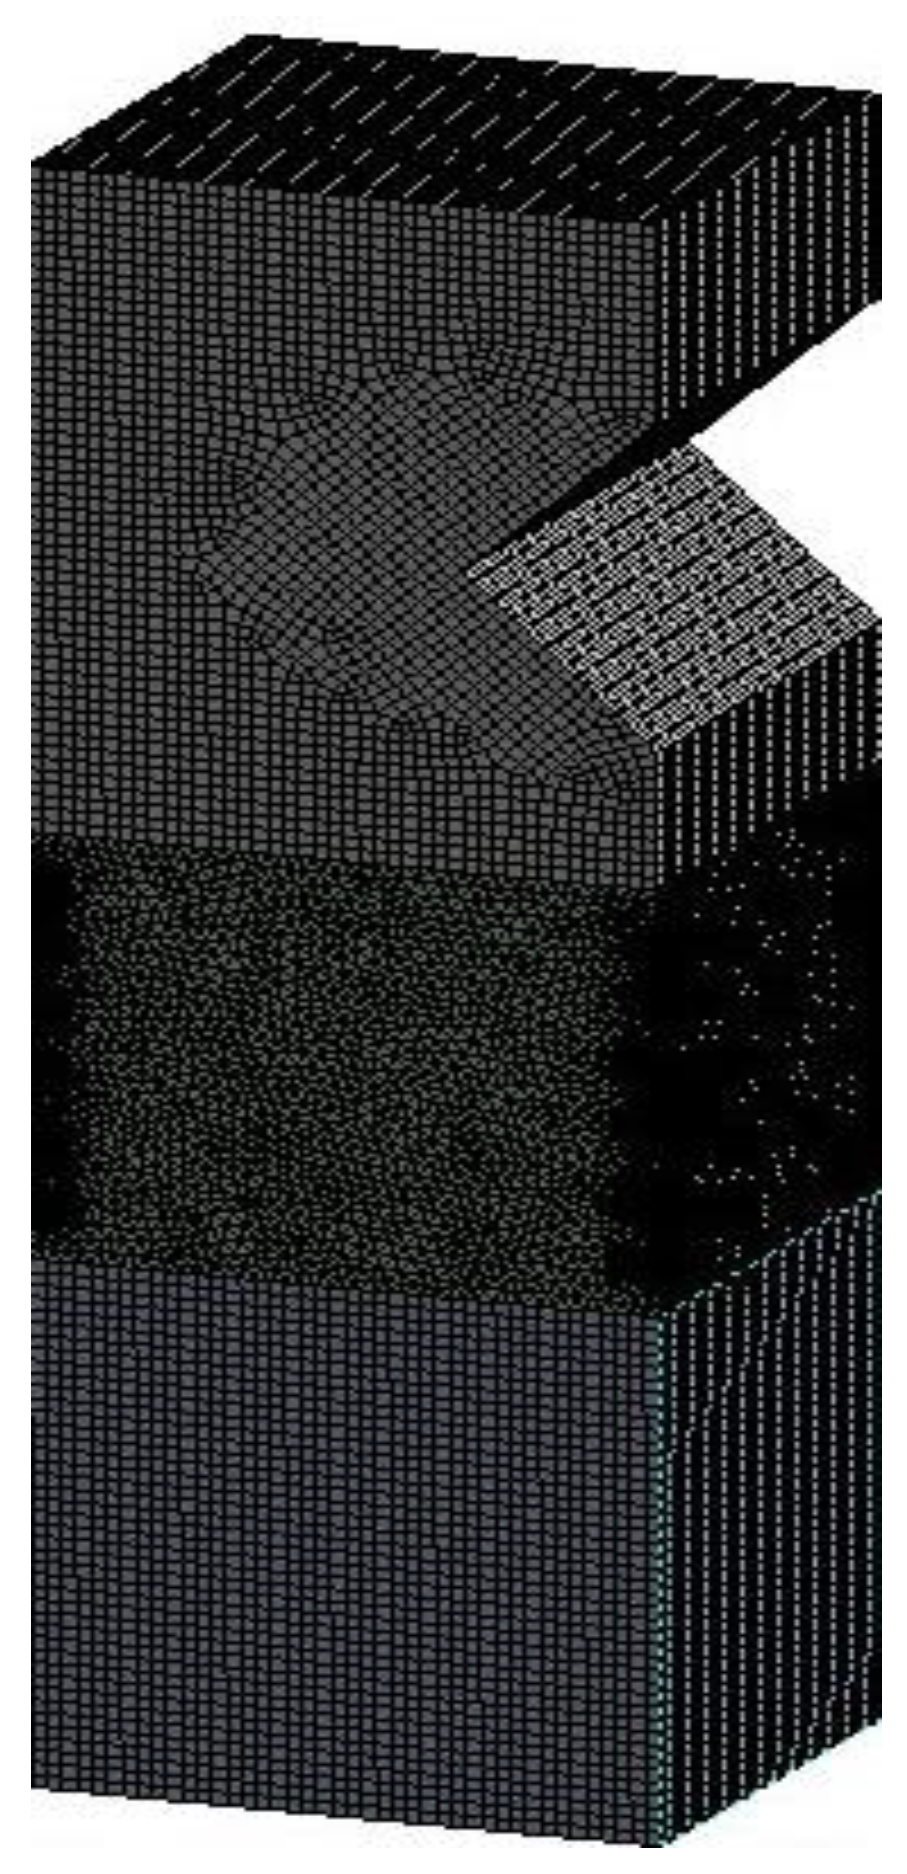
The flame and boiler exit gas properties mostly depend on the PA and SA characteristics. The detailed operating parameters of burners are given in Table 3. Burner each group has both primary and secondary ports which were located on the vertical axis as shown in Table 4. The complete meshing data used in the work is given in Table 5 and the detailed meshing of the furnace shows in Figure 7. The proposed research combines GA and CFD for further identification of fouling and slagging forms on tubes of water wall and reheater and super-heaters, and optimal elemental number and mesh node is significant, completed meshing and inadequate meshing could negatively influence slagging and fouling thickness on the water wall panels.

3.2. Combustion Process Modeling

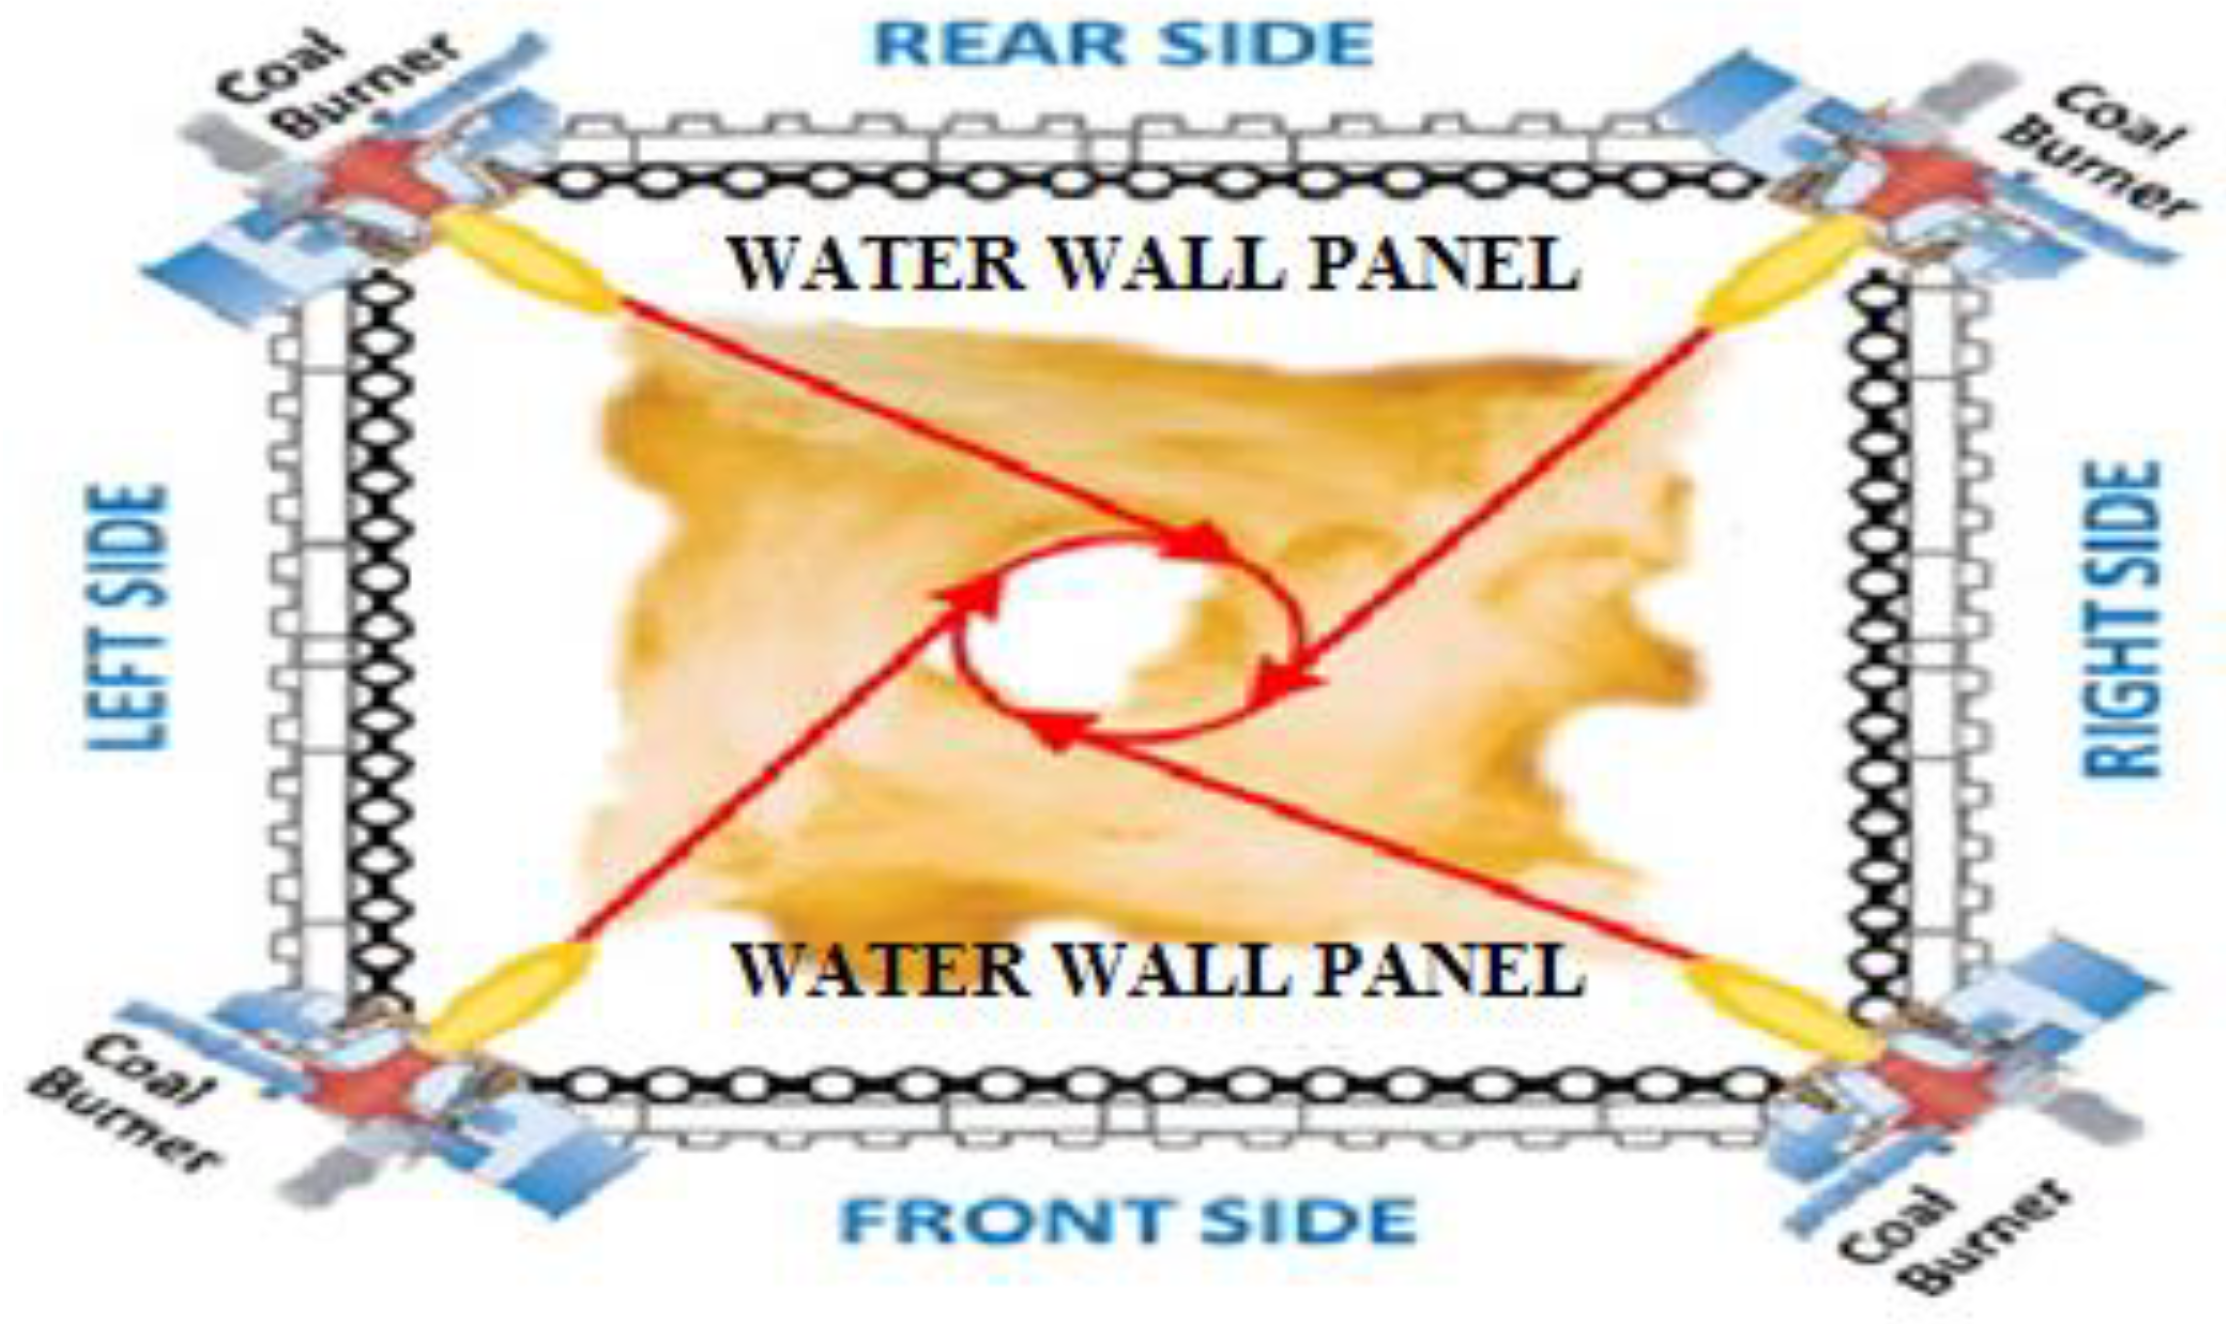
A boiler heat transfer occurs throughout the furnace by conduction, convection, and radiation. The flame from the four corners of the furnace creates a fireball in the middle of the furnace. Likewise, in six elevations the fire is continuously going upwards, as each elevation has the same four-corner burner arrangement. Figure 8 and Figure 9 show the firing condition inside the furnace and the boiler. The generated heat from the combustion of coal transfers from the middle of the furnace to the adjacent water wall by the mode of radiation, then heat transfer from the metal pipes to the flowing medium by the mode of conduction and the heat carry the flowing medium such as water or saturated steam by the mode of convection and conduction. Lastly, the heat is absorbed by steam inside the reheater and superheater by the mode of conduction and convection. The detailed coal combustion inside the boiler and transferring heat from the middle of the furnace to the particular portion are modeled in this research.
The equation of heat transfers by conduction and convection [29]:
x t   ( ρ E ) + ( v ( ρ E + ƿ ) ) =   ( Keff     T   Ʃ j   h j j j + ( τ eff .   v ) ) + S h
ρ is the density of flue gas (kg/m3), ƿ is the pressure of flue gas (N/m2), v is the velocity of flue gas (m/s), Keff is the material thermal conductivity effectiveness (W/m-K), T is the material temperature (K), jⱼ is the flue gas diffusion flux of species j (W/m), hj is the enthalpy of species j (J/kg), τeff is the viscosity of flue gas (N/m) and Sh. This is the combustion process heat release rate (W), Yⱼ is the furnace exit gas mass fraction and h is the enthalpy of flue gas.
The transfer of heat (qcond, W/m) from the furnace to the waterside through conduction mode is given as
q cond = Keff     T
The flue gas diffusion (qdiff, W/m) due to energy transfer is given as
q diff = Ʃ j   h j j j
The energy transfer (qdiss, W/m) due to furnace exit gas viscous dissipation is given as
q diss = τ eff .   v
The total energy transfers from the boiler
E = h P ρ + v 2 2
h = Ʃ j   Y j h j
and
h j = T   ref   T C p j dt
where Tref is 298.15 K and Cpj is the specific heat of furnace exit gas contained in species ‘j’ (J/kg-K).
The total enthalpy is given by
x ( ρ H ) + ( v ρ H ) =   ( ( K t / C p ) H ) + S
Kₜ is the conductivity of flue gas, Cp is the specific heat capacity. The enthalpy H is given as
H = Ʃ j   Y j H j
H j = T   ref   j T C p   j dT + h ° j   ( T re ,   j )
j (Trefj ) is the formation of enthalpy of species j at the ambient temperature Tref[K].
The reaction of chemical energy source Sh is given as
S h = Ʃ j   ( h ° j / M j )   R j
where Rj is the species volumetric rate ‘j’ (m3/s) and Mj is the flue gas volume of species ‘j’ (m3/kg).
The equation of transfer of radiation for an absorbing, scattering, and emitting at position r in the direction s is given as:
dI   ( r , s ) ds + ( a + σ s )   I   ( r , s ) = a n 2 ( σ T 4 Π ) + ( σ s / 4 Π ) 0   4 Π I   ( r , s ) Ø   ( s . ś ) d Ω
Here the position vector is indicated by ‘r, the direction vector indicated by ‘s’, the scattering direction vector is indicated by ‘ś’, the coefficient of absorption for heat transfer is indicated by ‘a’, the refractive index is indicated by ‘n, the coefficient of scattering is indicated by ‘σₛ’, the constant of Stefan-Boltzmann (5.66 × 10⁻⁸W/m2-k4) is indicated by ‘σ’, the intensity of radiation is indicated by ‘I’ (W/m2), which depends on ‘r’ and ‘s’, the Ø is the phase function, and Ω is the surface angle of heat transfer equipment.
For heat transfer process simulation inside the furnace, Discrete Ordinates (DO) radiation model is applied. The governing equation of the DO model is given as
  ( I   ( r , s ) ś ) + ( a + σ s )   I   ( r , s ) = a n 2 ( σ T 4 Π ) + ( σ s / 4 Π ) 0   4 Π I   ( r , s ) Ø   ( ś . s ) d Ω
j = 1 N μ ij T T j β i T T j =   α i T   k = 1 L I k ω k S i T + S i h
where αiT = aVi, βiT = 16aσTi3Vi, SiT = 12Ti4Vi, ais absorption coefficient, the terms μijT, and Sih are the terms of discretization of the convection and diffusion.
The main focus of this research is to optimize the coal combustion process with the pulverized coal and both samples of air entering the combustion chamber at different elevations. Before being taken out of the reaction the reactants are mixed at the molecular level, coal combustion from PC is a non-premixed system that is implemented in this research.
The mixture fraction ‘f’ is a scalar quantity in which thermo-chemical fluid states are closely related. The atomic mass fraction of the mixture as
f = Z i Z i ,   ox Z i , f u e l Z i ,   ox
where Zᵢ is the elemental mass fraction ‘i’. The subscript fuel indicates the value of the inlet fuel stream. The subscript ‘ox’ indicates the value of the inlet oxidizer steam. The equation of transport for the mixture fraction is given as
t   ( ρ f ) + . ( ρ v f ) =   ( τ eff / σ t ) f + S m
f’ is mixture fraction, σₜ = 0.85, and Sₘ mass transfer from a particle of pulverized coal to the gas phase (W).
Models of k-ϵ were applied for furnace exit gas simulation of a thermal boiler. The generated equations are given as
t   ( ρ k ) + x j . ( ρ k u j   ) = x j [ ( μ + μ t / δ ) k x j ] + G k + G β ρ ε Y m + S k
t   ( ρ ε ) + x j . ( ρ ε u j   ) = x j [ ( μ + μ t / δ ) ε x j ] + ρ C 1 S ε + ρ C 2 ( ε 2 / ( k + v ε ) ) + C 1 ε ( ε k ) C 3 ε G β + S ε
ε is the turbulence dissipation rate, Yₘ represents the fluctuating dilation contribution in compressible turbulence to the overall dissipation rate, Sₖ term is neglected due to the flue, gas flow is a low-speed in the furnace, constant term C1 = 1.44, C2 = 1.9, ∂k is the turbulent Prandtl number = 1.0, and ε is the turbulent Prandtl number for ‘ε’ = 1.2.
Y m = 2 ρ ε M 2 t
Mₜ is the Mach number turbulence. It is considering the compressible effect on turbulence flow in the model of k-ϵ.
M t = k / a ²
where ‘a’ is sound speed (m/s).
G k = ρ u i u j u j x i
Let u′ᵢ = uiui, u’j = ujuj. ui, uj be exact flue gas velocities, and ui, uj be mean flue gas velocities.
G b = β g i ( u t / P r t ) T x j
Gb is the generation of kinetic energy due to velocity gradient; Prₜ is the Prandtl number-0.85, gᵢ is the gravitational vector, and β is the coefficient of thermal expansion.
β = 1 / ρ ( ρ T ) p
The turbulence viscosity modeling of furnace exit gas given as
μ t = ρ C μ ( k 2 / ε )
where
C μ = 1 / ( A o + A s   ( k U ε )
where
U = (   S ij   S ij + Q ij Q ij )
and
Q ij = Q ij 2 ε ijk ω k
Q ij = Q ij ε ijk ω k
where Qᵢⱼ is the rate of rotation tensor in a reference frame,ꞷₖ is the angular velocity (rad/s), Aₒ = 4.04, the coefficient εᵢⱼₖ is given by ANSYS Fluent 14.5
A s = 6 C O S Ø
Ø = C O S 1 ( 6 W ) ,   W = ( S ij   S jk   S ki ) / S 3 ,   S = (   S ij   S ij ) ,   S ij = 1 2 [ u j x i + u i x j ]
where ui, uj, and uk are the velocity components of furnace exit gas (m/s), xi, xj, and xk are axial coordinates.
S ε = C 1 ( 2 S 2 ij ) ½   ϵ C 2 ρ ( ϵ 2 k + vT )
C 1 = max [ η η + 5   ] ,   η = k ( 2 S 2 ij ) ½

4. Numerical Simulation

The first objective function is to maintain high heat transfer from the combustion space of the furnace to tubes of water wall and steam tubes. Coal combustion achieves this in the presence of a stoichiometric air ratio. The objective function of the second level is to maintain a temperature lower than the ash melting temperature. It is achieved by maintaining proper primary and secondary air velocity and temperature. The third objective function is to improve boiler performance by optimizing excess air, fuel, and air consumption inside the furnace when combustion takes place. The fourth objective function is to control the emissions by controlling the fuel consumption and maintaining the temperature of the tube surface within the ash melting temperature to avoid slag formation on tubes of water and steam. The detailed objective functions and list of performance improvement measures are shown in Table 6.
The experiment was carried out in a 660 MW supercritical power plant furnace. During the experiment, no blowdown was given from the boiler, the emergency drains of HP and LP heaters were in closed conditions, and the plant was running in MCR condition. Table 7 gives the operating ranges of one set of burners. An experiment has been conducted with ten different close monitoring cases with CFD, which are shown in Table 8. The detailed analysis was carried out with plant data from the plant’s other losses, performances, and pollutants. The detailed analysis is given as:

4.1. Cases I to V Observations

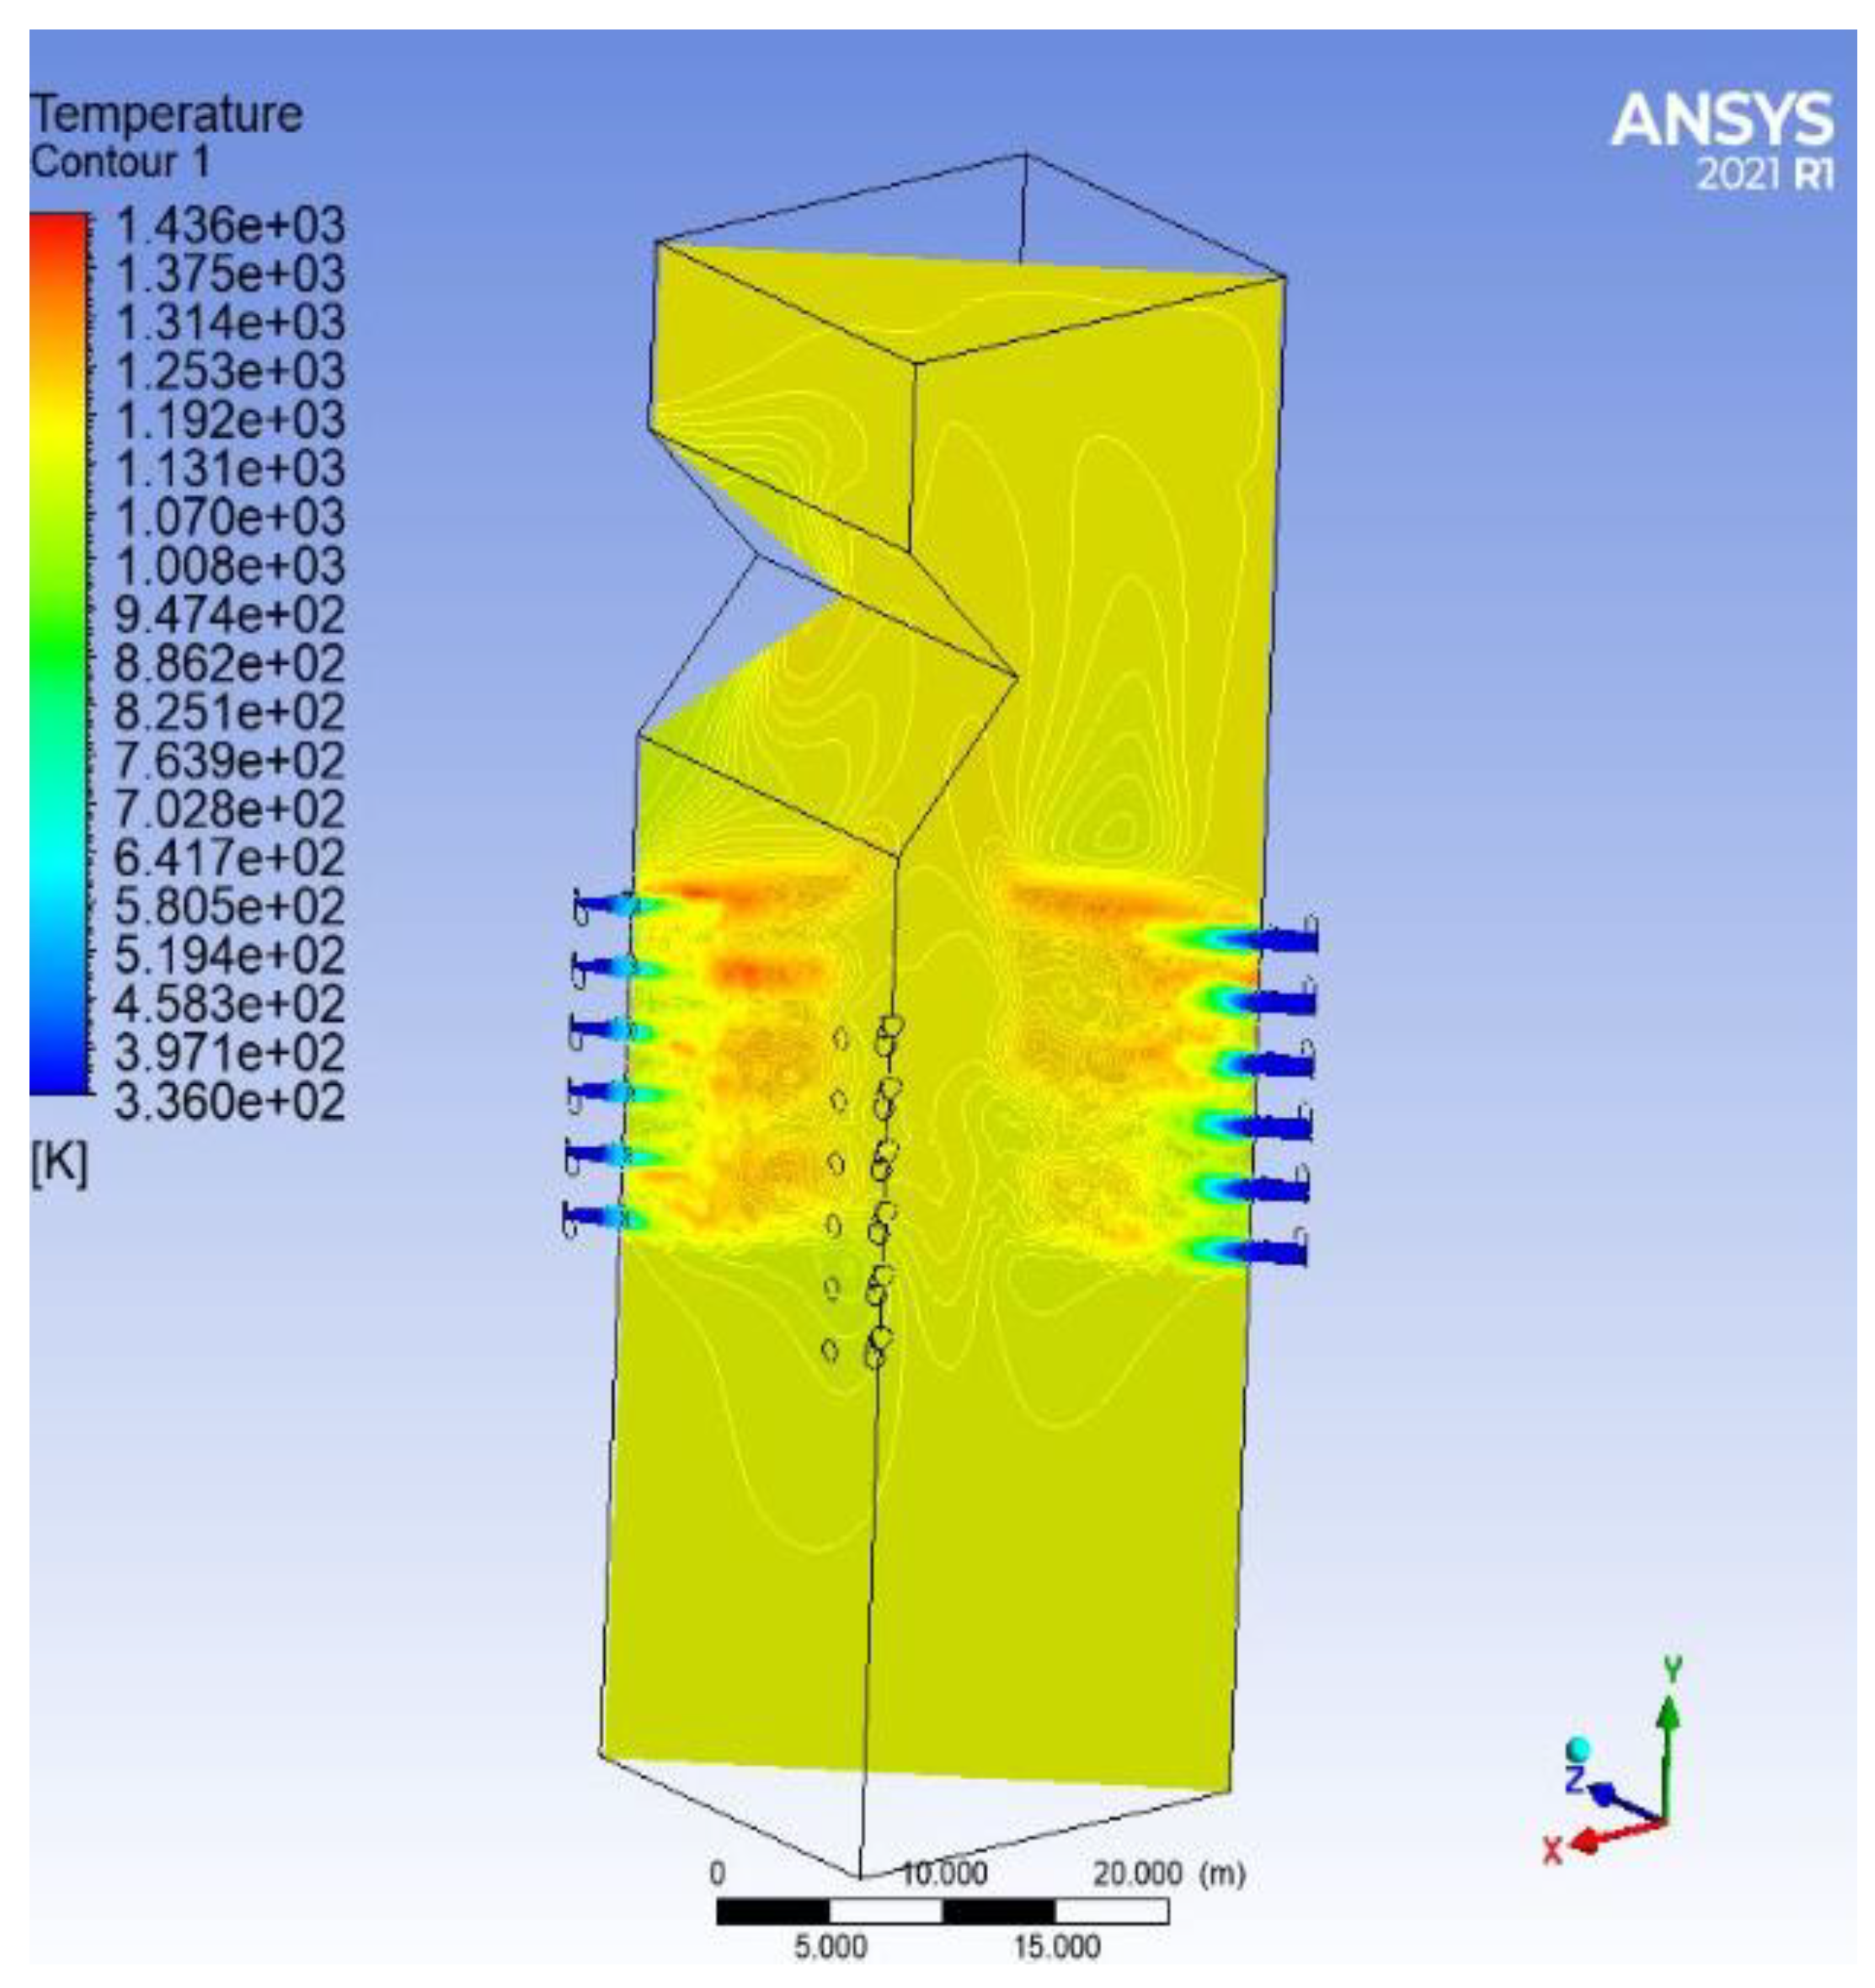
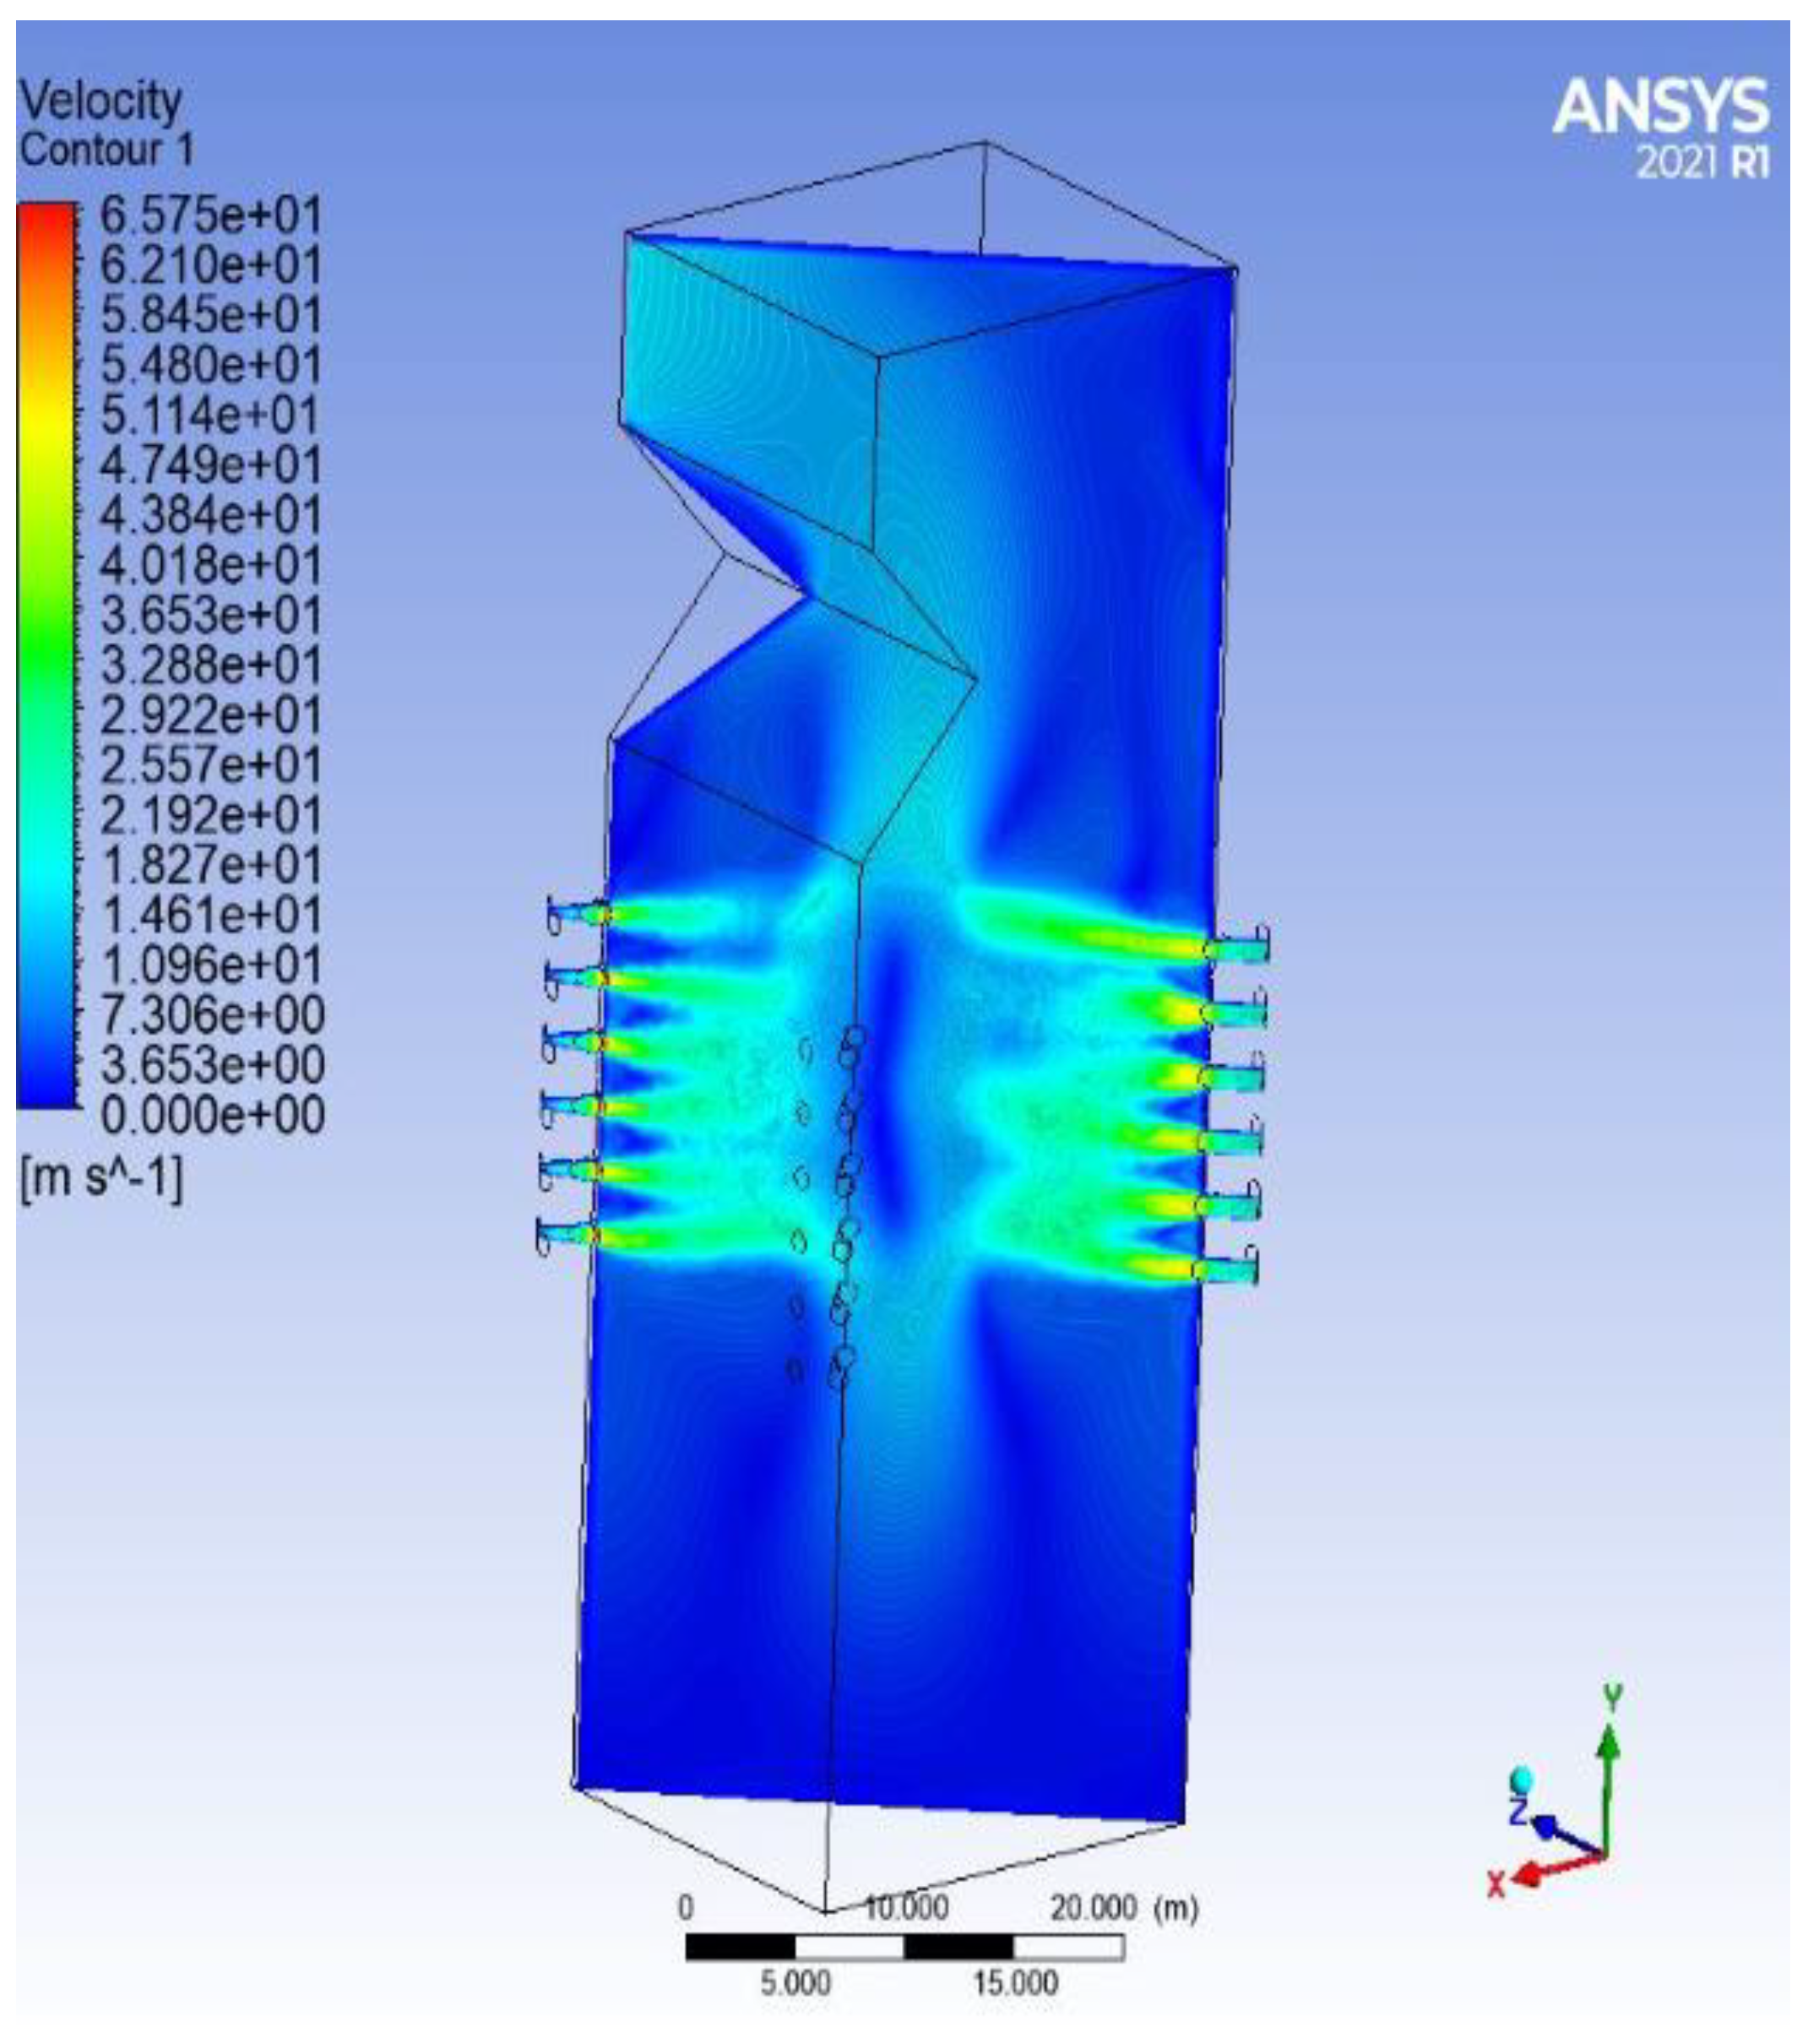
In cases where the I to V furnace temperature is maintained at less than 1373 K, there is no slag formation observed on water and steam tubes. The air velocities are low with flue gas velocity, and the un-burnt percent of carbon increases in furnace ash and fly ash due to a lack of a stoichiometric air ratio with the fuel. The heat transfer rate reduces from the furnace to tubes of water or steam due to increasing un-combustibles. Accordingly, coal consumption increases to 378 tonnes from 373 tonnes to mitigate heat recovery further into the tubes. There is a decrease in boiler performance due to some losses and an increase in emission generation from the boiler due to fuel consumption increases. Figure 10 and Figure 11 show the temperature of the furnace exit gas and the distribution of the velocity of case IV. Maximum velocity was achieved in the case of IV at 20.92 m/s, and maximum temperature was achieved at 1253 K. This achieved temperature is lower than the ash fusion temperature of 1575 K. Ash could not stick to the surface of tubes of water wall and steam tubes. No slag formation has happened with PA-22.5 m/s and SA-25 m/s at an air temperature of 330 °C.

4.2. Case VI Observations

In these cases, the VI furnace temperature is maintained at 1670 K, there is a slag layer of 12.7 cm formed on the tubes of water, and a slag layer of 1.27 cm formed on the reheater and superheater tubes. At this condition, the velocities of primary air are 15 m/s and secondary air is 35 m/s at the inlet of the burner, resulting in 24.82 m/s of flue gas generating velocity from the boiler. The heat transfer between the furnace and tubes decreases to 5945.876 W/m2 shown in Table 9. As the transfer of heat between the furnace and water tubes decreases due to slagging, the boiler requires excess coal to be added to the furnace for further combustion to maintain the required heat transfer and to maintain steam parameters such as pressure, temperature, and flow. Coal consumption increased to 383.2 tonnes from 373 tonnes. With excess coal, there is an increase in excess air for stoichiometric combustion inside the furnace. With this result, there is an increase in various emissions; reduced boiler efficiency and plant efficiency; increased dry flue gas losses; increased spray water for controlling the steam temperature at the superheater and reheater; and the boiler generates more quantities of flue gas due to more coal consumption.
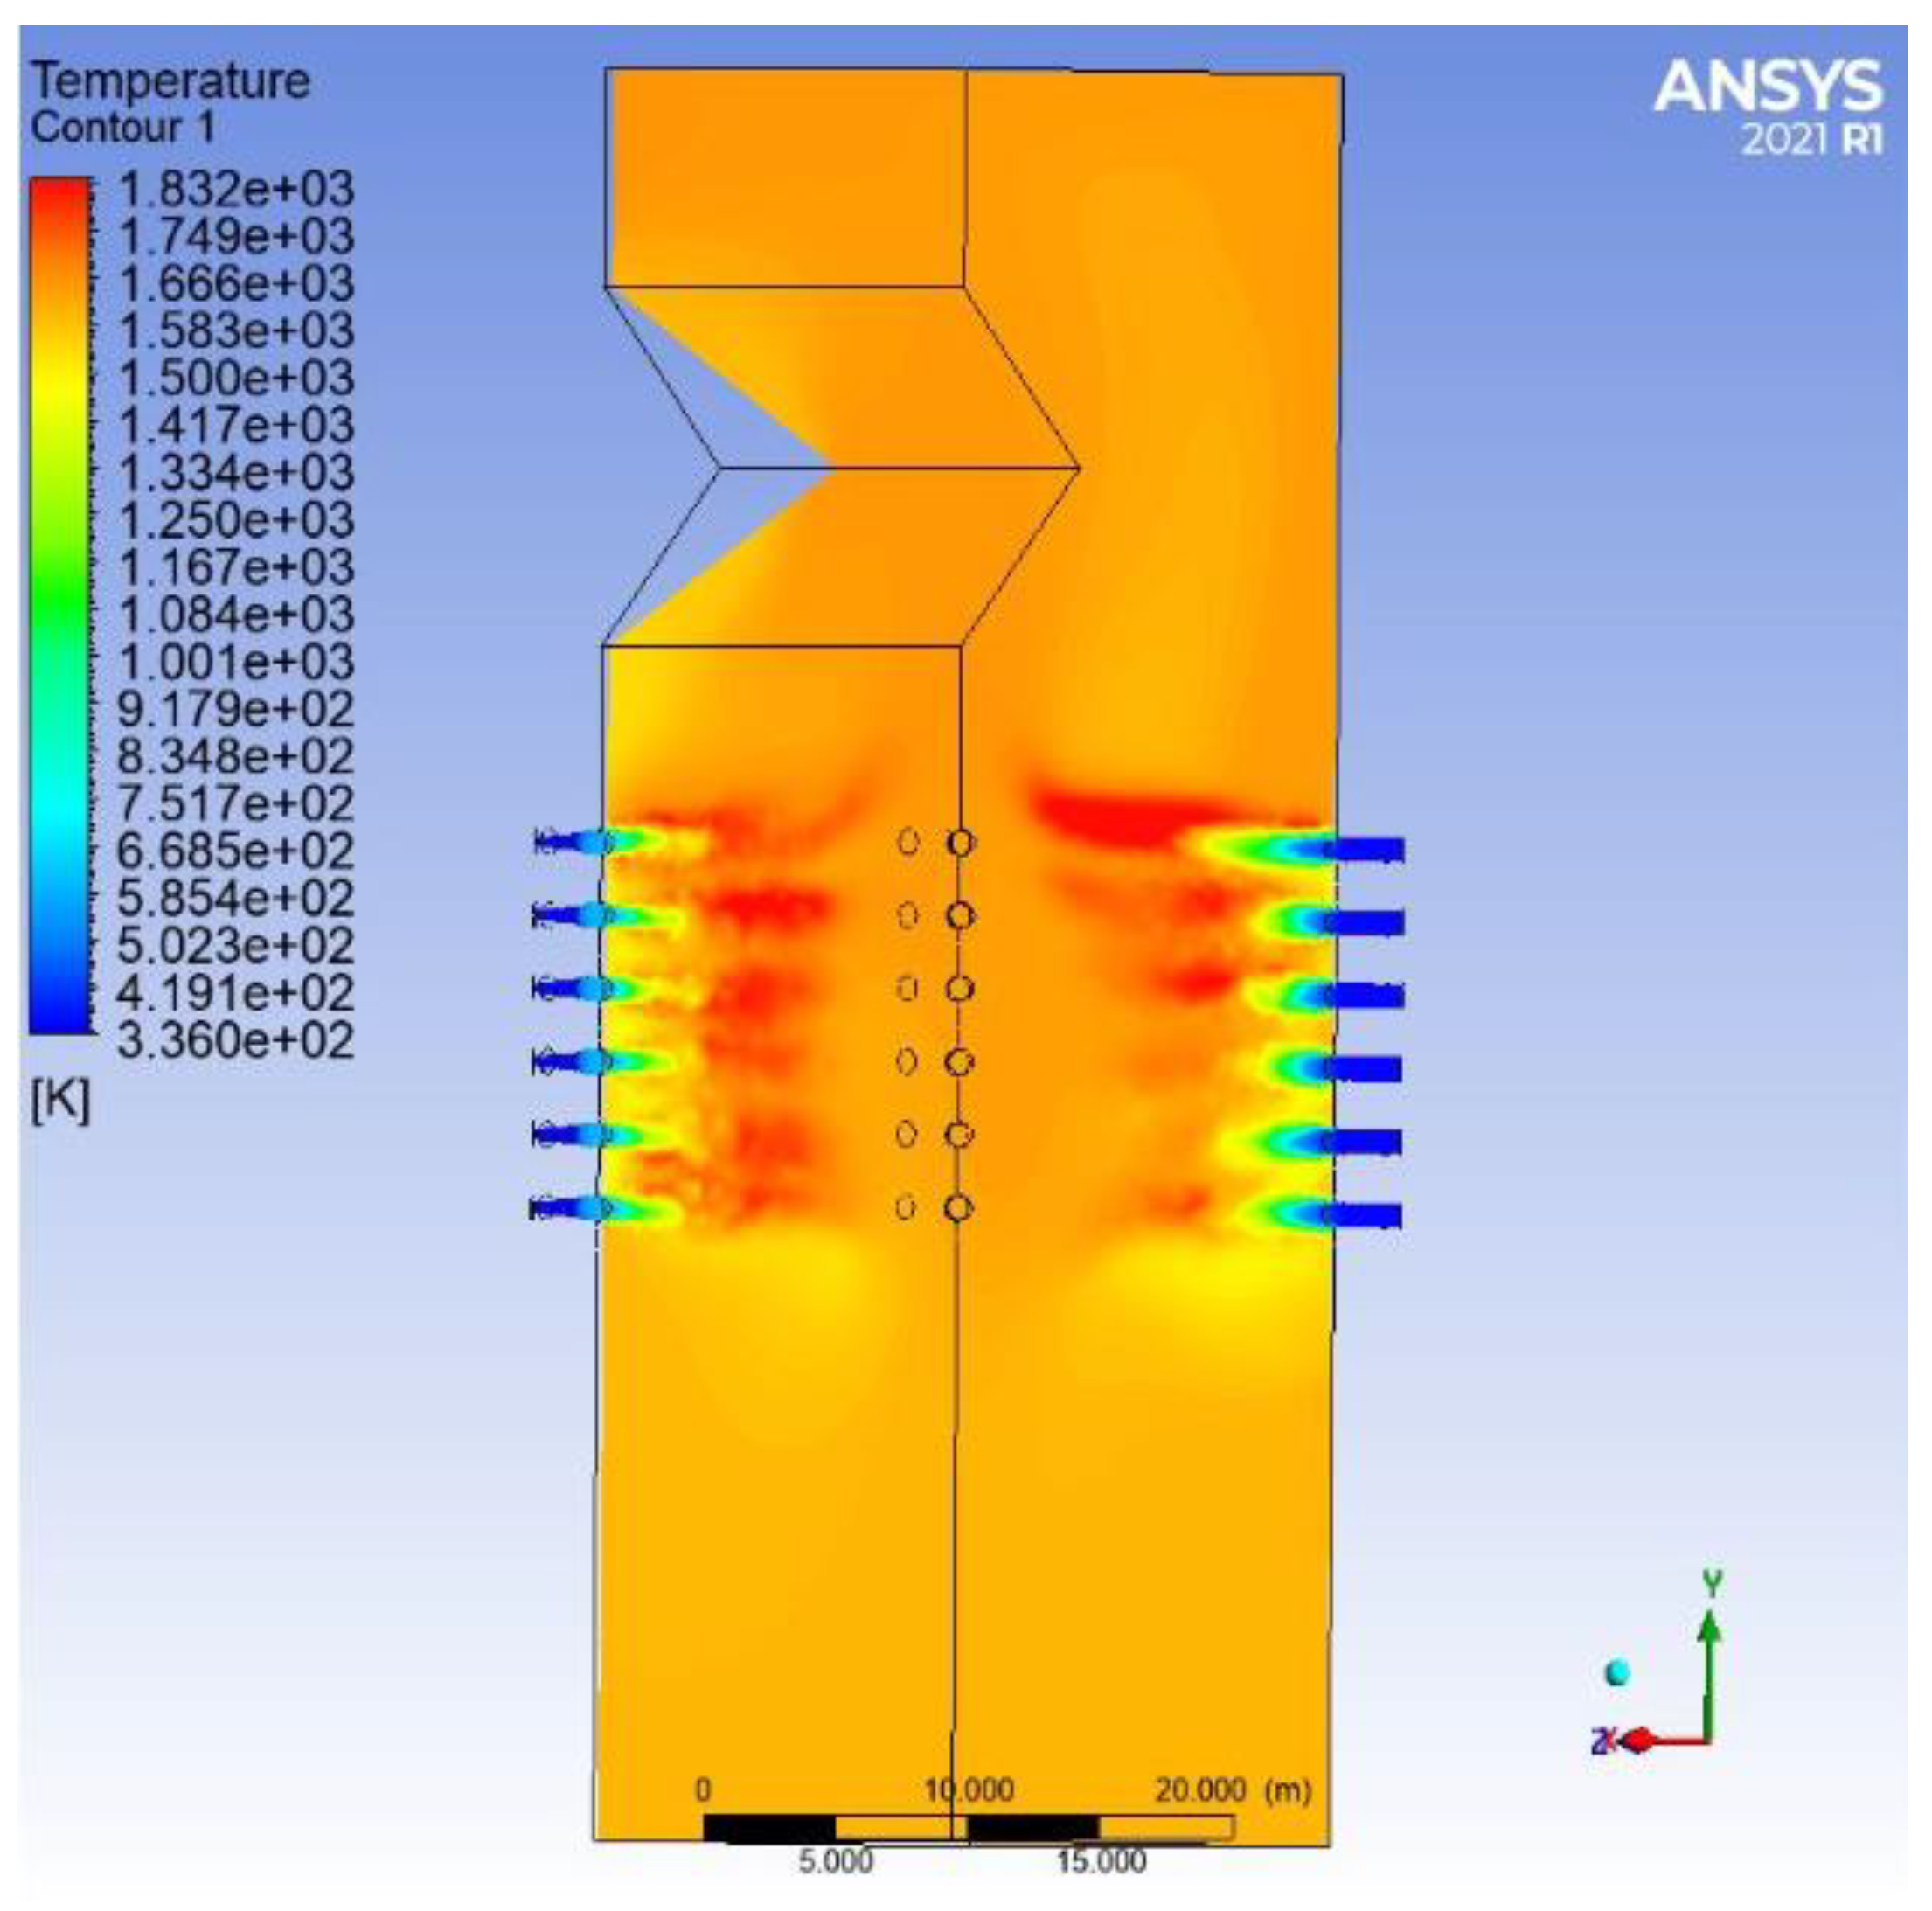
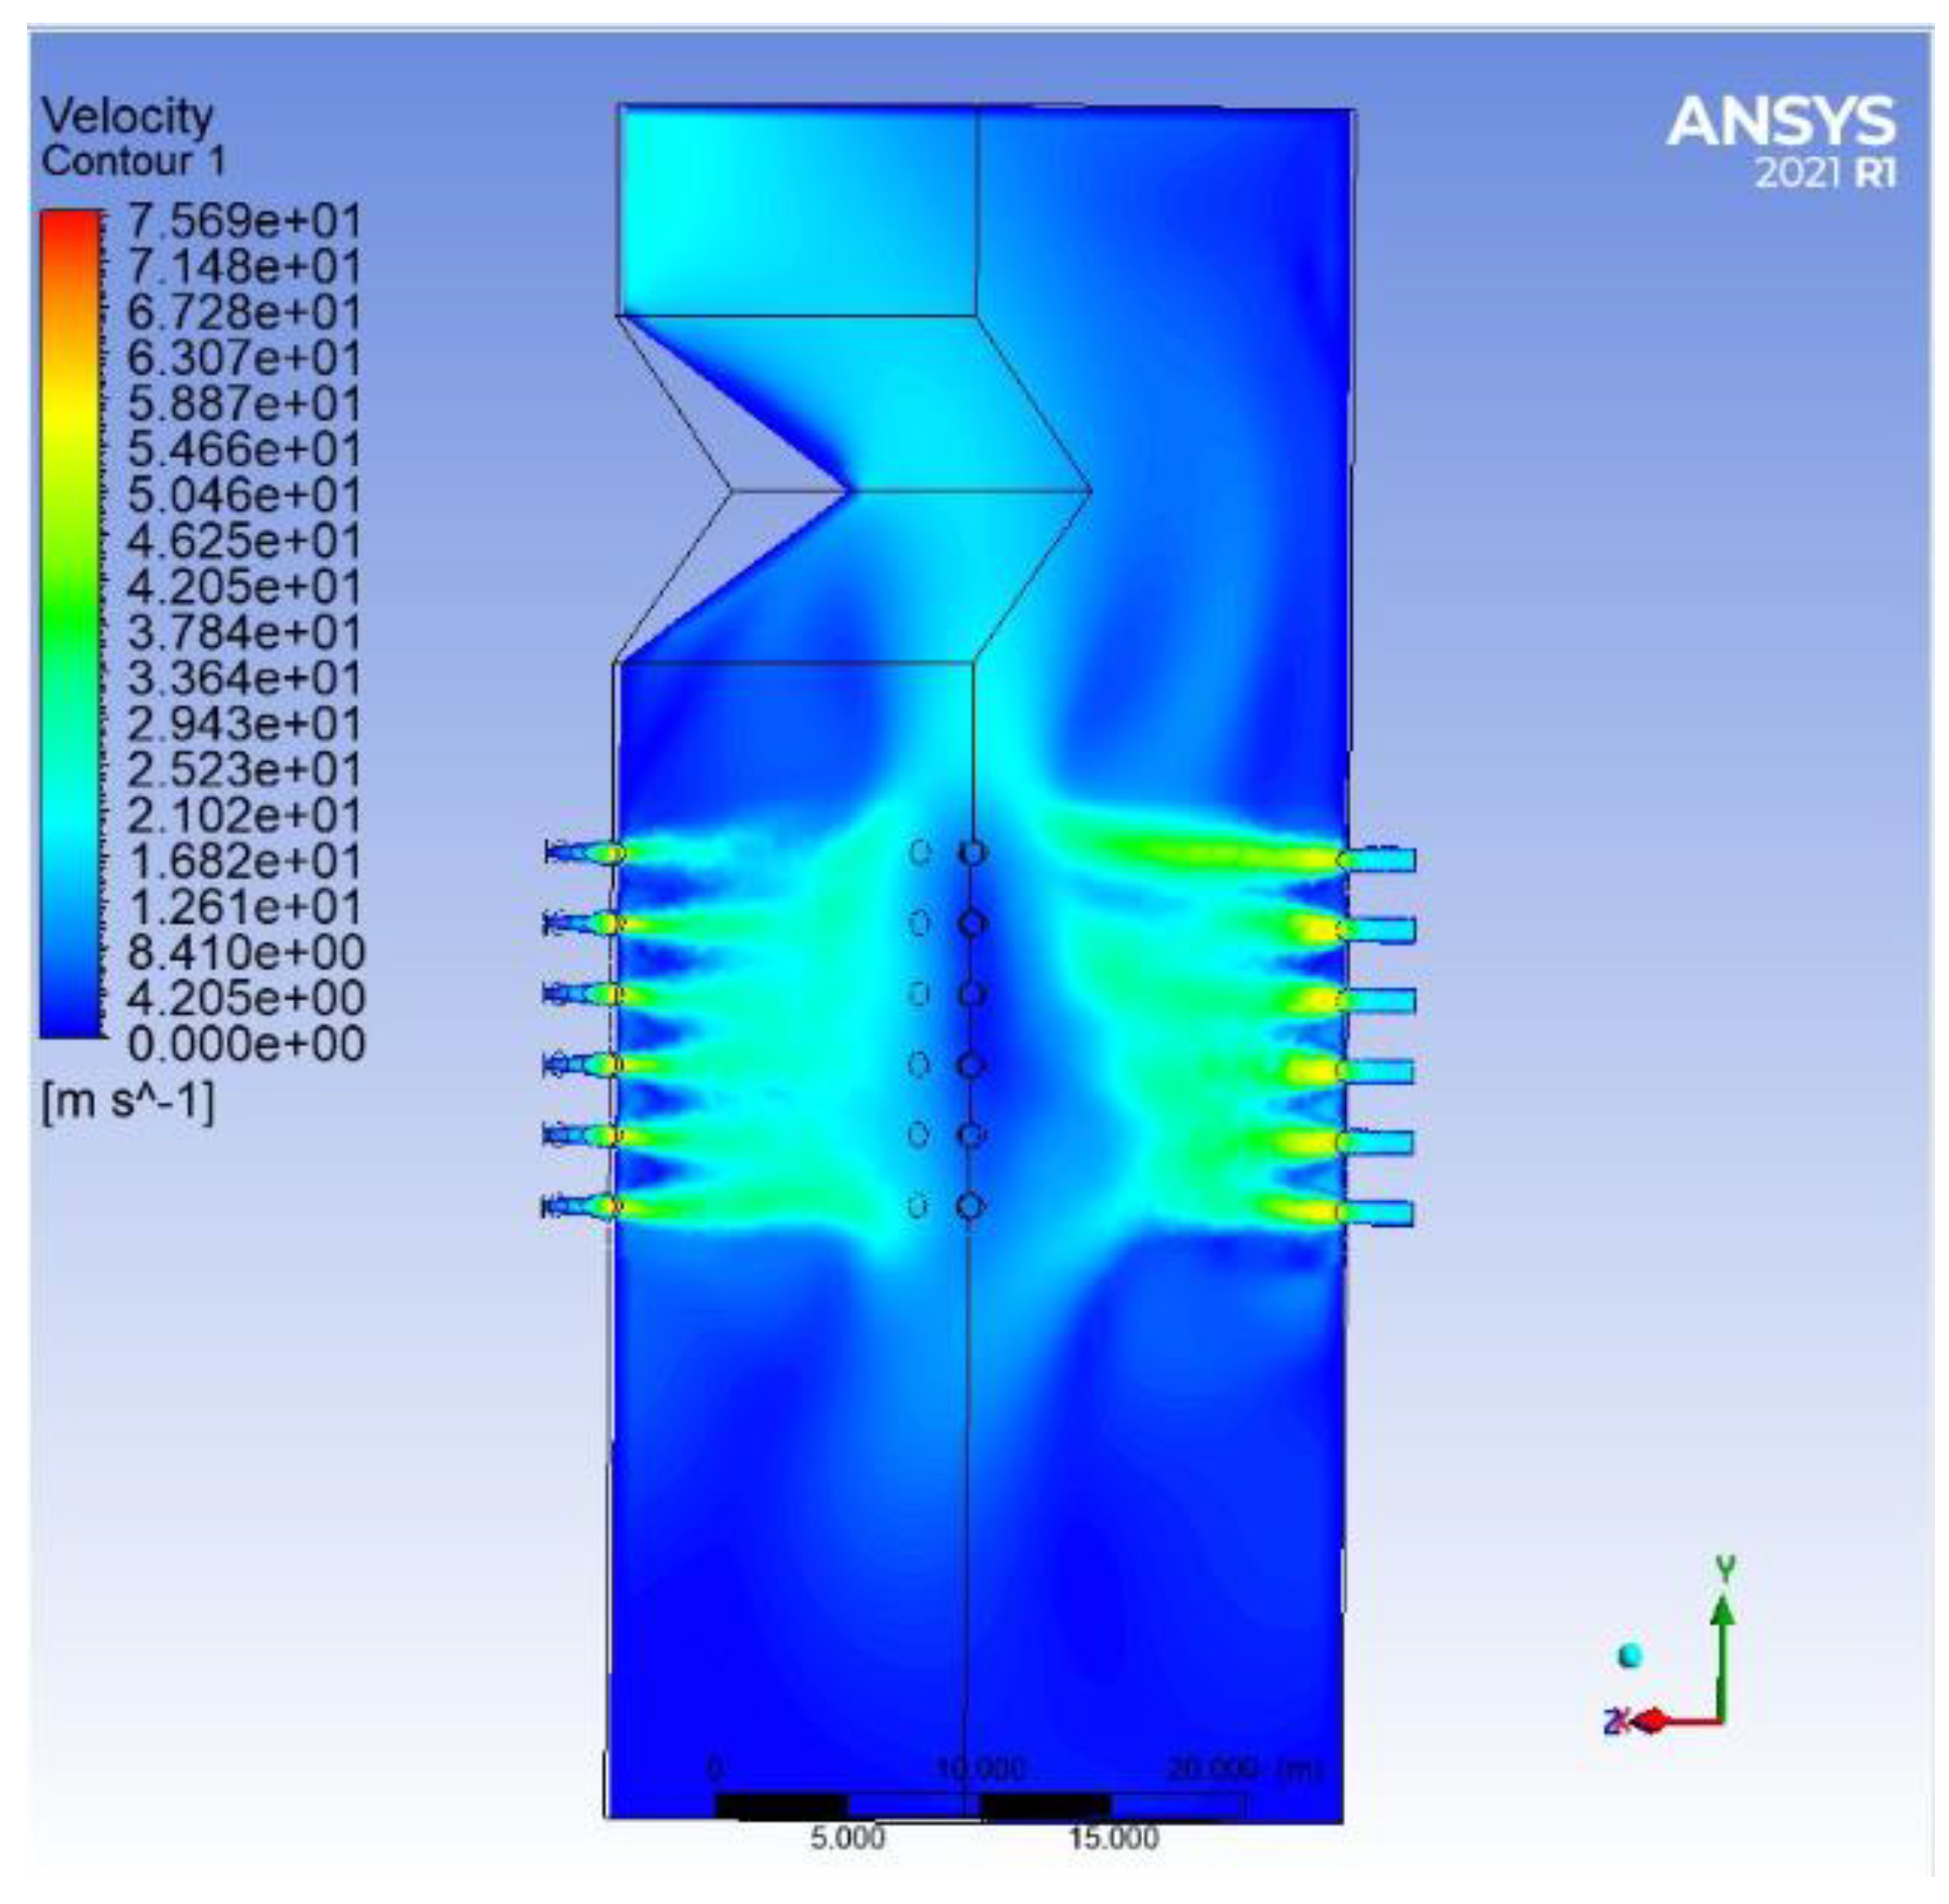
Figure 12 and Figure 13 show the temperature of the furnace exit gas and the distribution of the velocity of case VI. From case no. VI, the average velocity of the furnace is 24.82 m/s and the average temperature of the furnace is 1670 K which is higher than the ash melting temperature. The combustion-generated ash could stick to the surface of water and steam tubes and form a thick slag layer. This slag layer could restrict heat transfer between the furnace and water inside the tube.

4.3. Case VII Observations

In this case, VII furnace temperature is maintained at 1632 K, there is a slag layer of 7.62 cm formed on the tubes of water and a slag layer of 0.762 cm formed on the reheater and superheater tubes. At this condition, the velocities of primary air are 17.5 m/s and secondary air is 35 m/s at the inlet of the burner, generating a 21.82 m/s flue gas velocity from the boiler. The heat transfer between the furnace and the tubes decreases to 7743.76 W/m2 shown in Table 9. As the transfer of heat between the furnace and water tubes decreases due to slagging, the boiler requires excess coal from the furnace for further combustion to maintain the required heat transfer and to maintain steam parameters such as pressure, temperature, and flow. With excess coal consumption increasing to 380.2 tonnes from 376 tonnes, there is an increase in excess air for stoichiometric combustion inside the furnace. With this result, there is an increase in various emissions; reduced boiler efficiency and plant efficiency; increased dry flue gas losses; increased spray water for controlling the steam temperature at the superheater and reheater; and the boiler generates more quantities of flue gas due to more coal consumption. Due to the reduction of slag thickness, better results have come from case-VII than from case-VI.
Figure 14 and Figure 15 show the temperature of flue gas and the distribution of the velocity of case VII. From case no. VII, furnace average velocity is 21.82 m/s and the furnace average temperature is 1632 K which is more than the ash melting temperature.

4.4. Case VIII Observations

In case VIII, the furnace temperature is maintained at 1575 K, and there is a slag layer not present on the water tubes, reheater, and superheater tubes at this condition. The velocities of primary air are 20 m/s and secondary air is 35 m/s at the inlet of the burner, with 19.75 m/s of flue gas generating velocity from the boiler. The heat transfer between the furnace and the tubes of the water wall is 87,513.9 W/m2 shown in Table 9. With this condition, the boiler gave the highest performance in terms of boiler efficiency and heat rate, corrected 373 tonnes of coal, and corrected 16.67% of excess air ratio consumed in the boiler for stoichiometric combustion, reducing different emissions that go to the outside and decreasing dry flue gas losses to some extent.
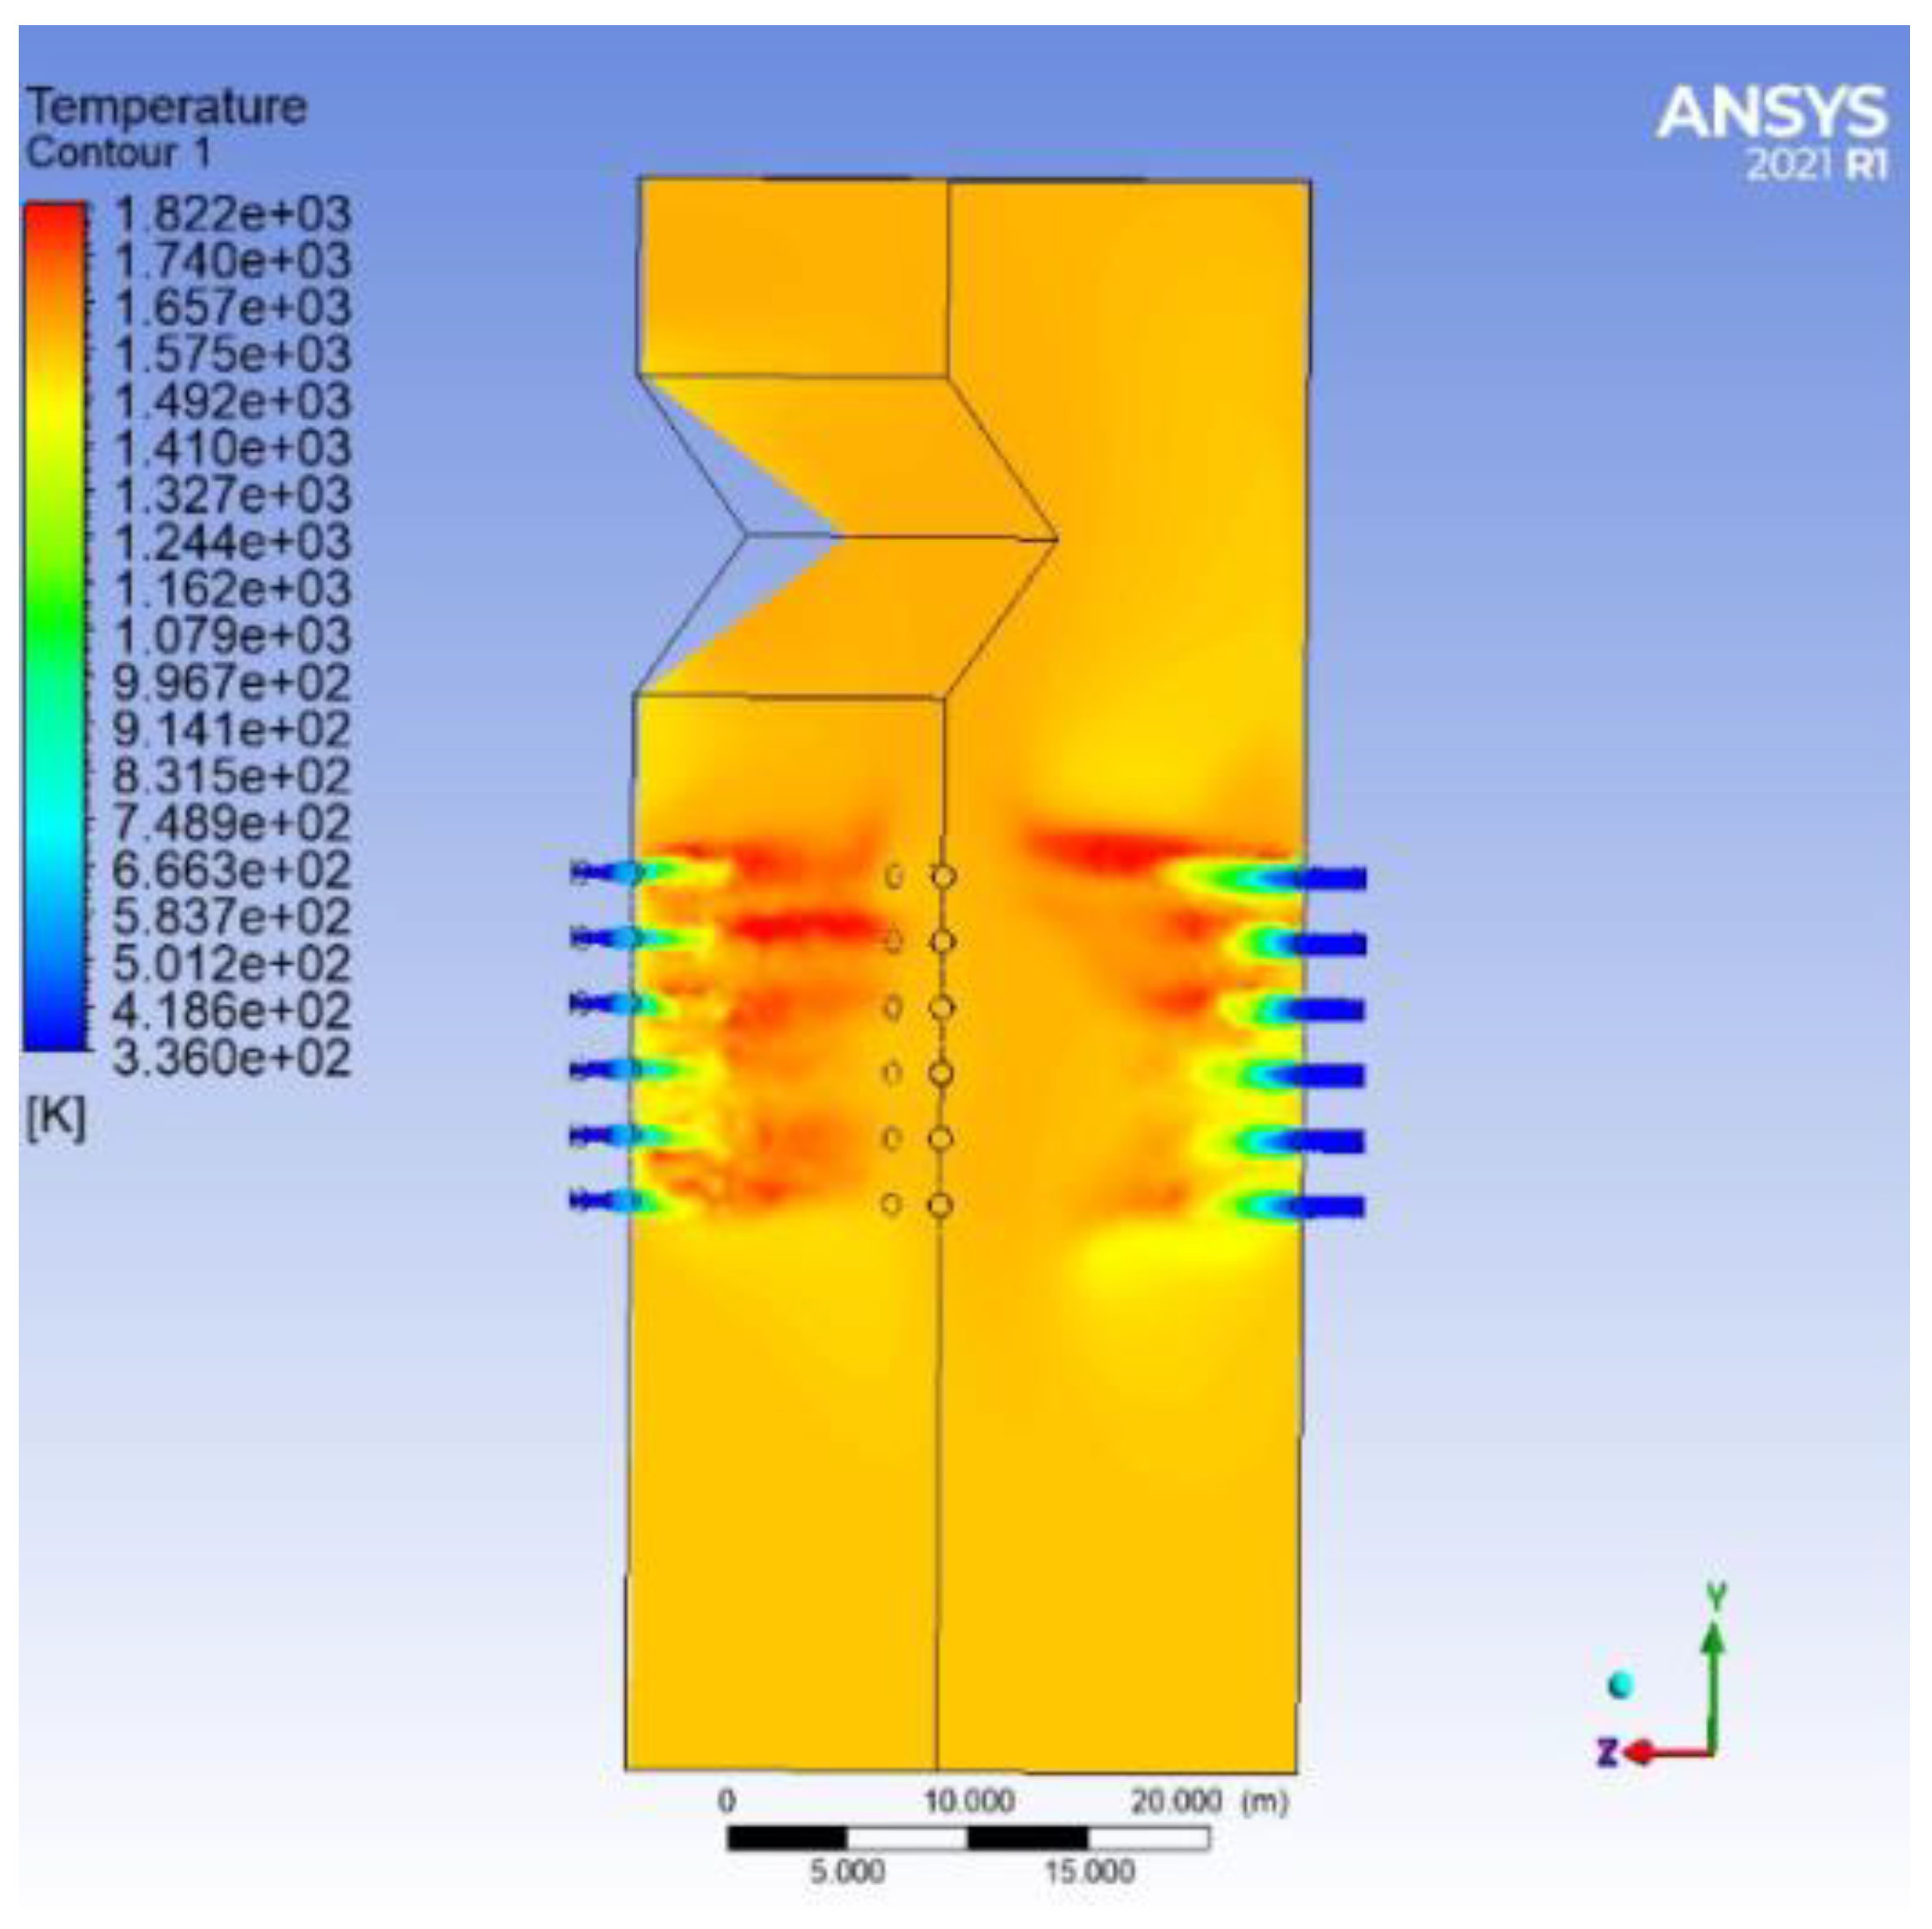
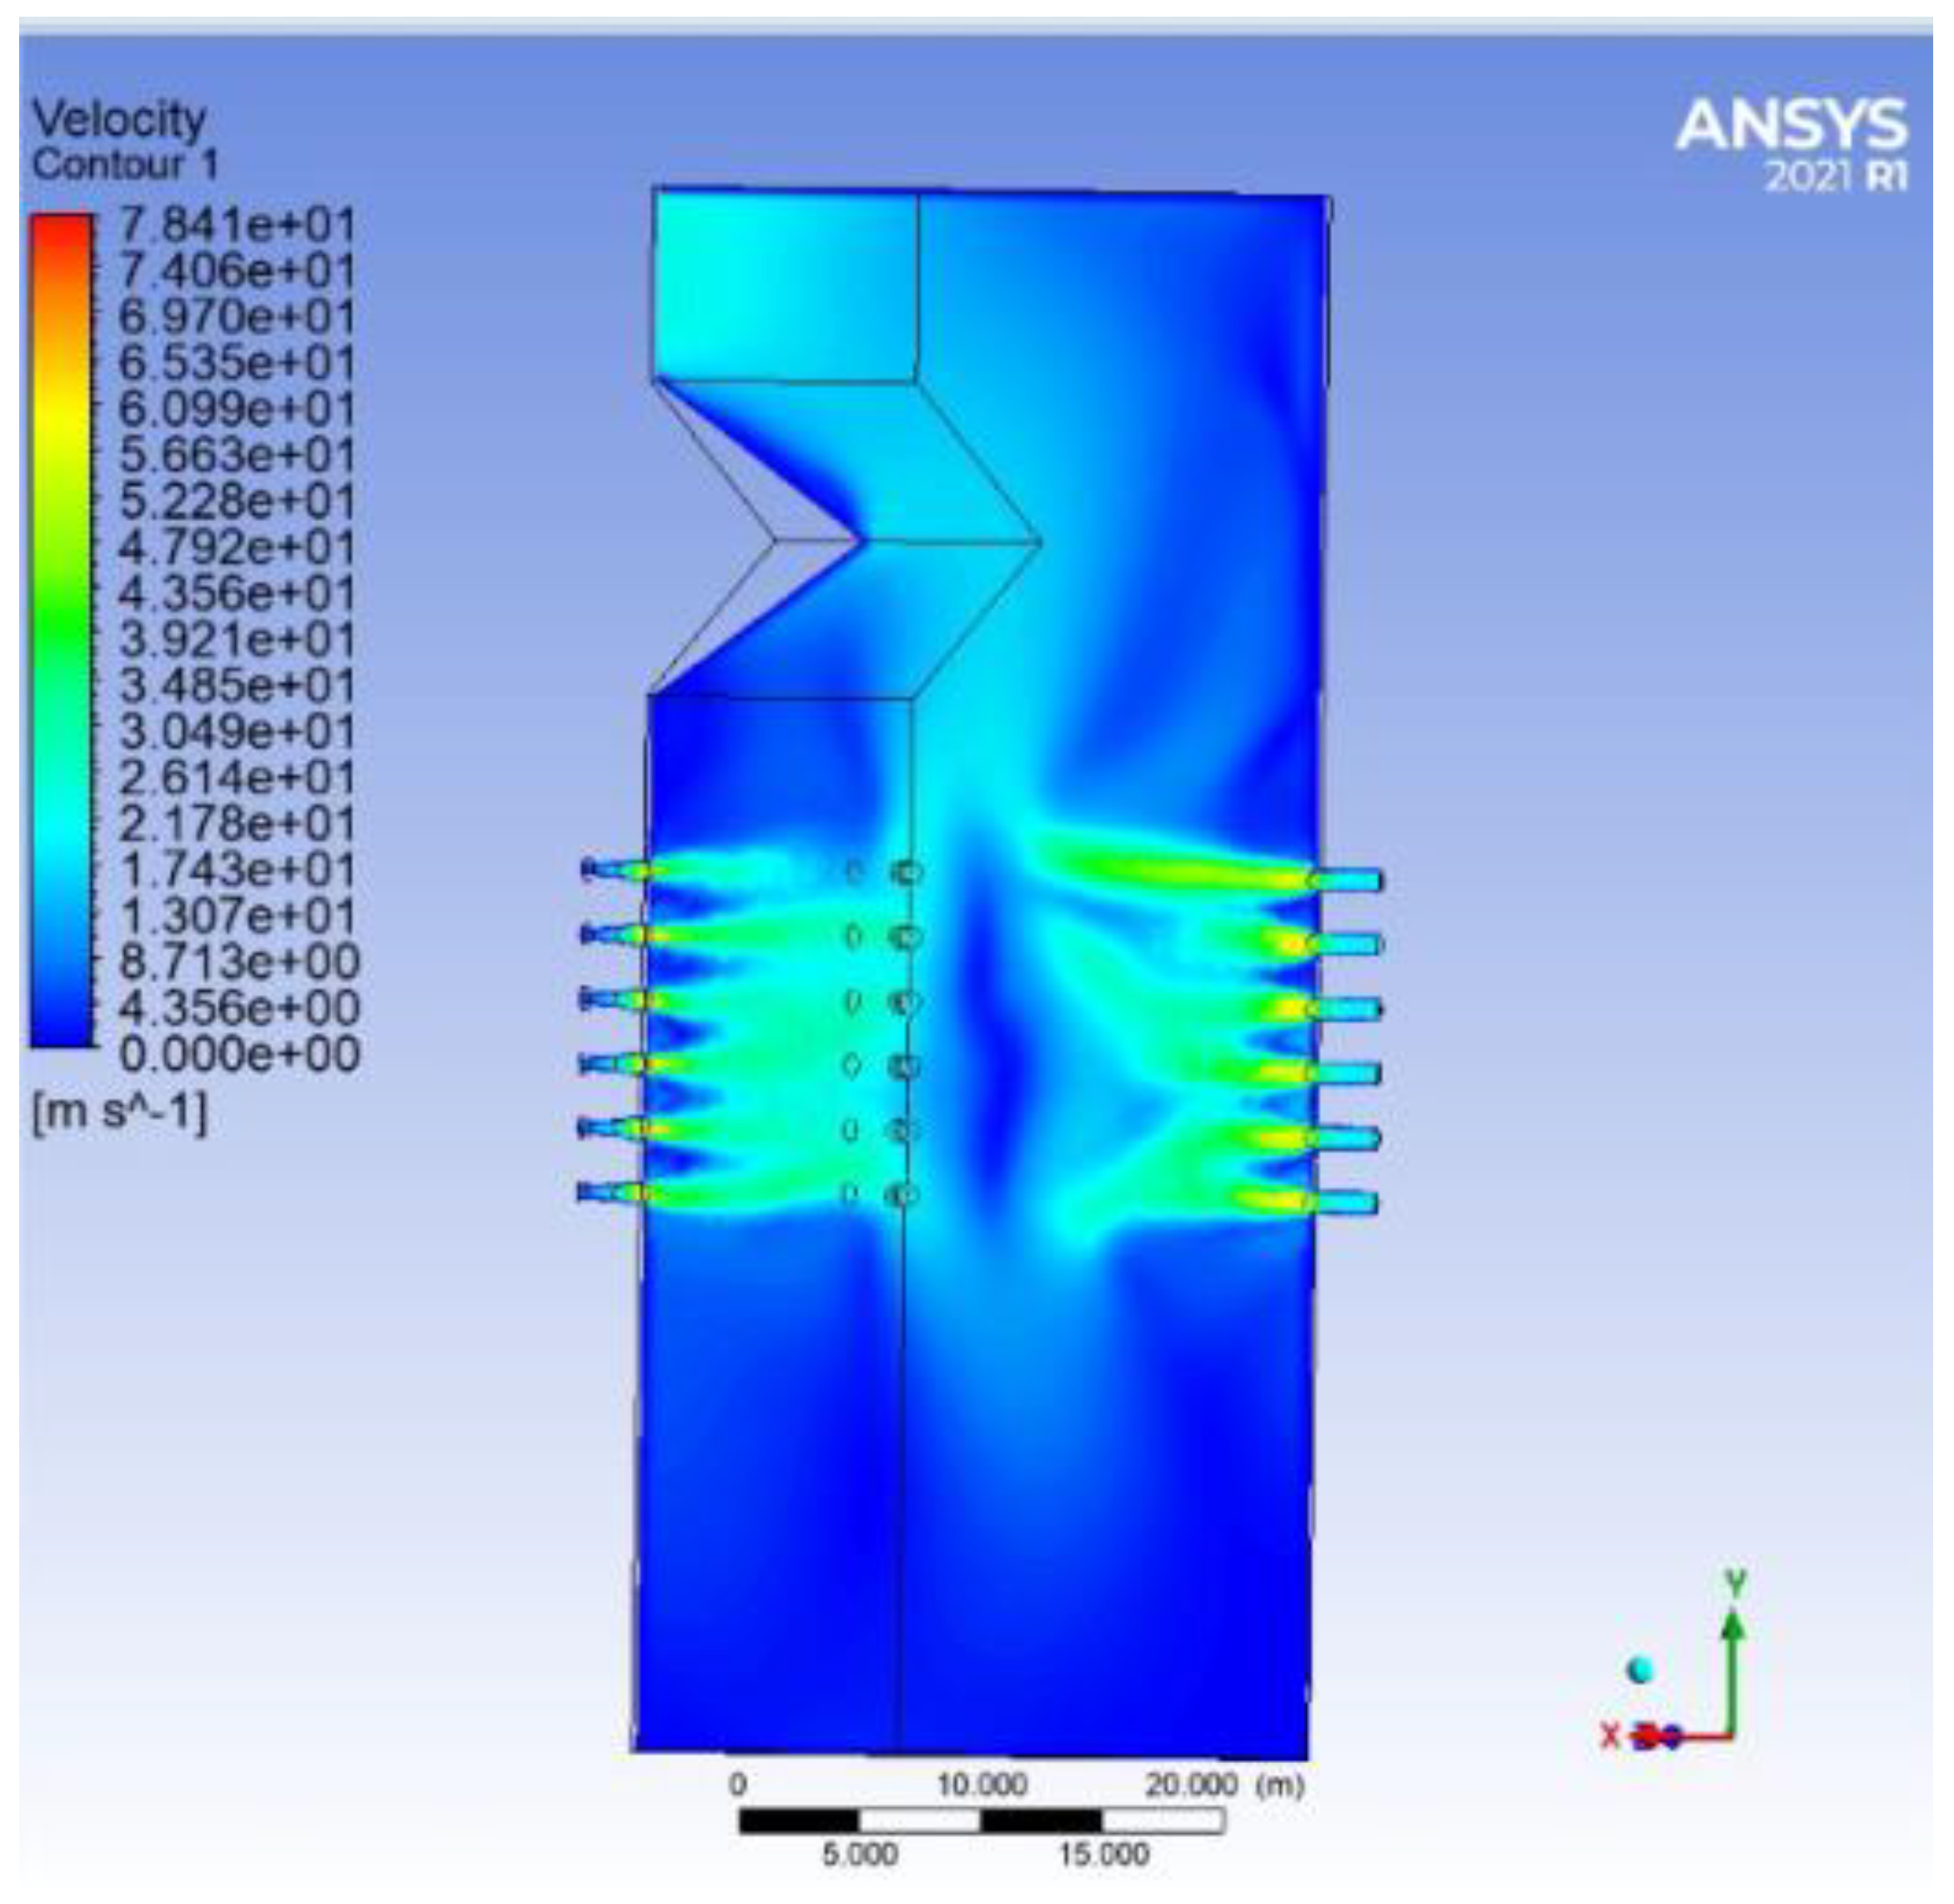
Figure 16 and Figure 17 show the temperature of the furnace exit gas and the distribution of the velocity of case VIII. From case no. VIII, the furnace’s average velocity is 19.75 m/s and the furnace’s average temperature is 1575 K which is lower than the ash melting temperature, no slag formation was observed on tubes of the water wall, reheater, and superheater, another 49 K is further dropping occurred from the firing place to water wall tubes, 1526 K is received by water wall tubes. This condition is less than the temperature of ash melting, the ash does not form any slagging on water wall tubes.

4.5. Cases IX and Case X Observations

Slag formation on water and steam tubes is not observed when Cases IX and X furnace temperatures are kept below 1550 K. The flue gas velocities are more than average values; the heat is carried away by flue gas to the atmosphere. That means generating heat in the furnace until a partial loss happens through the flue gas, i.e., heat is not transferred to the water wall tubes. There is an increase in dry flue gas losses, a decrease in the performance of the boiler, an increase in coal consumption to 376 tonnes from 373 tonnes, and more water spray is needed for the superheater and reheater. Flame stability is reduced due to unequal air disturbance. Table 10 shows the optimized and un-optimized decision variables from the experiment.

5. Genetic Algorithm

This is an optimization problem-solving method based on ordinary selection for both unconstrained and constrained environments. The procedure drives the living evaluation. At every step, it selects individuals to act as parents and uses these parents to generate children for further development. After a successful generation, the optimal solution has been developed. GA could work out different optimization problems unsuitable for standard algorithms, including the non-differential objective function, discontinuous objective function, and nonlinear and non-differentiable.
GA simulation is one of the best global optimization processes. This paper applies to the process of heat transfer optimization and selecting the high-temperature points. It thoroughly studies the slagging layer, developed by two inputs, the temperature and velocity of both PA and SA, and the generated flue gas behaviour.

6. Results and Discussion

6.1. Heat Transfer of Tube from All Cases

Fuel is conveyed from the mill to the furnace via main air conveyance. The PA and SA gases and the coal were burned together in the furnace’s center. The combustion conditions in the boiler’s furnace are depicted in Figure 8 and Figure 9. The tubes of the water wall, the tubes of the superheater, and the tubes of the reheater could all receive heat from the furnace. Some heat is lost through the furnace exit gas while being transferred from the furnace to the water wall. Slag buildup on the water tubes and steam tubes further reduces the heat transmission of the water walls and steam panels. The flue gas temperature, therefore, rises even more as a result.
Case-VIII gives better results than other cases. Combustion inside the furnace averaged 87,513.9 W/m2 of heat released from the furnace with an average temperature at the water wall of 1526 K, which is lower than the ash melting temperature. No slag formation was observed on tubes of the water wall, reheater, or superheater at this condition. From case VI, an average temperature of around 1670 K was generated from the furnace. There is a slag layer of 12.7 cm developed on the water tubes and a slag layer of 1.27 cm developed on the reheater and superheater tubes. Figure 18 shows the soot deposition on water wall tubes. The heat transfer between the furnace and tubes decreases to 5945.876 W/m2 from 87,513.9 W/m2 due to heat transfer further restricted by the slag layer. From case VII, a 1632 K average temperature was generated from the furnace. A slag layer of 7.62 cm developed on the water tubes and a slag layer of 0.762 cm developed on the reheater and superheater tubes. The heat transfer between the furnace and tubes decreases to 7743.76 W/m2 from 87,513.9 W/m2 due to heat transfer further restricted by the slag layer. Figure 19 shows the different cases of heat transfer from the middle of the furnace to the water/steam tubes. These values are obtained through CFD analysis, as there are nomeasurement devices available in the power plant.

6.2. Optimum Temperature Case Acted on Water Tube

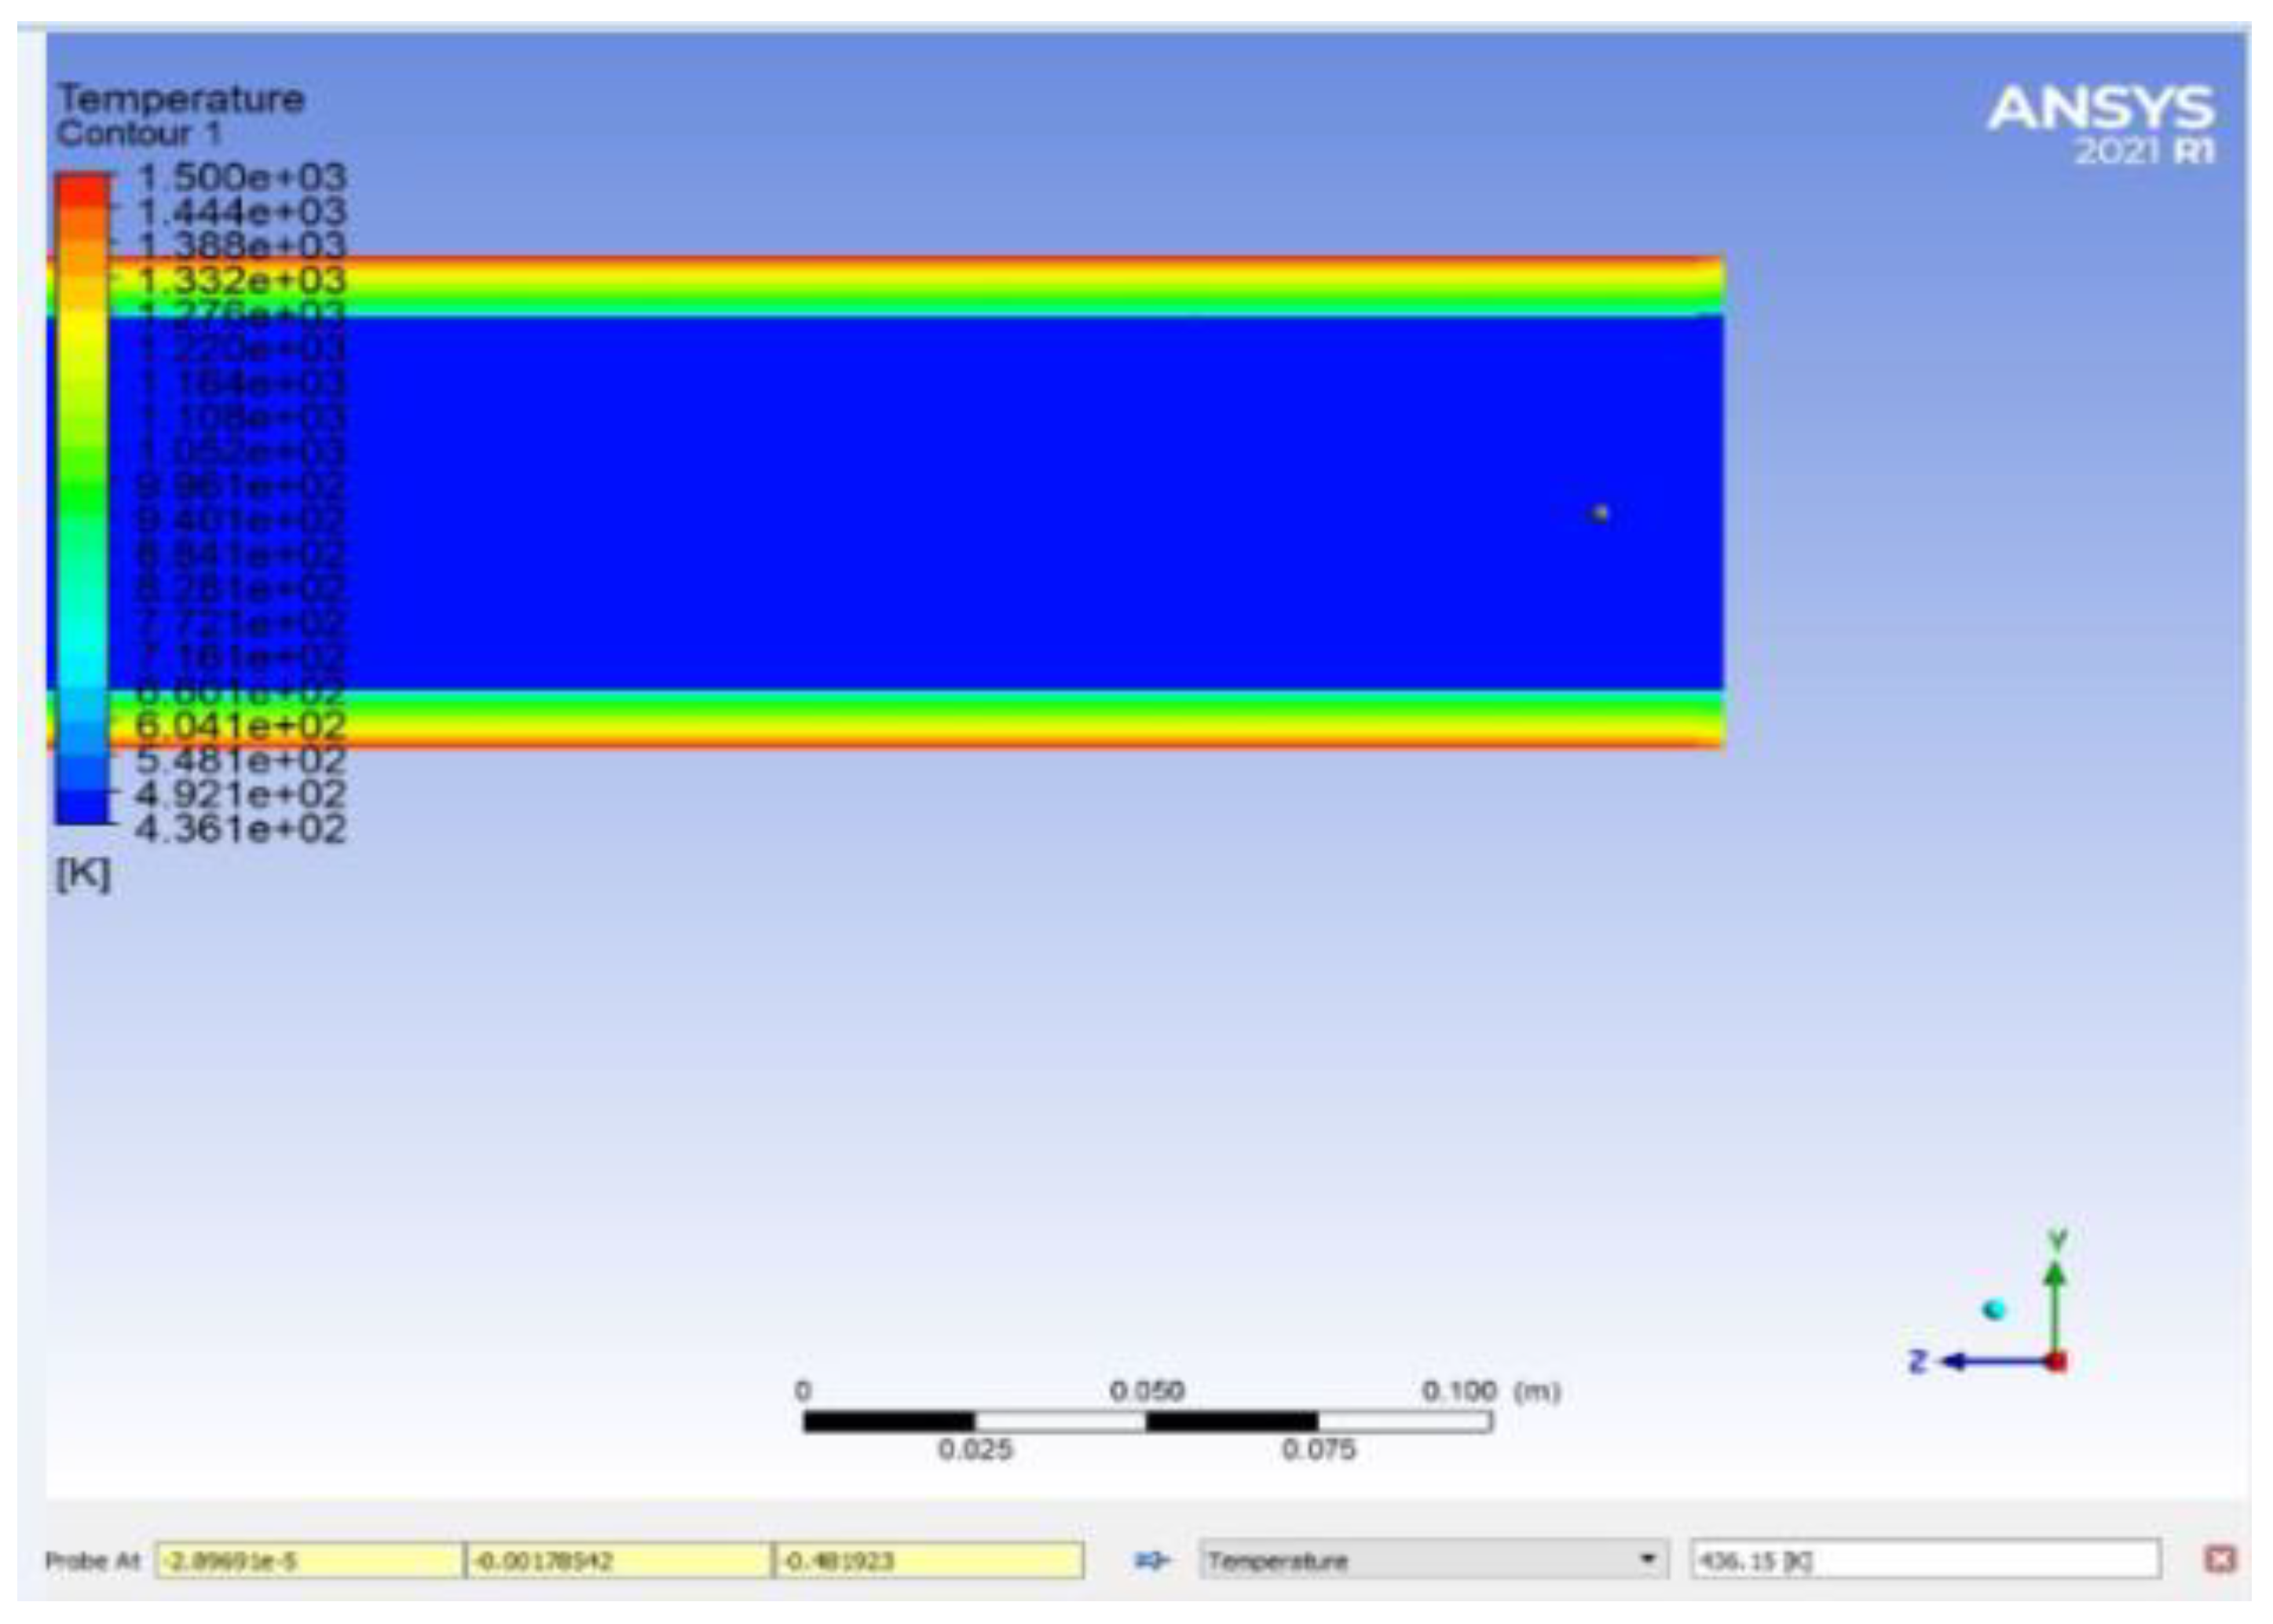
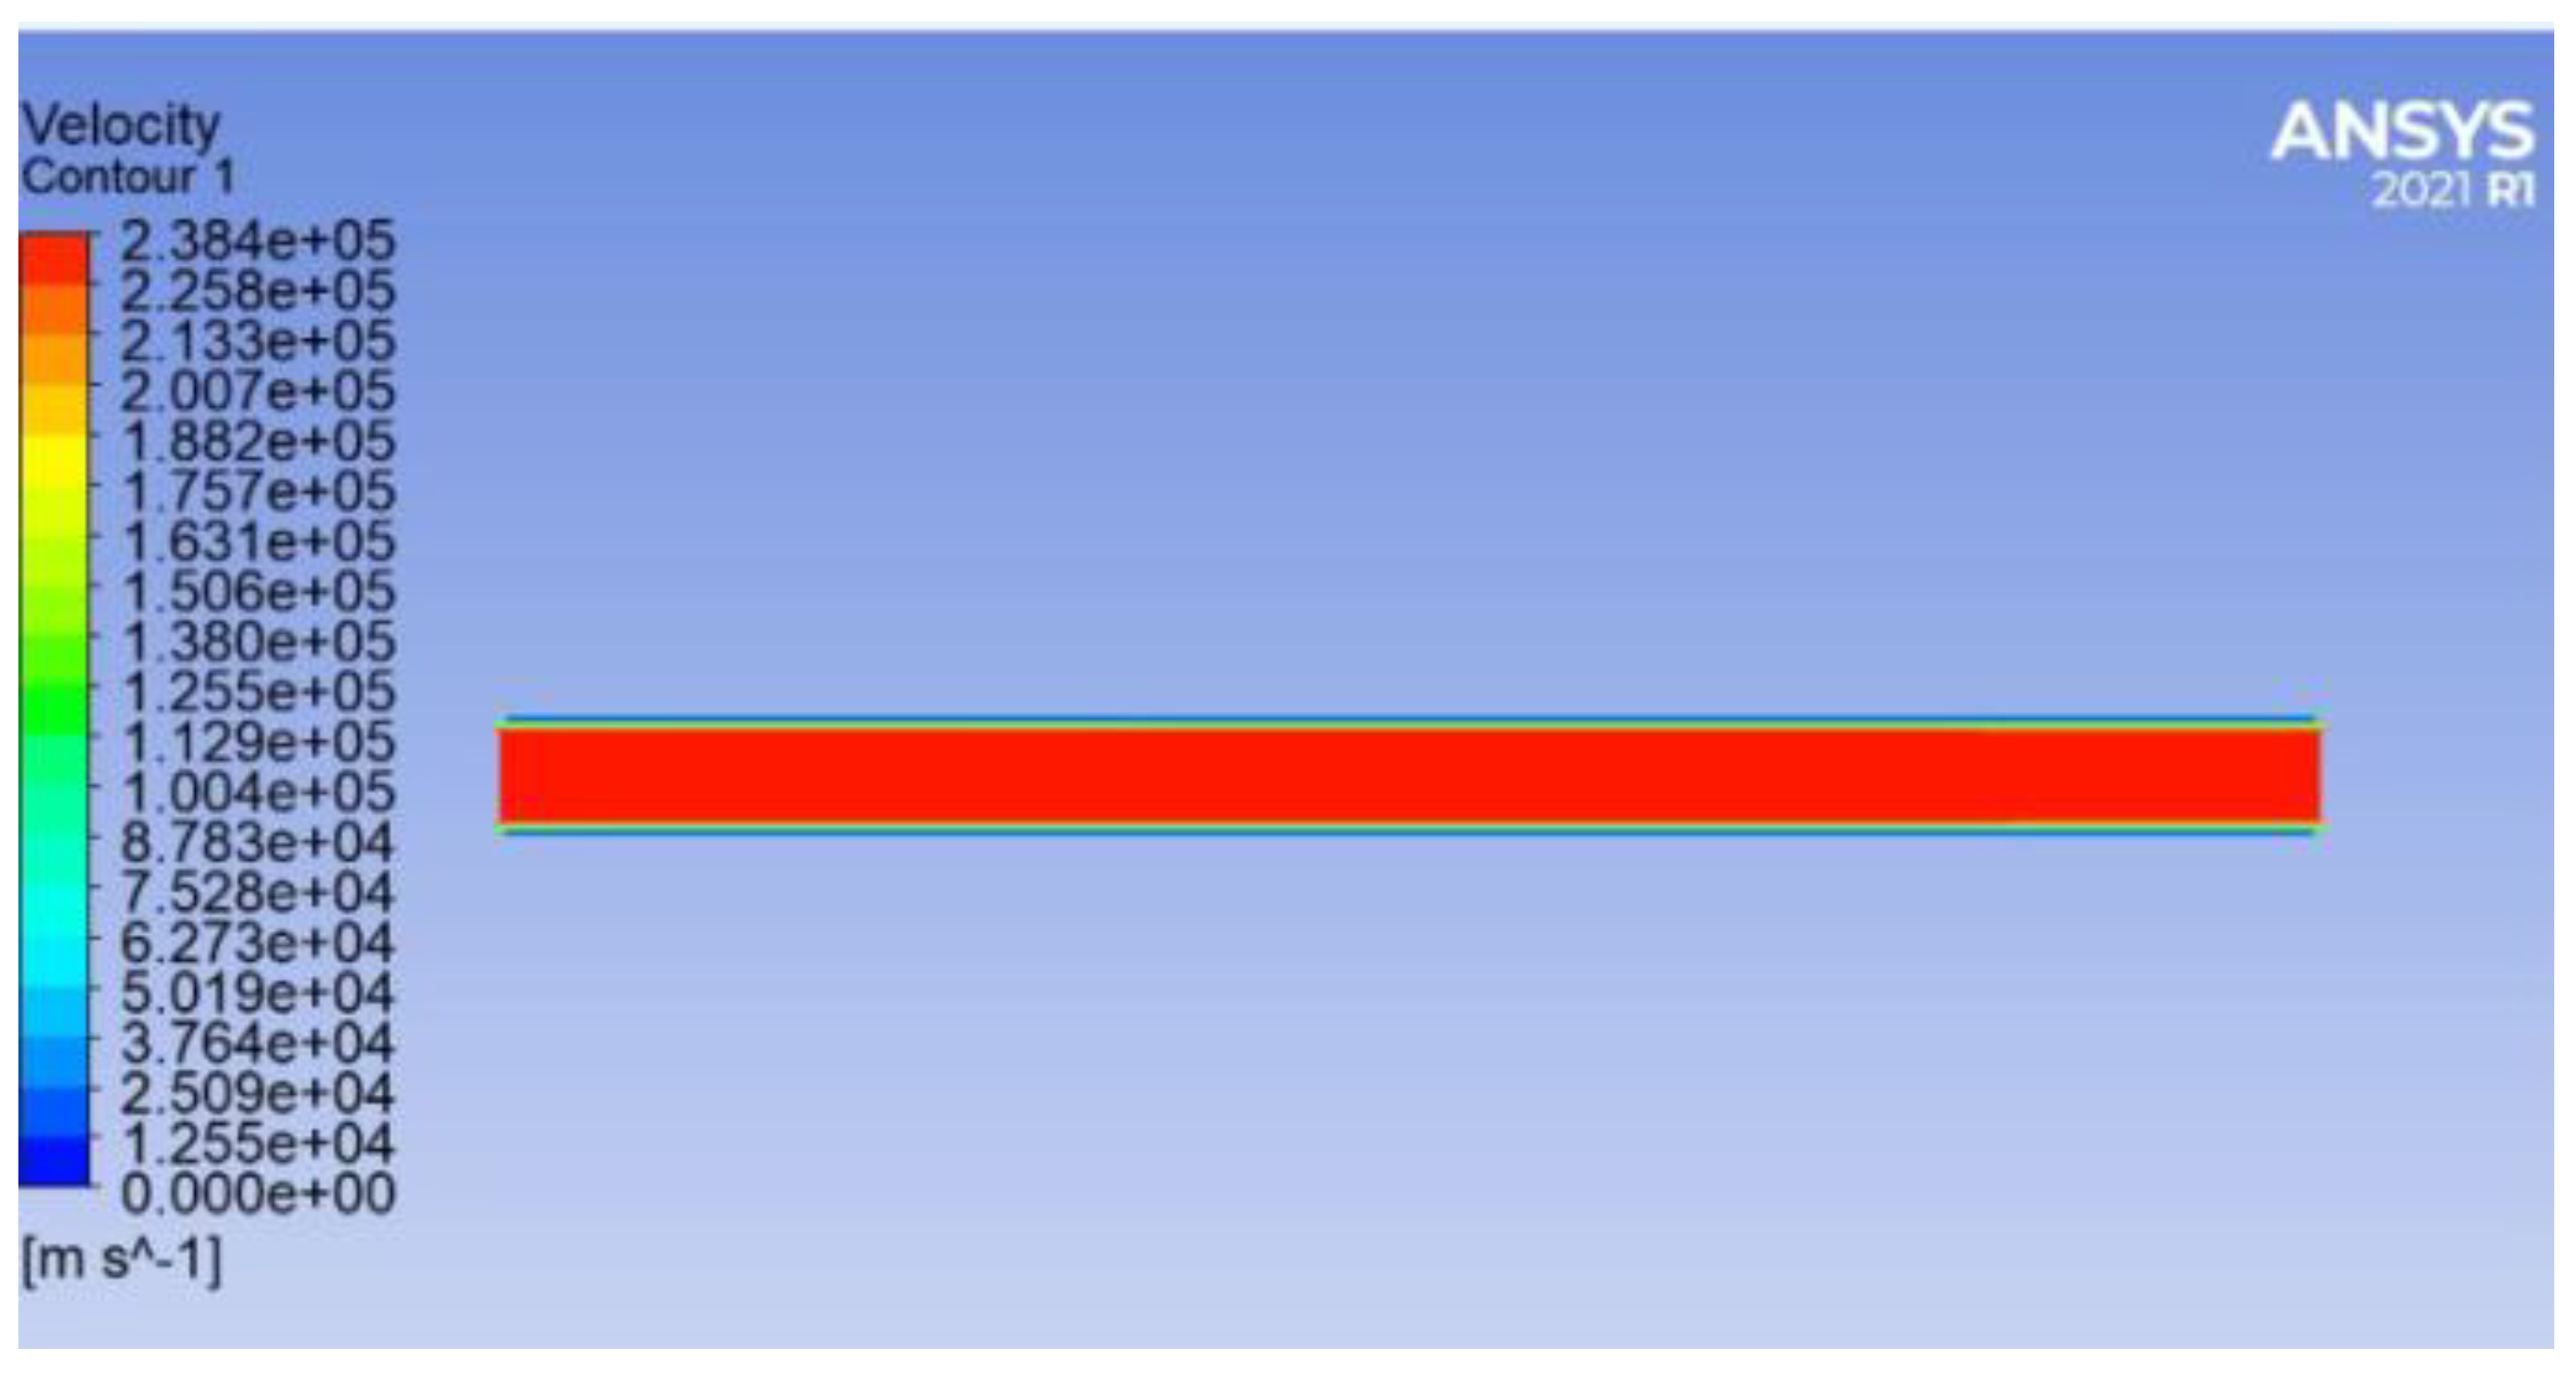
After going through all the cases, Case VIII gave high heat transfer from CFD analysis, and the result data also matched with the plant operation data. In case VIII, 1575 K of temperature is generated from the furnace by the combustion of fuel with a velocity of PA of 20 m/s and a velocity of SA of 35 m/s. The generated heat is further transferred from the middle of the furnace to the water wall panel by the radiation mode of heat transfer. While heat transfers from the middle of the furnace to the water wall panel, 49 K of temperature is lost by being taken out by the furnace exit gas at a velocity of 19.75 m/s. Finally, the water wall panels received 1526 K of temperature. Figure 20 and Figure 21 show the temperature and velocity distribution of the furnace exit gas from one tube. When striking the flue gas on a water wall panel, the flue gas temperature drops from 1526 K to 1463 K. At the same time, the flowing medium could observe the tube’s outer temperature and raise the medium’s temperature by convection and conduction modes of heat transfer. The tube’s temperature rises from 436 K to 493 K at that instant.

6.3. Various Boiler Losses from All Cases

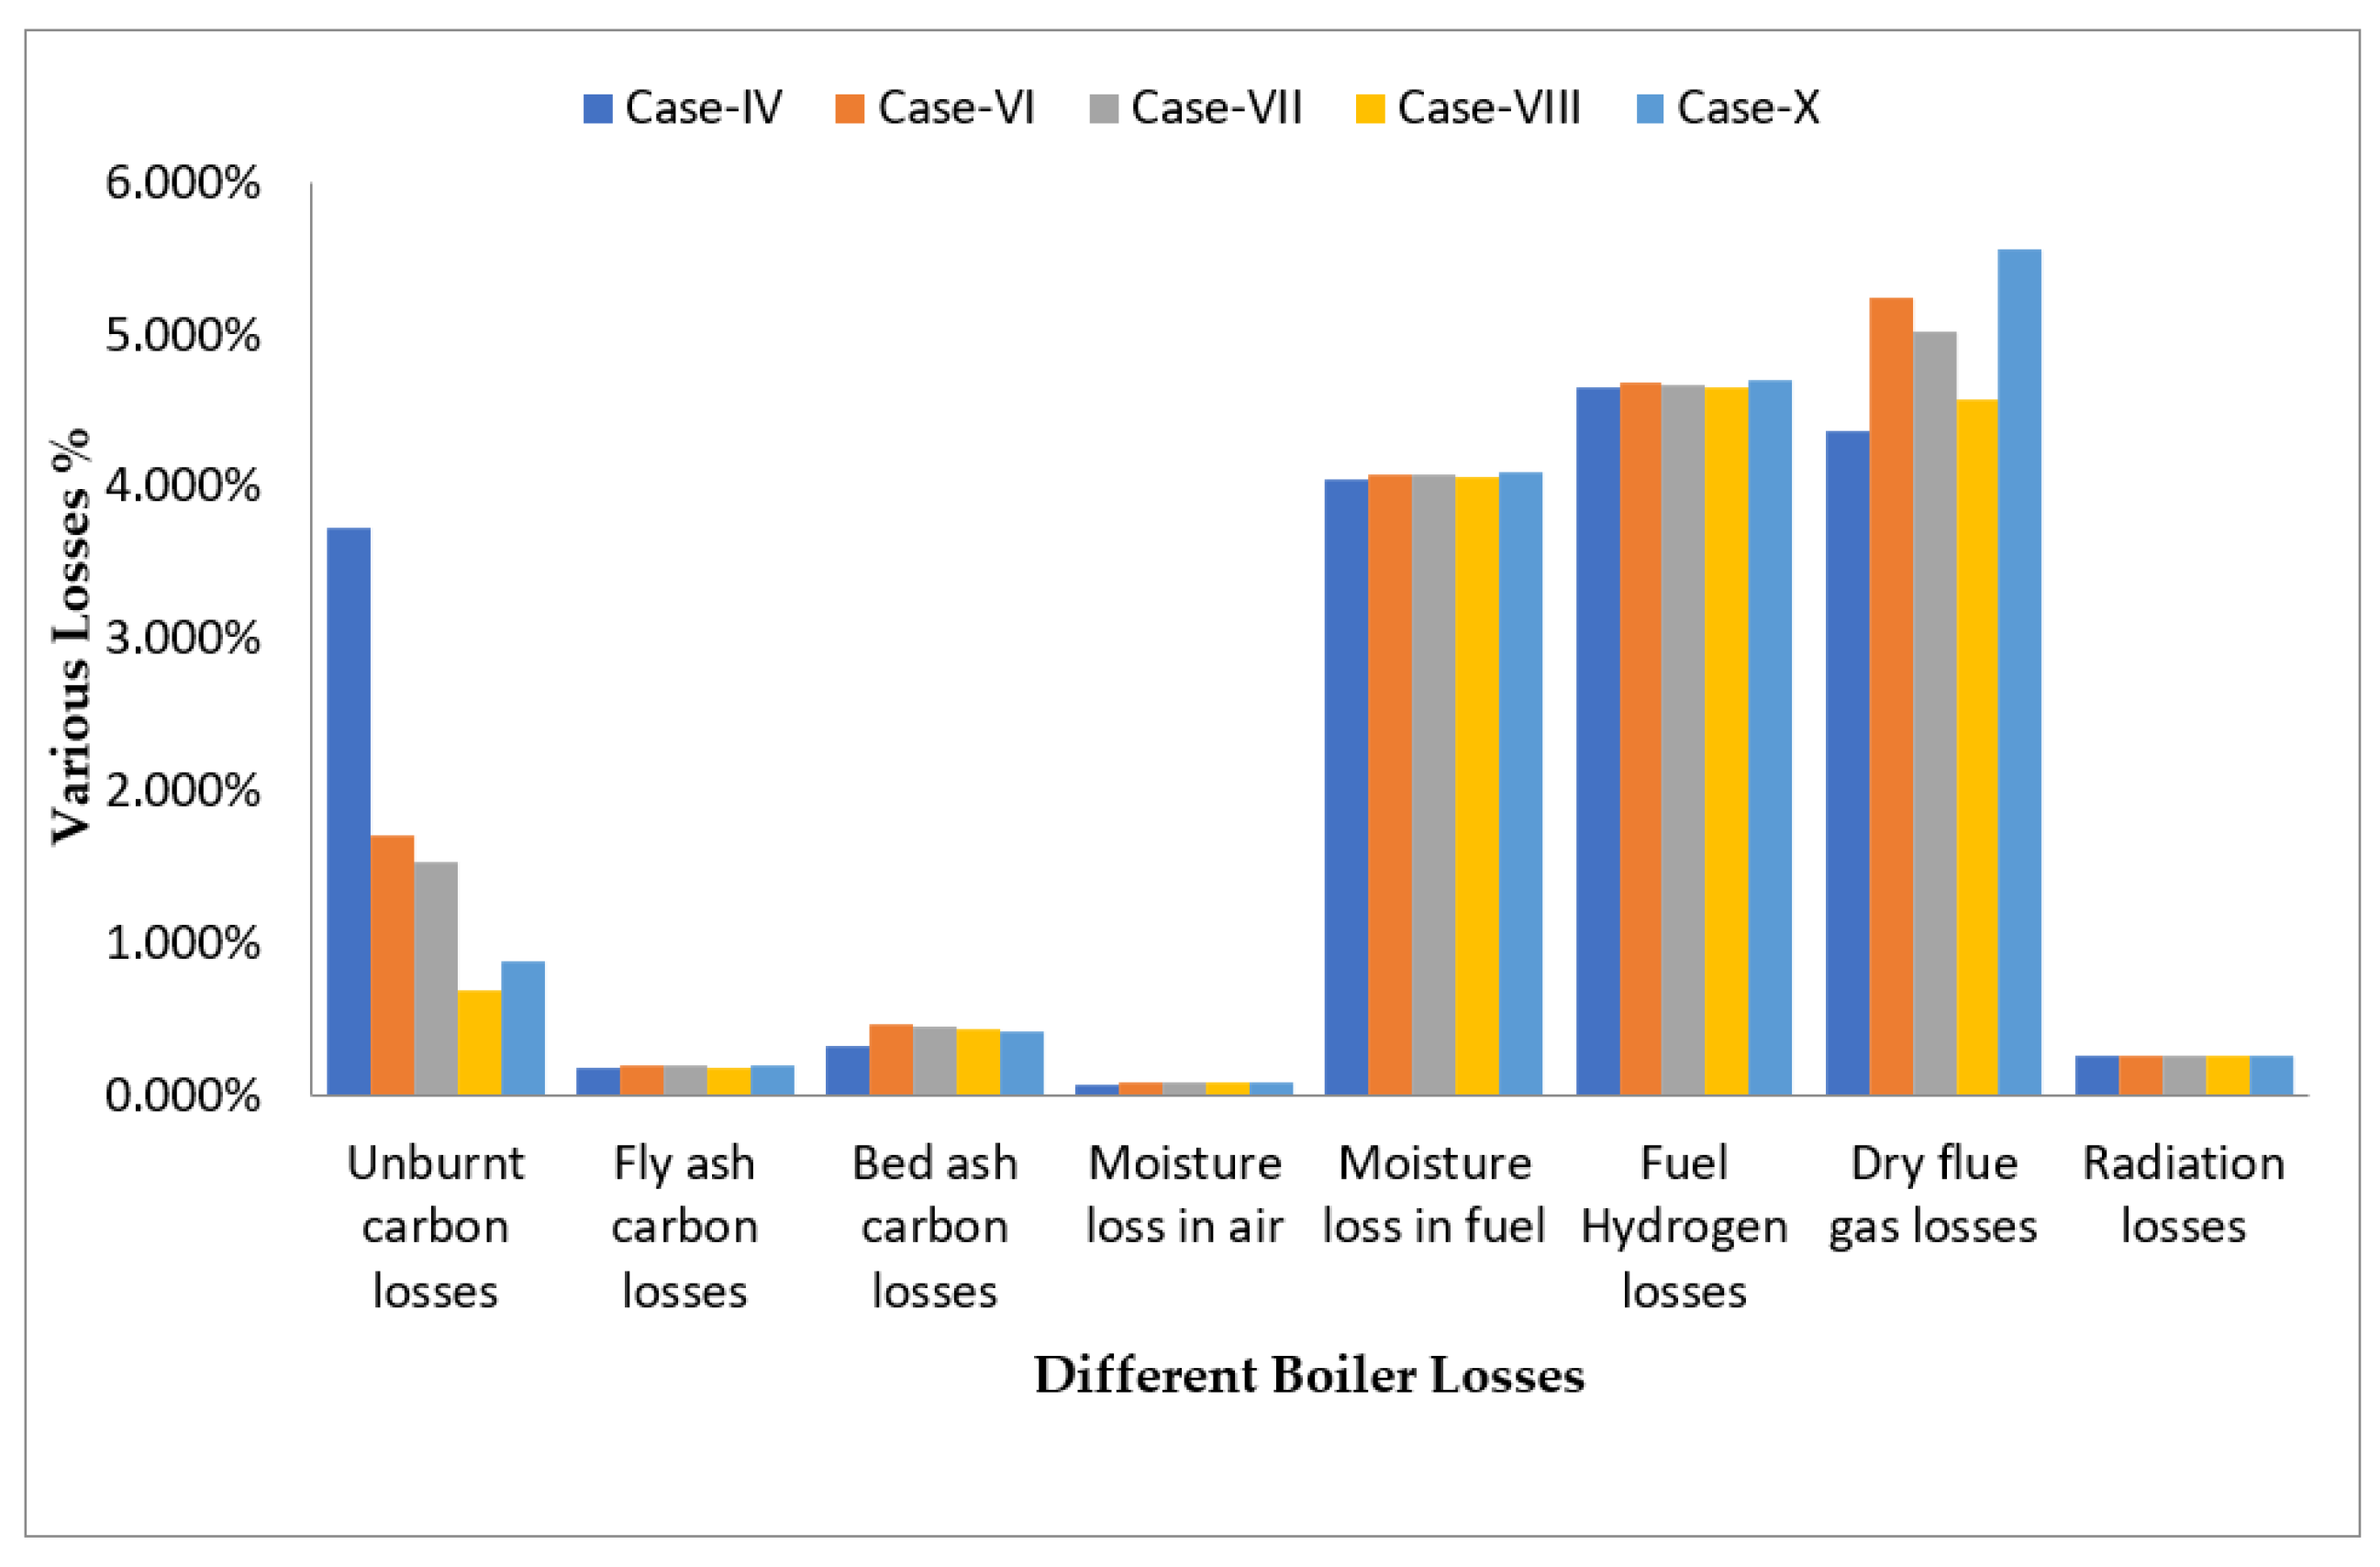
  • From all ten cases, fewer losses come from case-VIII (i.e.,) 14.895% than case-VI: 16.674% and Case-X: 16.154%.
  • Un-burnt carbon losses are high in case-IV (i.e.,) 3.728% than in other cases due to insufficient air (i.e.,) 16.667%, a lot of carbon wastage by fly ash and bed ash. This carbon does not participate in the combustion inside the boiler; it is a simple escape from the furnace by bed ash and fly ash.
  • Dry flue gas losses are high in Case-X (i.e.,) 5.555% followed by case-VI: 5.232% and case-VII: 5.016%. From Case-X lot of excess air 30.45% used for the combustion. From case-VI and VII slag layer observed on the tubes of the water wall, superheater, and reheater, the heat does not transfer from the furnace to the tubes completely, it escapes from the furnace to the atmosphere through the chimney. Figure 22 shows the case wise heat losses from the boiler. According to those results, boiler performances have been analyzed.
  • From all ten cases, case-VIII gives the maximum efficiency (i.e.,) 85.104% than case-VI: 83.326% and case-VII: 83.746% due to no slagging formed on the tubes of the water wall and steam wall. The maximum heat is going to be transferred from the middle of the furnace to the tubes with less dry flue gas losses.

6.4. Integrating GA from Python with CFD to Optimize Boiler Combustion Heat Transfer Process

Generally, the instrumentation PID controller pertains to the combustion process inside the boiler. On the other hand, this proportional integral derivative does not give good results due to continuous combustion changes happening in the boiler, such as slag deposits on the tubes of the water wall, superheater, and reheater due to parameter variations s coal size, primary airflow, secondary air flow, coal quality, etc. These continuous changes inside the boiler are not accurately identified by the instrumentation PID controllers. This paper recommends a method for integrating CFD with GA to optimize the coal burning process. By joining CFD with GA, the developed method could eliminate slag formation on the tubes of the water wall, superheater, and reheater.
The developed model is shown in Figure 23, which combines GA with CFD. The simulation results obtained through CFD are compared with GA having setting value in the controller. There is a program built into the controller which has a slag set point. The controller checks the result with a slag set point and delivers the result. The danger signal is given to avoid the slag built up on water and steam tubes. Hence, the combination of CFD with GA could effectively optimize the instrumentation-based PID controller. The controller sends information about controlling ‘u’ to the combustion process. After combustion, the outputs ‘x’ and ‘y’ come out of the combustion process. The CFD simulation obtains further for the input parameters ‘u’, ‘x’, and ‘y’ from the process. This developed module not only simulates the combustion process but also simulates microscopic parameters such as heat transfer and slag build-up due to heavier losses from these parameters inside the boiler. With the optimized value of ‘u’ sent to the CFD module, the controller could achieve improved heat transfer efficiency and reduce slag build-up.
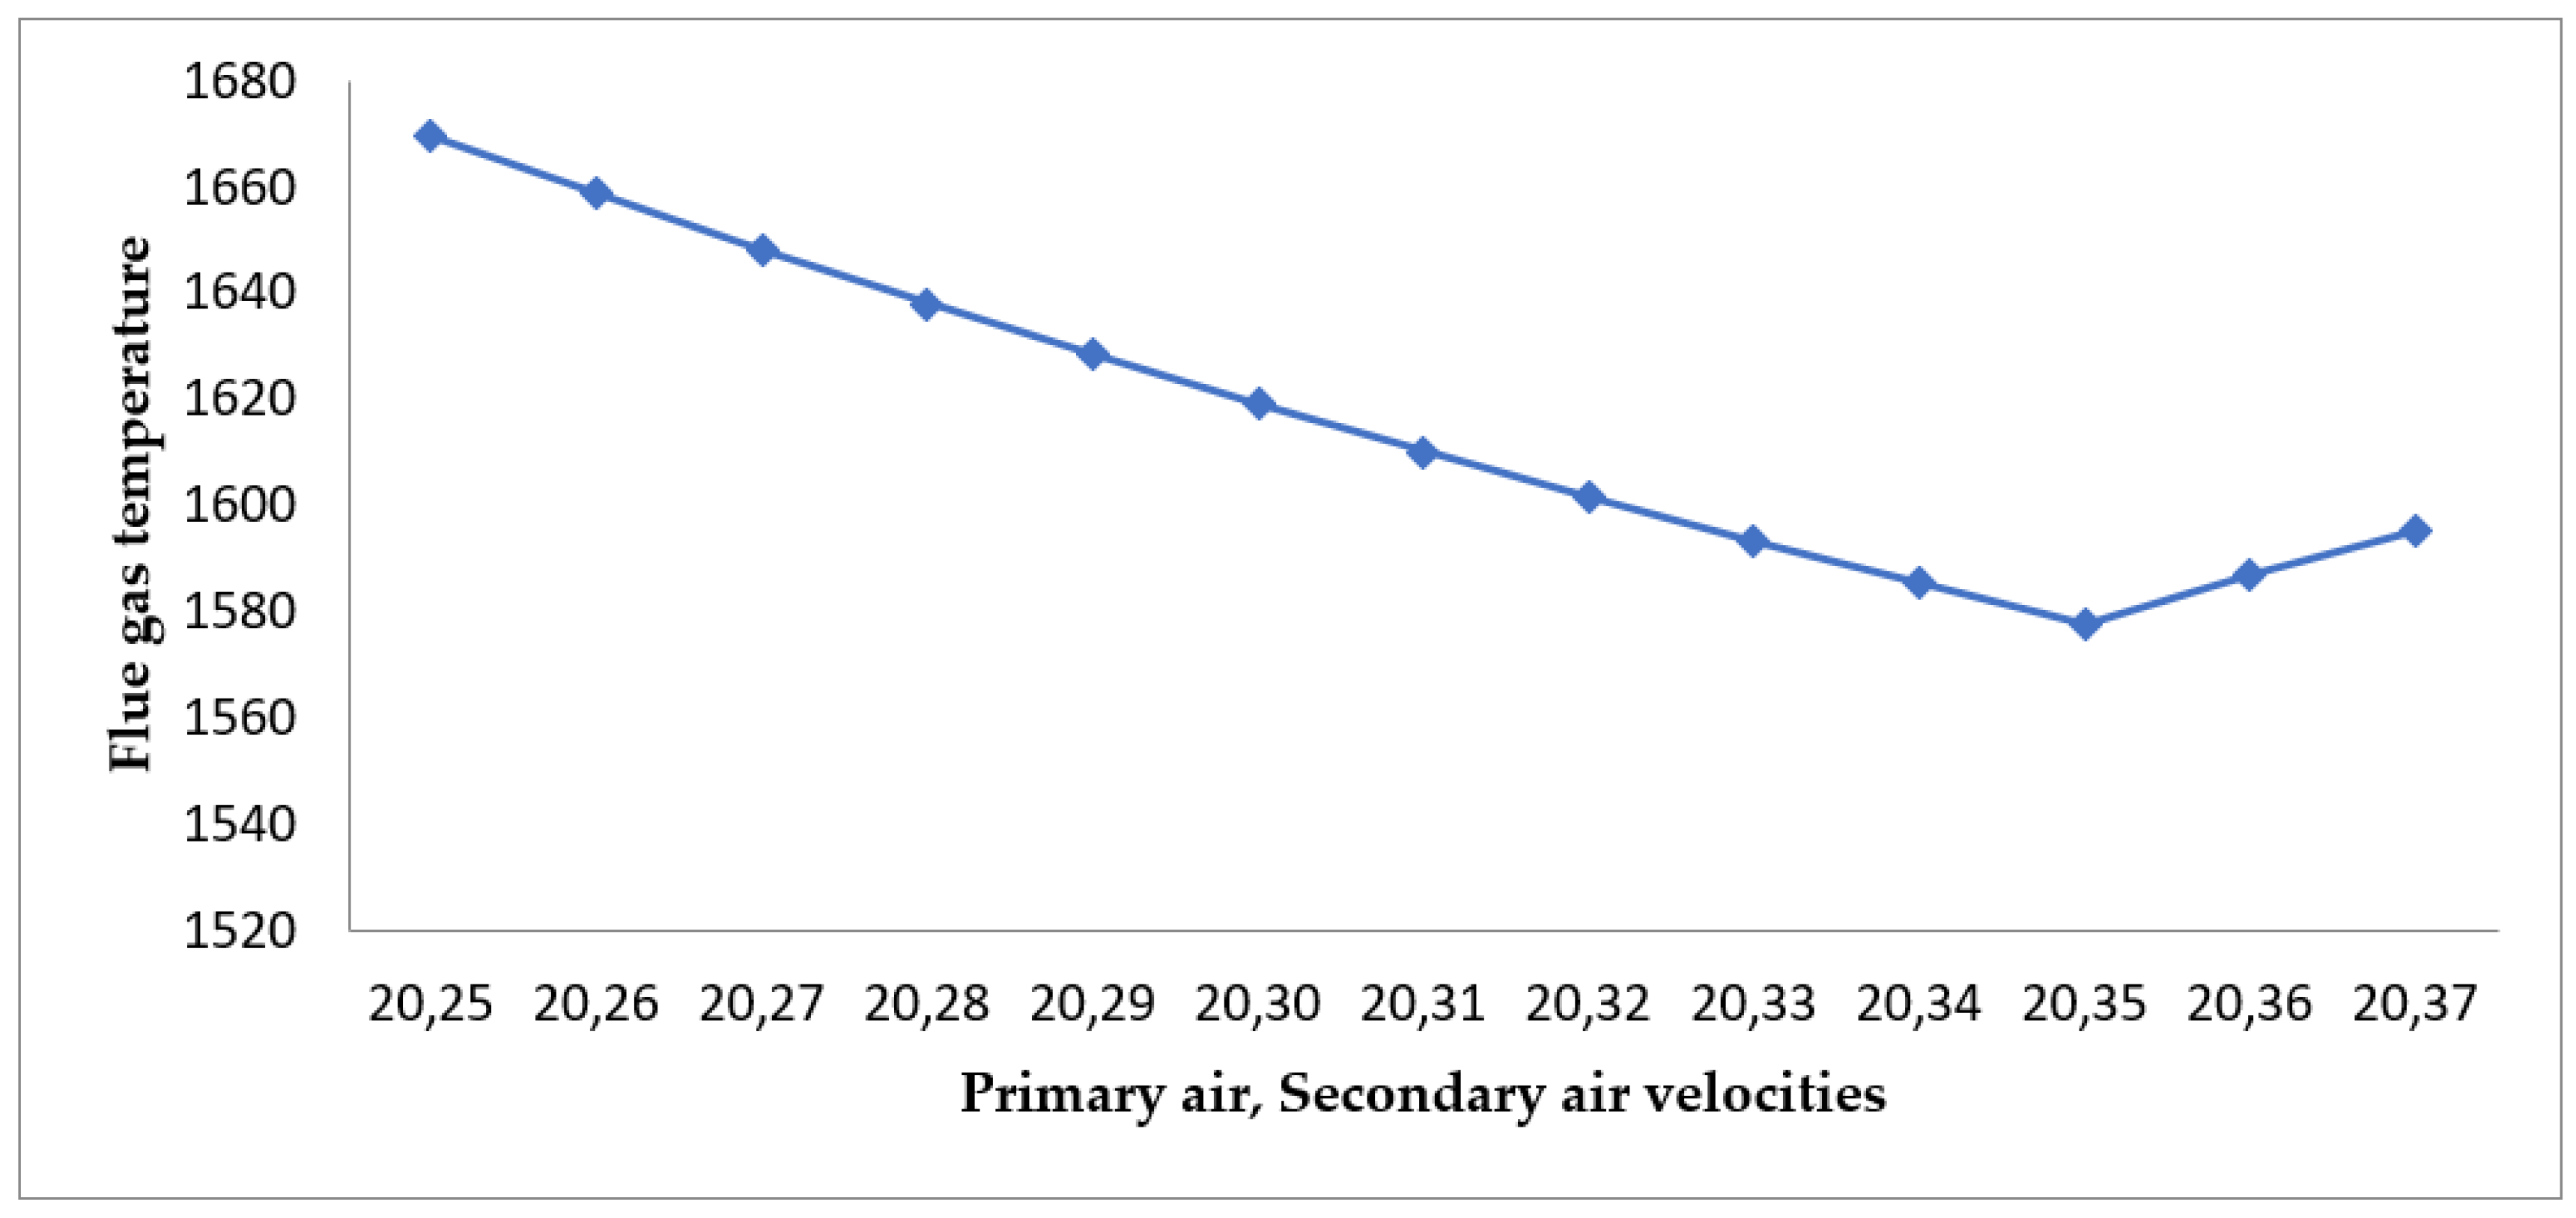
Here, GA is generated using Python language, the detailed step-wise algorithm given in Table 11. Figure 24 indicates the results obtained through the genetic algorithm. Hence, in the present work, results obtained through CFD and GA are compared and analysed. In the GA analysis, too, the same input parameter ranges that are used in CFD analysis are considered, i.e., PA: 15–35 m/s and SA: 20–45 m/s given to the GA. The optimum output received from the GA is 1578 K i.e., 1305 °C is generated in the furnace middle. The slight heat is taken away by flue gas when it transfers from the middle of the furnace to the water wall tubes.
From all cases, case-VIII gives the optimized combustion temperature from the furnace, and the same was confirmed with CFD analysis, 1575 K/1302 °C of optimized furnace temperature was obtained with a flue gas velocity of 19.75 m/s from the inputs PA velocity of 20 m/s and SA velocity of 35 m/s. There is a heat transfer of 85,513.9 W/m2 with no slag formation observed at this condition. A further GA module has been developed in Python and integrated with CFD analysis. The output values of all cases from the CFD analysis have been processed through the GA, and the output obtained from the GA is 1578 K/1305 K. Table 12 compares optimization results with un-optimized physical running plant data for knowing the plant conditions. Later the obtained results are compared with the physical plant data of primary air at 20 m/s and secondary air at 35 m/s. Table 13 compares the CFD + GA analysis results physical plant data, and the results are validated. The results were almost matched with the analytical results. The plant’s physical condition reduced the boiler losses due to slag formation. The physical plant results data is not presented in this paper due to confidential company policies.

7. Conclusions

Power plant efficiency is majorly dependent on boiler combustion. The combustion process optimization of the boiler is important to improve the efficiency of the power plant and decrease various emissions. However, because data has yet to be found to train ANN, the Artificial Neural Network strategy is not suitable for improving combustion efficiency and reducing different emissions due to slag build-up on tubes. This research has developed an appropriate method of integrating CFD with GA to improve the combustion process by increasing the heat transfer rate to 87,513.9 W/m2 to the tubes of water, reheater, and superheater and avoiding slag buildup on the surface of the tubes. The developed method could optimize the flue gas temperature fields inside the furnace by adjusting the velocity and temperature of both PA and SA. Restricting the temperature in the boiler furnace within ash melting temperature (i.e., 1575 K) could successfully reduce/avoid slag deposition and improve thermal power plant efficiency by improving boiler efficiency from 83.326% to 85.104%.

Author Contributions

Conceptualization, G.N.K. and E.G.; methodology, G.N.K. and E.G.; investigation, G.N.K.; writing—original draft preparation, G.N.K.; writing—review and editing, G.N.K. and E.G. All authors have read and agreed to the published version of the manuscript.

Funding

This research received external funding from the School of Mechanical Engineering (SMEC), Vellore Institute of Technology (VIT), Vellore, India.

Data Availability Statement

The data presented in this study are available on request from the corresponding author. The data are not publicly available due to the company’s confidential policy.

Conflicts of Interest

The authors declare no conflict of interest.

Nomenclature

Abbreviations
CO2Carbon dioxide
COCarbon monoxide
NOXNitrogen oxide
SOXSulfur oxide
SO2Sulfur dioxide
NO2Nitrogen dioxide
SPMSuspended particulate matter
MWMegawatt
GCVGross calorific value
COCarbon Monoxide
MCRMaximum continuous rating
SOFASecondary over-fire air damper
ANNArtificial neural network
GAGenetic Algorithm
NSGANon-sorting genetic algorithm
CFDComputational fluid dynamics
AIArtificial intelligence
MCRMaximum Continuous Rating
SOFASecondary over fire air
FSRFull superheated region
GCIGrid convergence index
CFBCCirculation fluidized bed combustion
LPTLow-pressure turbine
HPHigh pressure
LPLow pressure
CRHCold reheat steam
HRHHot reheat steam
PAPrimary air
SASecondary air
VMVolatile Matter
3DThree dimensional
Acronyms
mFlow rate of Mass, (kg/s)
%Percentage
W/m2Watt per square meter
°CDegree centigrade
m/sMeter per second
mmMillimeter
kg/m3Kilogram per cubic meter
N/m2Newton per square meter
KKelvin
Kcal/kgKilo calories per kg
dDiameter
VPAVelocity of Primary air
VSAVelocity of Secondary air
VMVolatile matter
PCPulverized coal
Kj/kgKilo Joules per kg
Kg/s Kilogram per second
W/m-kWatt per meter Kelvin
J/sJoule per second
cmCentimeter
uInput signal to the combustion chamber
xySignal from the combustion chamber

References

  1. Bureau of Energy Efficiency. Fuels and Combustion. In Book no. 2: Energy Efficiency in Thermal Utilities; Bureau of Energy Efficiency: New Delhi, India, 2003; pp. 6–12. [Google Scholar]
  2. Wang, X.; Wang, M.; Wei, Y. Simulation study on data of coal fired power plant boiler experiment with cold state. Energy Res. Util. 2007, 4, 58. [Google Scholar]
  3. Dowling, A.W.; Eason, J.P.; Ma, J.; Miller, D.C.; Biegler, L.T. Coal oxycombustion power plant optimization using first principles and surrogate boiler models. Energy Procedia 2014, 63, 352–361. [Google Scholar] [CrossRef] [Green Version]
  4. Zhou, A.; Xu, H.; Meng, X.; Yang, W.; Sun, R. Development of a numerical model for co-combustion of the blended solidwaste fuel in the grate boiler. Chem. Eng. J. 2021, 405, 126604. [Google Scholar] [CrossRef]
  5. Niu, Y.; Kang, J.; Li, F.; Ge, W.; Zhou, G. Case-based reasoning based on grey-relational theory for the optimization of boiler combustion systems. ISA Trans. 2020, 103, 166–176. [Google Scholar] [CrossRef]
  6. Tritippayanon, R.; Piemjaiswang, R.; Piumsomboon, P.; Chalermsinsuwan, B. CFD of sulfur dioxide and carbon dioxide capture using mixed feeding of calcium carbonate/calcium oxide in an industrial scale circulating fluidized bed boiler. Appl. Energy 2019, 250, 493–502. [Google Scholar] [CrossRef]
  7. Rahat, A.A.M.; Wang, C.; Everson, R.M.; Fieldsend, J.E. Data-driven multi-objective optimization of coal-fired boiler combustion systems. Appl. Energy 2018, 229, 446–458. [Google Scholar] [CrossRef] [Green Version]
  8. Mousavi, S.M.; Fatehi, H.; Xu, S.-B. Numerical study of the combustion and application of SNCR for NOx reduction in a lab-scale biomass boiler. Fuel 2021, 293, 120154. [Google Scholar] [CrossRef]
  9. Ma, L.; Yu, S.; Fang, Q.; Zhang, C.; Chen, G. Effect of separated over-fire air angle on combustion and NOx emissions in a down-fired utility boiler with a novel combustion system. Process Saf. Environ. Prot. 2020, 138, 57–66. [Google Scholar] [CrossRef]
  10. Pei, J.; Wang, H.; You, C. Optimization of staged combustion in a 600 MWe tangentially fired boiler with wall air injection. Fuel 2020, 275, 117951. [Google Scholar] [CrossRef]
  11. Masoumi, H.; Abroshan, H. Numerical Investigation of Burner Angles Effect on the Combustion Phenomenon in a Selected Power Plant Boiler; Niroo Research Institute, Power Plant Operation Systems: Kerman, Iran, 2012. [Google Scholar]
  12. Suksam, N.; Charoensuk, J. Development of pulverized biomass combustion for industrial boiler: A study on bluff body effect. BioResources 2019, 14, 6146–6167. [Google Scholar]
  13. Modaresi, M. Simulation of Effect of Operating Parameters of Furnace and Environmental Parameters on Gas Carburization. Ph.D. Thesis, Mashhad Ferdowsi University, Mashhad, Iran, 2010. [Google Scholar]
  14. Kumar, N.G.; Gundabattini, E. Enhancing the energy efficiency of a supercritical thermal power plant through improved plant load factor, and optimized performance of auxiliary equipment. Int. J. Des. Nat. Ecodyna 2022, 17, 177–187. [Google Scholar]
  15. Hao, Z.; Kefa, C.; Jianbo, M. Combining neural network and genetic algorithms to optimize low nox pulverized coal combustion. Fuel 2001, 80, 2163–2169. [Google Scholar] [CrossRef]
  16. Li, K.; Thompson, S.; Wieringa, P.A.; Peng, J.; Duan, G.R. Neural networks and genetic algorithms could support human supervisory control to reduce fossil fuel power plant emissions. Cogn. Technol. Work 2003, 5, 107–126. [Google Scholar] [CrossRef]
  17. Kumar, G.N.; Gundabattini, E. Effects of excess air and coal sulfur content in performance improvement of 660 MW supercritical boilers in terms of acid dew point temperature. Int. J. Energy A Clean Environ. 2022, 24, 41–62. [Google Scholar]
  18. US Department of Energy. Power Plant Optimization Demonstration Projects, Clean Coal Technology; Department of Energy: Washington, DC, USA, 2007; pp. 6–7. Available online: http://www.netl.doe.gov/technologies/coalpower/cctc/topicalreports/pdfs/topical25.pdf (accessed on 1 July 2011).
  19. Naveen Kumar, G.; Gundabattini, E. Optimization and Analysis of Design Parameters, Excess Air Ratio, and Coal Consumption in the Supercritical 660 MW Power Plant Performance using Artificial Neural Network. J. Inst. Eng. Ser. C 2022, 103, 445–457. [Google Scholar] [CrossRef]
  20. Murugan, P.; Kannan, S.; Baskar, S. Application of NSGA-II algorithm to single objective transmission constrained generation expansion. IEEE Trans. Power Syst. 2009, 24, 1790–1796. [Google Scholar] [CrossRef]
  21. Meng, X.; Ni, J. Research of Active Vibration Control Optimal Disposition Based on MIGA and NSGA-II. In Proceedings of the 6th International Conference on Natural Computation, Yantai, China, 10–12 August 2010. [Google Scholar]
  22. Liu, X.; Bansal, R.C. Integrating multi-objective optimization with CFD to optimize boiler combustion process of a coal fired power plant. Appl. Energy 2014, 130, 658–669. [Google Scholar] [CrossRef]
  23. Ji, J.; Cheng, L. CFD modeling of sodium transformation during high-alkali coal combustion in a large-scale circulating fluidized bed boiler. Fuel 2020, 279, 118447. [Google Scholar] [CrossRef]
  24. Chen, H.; Wang, Y.; Ma, H.; Zhao, Q. Analysis and study of the slagging and contamination of a CFB boiler burning Zhundong-originated coal. J. Eng. Therm. Energy Power 2015, 30, 431–435. [Google Scholar]
  25. Zi, J.; Ma, D.; Wang, X.; ur Rahman, Z.; Li, H.; Liao, S. Slagging behavior and mechanism of high-sodium–chlorine coal combustion in a full scale circulating fluidized bed boiler. J. Energy Inst. 2020, 93, 2264–2270. [Google Scholar] [CrossRef]
  26. Silva, J.; Teixeira, J.; Teixeira, S.; Preziati, S.; Cassiano, J. CFD modeling of combustion in Biomass Furnace. Energy Procedia 2017, 120, 665–672. [Google Scholar] [CrossRef]
  27. Zadravec, T.; Rajh, B.; Kokalj, F.; Samec, N. CFD modelling of air staged combustion in a wood pellet boiler using thecoupled modelling approach. Therm. Sci. Eng. Prog. 2020, 20, 100715. [Google Scholar] [CrossRef]
  28. Echi, S.; Bouabid, A.; Driss, Z.; Abid, M.S. CFD simulation and optimization of industrial boiler. J. Energy 2018, 12, 14259. [Google Scholar] [CrossRef]
  29. Liu, X.; Bansal, R. Improving fossil fuel boiler combustion efficiency based on integrating real time simulation with online learning technology. Int. J. Ambient. Energy 2012, 33, 130–141. [Google Scholar] [CrossRef]
  30. Liu, X.; Bansal, R.C. Optimizing combustion process by adaptive tuning technology based on Integrated GA and Computational Fluid Dynamics. Energy Convers. Manag. 2012, 56, 53–62. [Google Scholar] [CrossRef]
  31. Maakala, V.; Jarvinen, M.; Vuorinen, V. CFD Modeling and Experimental Validation of Heat Transfer and Fluid Flow in the Recovery Boiler Superheater Region. Appl. Therm. Eng. 2018, 139, 222–238. [Google Scholar] [CrossRef]
  32. Yu, C.; Xiong, W.; Ma, H.; Zhou, J.; Si, F.; Jiang, X.; Fang, X. Numerical investigation of combustion optimization in a tangential firing boiler considering steam tube overheating. Appl. Therm. Eng. 2019, 154, 87–101. [Google Scholar] [CrossRef]
  33. Gavirineni, N.K.; Gundabattini, E. Investigation of the Performance of a 660-MW Supercritical Boiler in Terms of NOx Emission and Enhancing the Thermal Efficiency by Optimizing the Air Distribution System. J. Inst. Eng. Ser. C 2022, 103, 1–14. [Google Scholar] [CrossRef]
  34. Taler, J.; Trojan, M.; Dzierwa, P.; Kaczmarski, K.; Węglowski, B.; Taler, D.; Zima, W.; Grądziel, S.; Oclon, P.; Sobota, T.; et al. The flexible boiler operation in a wide range of load changes with considering the strength and environmental restrictions. Energy 2022, 263, 125745. [Google Scholar] [CrossRef]
  35. Kumar, G.N.; Gundabattini, E. Irreversibility analysis of various components in a supercritical thermal power plant. Int. J. Exergy 2022, 37, 313–336. [Google Scholar] [CrossRef]
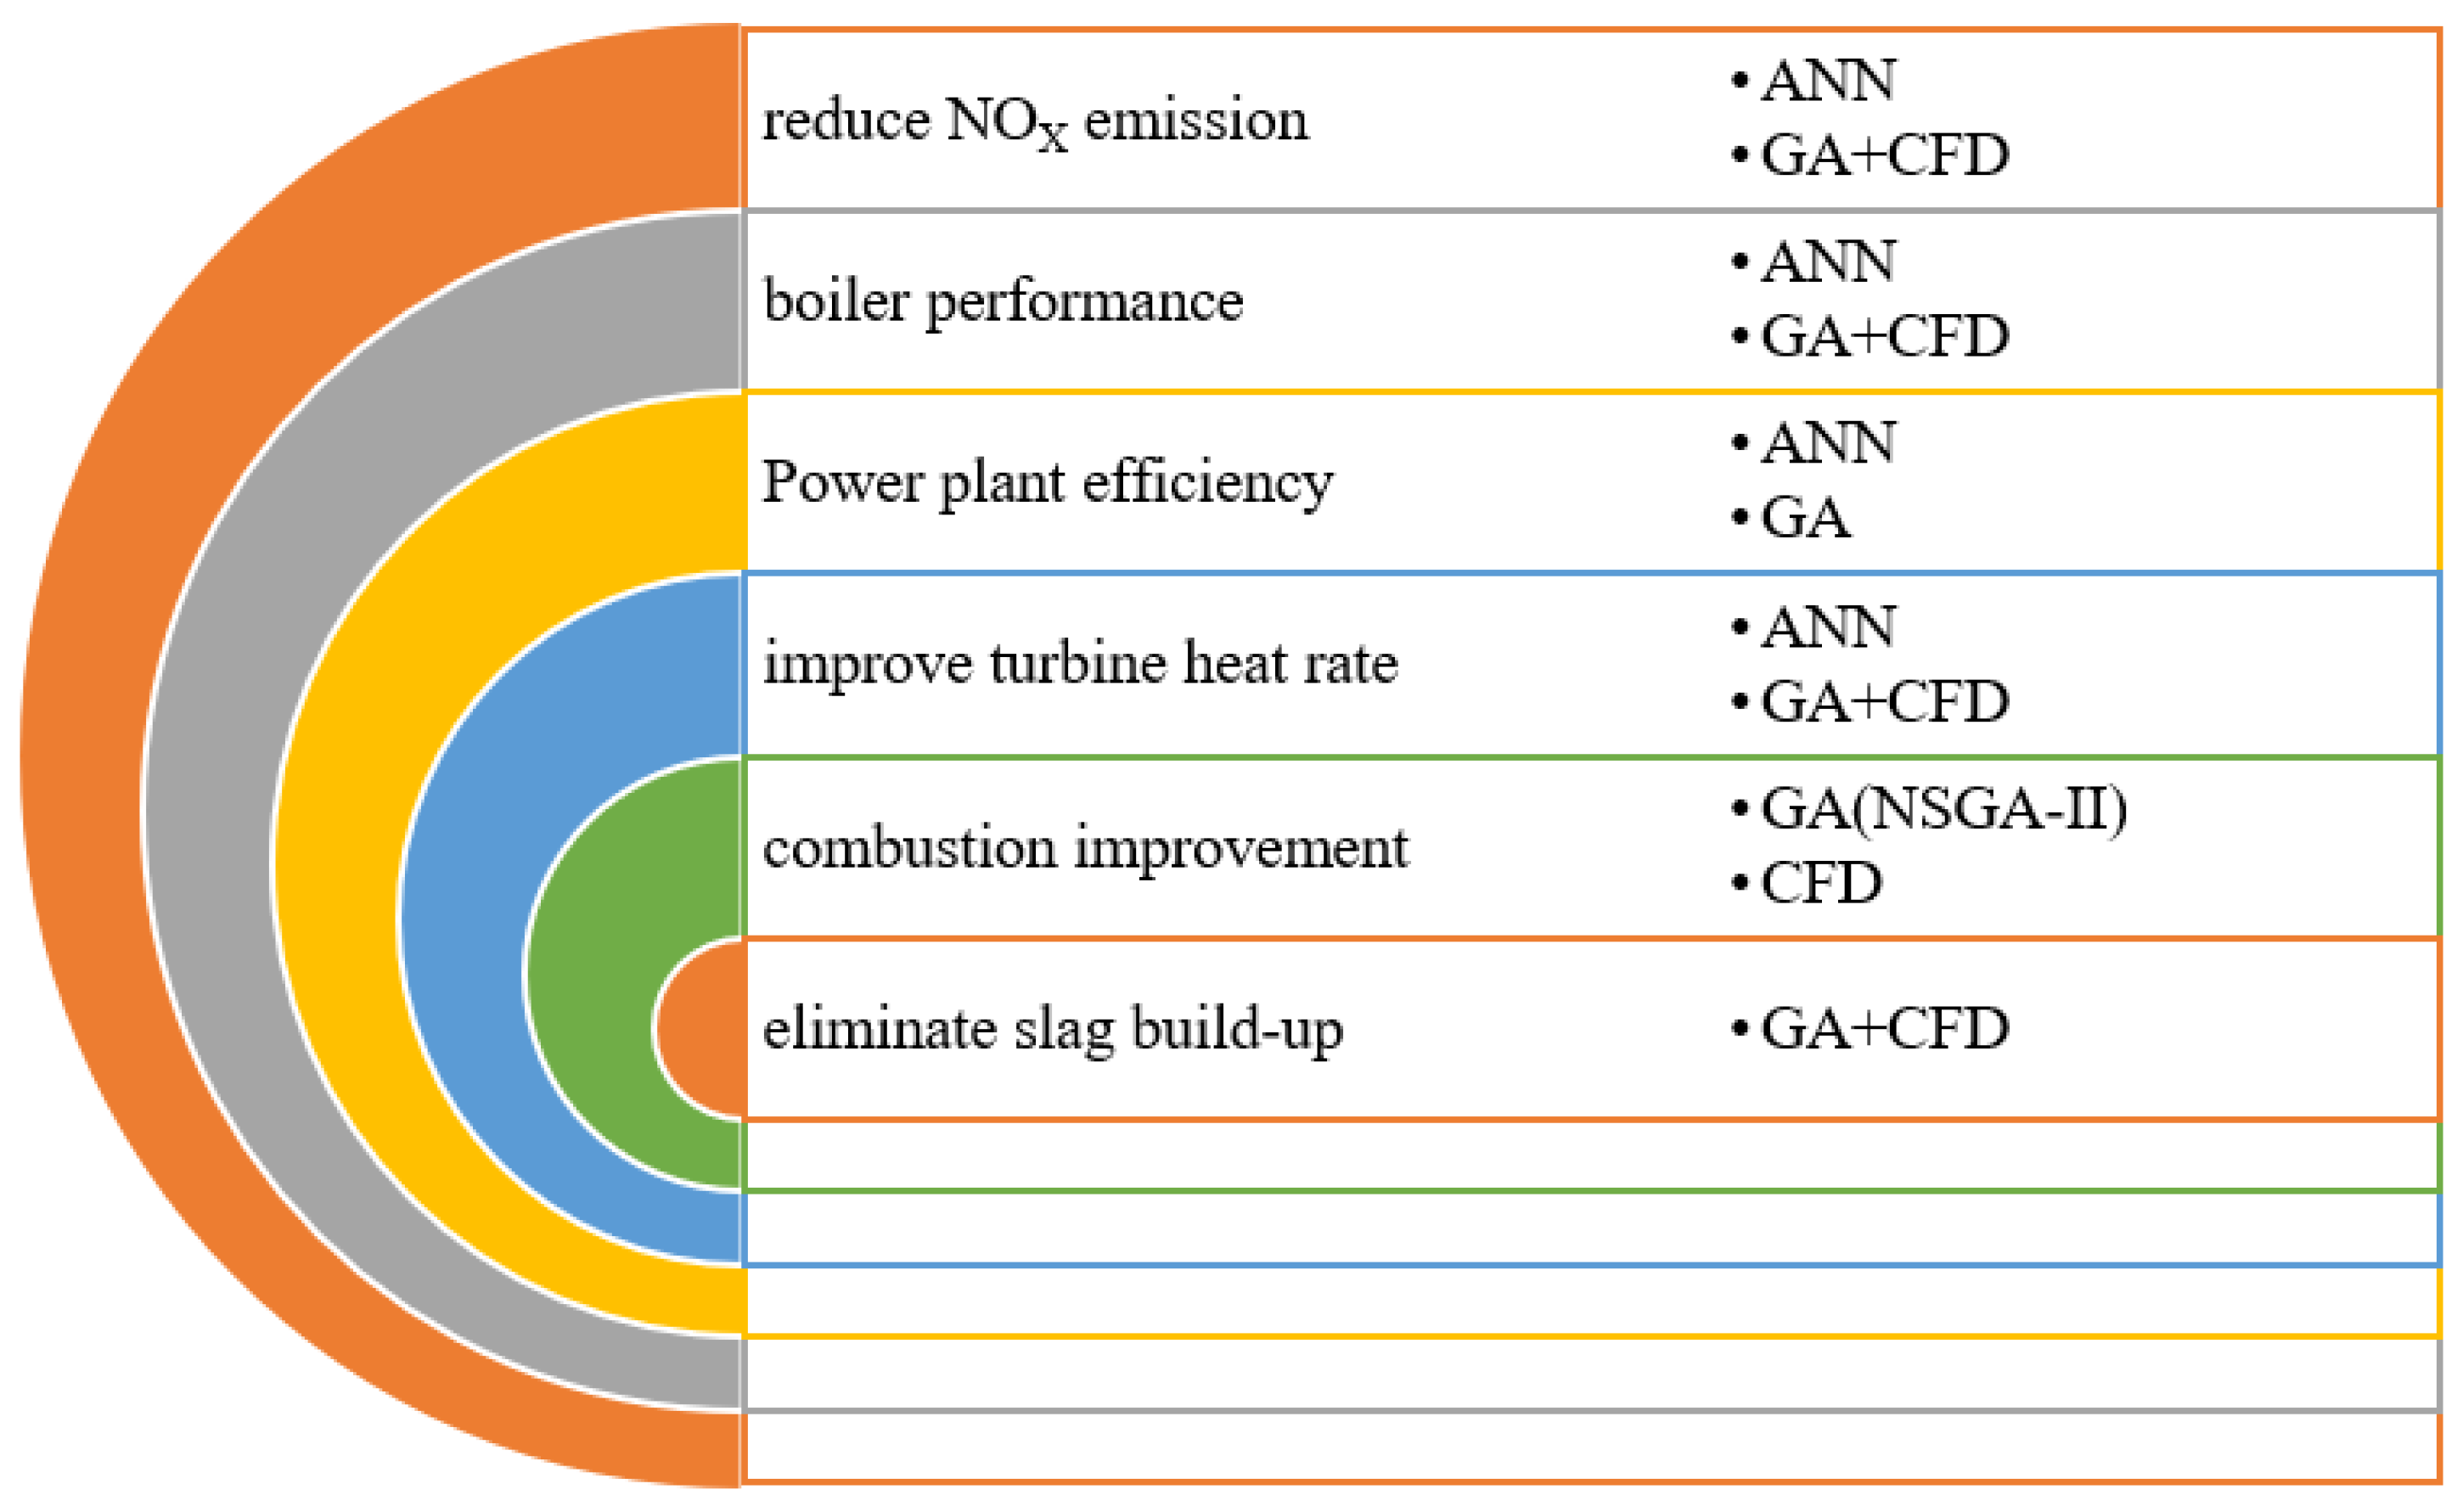
Figure 1. Emission control methods [6,7,8,9,10,11,12,13].
Energies 15 09076 g001
Figure 2. Optimizing tools to improve the performance of the process [14,15,16,17,18,19,20,21,22,23,24,25,26,27,28,29].
Energies 15 09076 g002
Figure 3. Supercritical thermal power plant line diagram.
Energies 15 09076 g003
Figure 4. Componential diagram of Supercritical 660 MW thermal power plant.
Energies 15 09076 g004
Figure 5. Supercritical Boiler front geometry.
Energies 15 09076 g005
Figure 6. Supercritical Boiler side elevation geometry.
Energies 15 09076 g006
Figure 7. Detailed meshing of supercritical boiler.
Energies 15 09076 g007
Figure 8. Flame condition inside the boiler.
Energies 15 09076 g008
Figure 9. Fireball formation inside the furnace.
Energies 15 09076 g009
Figure 10. Temperature distribution of flue gas in case-IV.
Energies 15 09076 g010
Figure 11. Velocity distribution of flue gas in case-IV.
Energies 15 09076 g011
Figure 12. Temperature distribution of flue gas in case-VI.
Energies 15 09076 g012
Figure 13. Velocity distribution of flue gas in case-VI.
Energies 15 09076 g013
Figure 14. Temperature distribution of flue gas in case-VII.
Energies 15 09076 g014
Figure 15. Velocity distribution of flue gas in case-VII.
Energies 15 09076 g015
Figure 16. Temperature distribution of flue gas in case-VIII.
Energies 15 09076 g016
Figure 17. Velocity distribution of flue gas in case-VIII.
Energies 15 09076 g017
Figure 18. Slag deposits on the water wall surface.
Energies 15 09076 g018
Figure 19. Heat transfer of tube from furnace flame to tubes for three cases.
Energies 15 09076 g019
Figure 20. Flue gas temperature distribution on tube.
Energies 15 09076 g020
Figure 21. Flue gas velocity distribution on tube.
Energies 15 09076 g021
Figure 22. Different losses from the boiler for all cases.
Energies 15 09076 g022
Figure 23. Integrated diagram of GA with CFD for combustion optimization.
Energies 15 09076 g023
Figure 24. Primary air, Secondary air VS Flue gas temperature generated from Python.
Energies 15 09076 g024
Table 1. Elemental exploration of coal samples.
S. NoElement%
1Sulphur0.593
2Oxygen6.545
3Carbon38.012
4Nitrogen0.744
5Hydrogen2.706
Table 2. Coal proximate analysis.
S. NoElementValue
1Fixed Carbon25.52%
2Moisture21.22%
3Ash30.18%
4Volatile Matter23.08%
5Gross calorific value13,807.2 kJ/kg
Table 3. Burner operating parameters in the supercritical plant.
PASAAir at Boundary
Velocity (m/s)Temperature (°C)Velocity (m/s)Temperature (°C)Velocity (m/s)Temperature (°C)
157835342.235342.2
Table 4. Elevation-wise burner location in each group.
Name of the ElevationName of the Airz-axis Value (m)
Elevation-IPrimary air36.00
Elevation-ISecondary air36.60
Elevation-IIPrimary air38.66
Elevation-IISecondary air39.26
Elevation-IIIPrimary Air41.32
Elevation-IIISecondary Air41.92
Elevation-IVPrimary Air43.98
Elevation-IVSecondary Air44.58
Elevation-VPrimary Air46.64
Elevation-VSecondary Air47.24
Elevation-VIPrimary Air49.30
Elevation-VISecondary Air49.90
Table 5. Supercritical boiler meshing details.
Type of MeshHEXA Mesh
Number of Nodes257,120
Number of Elements675,959
Table 6. Main objective functions.
ObjectiveObjective Function Description
1Maintain high heat transfer rate from the furnace to tubes
2Maintain the temperature of the water wall surface below the temperature of ash melting
3Boiler performance improvement
4Control the emissions from the boiler
Table 7. Burner’s operating parameters range, elevation-wise.
DescriptionMinimum Value (m/s)Maximum Value (m/s)Elevation
Secondary air Velocity A22045Elevation-2
Primary air Velocity A21535Elevation-2
Secondary air Velocity B22045Elevation-2
Primary air Velocity B21535Elevation-2
Secondary air Velocity C22045Elevation-2
Primary air Velocity C21535Elevation-2
Secondary air Velocity D22045Elevation-2
Primary air Velocity D21535Elevation-2
Air temperature to the burner set (°C)330350Elevation-2
Let A2, B2, C2 and D2—Second level burner arrangements.
Table 8. Different flue gas temperature and velocity cases.
Case NoInlet ConditionFurnace TemperatureFlue Gas Velocity
IPA-15 m/s and SA-25 m/s1348 K/1050 °C15.85 m/s
IIPA-17.5 m/s and SA-25 m/s1290 K/1017 °C20.01 m/s
IIIPA-20 m/s and SA-25 m/s1251 K/978 °C18.28 m/s
IVPA-22.5 m/s and SA-25 m/s1253 K/980 °C20.92 m/s
VPA-25 m/s and SA-25 m/s1239 K/966 °C22.52 m/s
VIPA-15 m/s and SA-35 m/s1670 K/1397 °C24.82 m/s
VIIPA-17.5 m/s and SA-35 m/s1632 K/1359 °C21.82 m/s
VIIIPA-20 m/s and SA-35 m/s1575 K/1302 °C19.75 m/s
IXPA-22.5 m/s and SA-35 m/s1540 K/1267 °C23.58 m/s
XPA-25 m/s and SA-35 m/s1512 K/1239 °C25.45 m/s
Table 9. Different cases Heat transfer rate.
Case NoInlet ConditionHeat Transfer Rate
VIPA-15 m/s and SA-35 m/s5945.867 W/m2
VIIPA-17.5 m/s and SA-35 m/s7743.76 W/m2
VIIIPA-20 m/s and SA-35 m/s87,513.9 W/m2
Table 10. Decision variables of optimized and un-optimized.
S. NODescriptionLow ValueHigh ValueOptimized
Variables
Un-Optimized Variables
1Primary air Velocity A2 (m/s)15752031.5
2Secondary air Velocity A2 (m/s)20603542.8
3Primary air Velocity B2 (m/s)15752031.5
4Secondary air Velocity B2 (m/s)20603542.8
5Primary air Velocity C2 (m/s)15752031.5
6Secondary air Velocity C2 (m/s)20603542.8
7Primary air Velocity D2 (m/s)15752031.5
8Secondary air Velocity D2 (m/s)20603542.8
9The temperature of primary air at burner set (K)400600584597.5
10The temperature of primary air at burner set (K)400600590597.5
Table 11. Python programming algorithm.
Step NumberSteps Sequence
Step-1Start
Step-2Enter the input value of ‘d’/ read ‘d’ value from the keyboard
Step-3d2 = d * d
Step-4For VPA in the range of 20–26 go to the next step
Step-5For VSA in the range from 25–30 go to the next step
Step-6Find num = (250 * (22/7) * d2 *(539 * VPA + 269 * VSA)))
Step-7Find dem = 4 * 37.75 * (VPA+ VSA)
Step-8Find tmax = (num/dem) + 30
Step-9Temp = tmax
Step-10If temp = 1577
Step-11Display VPA, VSA, tmax values
Step-12Stop
Table 12. Comparison of Simulation results with un-optimized physical plant data.
Simulation Results from CFD and GA at PA-20 m/s and
SA-35 m/s
Plant Data Before
Optimization at PA-15 m/s and SA-35 m/s
% of Variation
Furnace middle temperature, K/°C1575/13021665/13925.40/6.46
Flue gas Velocity, m/s19.7516.2321.50
Coal Consumption, Tonnes373382.12.38
Excess air consumption16.67%24.12%30.88
Boiler Losses14.895%16.158%7.81%
Boiler Efficiency85.104%83.842%1.48
Heat transfer rate, W/m285,513.9………-------
Slag formationNO12.5 cm-------
Table 13. Simulation results in comparison with experimental results from the plant.
Simulation Results from CFD and GA at PA-20 m/s and
SA-35 m/s
Plant Physical Results at
PA-20 m/s and SA-35 m/s
% of Variation
Furnace middle temperature, K/°C1575/13021595/13221.25/1.51
Flue gas Velocity, m/s19.75 17.2914.22
Coal Consumption, Tonnes3733700.8
Excess air consumption16.67%17.85%6.61
Boiler Losses14.895%14.29%4.23
Boiler Efficiency85.104%85.71%0.7
Heat transfer rate, W/m285,513.9 No device available-------
Slag formationNONO-------
Publisher’s Note: MDPI stays neutral with regard to jurisdictional claims in published maps and institutional affiliations.