1. Introduction
In 2020, 1.3 GW of energy was generated by fuel cells worldwide, almost entirely by Hydrogen cells [
1]. Despite Hydrogen’s predominance, alternative fuels are being studied in an attempt to address some of the shortcomings associated with Hydrogen, such as its high reactivity and difficulty in its storage and transportation at ambient conditions [
2].
One of these alternative fuels is ethanol, which was considered as it is liquid at ambient conditions and can be electro-oxidized at relatively low temperatures (below 90 °C) in direct ethanol fuel cells (DEFC) [
3]. In addition to that, ethanol is an attractive option for fuel cell use in locations where it is already renewably produced on a broad scale. Potentially, when completely oxidized to CO
2, twelve electrons are released per molecule of ethanol, although in practice complete ethanol electro-oxidation is still limited [
4].
Electro-oxidation kinetics, in particular, the cleavage of the C-C bond, are related to the formation of intermediate products less oxidized than the desired CO
2 and hence to reduced oxidation efficiency [
5]. In Badwal et al.’s review, the electro-oxidation kinetics of ethanol was viewed as a key point to overcome the technological limitations and enable its future commercial viability [
2]. Thus, research efforts were carried out to investigate possible reaction mechanisms and model them. Of great interest are the works of [
6,
7,
8,
9,
10].
These works used experimental observations from previous research to fit cell potential and current density data for bimetallic or trimetallic Pt-based anodic electro-catalysts using different reaction mechanisms. Data on product selectivity and/or surface coverage fraction distributions of adsorbed species were also considered in these studies to ensure adequate correspondence between the model and the electrochemical reactions occurring within the cell. These works have made important contributions to the literature on DEFC modeling; however, a formal analysis of model parameter sensitivity is lacking from them.
Such analysis can be challenging as the modeling system consists of non-linear equations with restrictions. Therefore, the present work seeks to add to the literature on DEFC first-principles modeling by conducting a statistical analysis of parameter sensitivity, with the intention of identifying parameters that have more impact on the model and calculating their uncertainties. More sensitive parameters are those effectively responsible for the model output response. Furthermore, they are determined within more narrow confidence intervals, that is, they are determined with less uncertainty. For this, the ethanol electro-oxidation mechanism adopted by [
6,
8] (and proposed by [
11,
12] based on their experimental studies) was considered.
Furthermore, this work modeled and identified sensitive parameters for different types of Pt–Sn catalysts, thus allowing for considerations related to catalyst composition to be made. Additional analyses associated with the most sensitive parameters were also carried out to extract relevant insights concerning their effect on coverage fraction distribution, reaction rates and parameter correlations.
2. Theory
2.1. Electrochemical Kinetics
Electrochemical reactions are traditionally described by the Butler–Volmer equation, which relates current density (j) to the electrode activation overpotential (η), as shown in Equation (1). The other terms in Equation (1) are: j
0, the exchange current density; α, the anodic charge coefficient; T, absolute temperature; R, ideal gas constant; and F, Faraday constant. This equation assumes that the rate of diffusion of species from the bulk to the surface is much larger than the rate of reaction and that the reaction is reversible.
Equations (2a)–(2e) describe the reactions included in the ethanol electro-oxidation mechanism adopted by [
6] and proposed by [
11,
12].
where the ads subscript denotes the species adsorbed onto the catalyst surface. It should be noted that Equations (2b) and (2e) are desorption reactions, which are not electrochemical. Equation (2a) represents the electrochemical adsorption of ethanol forming adsorbed acetaldehyde and releasing two protons and two electrons, and Equation (2b) represents the desorption of this adsorbed acetaldehyde. Equation (2c) represents the formation of adsorbed CH
3CO, releasing three protons and three electrons. The reversible electrochemical dissociative adsorption of water, forming adsorbed OH, is shown in Equation (2d). Lastly, the desorption of CH
3CO and OH, releasing acetic acid, is illustrated by Equation (2e).
The formation of CO
2 was not included in the mechanism as it was observed to be a minor reaction product [
13]. In addition, the fraction of adsorbed CO (the intermediate that leads to CO
2 formation) obtained by models from [
7] was found to be negligible and it was neglected in other modeling studies [
10]. Keeping in mind that from a modeling perspective, overparameterization should be avoided so that meaningful fits are achieved, it is reasonable to consider a mechanism that does not include CO
2 formation.
Based on this mechanism and using Butler–Volmer kinetics for electrochemical reactions, the corresponding reaction rates for each reaction are given by Equations (3a)–(3f), where k represents the reaction rate constant; θ, the coverage fraction for adsorbed species; C
ethanol, the concentration of ethanol in the bulk; and the other terms are as described previously. It should be noted that, while different types of active sites exist on the catalyst surface (each with a distinct reaction rate constant), it was assumed that the catalytic mechanism would be described by just one set of reaction rate constants [
6,
14].
In Equations (3a) and (3c), the charge transfer coefficients are already expressed taking into account the number of electrons, i.e., incorporating the respective number of electrons involved.
2.2. Statistics of Non-Linear Systems with Restrictions
The statistics of non-linear systems are related to the approximate covariance matrix, as shown in Equation (4) [
15].
where Cov(p*) is the approximate covariance matrix, size n × n (n is the number of parameters of the system); J(p*) is an m × n matrix with the Jacobians of the error with respect to the parameters (m is the number of experimental data points available for regression); J(p*)
T is the transpose of J(p*) (n × m); p* is an n-sized vector with the fitted parameter values; and s
2 is the variance of the output argument, as defined in Equation (5).
In Equation (5), SSE represents the loss function (commonly, the sum of squared errors); and DOF is the degrees of freedom of the system. According to the mathematical developments of [
16], who proposed a method for the calculation of the approximate covariance matrix for a non-linear system with non-linear equality restrictions, the key point in such calculations is to include the number of restrictions in the expression for the DOF. As such, in Equation (5), the DOF was expressed in terms of m, n and r (the number of restrictions).
The SSE is a common function in regression problems and is calculated as shown in Equation (6).
where e
i is the residual (error) for data point i; y is a vector with measured values for the output argument; and ŷ is a vector with output argument values as calculated by the model.
An important approximation is given in Equation (7), where the Hessian matrix (H) can be expressed in terms of the Jacobian vector and its transpose [
15,
17]. This allows the approximate covariance matrix to be rewritten as shown in Equation (8).
According to [
17], the standard error (SE) of each parameter can be computed based on Equation (9). The standard deviation (SD) of each parameter can then be computed from the SE with Equation (10) [
18]. For this, it is assumed that the SD is related to a 95% confidence interval (two-tailed).
where the t-value is a standard value calculated in statistical tests for small samples. Its value is commonly found in tables and depends on the DOF, confidence interval and type of distribution assumed (i.e., one- or two-tailed) [
18].
3. Methods
3.1. Model Fit
Based on the reaction mechanism described in Equations (2a)–(2e), the current density predicted by the model was expressed as shown in Equation (11). Equations (12a)–(12c) represent the non-linear restrictions of the model and were obtained from a steady-state balance on each adsorbed species.
The model was implemented in MATLAB using
fmincon, with current density as the output variable and anodic overpotential as the input. The model parameters were the reaction rate constants and the coverage fractions. Initial guess values, as well as upper and lower boundaries for these parameters, were taken from [
8]. Experimental cell potential and current density data for the regression were taken from previous work from the research group for as-prepared Pt–Sn catalysts that displayed good performance in the 5–15 mW/cm
2 range, relative to a performance of 12 mW/cm
2 for commercial ETEK [
13]. The as-prepared catalysts had the following nominal compositions: Pt
9Sn, Pt
4Sn, Pt
3Sn, Pt
2Sn, PtSn
3.
Fmincon is a function that takes in as arguments: the function whose SSE is to be minimized (Equation (11)); the initial guess values for the parameters; upper and lower boundaries for the parameters; non-linear restrictions (Equations (12a)–(12c)); and linear constraints (in this case, those were the sum of the coverage fractions at each available data point not being greater than one). The output arguments from the function are (among others): the fitted parameter values, the minimum SSE found, and the Hessian matrix used in the algorithm’s internal calculations [
19].
3.2. Parameter Sensitivity
Non-linear regression problems do not have a general solution theory and are instead solved by iterative methods, in which convergence occurs to a local optimum depending on the initial guess values for the system parameters. Within commercial software packages, algorithms are already available for implementing these methods. Of particular interest to this study, these packages do not include statistical data on regression results, on the standard deviations of the fitted model parameters.
Therefore, the statistical developments presented by the works of [
15,
17] were used to calculate the standard deviations for the parameters fitted by
fmincon based on the equations shown in
Section 2.2 and output arguments from the regression, such as the SSE value and the Hessian matrix. Initially, all model parameters were varied and the standard deviation of each was calculated. Then, through a subset selection process, regression was repeated by fitting only the parameter previously found to be the most sensitive, and subsequently adding one more of the next most sensitive parameters at a time. This was performed until the standard deviation for the newly added parameter was large enough so that it would not be considered sensitive. Only parameters that had been considered sensitive before the addition of the first non-sensitive parameter were kept with the newly fitted values, while the others were fixed at the values adjusted during the first fit.
Additionally, in order to test the sensitivity of the charge transfer coefficients and possible correlation effects between the parameters, regression was carried out by re-fitting the model taking as adjustable parameters the most sensitive parameters previously found and the charge transfer coefficients.
3.3. Effect of Most Sensitive Parameters on Adsorbed Species Coverage Distribution
Regression was performed again for PtSn3 by refitting the coverage fraction distributions only. The values for the other parameters were fixed at the previously adjusted values for non-sensitive parameters and increased by 1.5 for the most sensitive parameters.
3.4. Analysis of Reaction Rates as a Function of Anodic Overpotential
Reaction rates as a function of anodic overpotential were plotted using Equations (3a)–(3f), with parameter values as previously adjusted. Only reactions associated with the most sensitive parameters were considered in the analysis, with the aim of identifying which reaction pathways could be related to each catalyst’s performance.
4. Results and Discussion
4.1. Model Fit
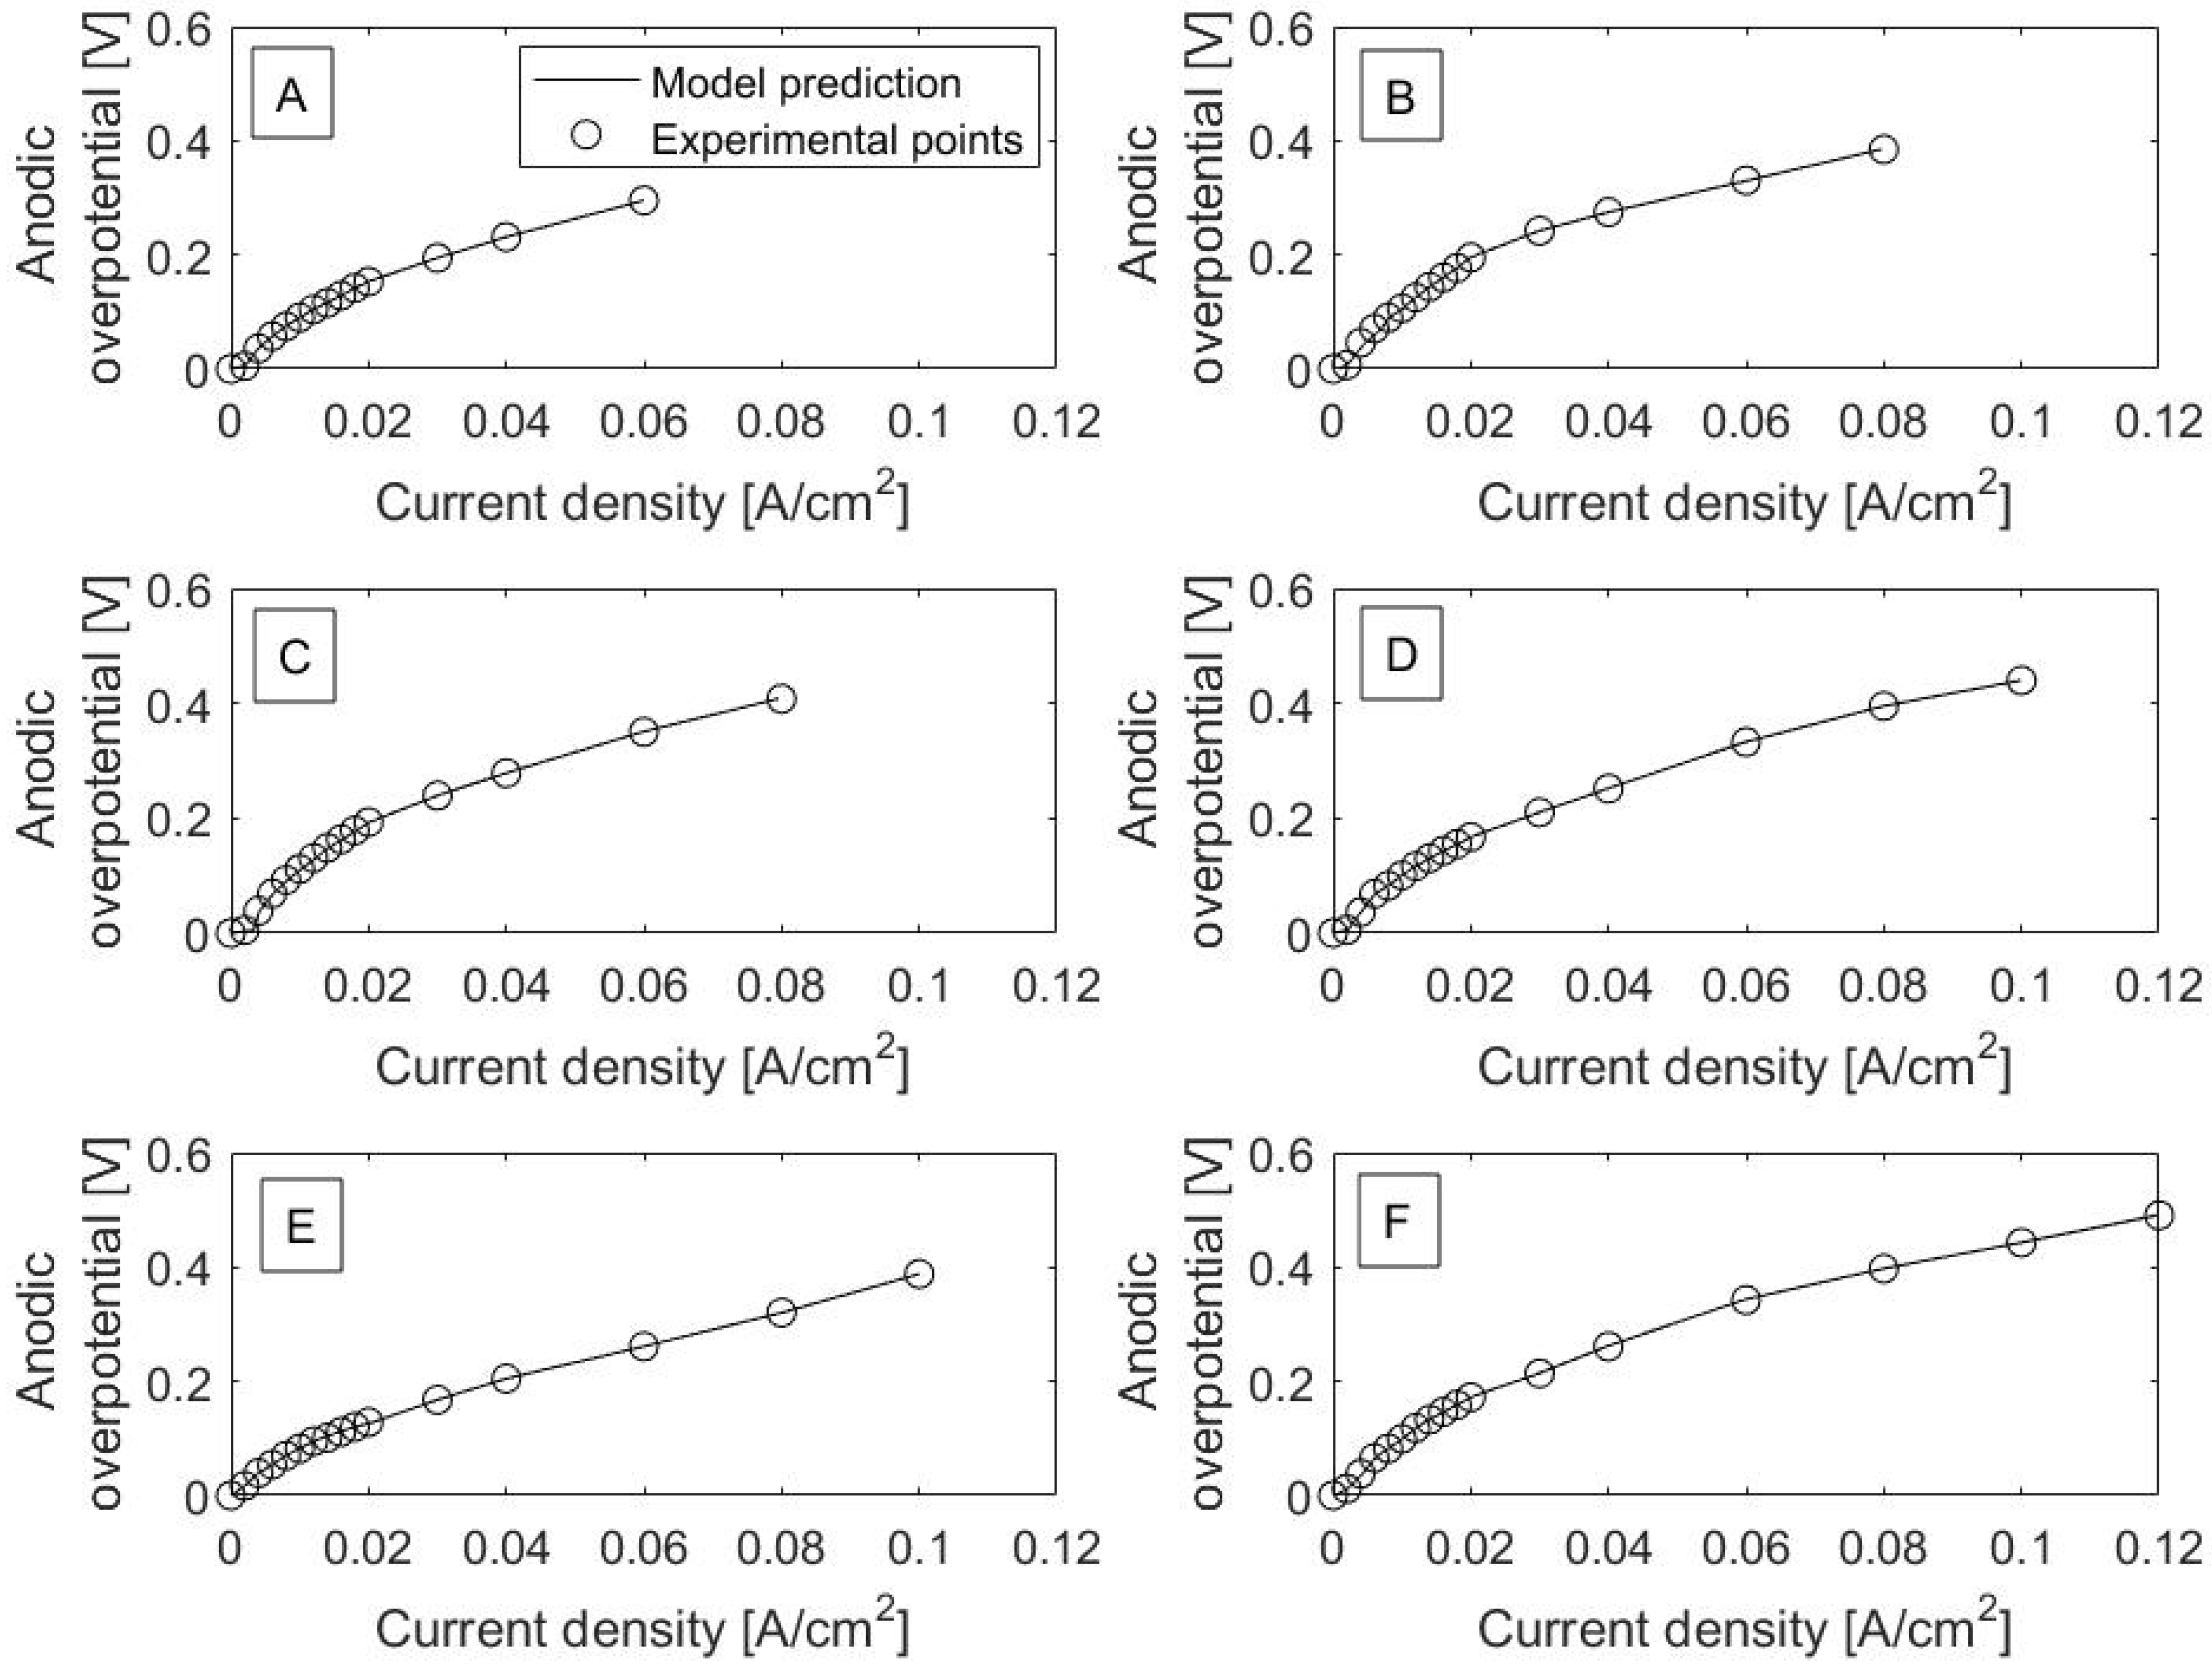
Polarization curves for each catalyst are shown in
Figure 1. It is worth noting that current density is the output variable from the model, even though it is plotted on the
x-axis in the polarization curves. Excellent fits between model prediction (solid lines) and experimental data can be observed. This can also be seen in the RMSE values, as listed in
Table 1. RMSE is the square root of residual (error) variance and has the same units as the model output variable. RMSE values range from 0.22 × 10
−4 to 4.2 × 10
−4 A/cm
2 and are relatively much smaller in magnitude than current density values, with a range from 0 to 0.12 A/cm
2 across all catalysts.
Figure 2 presents the fitted surface coverage fraction distributions for each catalyst. The lines in the graph do not represent a model fit and are visual guides only. Surface coverage fractions were fitted for each adsorbed species at each overpotential value from the experimental data points.
Very similar fits were obtained for different Pt–Sn catalysts. The coverage fraction of acetaldehyde and OH increases with overpotential (with acetaldehyde exhibiting a greater increase), while that of CH3CO is very close to one at low overpotentials and drops with overpotential. It should be noted that, in agreement with the model, the formation of adsorbed CH3CO is independent of the prior formation of adsorbed CH3CHO, as both species come directly from ethanol oxidation (Equations (2a) and (2c)).
The overall shape of the distribution curves in
Figure 2 was kept through restrictions on upper and lower boundary limits during regression, based on limit values found in the literature, as mentioned in
Section 3.1. This was carried out so as to avoid random coverage fraction fits and instead achieve fits that were close to what was observed in experimental studies that are in agreement with electrochemical/adsorption phenomena occurring at the anode.
4.2. Parameter Sensitivity
Table 1 lists the fitted values for the reaction rate constants for each Pt–Sn catalyst. Standard deviation values are shown for the most sensitive parameters of each catalyst. All catalysts considered, the most sensitive parameters were k
1, k
4 and k
4′, which are associated with the formation of adsorbed CH
3CO, and the direct and reverse water dissociative adsorption reactions, respectively.
Figure 3 shows the effect of increasing the value of the two most sensitive parameters on the polarization curve for PtSn
3 (all other parameter values remained at their previously adjusted values). As can be seen from
Figure 3, changing the value of k
4 causes a greater deviation from the original fit than changing k
4′ because k
4 is the most sensitive model parameter for PtSn
3, which can be inferred from the standard deviation values shown in
Table 1. The smaller the relative value of the standard deviation of a parameter, the more sensitive it is, that is, the more effect it has on the model output. Less sensitive parameters can vary quite a bit without impacting the model and therefore they have larger standard deviations.
As k4 is associated with the forward water adsorption reaction, which is an oxidation reaction, increasing its value leads to higher current density values for a constant anodic overpotential, meaning that as the reaction rate increases, more electrons would be released. The opposite occurs with k4′, which is the reaction rate constant for a reduction reaction.
The charge transfer coefficients were originally taken to be constants within the model, with values as presented by [
8]. Afterward, they were included as model parameters and fitted along with the most sensitive parameters previously identified.
Table 2 lists the original and refitted values for these terms and their standard deviations for Pt
9Sn.
The addition of charge transfer coefficients as adjustable model parameters did not significantly alter the fitted values for the most sensitive parameters. Comparing the magnitude of the standard deviations with the refitted values, it can be seen that some transfer coefficients are as sensitive as, if not more sensitive than, k4 and k4′. The fitted values for the transfer coefficients were within a standard deviation from the constant value originally assumed, except for α1. However, this transfer coefficient was a lot less sensitive than the other two, and as such, a change in its value would have a smaller impact on the model output.
4.3. Effect of Most Sensitive Parameters on Adsorbed Species Coverage Distribution
Variations in the surface coverage fraction distributions are shown in
Figure 4 for the case where the values of the two most sensitive parameters of PtSn
3 (k
4 and k
4′) are increased by 1.5. Original distribution curves are shown with continuous lines and those for the changed fit with dashed lines. As can be seen, the surface fraction of acetaldehyde increased, while those of CH
3CO and OH decreased, but there is only a slight variation from the original distributions, which becomes more distinct as the overpotential increases. The distributions are not much affected by a change in the most sensitive parameters, indicating they are not strongly correlated. Therefore, taking the fitted values for the surface coverage fraction distributions as a constant within the modeling framework is a reasonable assumption.
However, it should be noted that it was not possible to raise the values of k4 and k4′ by much beyond 1.5 because the model was very sensitive to these parameters. As a consequence, the regression algorithm could not appropriately fit the polarization curve when the parameters were much higher than their original fitted values.
4.4. Analysis of Reaction Rates as a Function of Anodic Overpotential
Plots of reaction rates as a function of anodic overpotential for different Pt–Sn catalysts can be seen in
Figure 5. Trendlines were added to help visualize the general behavior of the reaction rates, especially since some rates oscillate with overpotential due to their surface coverage fraction distributions not being completely smooth (see
Figure 2). Only rates related to reactions with the most sensitive parameters are shown for each catalyst, as these would have a lower degree of uncertainty.
The inverse water adsorption reaction (R
4′) occurs at a higher rate for Pt
9Sn, Pt
2Sn and ETEK (
Figure 5A,D,F). While this reaction is unfavorable since it consumes electrons, for Pt
2Sn and ETEK, this is offset by R
1, which releases 3 mol e
− for every mol of reaction-equivalent. Pt
9Sn was, among all catalysts considered, the one with the lowest performance, achieving a maximum power density of 5 mW/cm
2 [
13]. This lower performance could be attributed to a very high rate of the reduction reaction, meaning the equilibrium is dislocated towards the inverse water dissociative adsorption reaction.
In catalysts for which R
4 was one of the most sensitive reactions (
Figure 5A–C,E), the rate of reaction increased with anodic overpotential. Since the different types of ethanol electro-oxidation reactions that may occur are dependent on the overpotential, it is important to mention that R
4 prevailing at higher overpotentials is in agreement with what was empirically observed [
11,
12].
The catalyst PtSn
3 was previously found to be the one with the highest performance, with a maximum power density of 15 mW/cm
2 [
13]. As seen in
Figure 5E, its current density generation is related to a greater degree of certainty to the forward water dissociative adsorption reaction (R
4), while also benefiting from lower rates of the unfavorable reverse reaction (R
4′).
5. Conclusions
This work focused on modeling the ethanol electro-oxidation kinetics at the anode of a DEFC, including parametric sensitivity and related analyses. The model was fitted to different Pt–Sn compositions, and overall, k1, k4 and k4′ were identified as the most sensitive parameters. These parameters are associated with the formation of adsorbed CH3CO and the direct and reverse water dissociative adsorption reactions, respectively.
Reverse water dissociative adsorption was an unfavorable factor for ethanol electro-oxidation in Pt9Sn, Pt2Sn and ETEK. However, for Pt2Sn and ETEK, its impact was offset by adsorbed CH3CO formation. Forward water dissociative adsorption presented higher rates as the anodic overpotential increased, which matches the behavior observed experimentally.
As the DEFC modeling approaches become broader and move on to include additional cell layers and heat and mass transfer phenomena, it is important to have a well-defined anodic kinetic model, as well as an understanding of which parameters more strongly affect its output. In this sense, the results from this work could contribute to state-of-the-art DEFC modeling by providing insights into which variables may be assumed constant or which are the few ones that are more sensitive. This may assist in reducing the model size and computational time for future broader models.
Author Contributions
D.S.B.L.d.O.: conceptualization, design of the study, coding (writing and debugging), analysis and interpretation of results, manuscript (writing, review and editing); F.C.: conceptualization, critical review of analysis and interpretation of results, manuscript (critical review); R.d.S.J.: conceptualization, design of the study, coding (review and debugging), critical review of analysis and interpretation of results, manuscript (critical review and editing), supervision. All authors have read and agreed to the published version of the manuscript.
Funding
This study was financed in part by the Coordenação de Aperfeiçoamento de Pessoal de Nível Superior—Brasil (CAPES) [Coordination for the Improvement of Higher Education Personnel—Brazil]—Finance Code 001.
Data Availability Statement
Sources for all data used in this work were cited along the text.
Acknowledgments
The authors wish to acknowledge the financial support from the Brazilian National Agency of Petroleum, Natural Gas and Biofuels (ANP), the Financing Agency for Studies and Projects (FINEP), and the Brazilian Ministry of Science, Technology and Innovations (MCTI), through the ANP Human Resources Program for the Biofuel Sector (PRH-ANP/FINEP).
Conflicts of Interest
The authors certify no affiliations or involvement in any organization or entity with any financial or non-financial interest in the subject matter or materials discussed in this manuscript.
References
- E4tech. The Fuel Cell Industry Review. 2020. Available online: https://www.FuelCellIndustryReview.com (accessed on 1 February 2022).
- Badwal, S.P.S.; Giddey, S.; Kulkarni, A.; Goel, J.; Basu, S. Direct ethanol fuel cells for transport and stationary applications—A comprehensive review. Appl. Energy 2015, 145, 80–103. [Google Scholar] [CrossRef]
- Sánchez-Monreal, J.; Vera, M.; García-Salaberri, P.A. Fundamentals of Electrochemistry with Application to Direct Alcohol Fuel Cell Modeling. IntechOpen 2017, 121–151. [Google Scholar] [CrossRef] [Green Version]
- Friedl, J.; Stimming, U. Model catalyst studies on hydrogen and ethanol oxidation for fuel cells. Electrochim. Acta 2013, 101, 41–58. [Google Scholar] [CrossRef] [Green Version]
- Abdullah, S.; Kamarudin, S.K.; Hasran, U.A.; Masdar, M.S.; Daud, W.R.W. Modeling and simulation of a direct ethanol fuel cell: An overview. J. Power Sources 2014, 262, 401–406. [Google Scholar] [CrossRef]
- Sousa, R., Jr.; Anjos, D.M.; Tremiliosi-Filho, G.; Gonzalez, E.R.; Coutanceau, C.; Sibert, E.; Léger, J.-M.; Kokoh, K.B. Modeling and simulation of the anode in direct ethanol fuels cells. J. Power Sources 2008, 180, 283–293. [Google Scholar] [CrossRef]
- Meyer, M.; Melke, J.; Gerteisen, D. Modelling and simulation of a direct ethanol fuel cell considering multistep electrochemical reactions, transport processes and mixed potentials. Electrochim. Acta 2011, 56, 4299–4307. [Google Scholar] [CrossRef]
- Maia, L.K.K.; Sousa Jr., R. Three-dimensional CFD modeling of direct ethanol fuel cells: Evaluation of anodic flow field structures. J. Appl. Electrochem. 2016, 47, 25–37. [Google Scholar] [CrossRef]
- Sánchez-Monreal, J.; García-Salaberri, P.A.; Vera, M. A genetically optimized kinetic model for ethanol electro-oxidation on Pt-based binary catalysts used in direct ethanol fuel cells. J. Power Sources 2017, 363, 341–355. [Google Scholar] [CrossRef]
- Pittayaporn, N.; Therdthianwong, A.; Therdthianwong, S.; Songprakorp, R. Dynamic modeling of direct ethanol fuel cells upon electrical load change. Int. J. Energy Res. 2019, 43, 2615–2634. [Google Scholar] [CrossRef]
- Hitmi, H.; Belgsir, E.M.; Leger, J.-M.; Lamy, C.; Lezna, R.O. A kinetic analysis of the electro-oxidation of ethanol at a platinum electrode in acid medium. Electrochim. Acta 1994, 39, 407. [Google Scholar]
- dos Anjos, D.M. Preparação, Caracterização e Estudo Eletroquímico de ligas de Pt/M e Pt/M/M1 (M, M1 = Mo, Sn, Ru, Os e W) para Eletrooxidação de Etanol com Aplicações em DEFC [Synthesis, Characterization and Electrochemical Study of Pt/M and Pt/M/M1 Alloys (M, M1 = Mo, Sn, Ru, Os and W) for the Electro-Oxidation of Ethanol with DEFC Applications]. Ph.D. Thesis, Universidade de São Paulo, São Paulo, Brazil, 2007. (In Portuguese). [Google Scholar]
- Colmati, F., Jr. Estudo de Catalisadores de Pt-Sn para o ânodo da célula a Combustível de Membrana Trocadora de Prótons Alimentada com Etanol Direto [Study of Pt-Sn Catalysts for the Anode of a Proton-Exchange Membrane Fuel Cell Directly Fed with Ethanol]. Ph.D. Thesis, Universidade de São Paulo, São Paulo, Brazil, 2007. (In Portuguese). [Google Scholar]
- Nordlund, J.; Lindbergh, G. A model for the porous direct methanol fuel cell anode. J. Electrochem. Soc. 2002, 149, A1107–A1113. [Google Scholar] [CrossRef]
- Nelles, O. Nonlinear System Identification—From Classical Approaches to Neural Networks and Fuzzy Models, 1st ed.; Springer: Berlin/Heidelberg, Germany, 2001. [Google Scholar]
- Lohmann, T.; Boch, H.G. A Computationally Convenient Statistical Analysis of the Solution of Constrained Least-Squares Problems; Fakultät für Mathematik, Technische Universität München: Munich, Germany, 1996. [Google Scholar]
- Aster, R.C.; Borchers, B.; Thurber, C.H. Parameter Estimation and Inverse Problems; Elsevier: Amsterdam, The Netherlands, 2019. [Google Scholar]
- Devore, J.L. Probability and Statistics for Engineering and the Sciences, 9th ed.; Cengage Learning: Boston, MA, USA, 2009. [Google Scholar]
- MathWorks Inc. Fmincon Online Documentation. 2020. Available online: https://www.mathworks.com/help/optim/ug/fmincon.html#busog7r-3 (accessed on 1 February 2022).
| Publisher’s Note: MDPI stays neutral with regard to jurisdictional claims in published maps and institutional affiliations. |
© 2022 by the authors. Licensee MDPI, Basel, Switzerland. This article is an open access article distributed under the terms and conditions of the Creative Commons Attribution (CC BY) license (https://creativecommons.org/licenses/by/4.0/).


