Article

Power-to-Methane to Integrate Renewable Generation in Urban Energy Districts

by
Gianluigi Lo Basso
*,
Lorenzo Mario Pastore
and
Livio de Santoli
Department of Astronautical Electrical and Energy Engineering (DIAEE), Sapienza University of Rome, Via Eudossiana 18, 00184 Rome, Italy
*
Author to whom correspondence should be addressed.
Energies 2022, 15(23), 9150; https://doi.org/10.3390/en15239150
Submission received: 31 October 2022 / Revised: 24 November 2022 / Accepted: 25 November 2022 / Published: 2 December 2022
(This article belongs to the Topic Distributed Energy Systems and Resources)

Abstract

:
The deployment of distributed energy systems must take place paying attention to the self-consumption of renewable generation. Innovative sector coupling strategies can play that role linking local electricity and gas grids. The present work aims to evaluate the energy and economic feasibility of the Power-to-Methane strategy application in urban energy districts. A residential cluster was considered as a case study. Two PV configurations have been applied to evaluate the Substitute Natural Gas (SNG) production under different renewable excess conditions. Thereafter, the Power-to-Methane strategy was implemented by varying the system’s size. Some significant configurations have been compared to each other in terms of energy and economics. Beyond a certain threshold limit, an increase in the photovoltaic size slightly enhances the effectively self-consumed energy. The Power-to-Methane strategy can exploit all the renewable excess once the system is properly sized, almost doubling the potential energy consumption reduction compared to the PV system alone. The SNG production cost is between 100 and 200 EUR/MWh in most configurations, which is competitive with the high natural gas prices on the European market. Therefore, decentralised SNG production can reduce the households’ annual expenditures and it can mitigate the energy poverty conditions over the current energy crisis period.

1. Introduction

The transformation of energy systems is a necessity in order to reduce greenhouse gas emissions [1]. The energy transition will not only affect generation technologies, but also the structure of energy systems [2]. Currently, those systems are mainly centralised, where both the energy production and consumption are separated geographically and in terms of stakeholders as well. Future renewable energy systems, on the other hand, should be distributed so that citizens themselves self-produce and self-consume renewable energy locally [3]. However, the intermittency of renewable energy sources (RES) implies the need for storage systems to provide system flexibility and integrate RES excess [4].
Indeed, in recent years, with RES deployment, local self-consumption has become a major constraint in the distributed energy systems’ design [5]. Electricity grids can only accommodate small energy amounts and the development of numerous generation nodes can create problems in managing the grid stability and energy flows. Therefore, distributed renewable plants should be managed in order to self-consume local generation as much as possible [6]. To do this, it is necessary to develop systems able to increase flexibility within the energy system itself [7]. Indeed, the energy demands have to be precisely forecasted at the local level [8] and different demand side management strategies have to be applied in order to adapt power loads to the intermittent generation [9]. The infrastructure implementation can play a key role for the managing of RES-based energy systems [10]. Moreover, the exploitation of several small-scale energy storage system solutions at a district level is crucial for RES integration [11].
Electric batteries are the most analysed storage solution in distributed energy systems [12]. Nevertheless, such systems are not the most efficient solution in many cases, as they are characterised by high costs [13]. Furthermore, they have a high life-cycle environmental impact [14,15]. In addition, as the penetration of renewables increases, the implementation of long-term energy storage systems becomes increasingly required [16].
In the literature, the smart energy systems approach has become of growing interest in recent years [17]. It proposes a holistic view of energy systems that goes beyond the single-sector approach. According to Ref. [18], “a Smart Energy System is defined as an approach in which smart electricity, thermal and gas grids are combined with storage technologies and coordinated to identify synergies between them in order to achieve an optimal solution for each individual sector as well as for the overall energy system”.
The need for a holistic approach in energy planning is widely demonstrated in the literature [19]. Different sector coupling strategies have been investigated to improve the self-consumption ratio in distributed energy systems [20]. Several works analysed the potentiality of the Power-to-Heat strategy, i.e., the possibility to convert the RES excess into thermal energy by means of heat pumps [21,22]. This solution was also analysed by combining other strategies [23].
A more recent suitable solution for small-scale energy scenarios are Power-to-Gas systems [24]. Such systems convert excess electricity from renewable sources into green hydrogen by means of electrolysers [25]. Often, the hydrogen application in distributed systems was analysed for grid balancing through the use of fuel cells [26]. However, the hydrogen re-conversion into electricity for balancing purposes alone was not the best solution, due to the low round-trip efficiency [27].
Instead, the potential role of hydrogen in connecting electricity and gas grids is more interesting [28]. Indeed, hydrogen can be further converted in alternative fuels, such as Synthetic Natural Gas (SNG), methanol, ammonia and DME (dimethyl ether) [29].
As shown in Ref. [30], the current costs of SNG are often higher than 100 EUR/MWh. Notwithstanding, the recent increase in the natural gas spot price can be an opportunity to accelerate the deployment of alternative fuels, namely to boost the so-called electro-fuels once captured CO2 is available [31].
Hydrogen and CO2 can be converted into SNG by means of the methanation process, which can be carried out in different reactor typologies [32].

1.1. Methanion Reactors in Brief

Over the last 50 years, several methanation reactor concepts have been proposed due to a growing environmental consciousness and the urgent task of rapidly lowering anthropogenic greenhouse gas emissions. The well-proven reactor layouts have been developed especially for large industrial processes. For instance, adiabatic fixed-bed reactors were commercialised by Air Liquide (formerly Lurgi) for crude oil refineries [33] and by Haldor Topsøe (namely the so-called TREMP) [34] which used a four-reactor cascade for also producing water steam. A similar methanation process, characterised by three adiabatic fixed-bed reactors, intermediate cooling and gas recycling was developed by British Gas (BTG) and Conoco. In 1973, the process was tested for several hundred hours at the coal gasification plant in Westfield (Scotland) [35].
Thus, to avoid gas recycling and internal reactor cooling, the Ralph M. Parsons company designed a reactor layout consisting of 4–7 adiabatic fixed-bed reactors in series. Temperature control of the exothermic reaction was guaranteed by intermediate gas coolers and a staged gas feed into the reactors. Yet, a commercial plant with this technology was not deployed.
Even though methanation has been developed by the industry for many years, the demands of a changing energy system call for a continuous optimization and, eventually, for a downsizing of methanation technologies. For those reasons, the designers’ approaches must be focused primarily on an enhancement of temperature control, cost effectiveness and methanation process flexibility. Indeed, this latter is strongly correlated to the fluctuating availability of renewable energy sources and syn-gases.
Among all the available technologies for CO2 hydrogenation, the fixed-bed reactors offer the best compromise between compact design and synthetic gas quality [36]. Nevertheless, the temperature control alongside the longitudinal axis is crucial to attain high CO2 conversion rates; moreover, the average temperature of reaction strongly influences the product gas composition which is crucial for matching the requirements for the subsequent injection of SNG into the gas grid [37].
The main difference between the methanation technologies consists of the temperature profile inside the reactor. Generally, it is possible to find three types of temperature profiles: adiabatic, isothermal and polytropic [38].
In order to empirically classify the reactors typology, Kiewidt and Thöming [39] used the Seminov number (Se) which, basically, represents the heat-production rate to cooling rate ratio. According to that definition, the adiabatic fixed-bed reactors are characterised by Se → ∞. Those reactors, without any external or integrated cooling system, typically show an almost adiabatic temperature profile with a significant hot spot in the bed and high reactor outlet temperatures. Due to the fact that catalysts cannot withstand temperatures above 550–700 °C, steam addition and gas recirculation are very often required [34,35]. The main advantages consist of accomplishing high reaction rates and the possibility to produce high-temperature steam. Yet, the process setup is relatively complex.
When Se → 0, that implies the reactors are isothermal, such as the fluidized-bed reactors and three-phase reactors. The process temperatures are lower; therefore, the catalysts are less thermally stressed, and the reactors’ layout is strongly simplified. Unfortunately, the isothermal operation leads to limited reaction rates and, especially for fluidized-bed reactors, a significant catalyst consumption occurs owing to the friction.
In the end, when 0 < Se < 1, reactors can be considered polytropic. In that case, the cooled fixed-bed reactors as well as the structured ones (e.g., microchannel, honeycomb) usually show a hot spot near the reactants inlet. When comparing those ones to adiabatic reactors, however, it emerges that the hot spot temperatures are significantly lower, as well as the outlet product’s temperature, which typically is close to 300 °C.
Such polytropic reactors combine the strength points of the isothermal and the adiabatic reactors. Furthermore, the moderate hot spot values favour higher reaction rates, whilst the lower temperature downstream of the reactor allows high conversion rates with respect to thermodynamic limits.
Having said this, for the purpose of this study, polytropic reactors suitable for small scale applications have been assumed as a reference in the calculations.

1.2. Scope of the Work

The aim of the present work is to assess the potential role of the Power-to-Methane strategy to integrate RES generation in urban energy districts.
In detail, this paper analyses SNG production by means of local RES excess in the context of residential energy communities.
In Section 2, materials and methods applied in the present work have been presented. In Section 3, the outcomes of the analyses have been reported and discussed. Finally, in Section 4, the main findings have been summarised.

2. Materials and Methods

In order to investigate the potential role of the Power-to-Methane strategy to integrate renewable generation and decarbonise the gas grid, a residential energy district was considered as a case study.
A preliminary analysis was carried out by implementing a PV system in the energy district. The aforementioned analysis was performed by changing the PV peak power. Two PV configurations were chosen in order to evaluate the SNG production under different RES excess conditions.
Thereafter, SNG production was evaluated in the two configurations by varying the size of the electrolyser and methanation reactor. By changing the rated power of the Power-to-Methane system, the self-consumption ratio, SNG production and its cost were calculated. Some significant configurations were chosen for comparison in energy and economic terms and a sensitivity analysis, driven by the energy carrier prices modifications, was carried out.

2.1. Case Study

The case study was a residential energy district located in Rome. It consisted of 20 buildings with a total of 200 dwellings. The electrical loads were modelled on the basis of Ref. [40], where average hourly profiles were defined according to different archetypes. Four of those archetypes were chosen to model the electrical demand in the present work. In addition, the overall heat demand was estimated in accordance with Ref. [41]. The heating demand profiles were considered in accordance with the database of the Hotmaps Project [42].
The electricity and heating needs for each dwelling archetype and the energy district are reported in Table 1.
The system analysed involved the implementation of a PV plant in the energy district. The RES excess was converted by means of an electrolyser into hydrogen, which was combined with CO2 by means of a methanation fixed bed catalytic reactor for producing SNG. In Figure 1, the block diagram of energy system configuration is depicted.

2.2. Energy Model

To simulate the energy system, a dynamic model of the urban district was implemented in MATLAB-Simulink environment. The simulations were carried out in hourly steps over one year time span. The balance equations governing the energy flows read as follows:
P E L L o a d , t P P V , t { i f > 0 t h e n = P D e m a n d , t i f < 0 t h e n = P E x c e s s , t i f = 0 t h e n = 0
If there is no energy storage system, the energy flows can be defined as:
P D e m a n d , t = P g r i d , t
P E x c e s s , t = P i n j , t
Here, i n j denotes “electricity injected into the grid” and g r i d denotes “electricity offtake from the grid”.
When Power-to-Methane system is implemented, the following equations are considered. If there was a condition of RES excess ( P L o a d P P V < 0 ), then the energy flows will read as:
P E L T , t = MIN [ P E x c e s s , t ,   P m a x , E L T ]
Moreover, the SNG production can be computed by Equation (5):
P S N G , t = P E L T , t · η M E T H
The electricity injection into the grid can be calculated according to Equation (6):
P E x c e s s , t P E L T , t = P i n j , t
Finally, the natural gas consumption can be computed as follows:
P N G , t = P H e a t i n g , t η M E T H P S N G , t

2.3. Technical and Economic Indicators

Energy self-consumption plays a key role in the distributed energy systems’ implementation [43]. Indeed, the design of such systems must aim at maximising the share of self-consumed energy and thus minimise the local renewable excess [44].
To analyse this factor, a dedicated indicator was considered. The Self-Consumption Ratio (SCR) is the ratio between the energy self-consumption ( R E S C ) and the total yearly RES generation ( R E P ).
S C R = E S C E P V
The SNG production cost (CSNG) was also evaluated. The methodology of levelized cost was used, which is widely applied in the energy sector to assess and compare the generation cost of different plants.
In detail, the use of the Levelized Cost of Energy (LCOE) [45] is common. However, it has also often been used to evaluate the Levelized Cost of Hydrogen (LCOH) [46] or the Levelized Cost of Storage (LCOS) [47].
Based on that methodology, the CSNG, expressed by EUR/MWh, can be calculated as follows:
C S N G = c r f · C A P E X + C e l , E L T · E E L T + C C O 2 + C O & M E S N G
where:
CAPEX is the CAPital EXpenditure and is intended as the sum of the installation costs related to the electrolyser and the reactor for methanation;
C e l , E L T represents the cost of electricity from the PV system;
E E L T is the electricity feeding the electrolyser;
C C O 2 represents the cost of CO2;
C O & M represents the operation and maintenance costs of both electrolyser and methanation reactor.
Finally, the Annual Costs (ACs) of the urban district were assessed as the sum between the overall investments, the O&M costs and the energy vectors’ purchase ( C F u e l ).
A C = C A P E X × c r f + C O & M + C F u e l
Here, c r f is the capital recovery factor:
c r f = i × ( 1 + i ) τ ( 1 + i ) τ 1
where:
i is the interest rate of investments;
τ is the lifetime.

2.4. Technical and Economic Assumptions

The main assumptions on CAPEX, O&M costs and lifetime of the applied components are reported in Table 2.
Stack replacement costs were considered. A cost equal to 50% of initial CAPEX, after 10 years, was considered for the stack replacement of alkaline electrolysers [52].
Furthermore, an electricity consumption equal to 0.013 GJel/GJSNG is required for producing SNG [50] and the assumed efficiency of NG boiler is equal to 0.92 [53]. In the present work, an external cost for the purchase of CO2 was considered. According to Ref. [50 of the revised manuscript], the CO2 cost, due to transport and storage for usage in electro-fuel synthesis, is equal to 20 EUR/tCO2 [50].
The catalyst used inside the reactor is Ni/Al2O3, 50% Wt. A specific mass of catalyst equal to 4.26 kg/m3CO2/h was considered to calculate the mass required for the methanation reactor. Such a mass has to be replaced after two years of operation on average, depending on the number of start-ups and shutdowns of reactors, and having considered a pick operating temperature lower than 500 °C. The specific catalyst cost was assumed equal to 32.2 EUR/kg [54].
Moreover, all the investments were assessed considering an interest rate equal to 3%.
Finally, the energy carrier prices assumed in the present study are equal to 137 EUR/MWh and 413 EUR/MWh for natural gas and electricity, respectively [55]. Such values were in accordance with The Italian Regulatory Authority for Energy, Networks and Environment and represent the average energy prices for residential users in the second quarter of 2022. Those prices were considered in order to analyse whether the current energy price increase could benefit the cost-effectiveness of SNG production. Furthermore, those prices were discussed with a dedicated sensitivity analysis in order to assess the cost-effectiveness of the configurations in different energy market situations.

3. Results and Discussion

A PV system was implemented in the residential urban district by changing the peak power; thus, two PV scenarios were considered for assessing the impact of the Power-to-Methane system. Then, the SNG production for exploiting the local RES excess was evaluated by varying the size of both the electrolyser and methanation reactor. Different KPIs were assessed for choosing some significant configurations, which were compared to each other. Finally, a sensitivity analysis was carried out by changing the energy carrier prices.

3.1. Preliminary Analysis

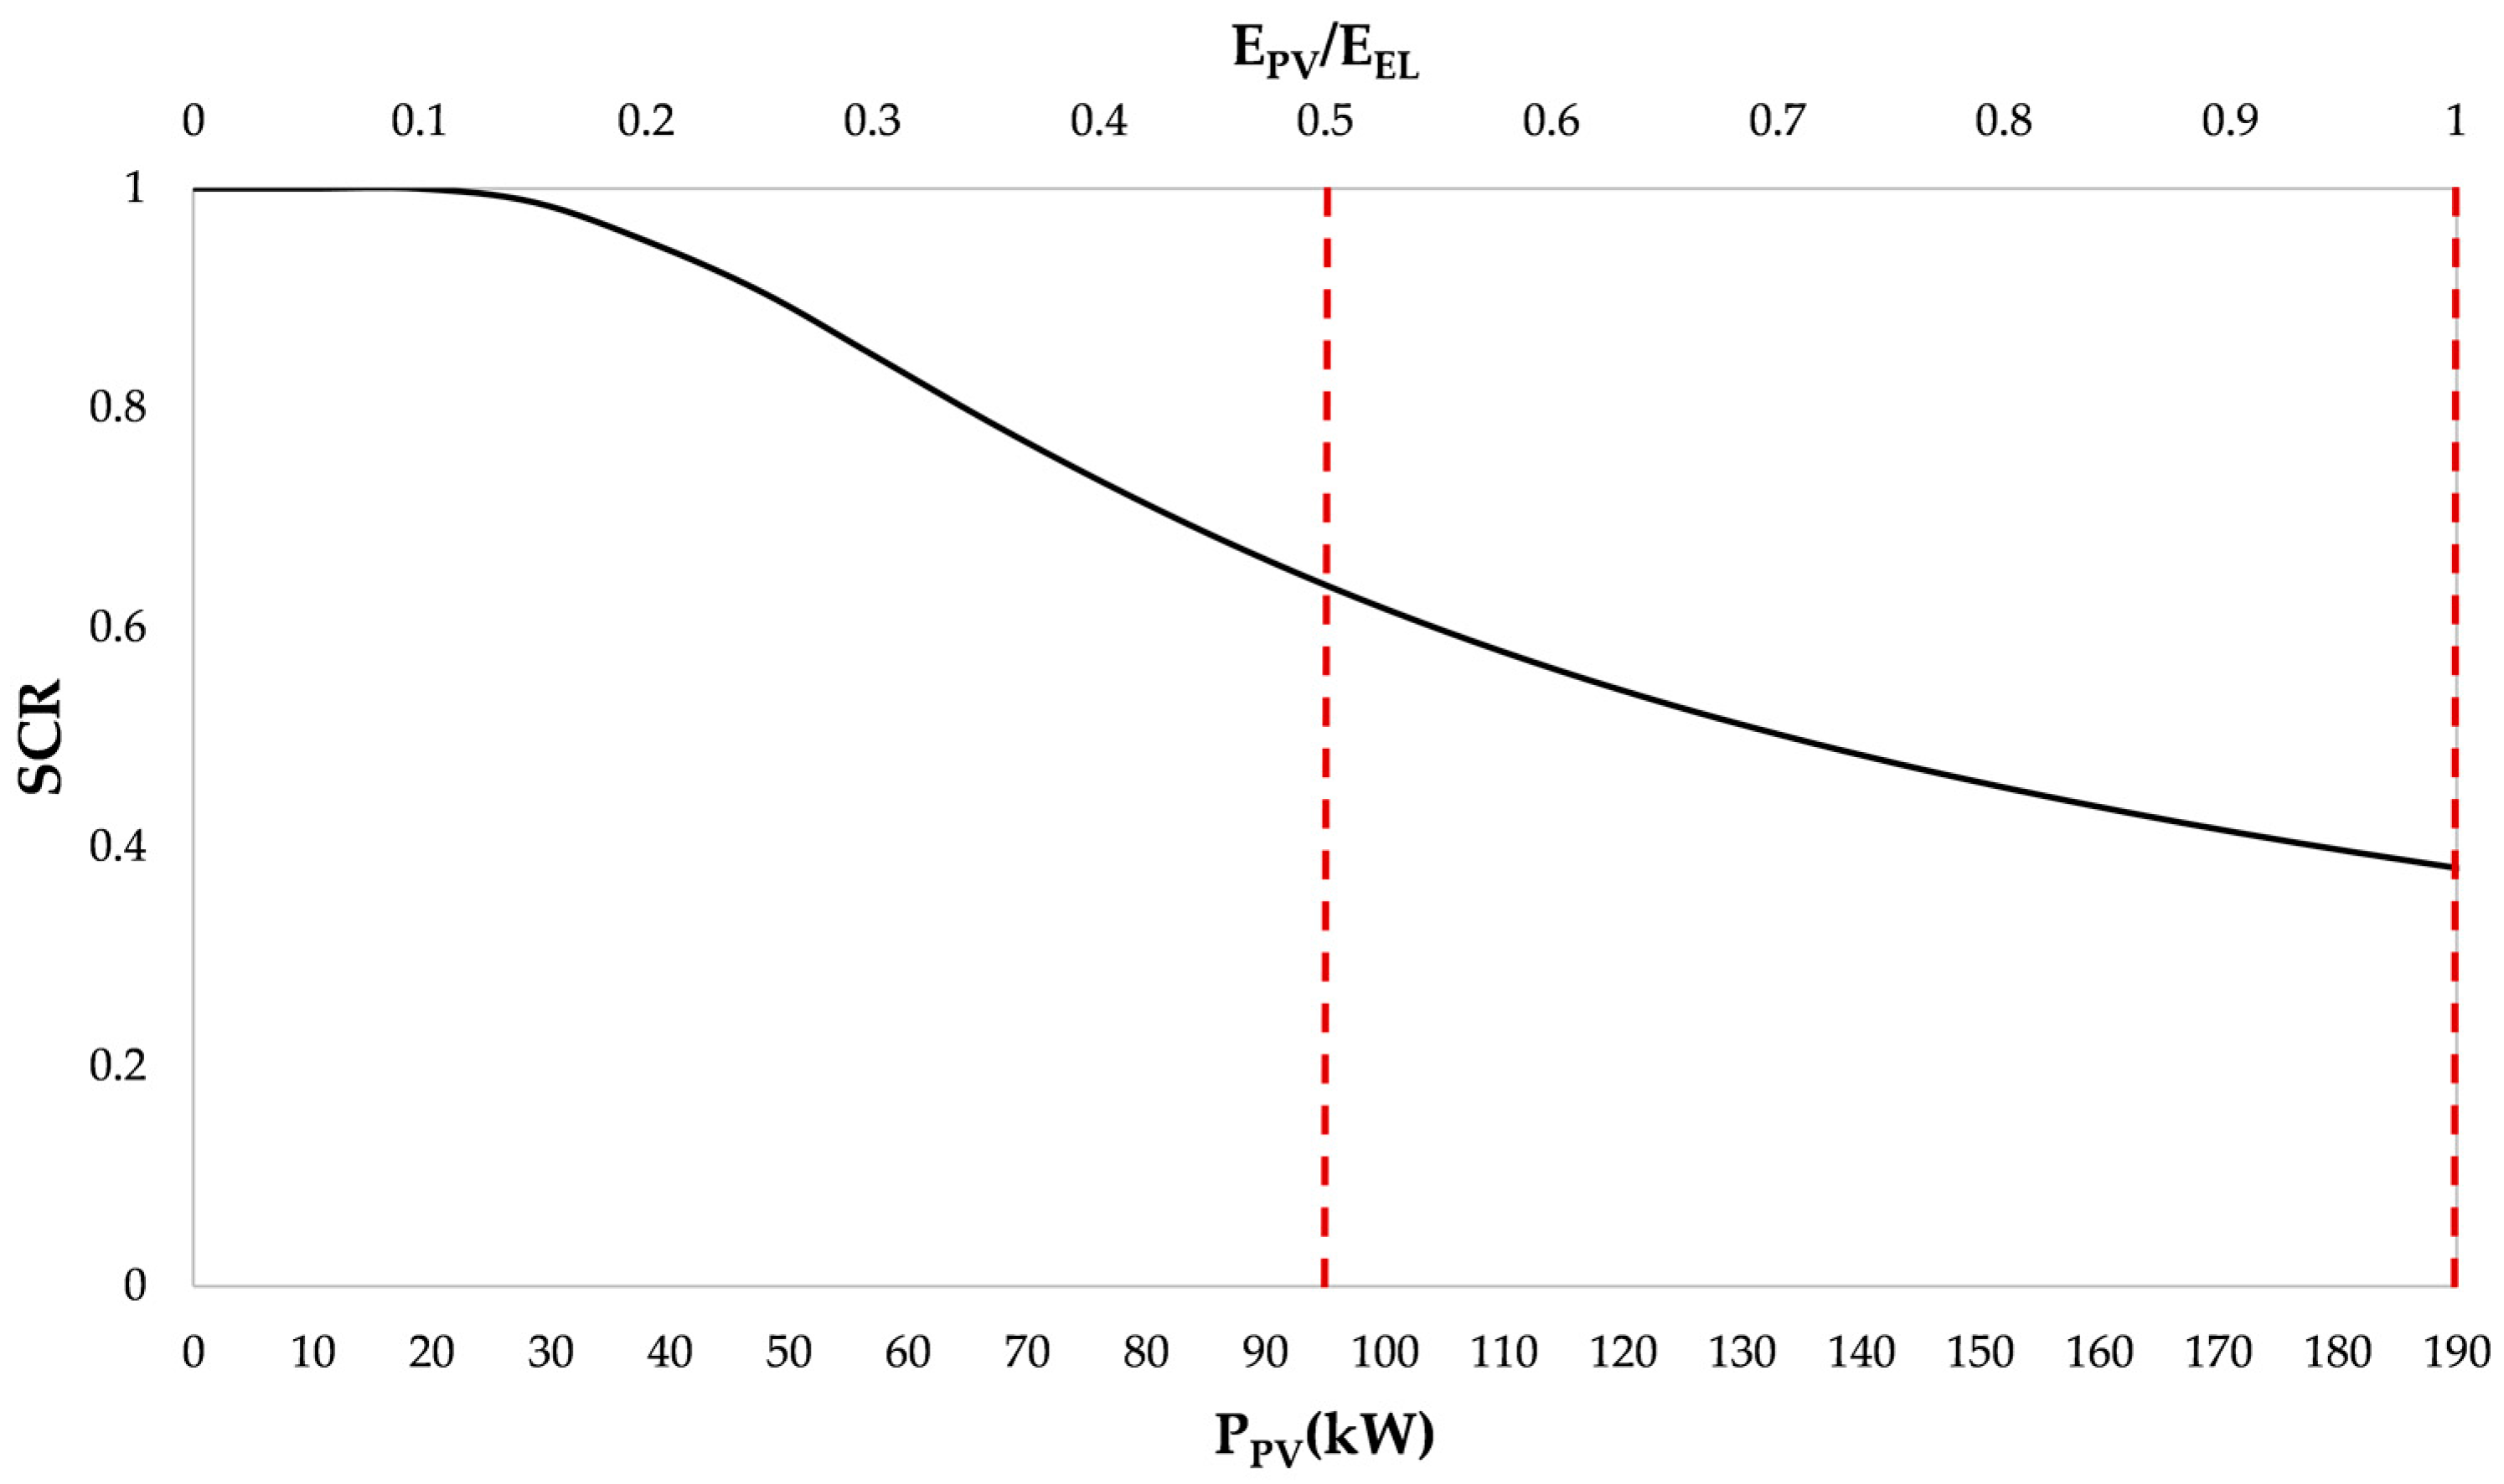
A preliminary analysis by varying the PV peak power was carried out in order to identify some significant scenarios for investigating the Power-to-Methane system application under different local RES excess conditions. In Figure 2, the SCR versus the PV peak power, along with the ratio between the energy produced by the PV system and the electricity demand of the community on yearly basis (EPV/EEL), is depicted.
Without energy storage systems, low SCR levels are achieved when large PV sizes are installed. Furthermore, when the energy produced annually by the PV system matches the community electricity demand, the SCR is approximately 0.4. Two significant PV configurations were identified for implementing the Power-to-Methane system:
  • EPV/EEL = 0.5, corresponding to a PPV of approximately 95 kW
  • EPV/EEL = 1, corresponding to a PPV of approximately 190 kW

3.2. Power-to-Methane

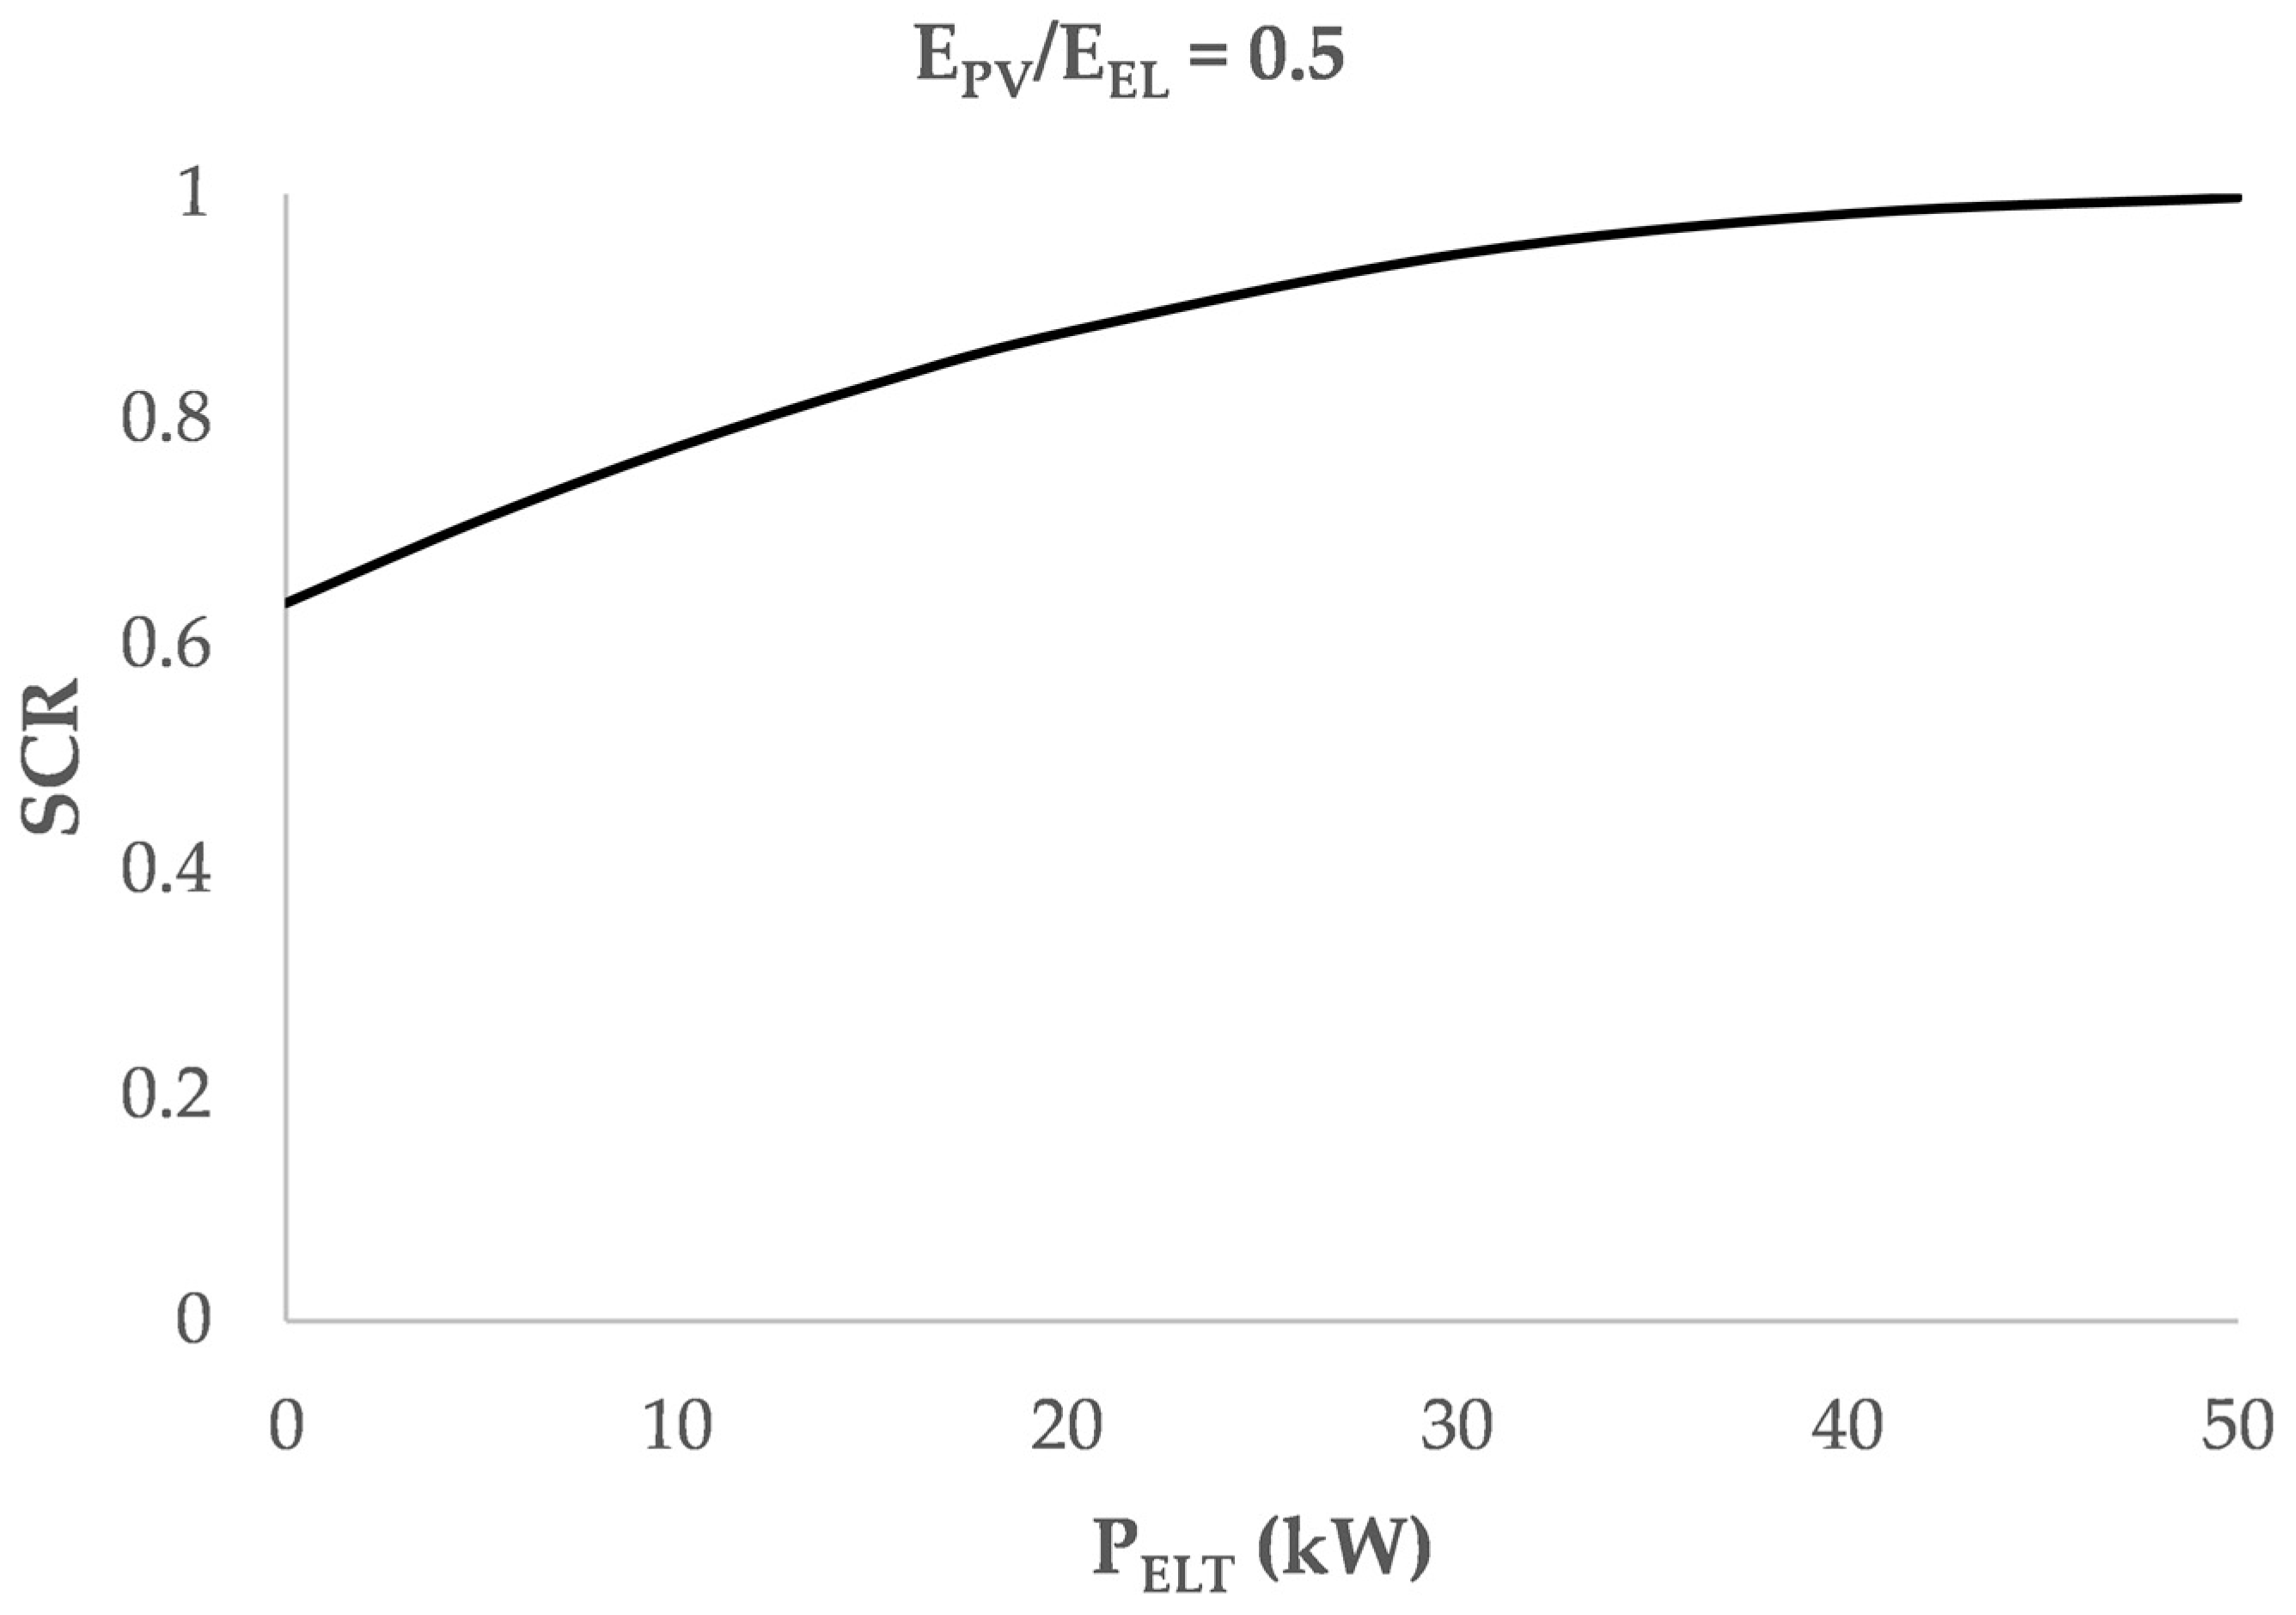
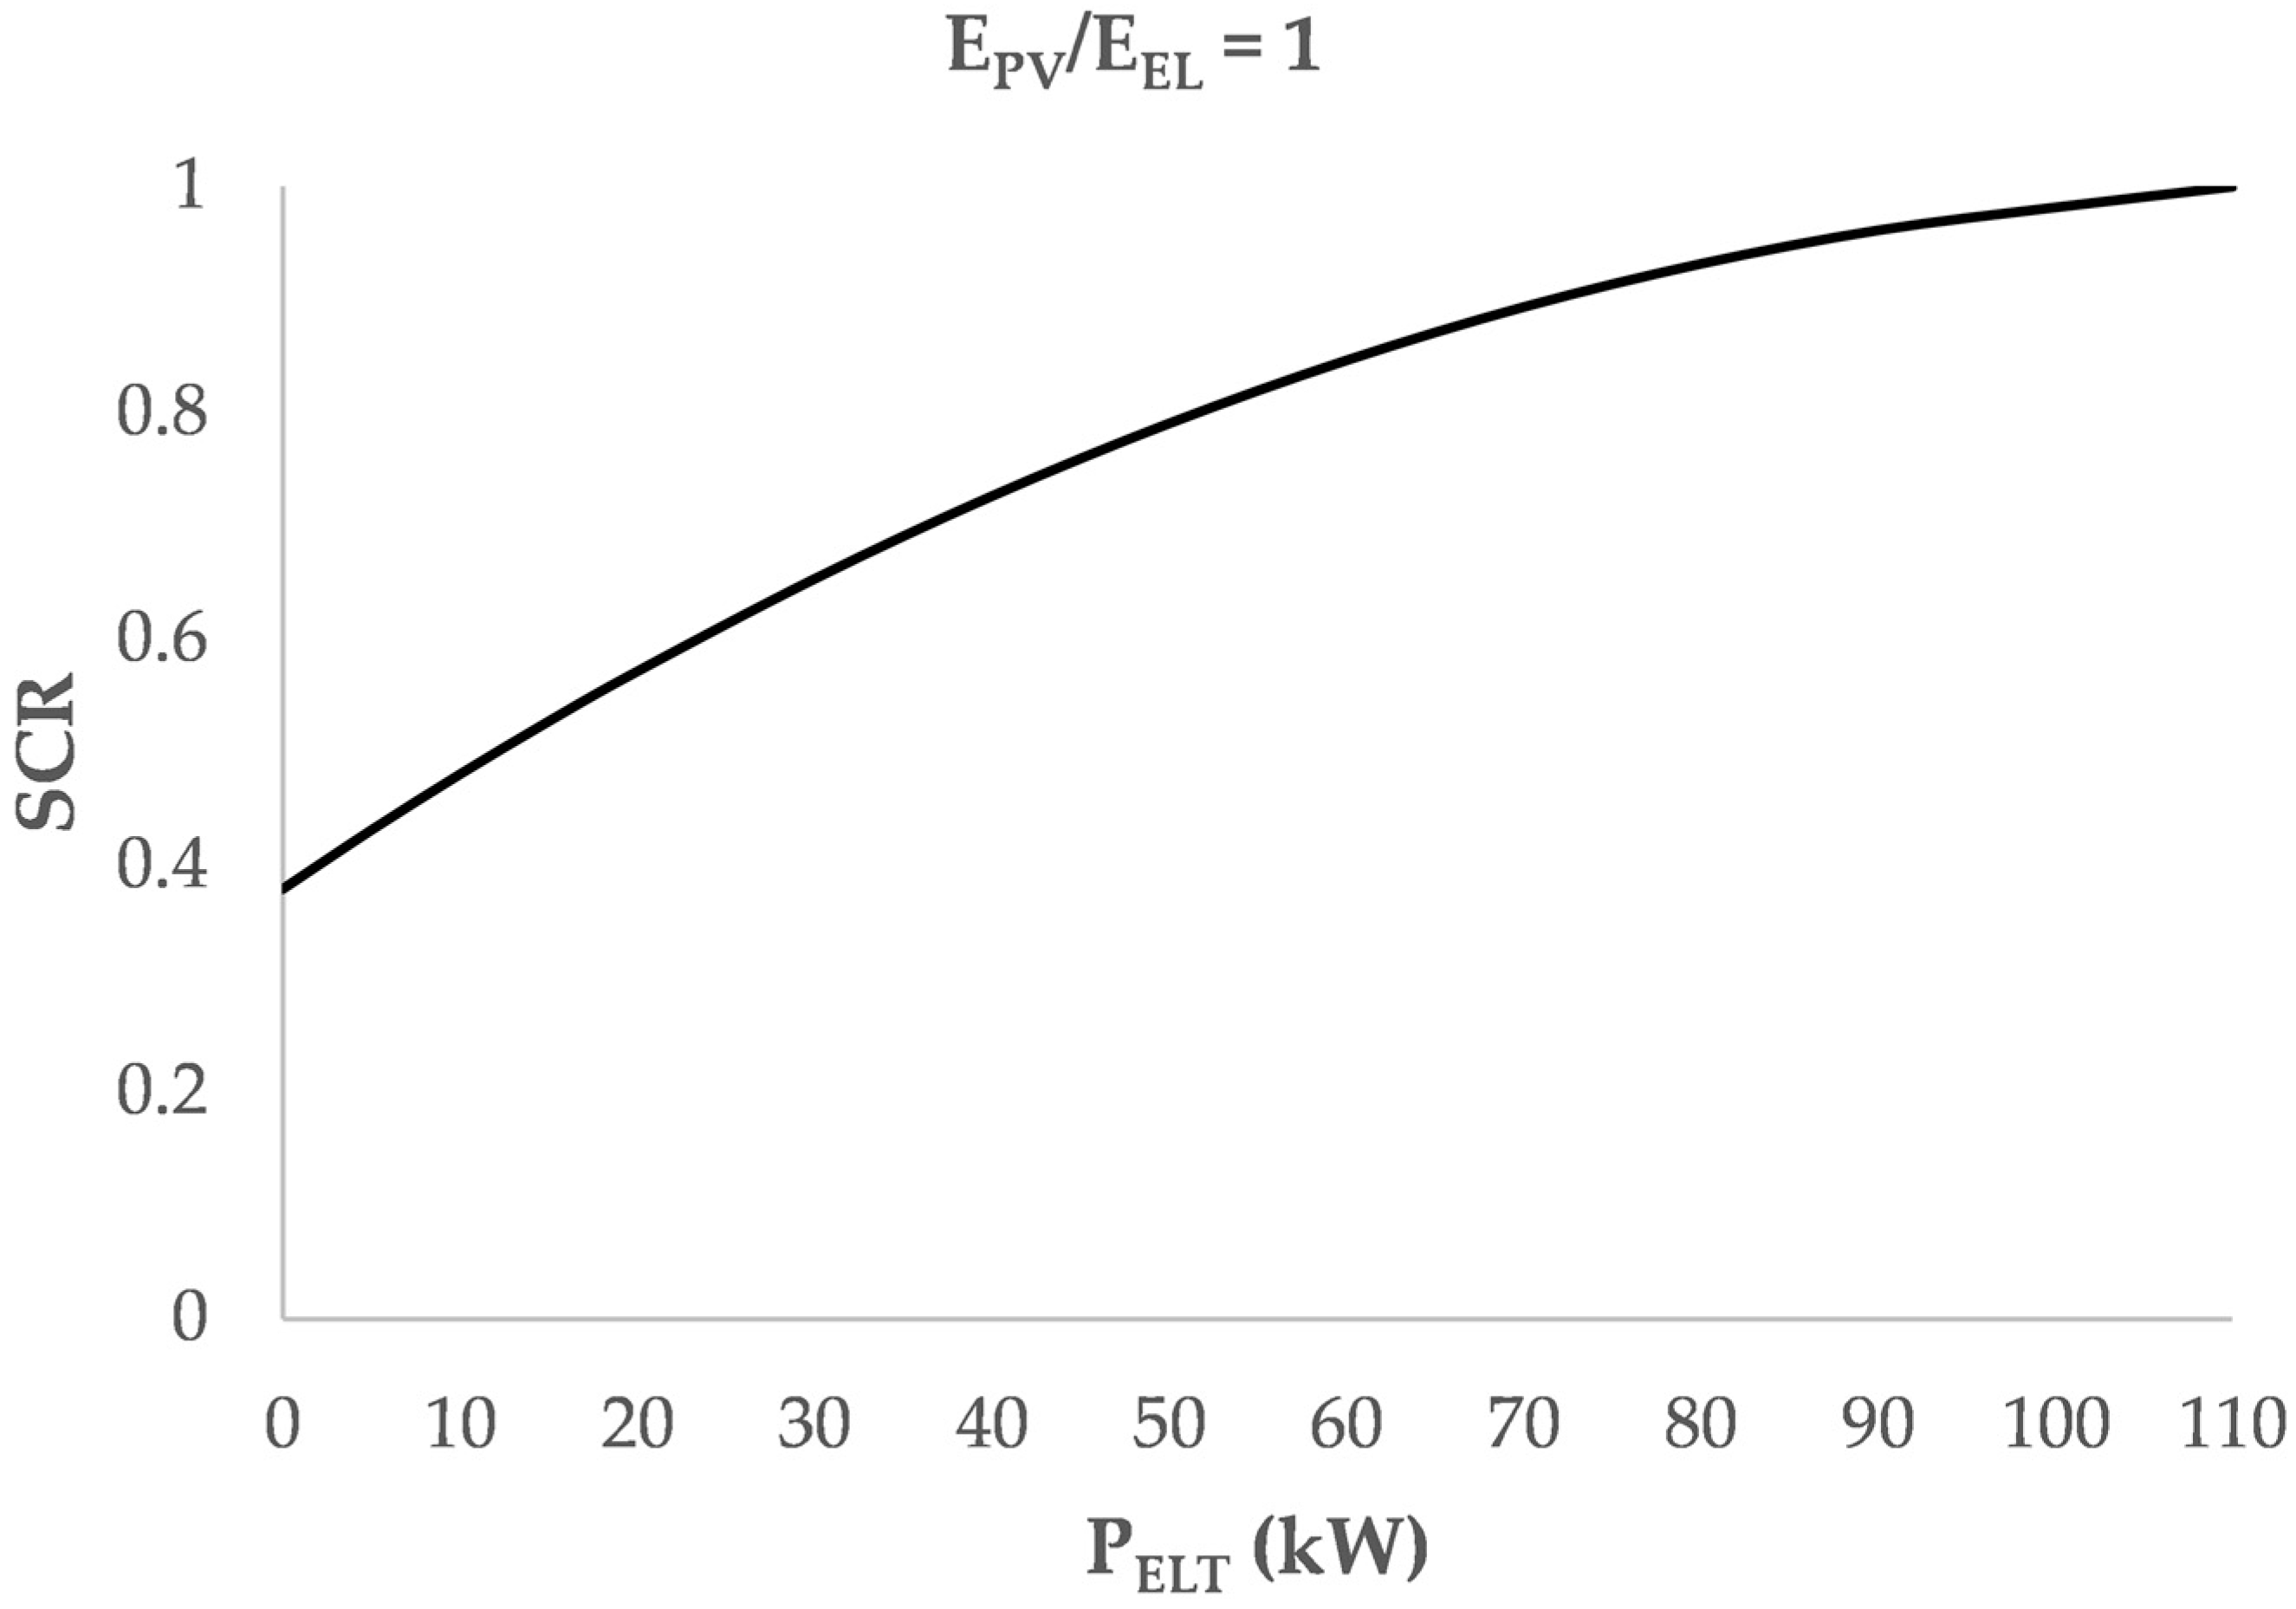
The Power-to-Methane strategy was adopted in the two PV scenarios by changing the system rated power. In Figure 3 and Figure 4, the SCR versus the rated power of electrolyser is depicted in the scenario EPV/EEL equal to 0.5 and EPV/EEL equal to 1, respectively.
The Power-to-Methane strategy allows all the RES excess to be utilised by sizing the system appropriately. Furthermore, unlike other energy storage systems, there is no limit linked to the storage size. Indeed, all the produced SNG can be fed into the gas grid, thus avoiding storage volume constraints.
In the first section, the curve has an almost linear trend in both configurations. Conversely, once high levels of SCR are reached (around 0.9), a large increase in the Power-to-Methane system size is required to absorb all the RES excess.
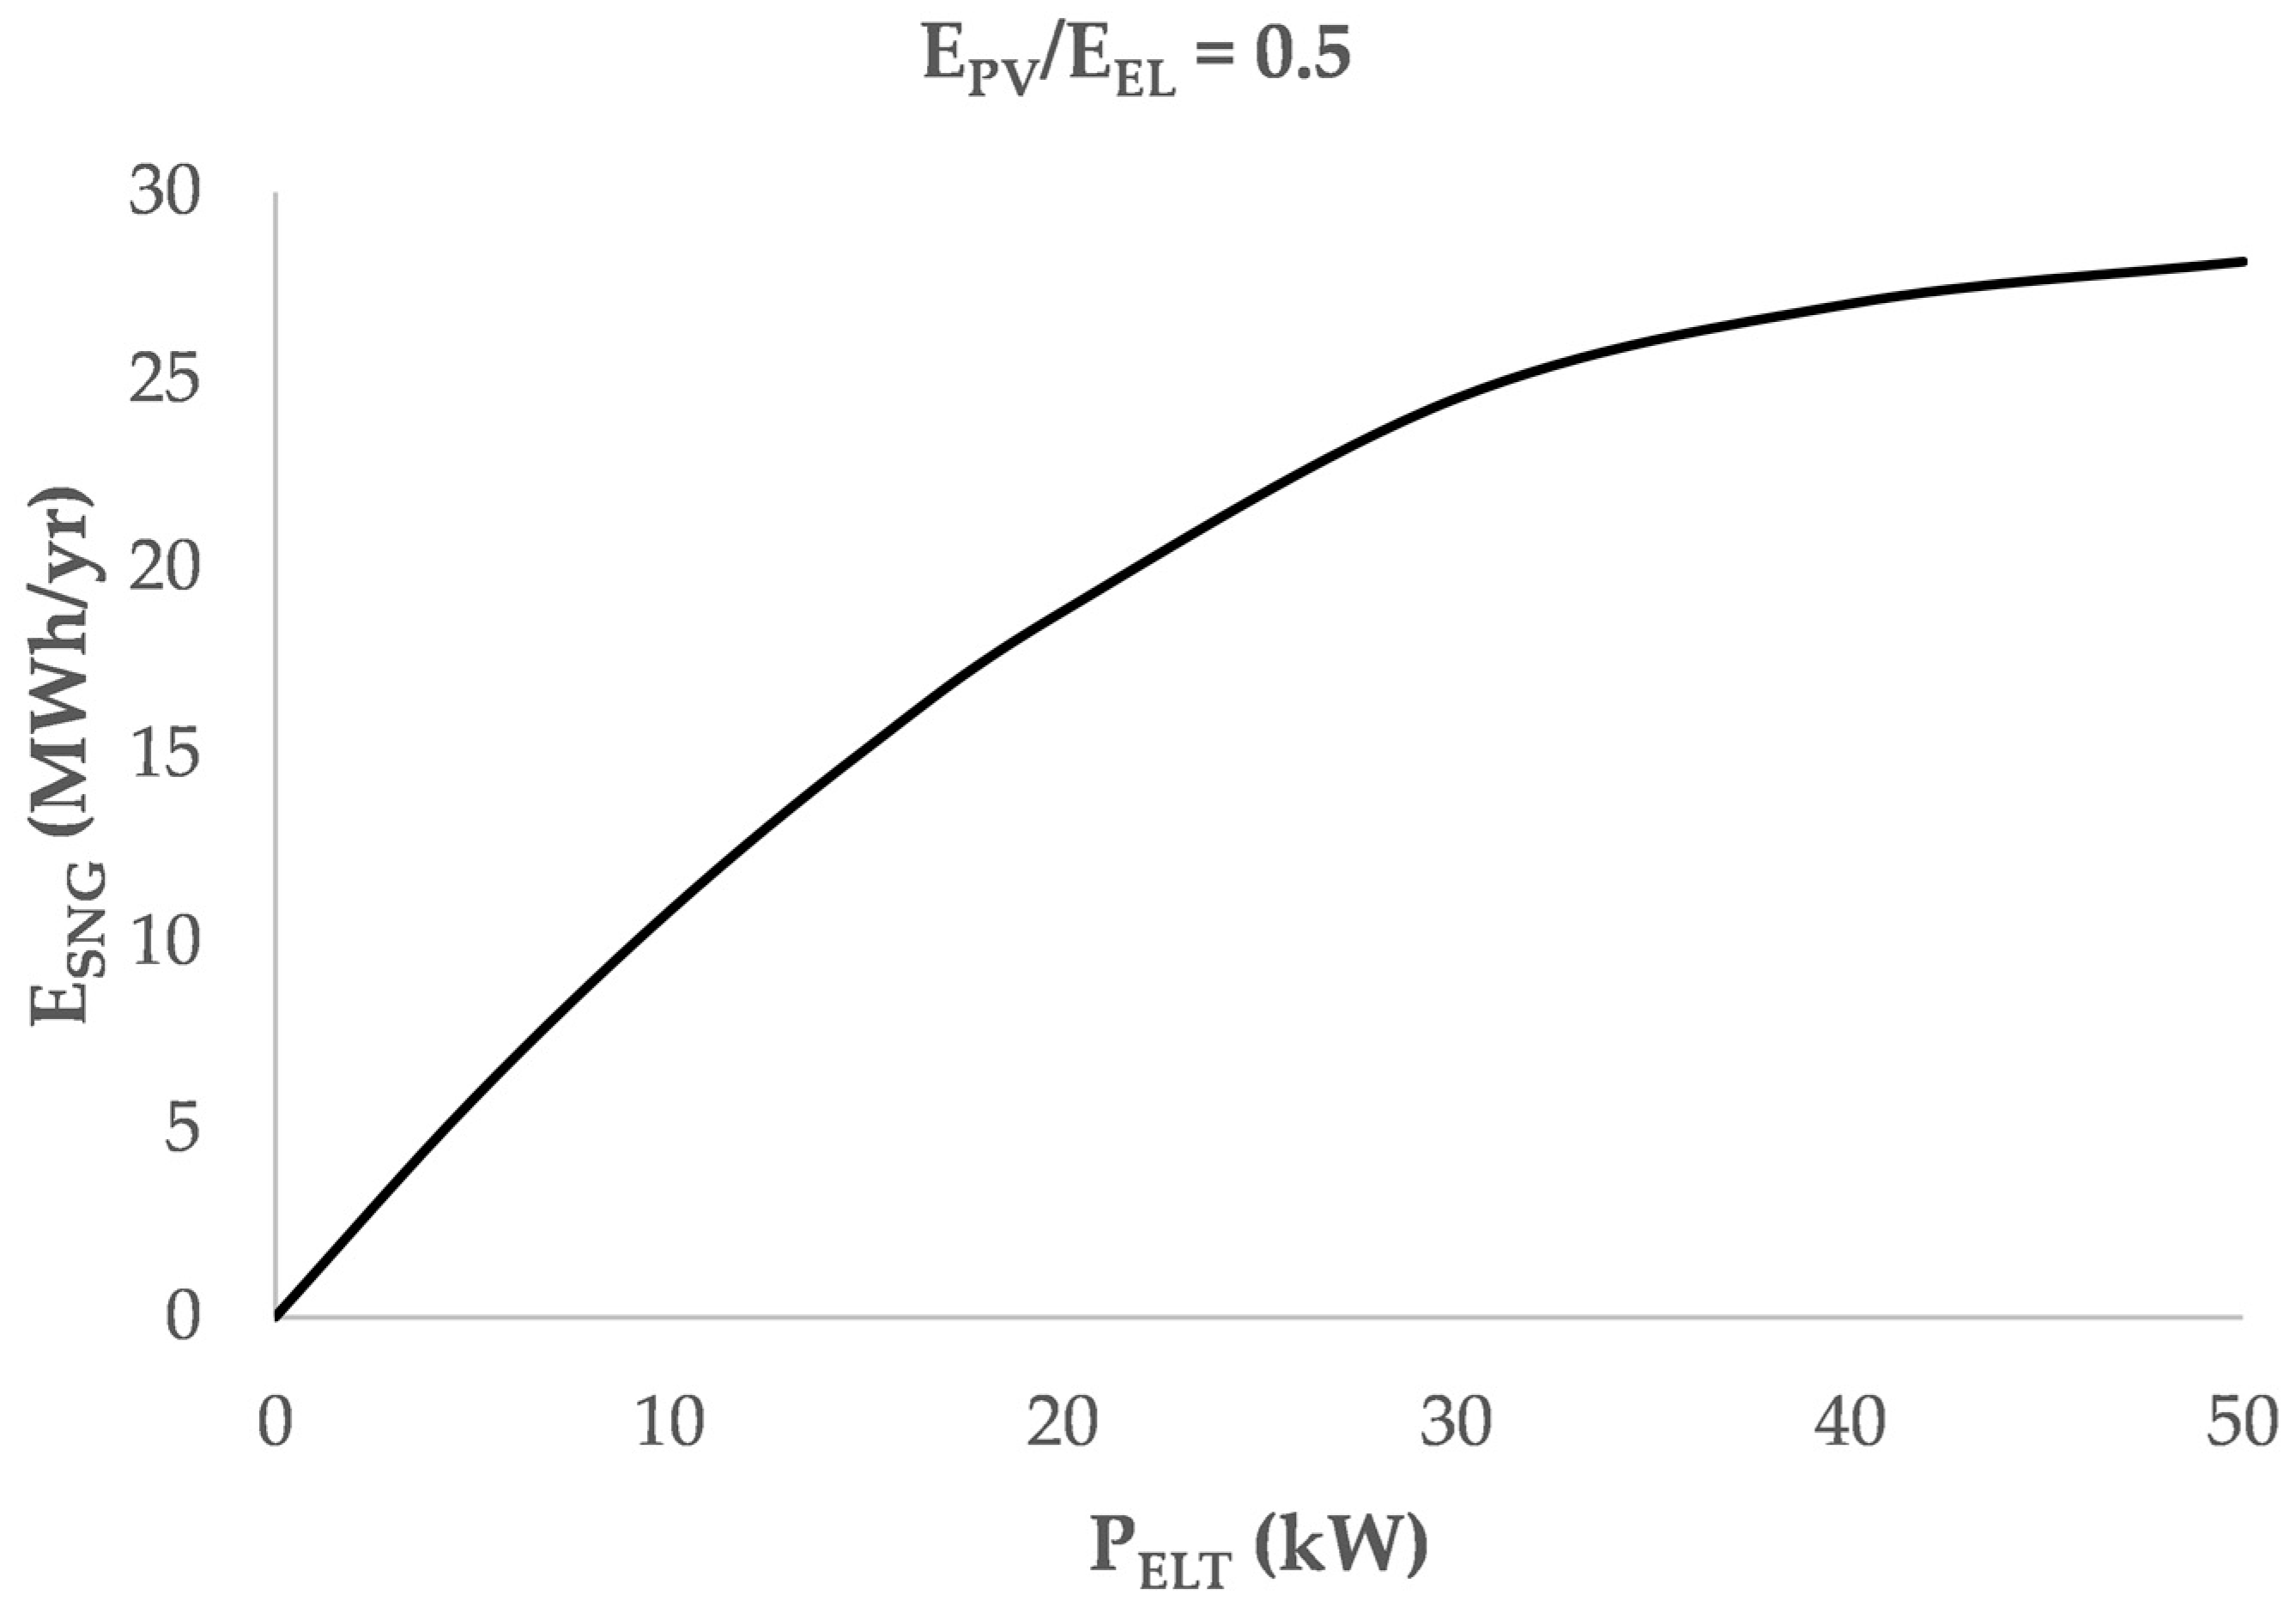
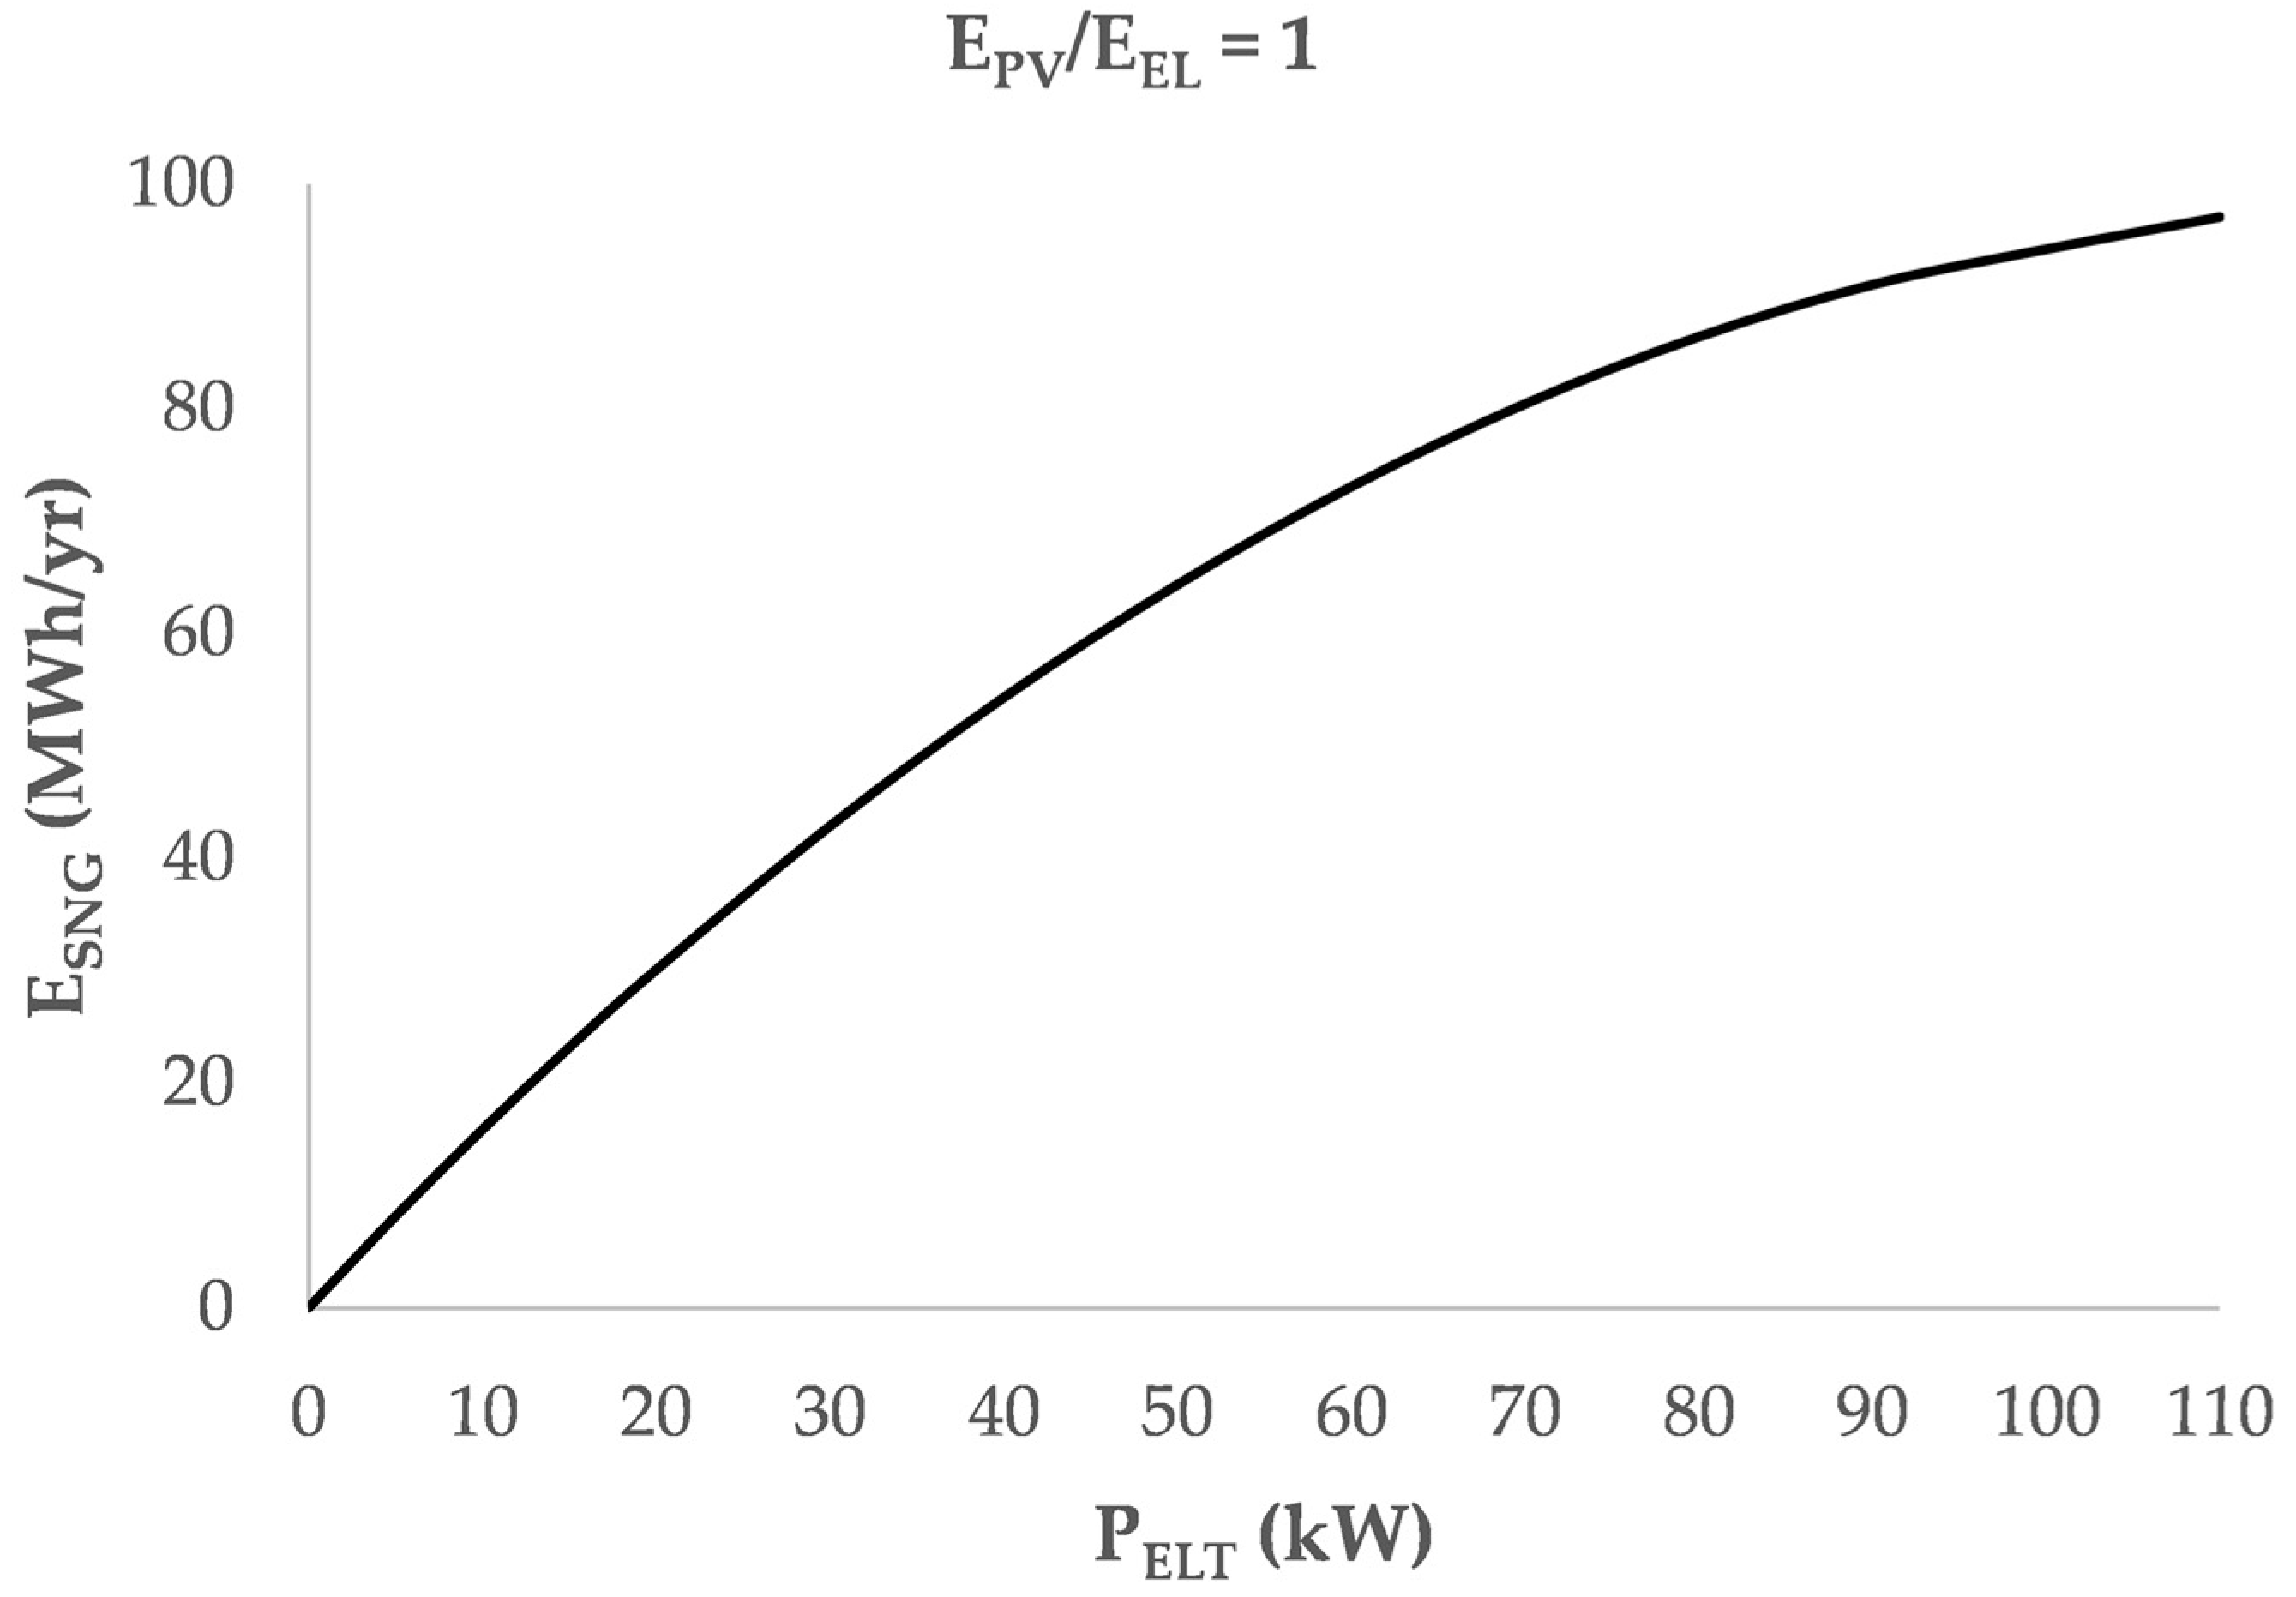
In Figure 5 and Figure 6, the annual SNG production, expressed by MWh/yr, versus the rated power of electrolyser is depicted in the scenario EPV/EEL equal to 0.5 and EPV/EEL equal to 1, respectively.
Large volumes of SNG can be produced by means of the Power-to-Methane system in both scenarios. This is due to the large amount of RES excess available for conversion. In the scenario with the EPV/EEL ratio equal to 1, approximately 110 MWh/year of electricity is self-consumed directly by the energy district. Nevertheless, almost the same amount of SNG in energy terms is producible through the Power-to-Methane system from the local excess alone. Therefore, under high-RES excess conditions, this strategy allows almost twice as much renewable generation to be integrated within the energy district, compared to the same PV configuration without storage systems.
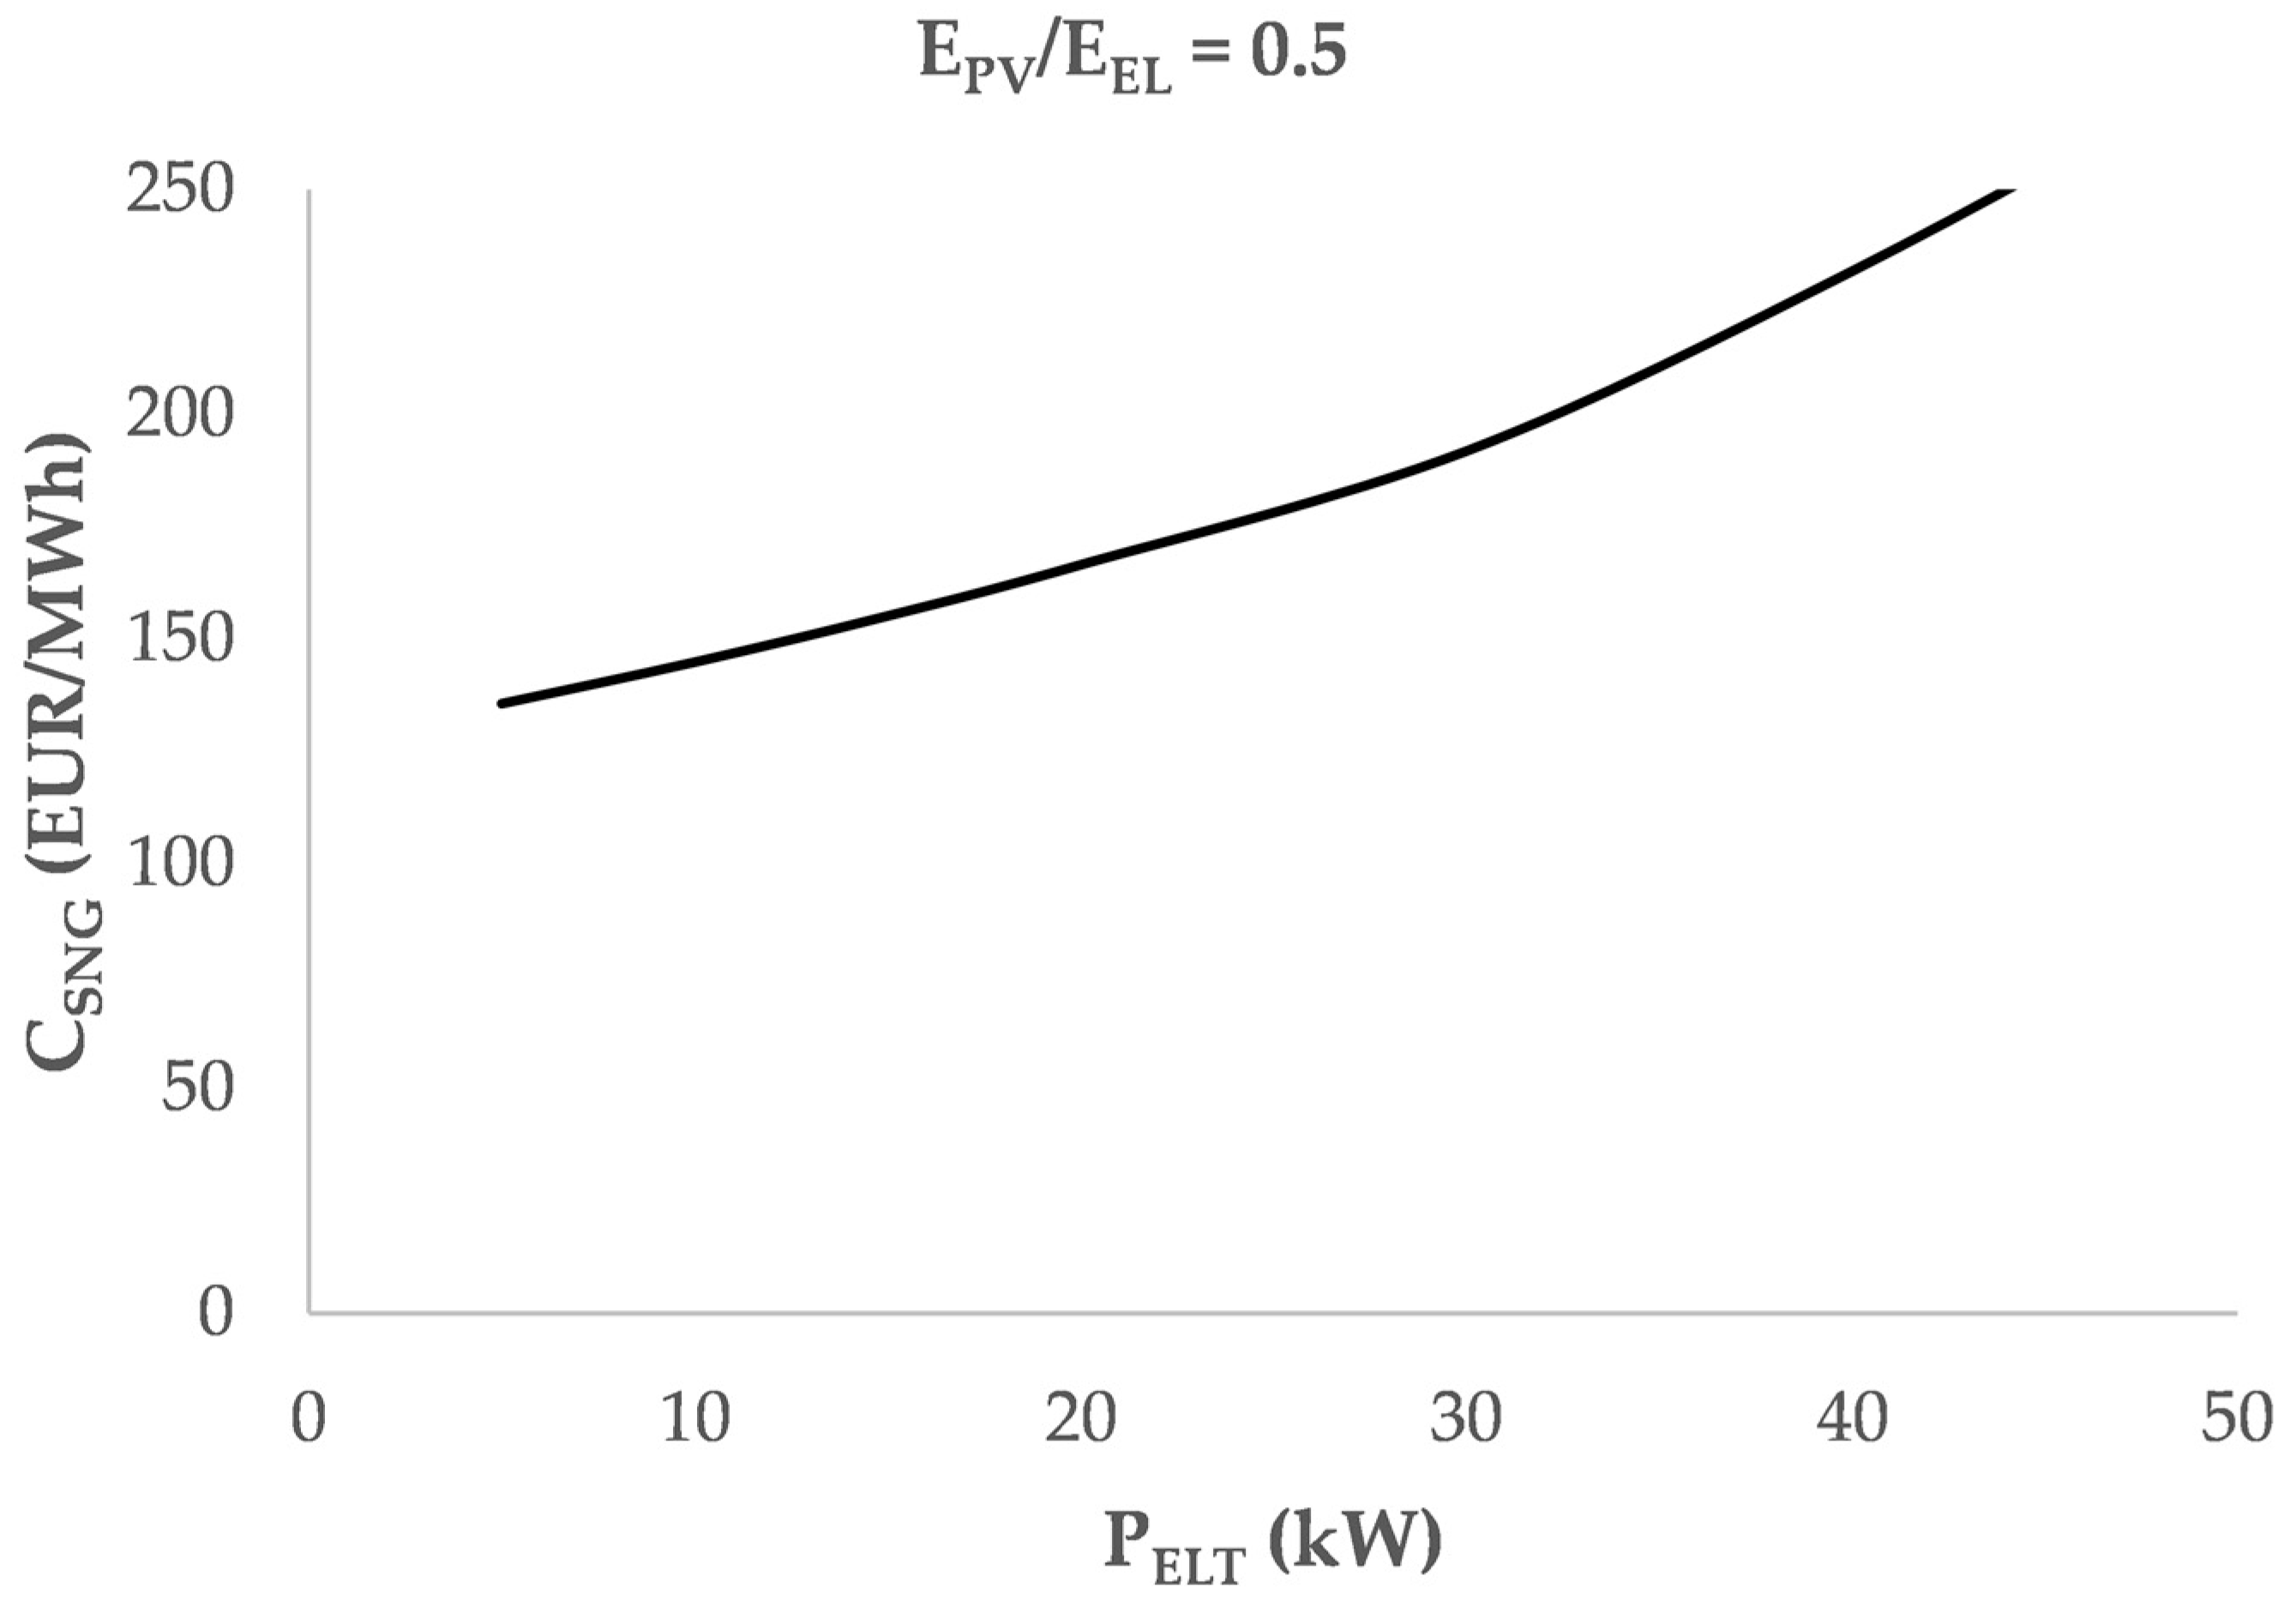
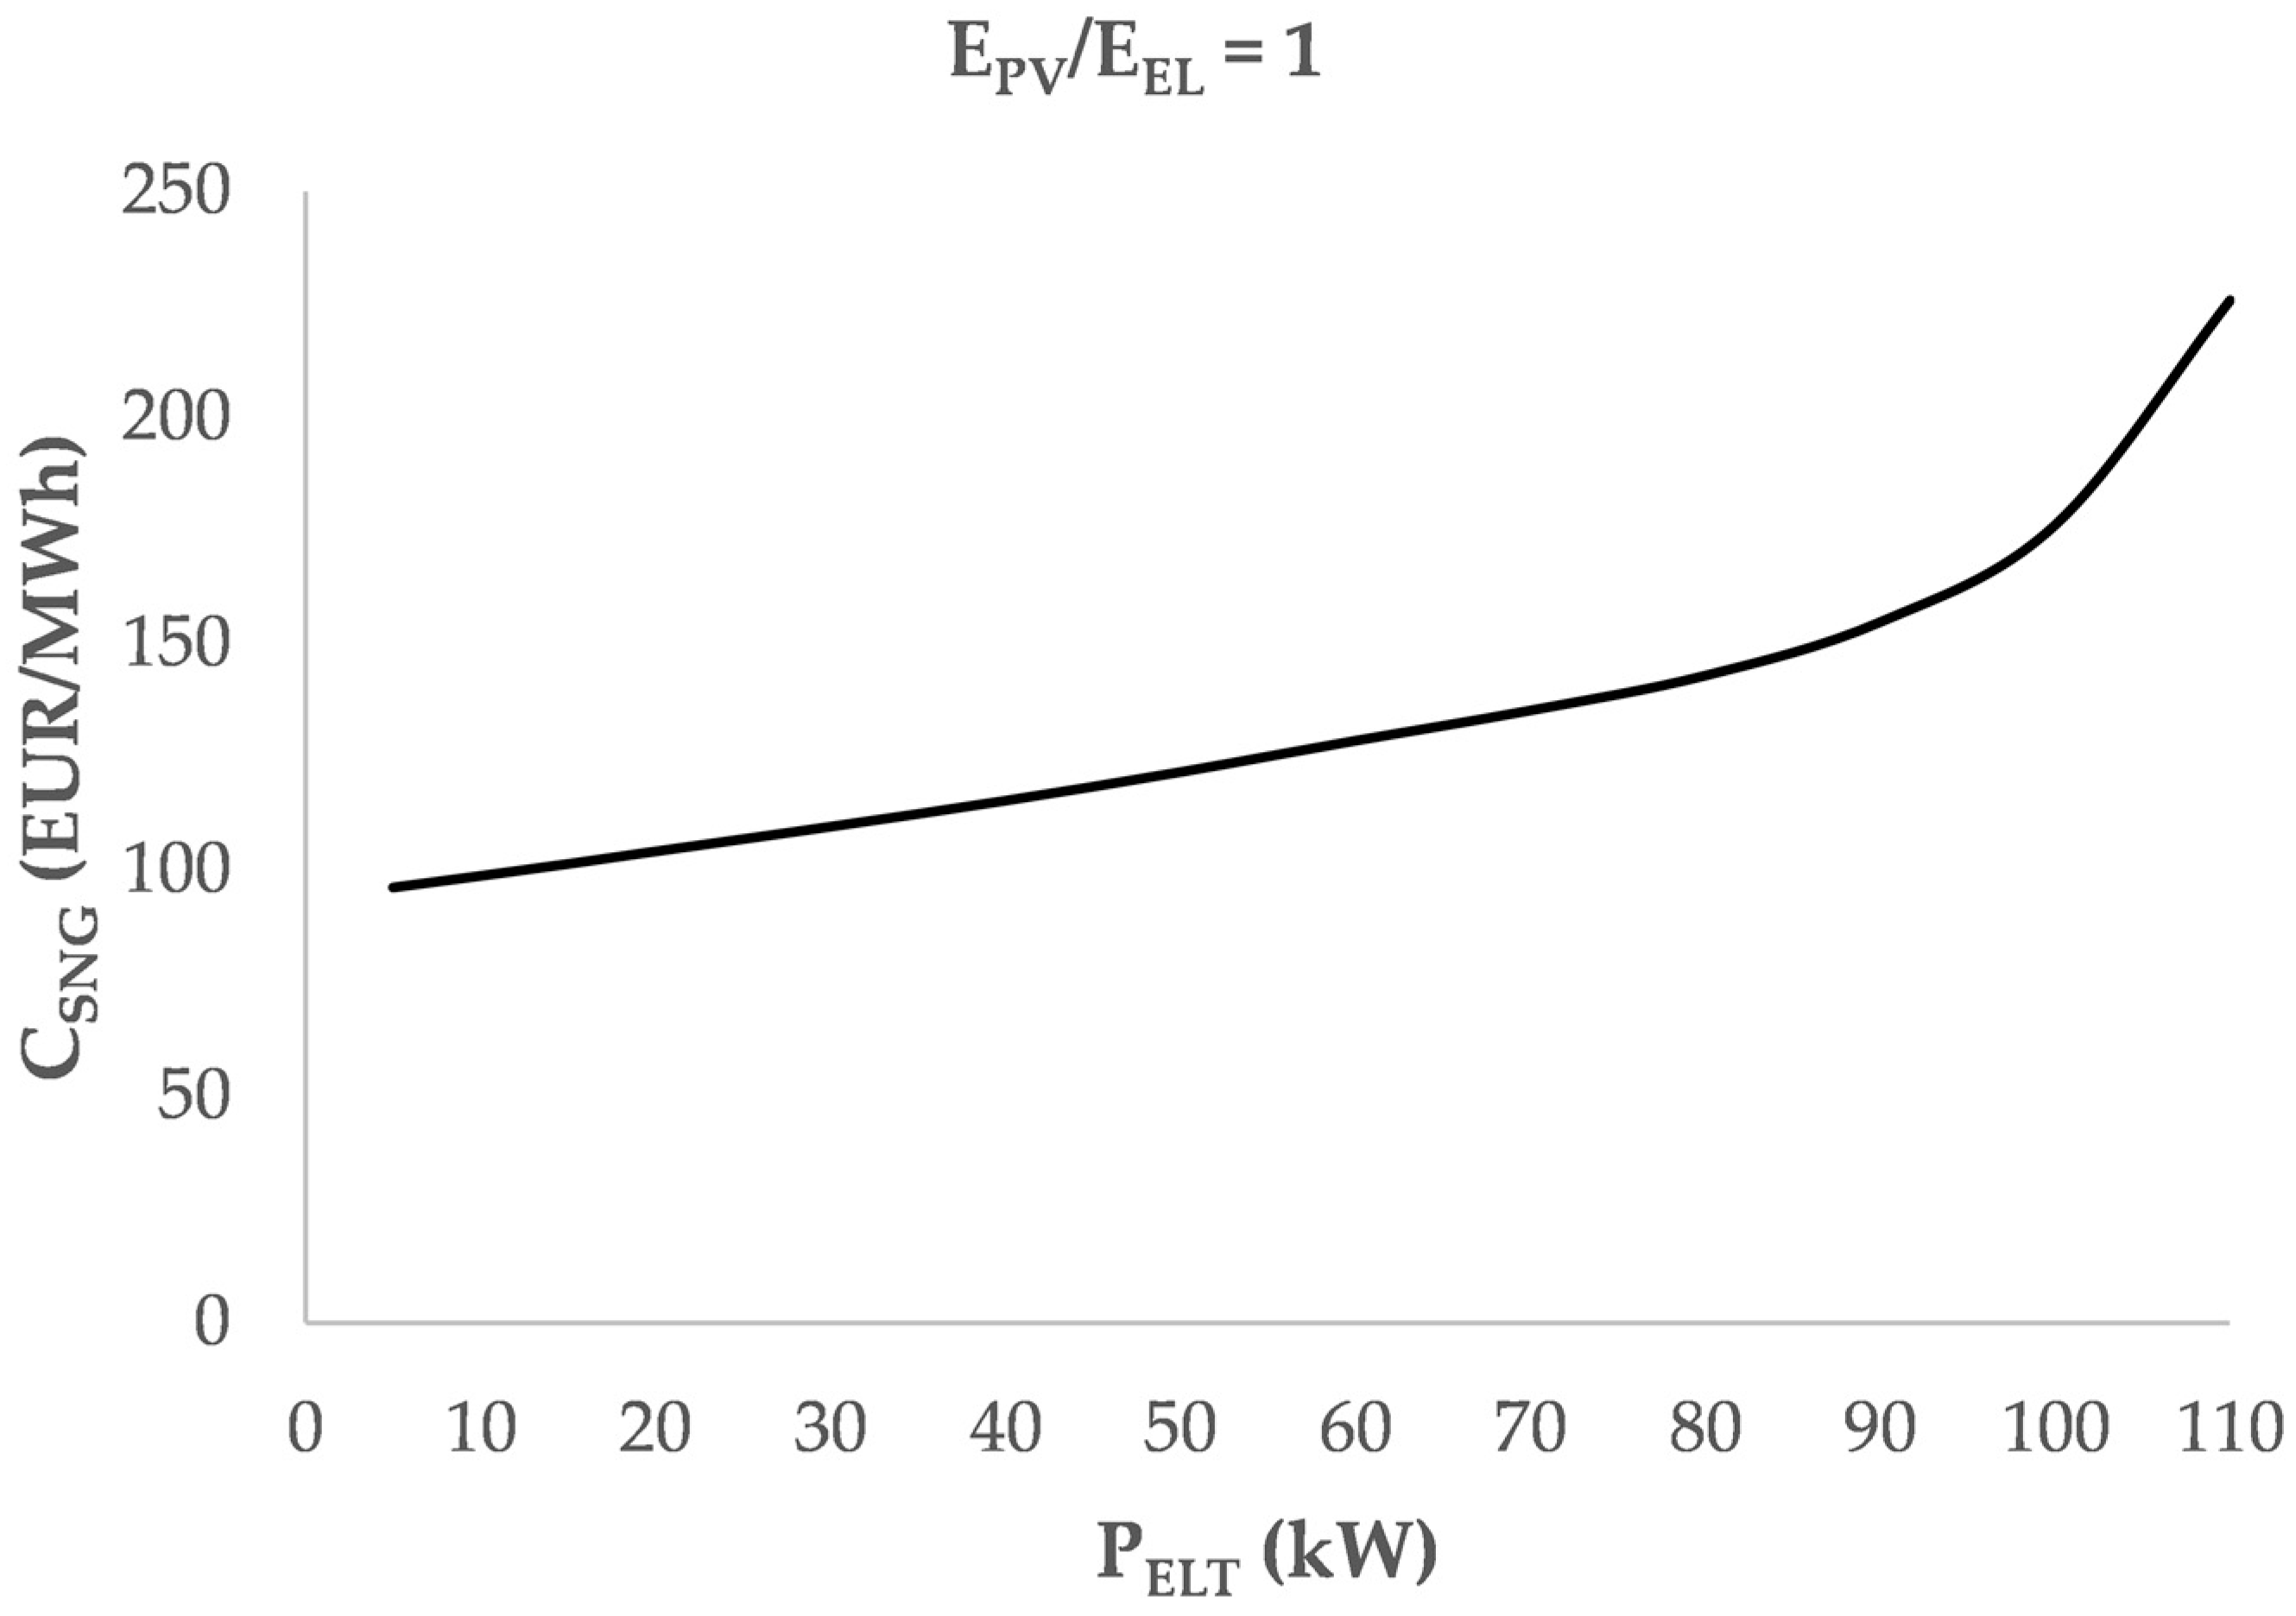
The production cost of the SNG has been analysed in the two different PV configurations. In Figure 7 and Figure 8, the SNG production cost, expressed by EUR/MWh, versus the electrolyser rated power is depicted in the scenario EPV/EEL equal to 0.5 and EPV/EEL equal to 1, respectively.
SNG production costs raise as the size of the Power-to-Methane system is larger. This is due to the fact that an increase in size reduces the system’s full load hours.
In the scenario characterised by the ratio EPV/EEL equal to 0.5, CSNG is never below 130 EUR/MWh and significant amounts can only be produced at prices above 150 EUR/MWh.
In the scenario characterised by the ratio EPV/EEL equal to 1, SNG can be produced at costs around 100 EUR/MWh. The choice of an electrolyser size of 80 kW, which is necessary for the integration of large quantities of renewables, still allows the SNG to be around 140 EUR/MWh.
Those values are significant in light of the recent European energy crisis. Indeed, gas prices on the wholesale market have risen significantly due to geopolitical tensions. The average natural gas spot price on the European market was around 30 EUR/MWh in the period from 2015 to 2019 [56]. In recent months, however, there have been monthly average prices of more than 150 EUR/MWh.
Therefore, the recent NG price increase can make the SNG’s local self-production competitive and cost-effective for urban energy districts.

3.3. Comparison between Scenarios and Sensitivity Analysis

Some significant configurations were chosen and compared to each other.
Five scenarios were considered:
  • Base Case: in the reference scenario, the electricity and natural gas demands are completely supplied by the grids; no PV systems are implemented;
  • PV 0.5: A PV system with a rated power equal to 95 kW is considered;
  • PV 0.5 + SNG: A PV system with a rated power equal to 95 kW and a Power-to-Methane system characterised by an electrolyser of 30 kW are considered;
  • PV 1: A PV system with a rated power equal to 190 kW is considered;
  • PV 1 + SNG: A PV system with a rated power equal to 190 kW and a Power-to-Methane system characterised by an electrolyser of 80 kW are considered.
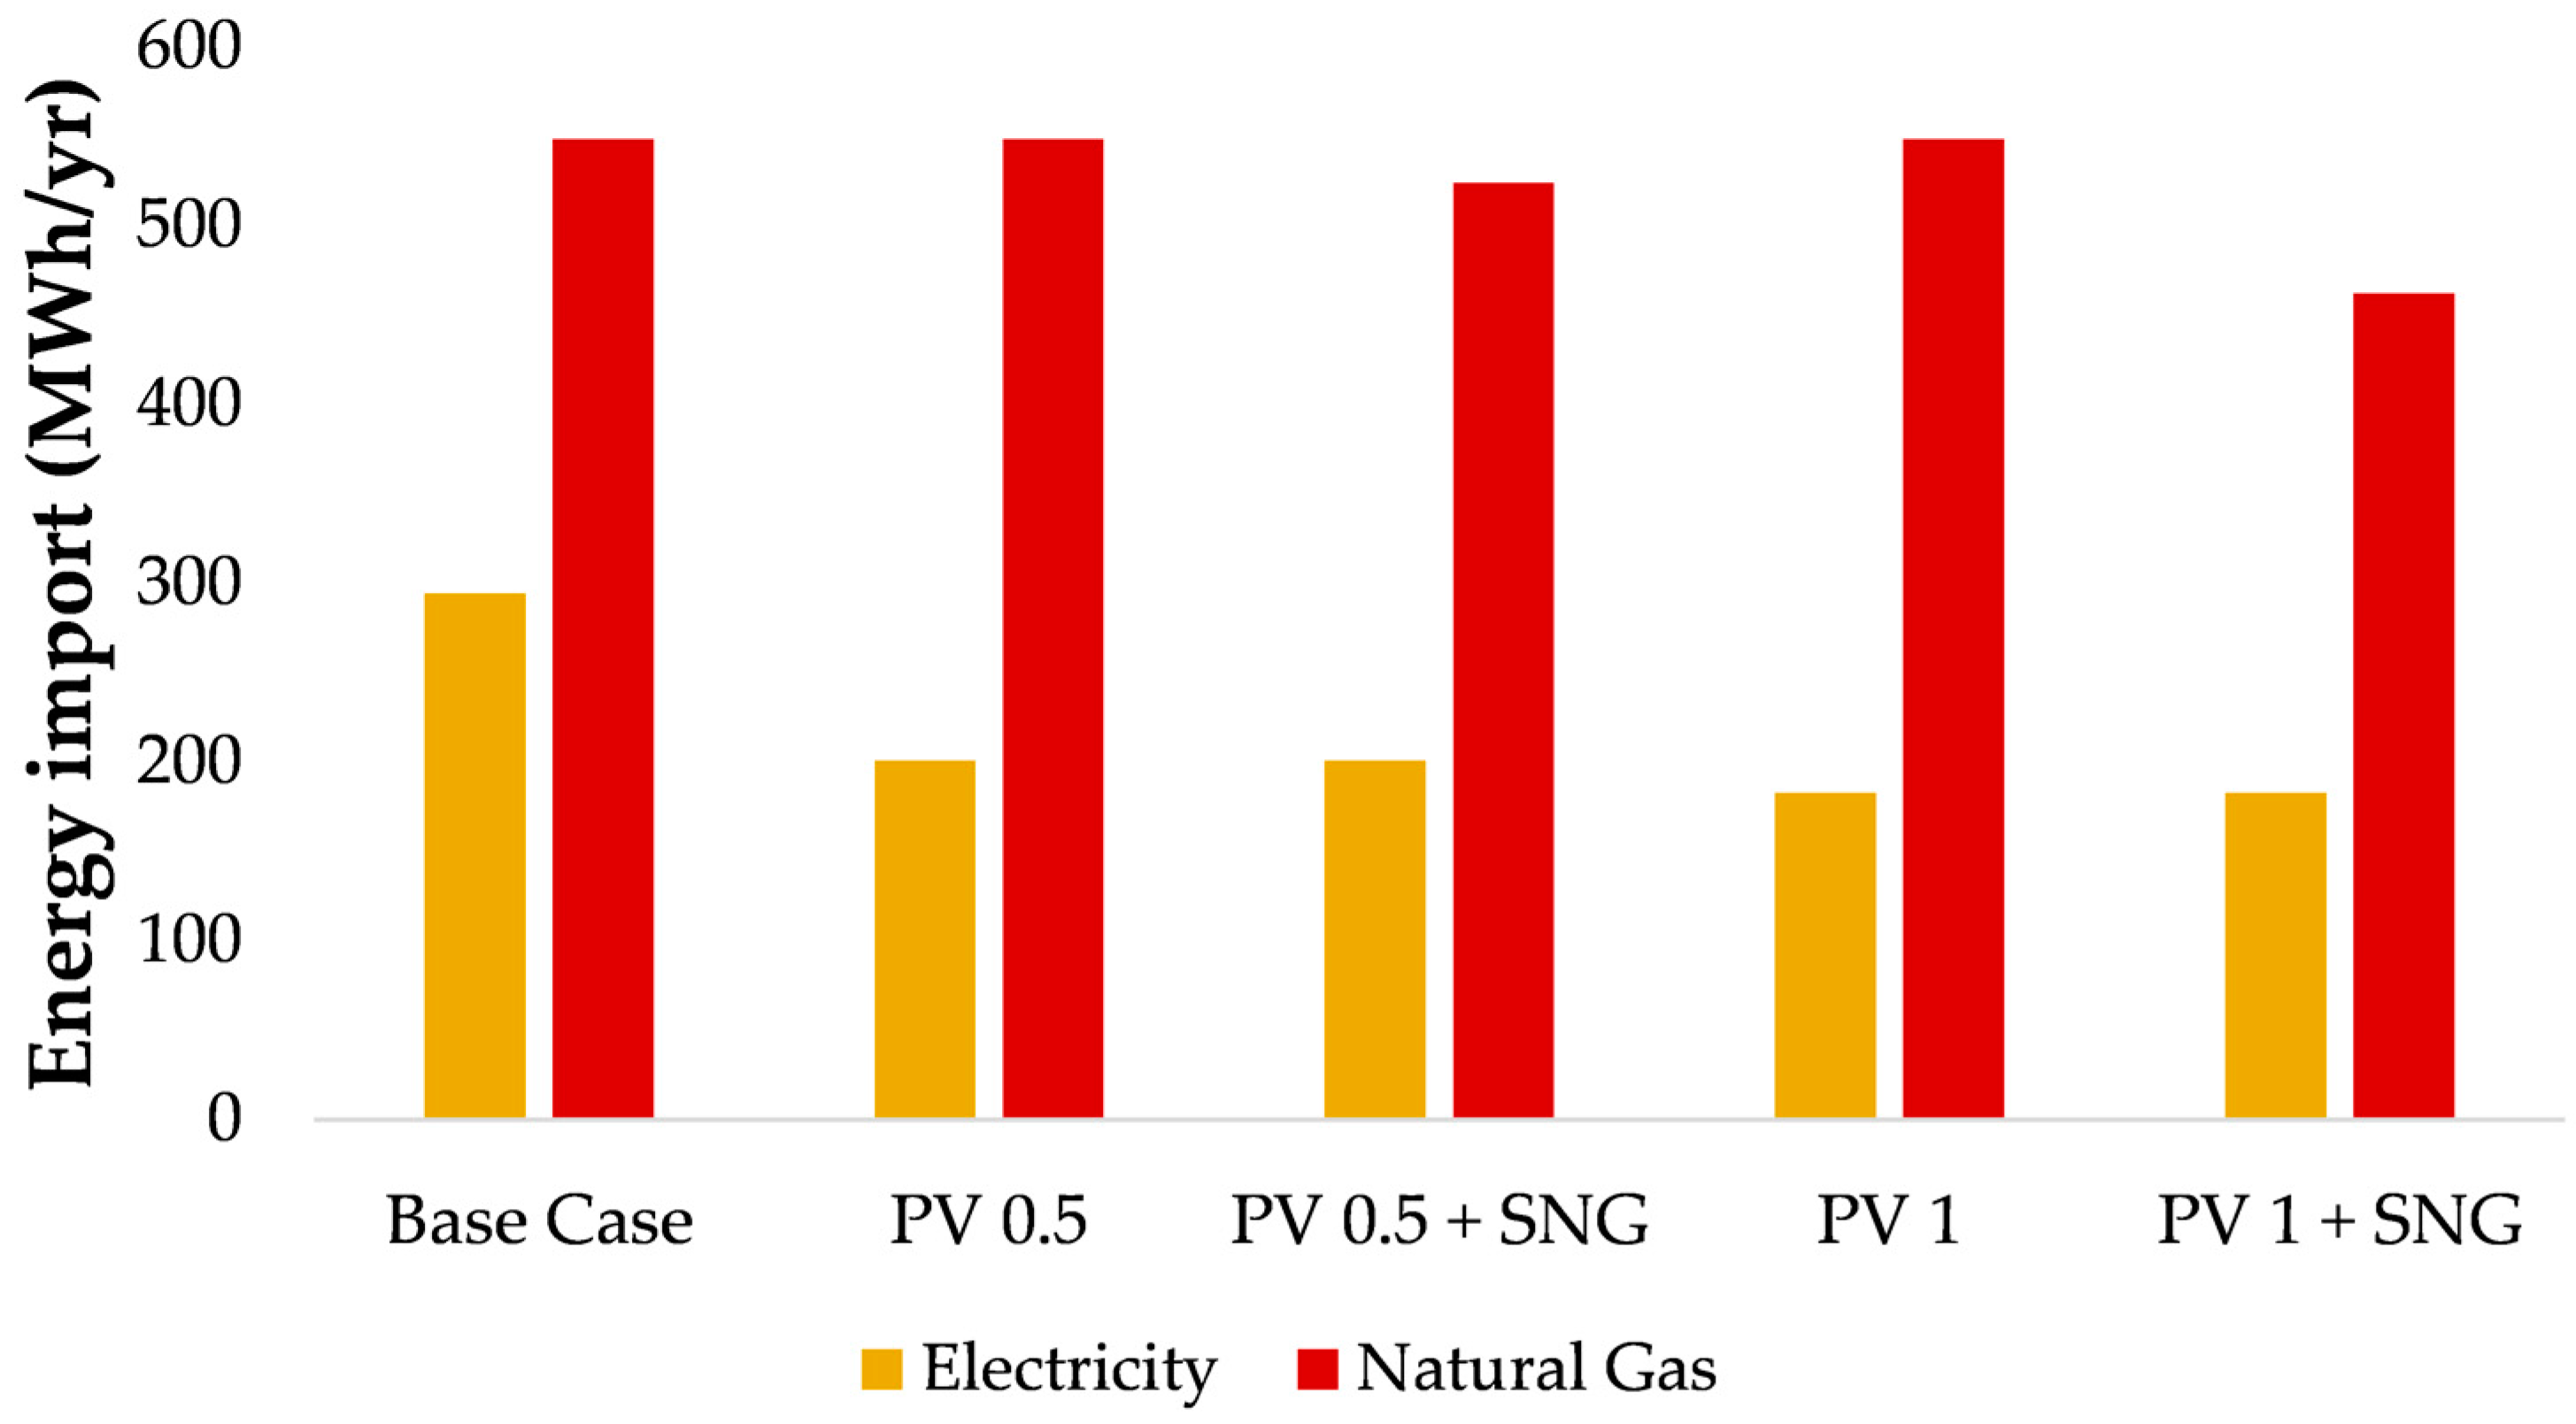
Those scenarios have been compared in energy and economic terms. In Figure 9, the electricity and natural gas consumption in the five energy district configurations have been shown.
Furthermore, in Figure 10, the annual costs of the urban energy district are reported for the five scenarios by splitting them into the annual expenditure for the energy consumption, the O&M costs for the new plants and the annualised investment costs.
The economic analysis was carried out at the current average prices for residential consumers, which are high due to the energy crisis, and then widely discussed by a sensitivity analysis.
The implementation of the photovoltaic arrays along with the Power-to-Methane strategy makes it possible to reduce the urban district overall energy consumption and, at the same time, to decrease the households’ annual expenditures.
Indeed, it is possible to greatly reduce both electricity and gas consumption by exploiting almost all the energy produced on site by the PV system. The effect of the Power-to-Methane strategy is significant. Indeed, without such a system, there is either a large local renewable surplus or the need to downsize the photovoltaic array.
At current energy carrier prices, investments are more than repaid by savings in gas and electricity purchase from the grid, even in the PV 1 + SNG scenario.
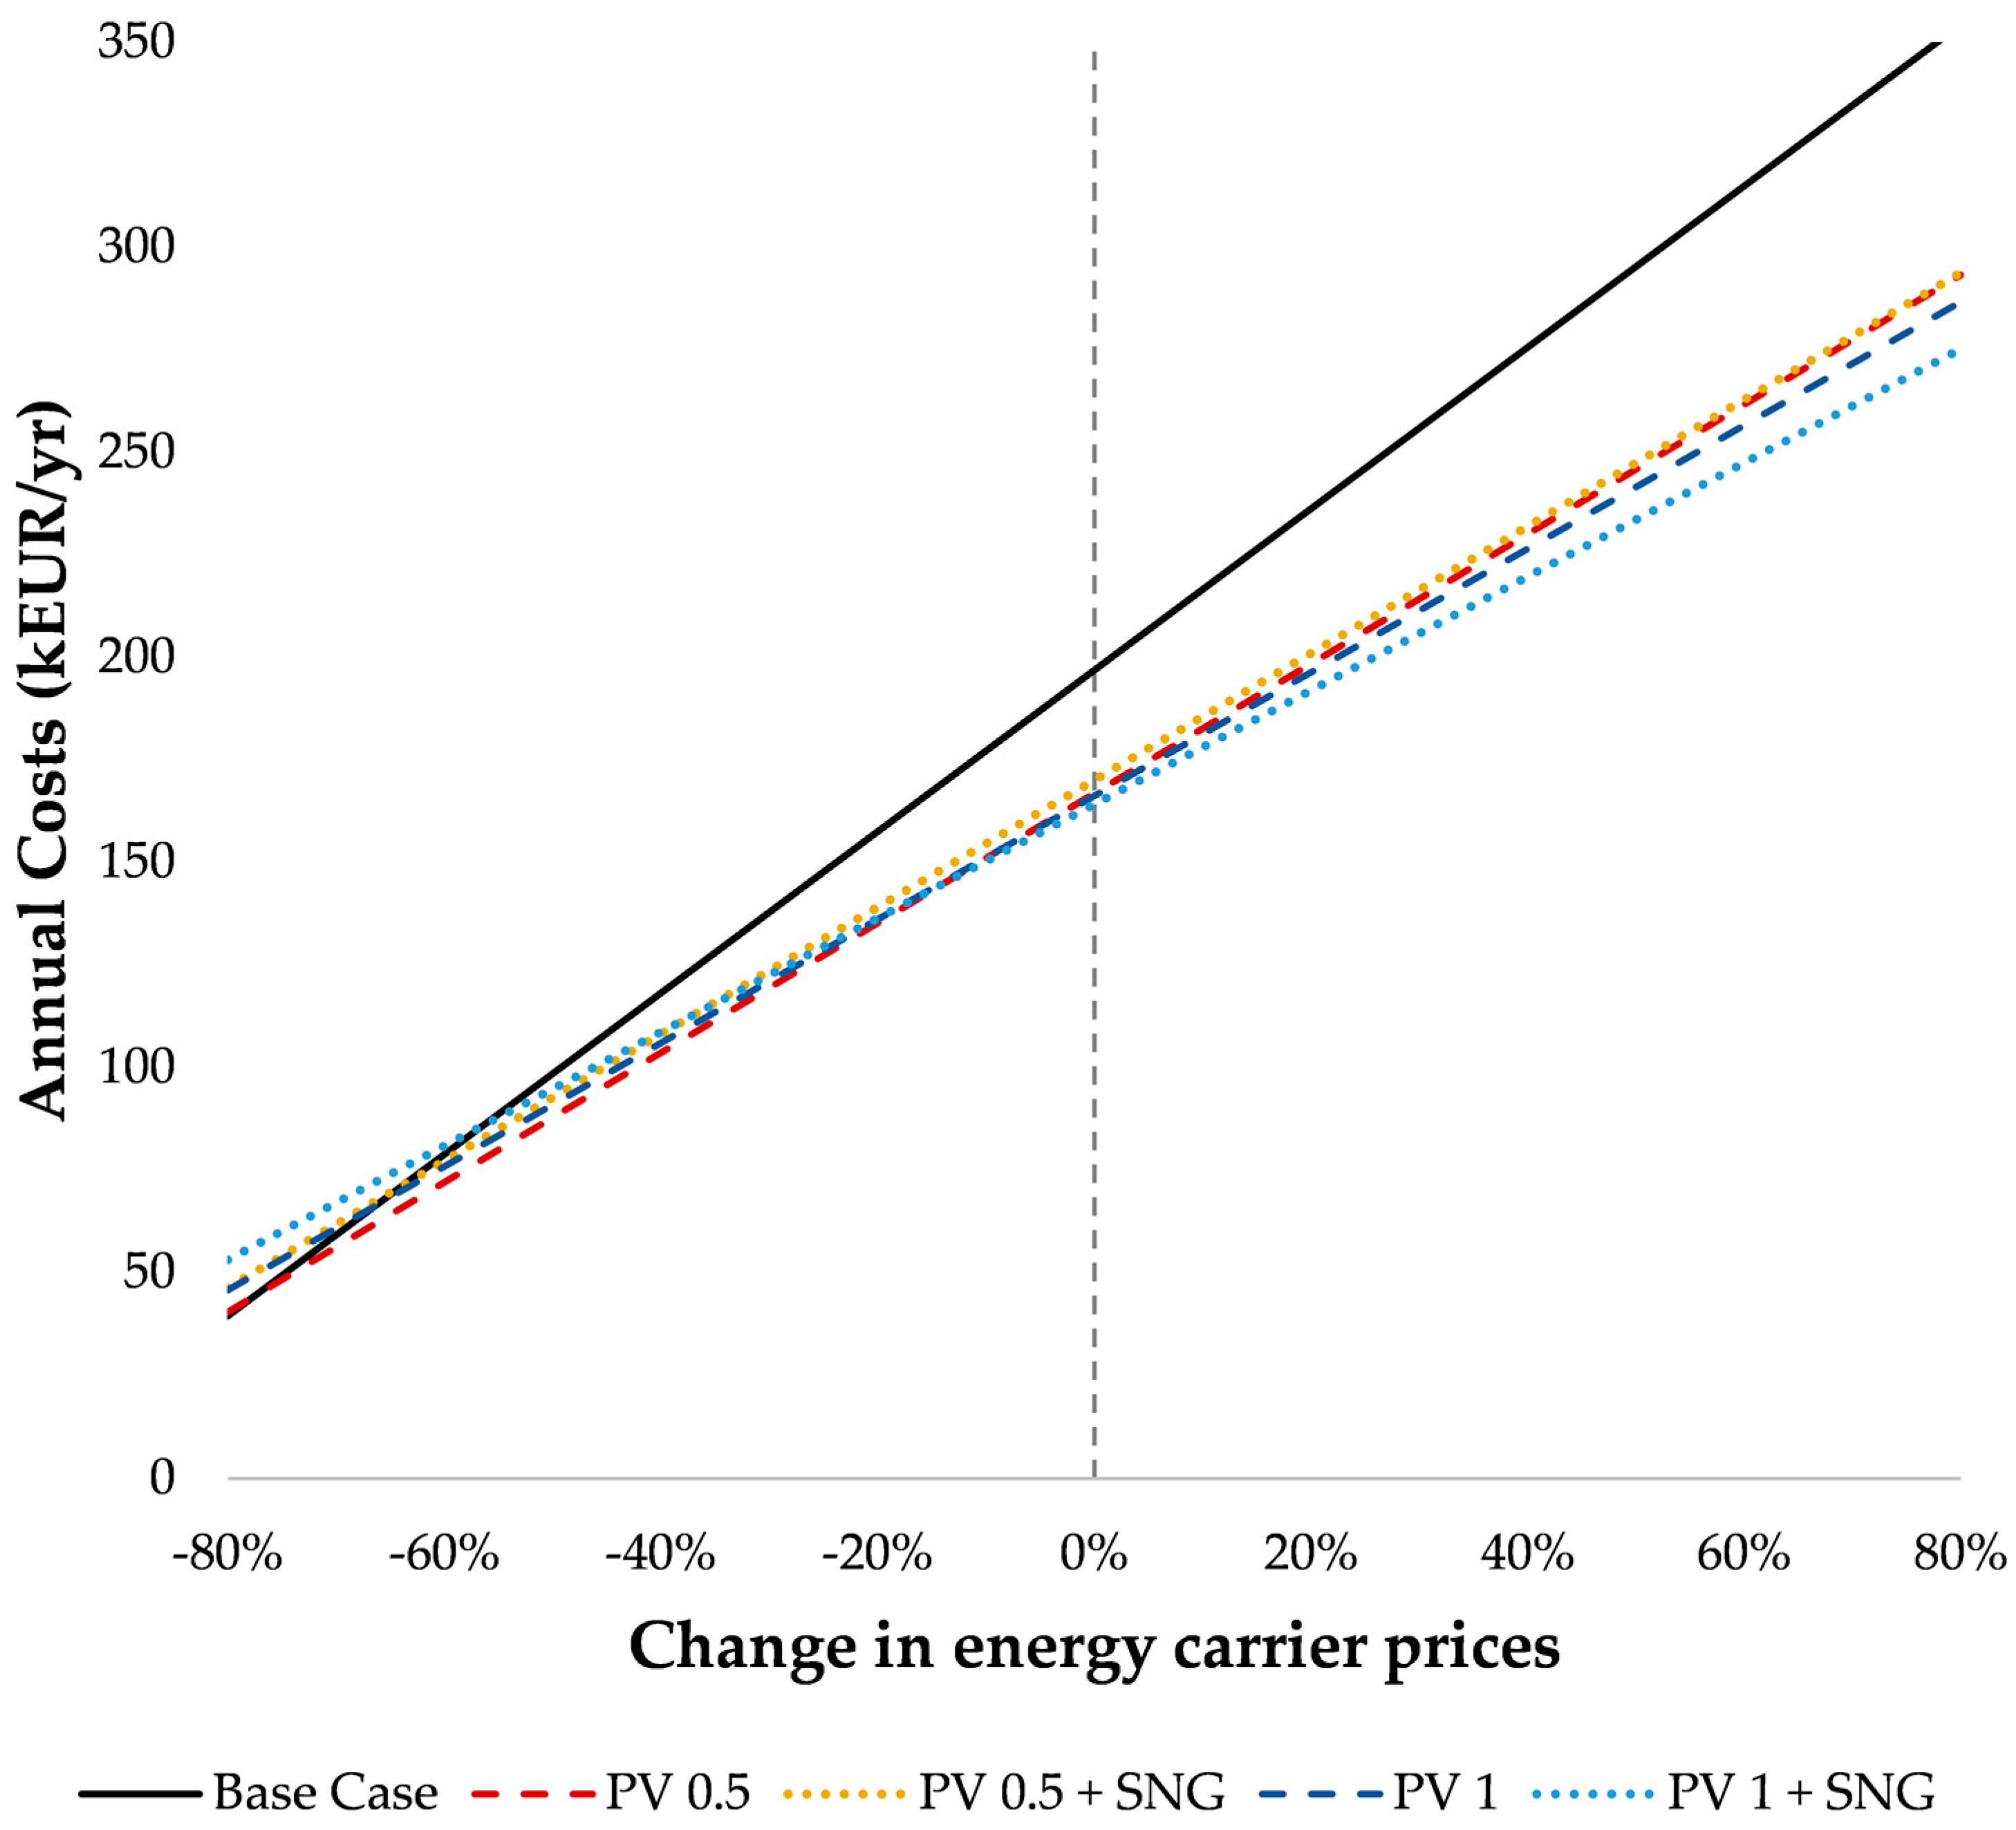
However, the high prices considered are the result of the current international energy crisis and it is not possible to know whether and for how long those prices will remain at those high values. It is, therefore, necessary to analyse the impact of these prices on the evaluations made above. A sensitivity analysis has been carried out by changing the energy carrier prices and the results are plotted in Figure 11.
It is evident from the plot that the cost-effectiveness associated to the proposed systems is highly dependent on energy prices. Values between −60% and −80% compared to current prices correspond to prices before the energy crisis. At those values, the SNG production is correlated with higher annual costs for the community. Even the mere installation of a PV system, if over-sized (PV Scenario 1), is in some cases no more cost-effective than the base case.
On the contrary, at current energy carrier prices, the proposed systems are able to lead to economic benefits, as well as decarbonise the energy district. Moreover, any further increase in these prices would raise the profitability related to the PV 1 system with SNG production.
The price growth due to the current energy crisis causes a substantial increase in the district’s annual costs in all the configurations and, thus, in the overall expenditure that households have to bear. The PV 1 + SNG configuration can, therefore, make the district less sensitive to this price increase, reducing the effects of the energy crisis on households and mitigating the energy poverty.
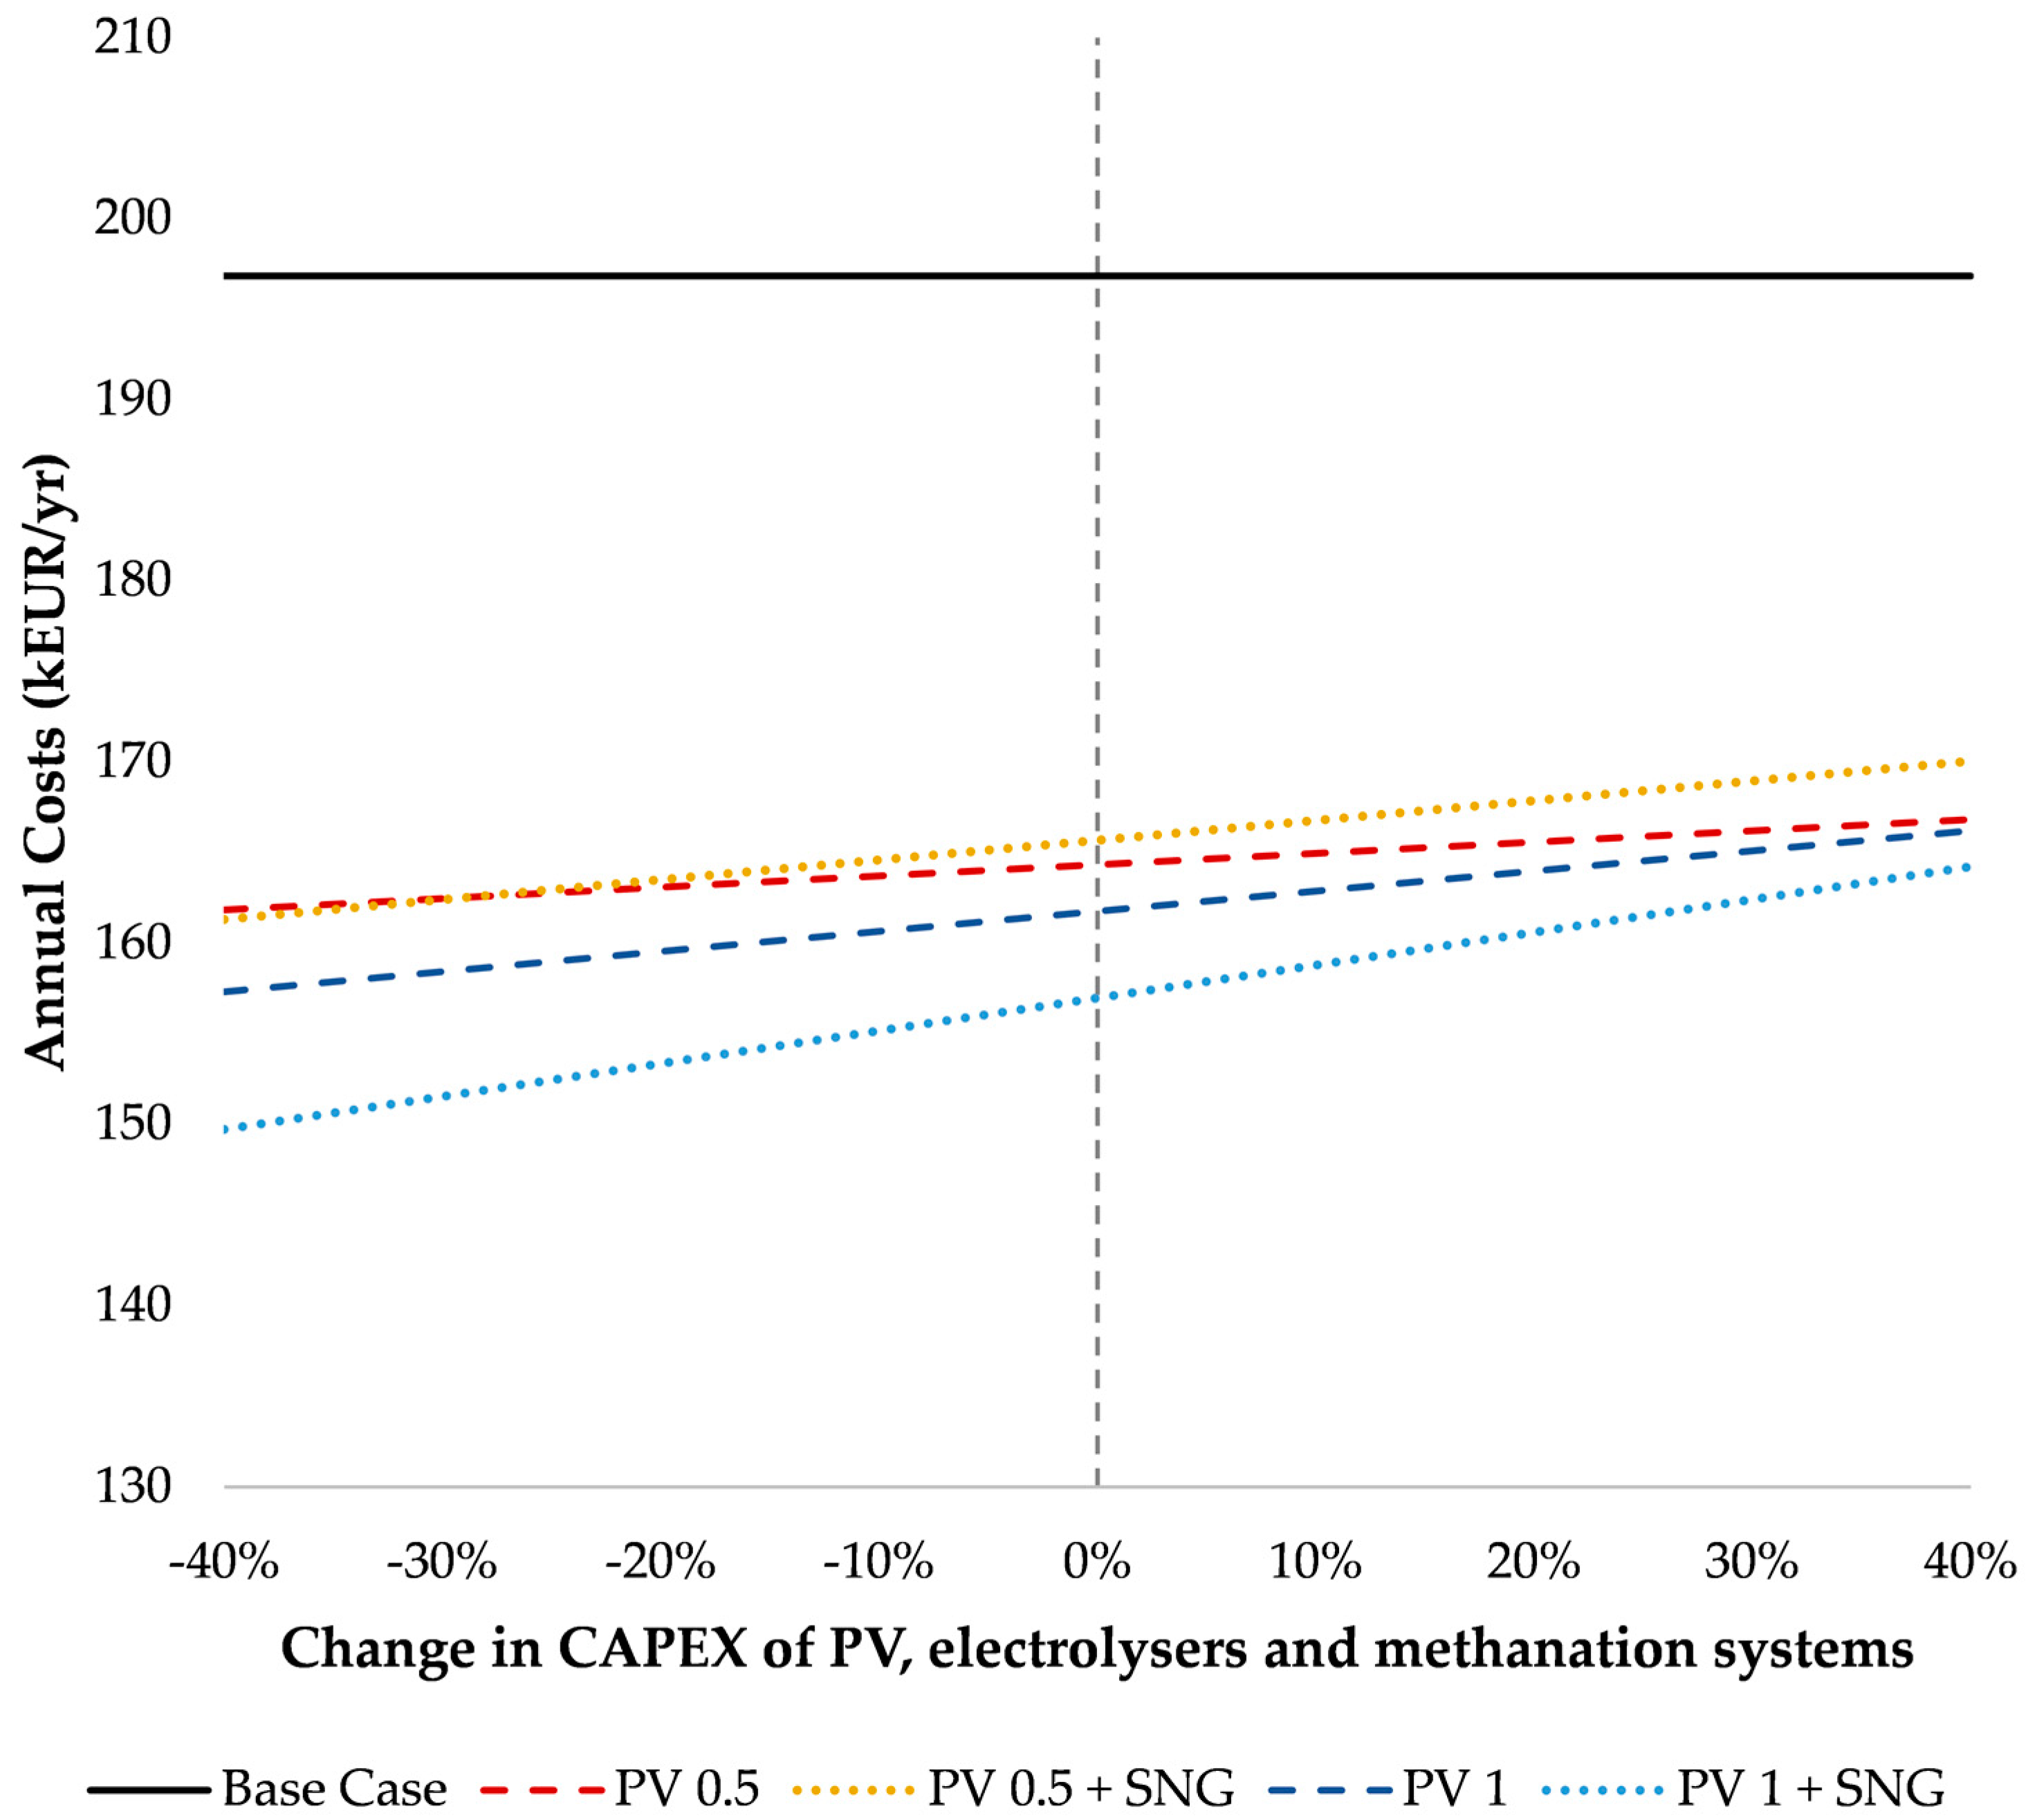
Furthermore, the current global crisis has affected the raw material markets. Therefore, the price of the different technology is also currently subject to a degree of uncertainty. Thereby, a sensitivity analysis on the CAPEX of different technologies has been carried out. In such a way, the cost-effectiveness of the proposed configurations in future scenarios characterised by a reduction in the investment costs can also be assessed.
In Figure 12, annual costs by changing the CAPEX of the different technologies in a range between +40% and −40% are depicted.
The latter sensitivity analysis shows that even with an increase in the CAPEX of the technologies, the proposed configurations remain cost-effective. Indeed, even with a 40% increase in the initial investment, the annual community costs are extremely low due to the photovoltaic system and the Power-to-Methane strategy.
Furthermore, even if the CAPEX reduction is implemented proportionally for all technologies, the lower the initial investment, the more competitive the PV + SNG system is, compared to the PV system implementation alone.

3.4. Limitations of the Present Work

The present works assesses the implementation of a Power-to-Methane strategy along with a PV system by means of a semi-dynamic simulation. Indeed, the energy balances were simulated by hourly steps over a whole year. In so doing, the quantification of hydrogen production and the subsequent SNG synthesis in the different configurations was performed.
Nevertheless, it should be pointed out that not all components have dynamic behaviour. Indeed, the efficiency of the electrolyser and methanation reactor was considered as fixed during the simulations. This approximation is widely applied in many energy system design studies. However, when analysing small-scale systems, it may be interesting to implement the dynamic behaviour of different systems in order to have a more accurate model of the simulated system. Such an issue may be the subject of future developments of this work.

4. Conclusions

The present work aims to evaluate the energy and economic feasibility of the Power-to-Methane strategy to integrate RES generation in urban energy districts. To do this, a residential energy district was considered as a case study. A preliminary analysis was carried out by implementing a PV system in the energy district and two PV configurations were considered to evaluate the SNG production under different RES excess conditions. Thus, SNG production was evaluated by varying the Power-to-Methane system size. The SCR, SNG production and CSNG were calculated. Some significant configurations were chosen for comparison in energy and economic terms. Furthermore, sensitivity analyses were carried out by changing energy carrier prices and technologies’ CAPEX.
The main outcomes can be summarised as follows:
  • Without energy storage systems, low SCR levels are achieved when large PV sizes are installed. Furthermore, when the energy annually produced by the PV system matches the electricity demand of the community, the SCR is approximately 0.4.
  • The Power-to-Methane strategy can exploit all the RES excess, since there is no limit linked to the storage system size. Indeed, all the SNG produced can be fed into the gas grid, thus avoiding storage volume constraints.
  • In the scenario characterised by the ratio EPV/EEL equal to 1, under high-RES excess conditions, the Power-to-Methane strategy allows almost twice as much renewable generation to be integrated within the energy district, compared to the same PV configuration without energy storage systems.
  • The SNG production costs raise as the size of the Power-to-Methane system increases. This is due to the fact that an increase in size reduces the system’s full load hours.
  • The SNG production cost is between 100 and 200 EUR/MWh in almost all the analysed configurations. Those values are higher than the average cost of natural gas in the period from 2015 to 2020. However, they are comparable to or lower than current gas prices for end-users. Therefore, the current energy crisis can make SNG’s local self-production cost-effective for urban energy districts.
  • The annual costs of the urban energy district can be reduced by means of the PV array implementation along with the Power-to-Methane strategy. At current energy carrier prices, investments are more than repaid by savings in gas and electricity purchase from the grid, even in the PV 1 + SNG scenario.
  • Considering the energy prices before the current crisis, SNG production is correlated with higher annual costs for the community. On the contrary, at current energy carrier prices, the proposed systems provide economic benefits, as well as they decarbonise the energy district.
In conclusion, the implementation of the photovoltaic arrays along with the Power-to-Methane strategy makes it possible to reduce the overall energy consumption of the urban district and, at the same time, decrease the annual expenditure of households.

Author Contributions

Conceptualization, L.M.P. and G.L.B.; methodology, L.M.P.; software, L.M.P.; formal analysis, L.M.P.; data curation, G.L.B.; writing—original draft preparation, L.M.P.; writing—review and editing, G.L.B.; supervision, L.d.S. and G.L.B.; project administration, L.d.S.; funding acquisition, L.d.S. All authors have read and agreed to the published version of the manuscript.

Funding

The research activities leading to this study have been carried out within the project “SINBIO-Sistemi INtegrati di produzione e immissione in rete di BIOmetano e gas sintetici da fonti rinnovabili” co-funded by Regione Lazio (Italy) in the framework of “Progetti Strategici 2019”, prot. n. A0320-2019-28132 of 29/07/2019–CUP F82I20000300002.

Data Availability Statement

Data sharing not applicable. No new data were created or analyzed in this study. Data sharing is not applicable to this article.

Conflicts of Interest

The authors declare no conflict of interest. The funders had no role in the design of the study; in the collection, analyses or interpretation of data; in the writing of the manuscript; or in the decision to publish the results.

Nomenclature

ACsAnnual Costs
ALKAlkaline
C F u e l Energy vectors’ purchase
C O & M Operation and maintenance costs
CSNGSNG production cost
DMEDimethyl ether
EEnergy
ELElectricity
ELTElectrolyser
ηEfficiency [-]
LCOELevelized Cost of Energy
LCOHLevelized Cost of Hydrogen
LCOSLevelized Cost of Storage
METHMethanation Reactor
NGNatural Gas
PPower
PVPhotovoltaic
RESRenewable Energy Sources
SNGSubstitute Natural Gas

References

  1. Intergovernmental Panel on Climate Change (IPCC). Climate Change 2022: Mitigation of Climate Change; IPCC: Geneva, Switzerland, 2022. [Google Scholar]
  2. Connolly, D.; Lund, H.; Mathiesen, B.V. Smart Energy Europe: The technical and economic impact of one potential 100% renewable energy scenario for the European Union. Renew. Sustain. Energy Rev. 2016, 60, 1634–1653. [Google Scholar] [CrossRef]
  3. Møller Sneum, D. Barriers to flexibility in the district energy-electricity system interface—A taxonomy. Renew. Sustain. Energy Rev. 2021, 145, 111007. [Google Scholar] [CrossRef]
  4. Pastore, L.M.; Lo Basso, G.; Sforzini, M.; De Santoli, L. Heading towards 100% of Renewable Energy Sources Fraction: A critical overview on Smart Energy Systems planning and flexibility measures. E3S Web Conf. 2020, 197, 01003. [Google Scholar] [CrossRef]
  5. Luthander, R.; Widén, J.; Nilsson, D.; Palm, J. Photovoltaic self-consumption in buildings: A review. Appl. Energy 2015, 142, 80–94. [Google Scholar] [CrossRef] [Green Version]
  6. Gallego-Castillo, C.; Heleno, M.; Victoria, M. Self-consumption for energy communities in Spain: A regional analysis under the new legal framework. Energy Policy 2021, 150, 112144. [Google Scholar] [CrossRef]
  7. Li, H.; Wang, Z.; Hong, T.; Piette, M.A. Energy flexibility of residential buildings: A systematic review of characterization and quantification methods and applications. Adv. Appl. Energy 2021, 3, 100054. [Google Scholar] [CrossRef]
  8. Heydari, A.; Astiaso Garcia, D.; Keynia, F.; Bisegna, F.; De Santoli, L. Hybrid intelligent strategy for multifactor influenced electrical energy consumption forecasting. Energy Sources Part B Econ. Plan. Policy 2019, 14, 341–358. [Google Scholar] [CrossRef]
  9. Panda, S.; Mohanty, S.; Rout, P.K.; Sahu, B.K.; Bajaj, M.; Zawbaa, H.M.; Kamel, S. Residential Demand Side Management model, optimization and future perspective: A review. Energy Rep. 2022, 8, 3727–3766. [Google Scholar] [CrossRef]
  10. Mattoni, B.; Pagliaro, F.; Gugliermetti, L.; Bisegna, F.; Cellucci, L. A territorial based strategy for the distribution of sensor networks in smart cities. In Proceedings of the 2015 IEEE 15th International Conference on Environment and Electrical Engineering, EEEIC 2015-Conference Proceedings, Rome, Italy, 10–13 June 2015; pp. 653–658. [Google Scholar]
  11. Lund, P.D.; Lindgren, J.; Mikkola, J.; Salpakari, J. Review of energy system flexibility measures to enable high levels of variable renewable electricity. Renew. Sustain. Energy Rev. 2015, 45, 785–807. [Google Scholar] [CrossRef] [Green Version]
  12. Pfeifer, A.; Dobravec, V.; Pavlinek, L.; Krajačić, G.; Duić, N. Integration of renewable energy and demand response technologies in interconnected energy systems. Energy 2018, 161, 447–455. [Google Scholar] [CrossRef]
  13. Jülch, V. Comparison of electricity storage options using levelized cost of storage (LCOS) method. Appl. Energy 2016, 183, 1594–1606. [Google Scholar] [CrossRef]
  14. Rahman, M.M.; Oni, A.O.; Gemechu, E.; Kumar, A. Assessment of energy storage technologies: A review. Energy Convers. Manag. 2020, 223, 113295. [Google Scholar] [CrossRef]
  15. Baumann, M.; Peters, J.F.; Weil, M.; Grunwald, A. CO2 Footprint and Life-Cycle Costs of Electrochemical Energy Storage for Stationary Grid Applications. Energy Technol. 2017, 5, 1071–1083. [Google Scholar] [CrossRef] [Green Version]
  16. Child, M.; Breyer, C. Vision and initial feasibility analysis of a recarbonised Finnish energy system for 2050. Renew. Sustain. Energy Rev. 2016, 66, 517–536. [Google Scholar] [CrossRef]
  17. Pastore, L.M.; Basso, G.L.; Cristiani, L.; Santoli, L. De Rising targets to 55 % GHG emissions reduction–The smart energy systems approach for improving the Italian energy strategy Italian Manager of Energy Services. Energy 2022, 259, 125049. [Google Scholar] [CrossRef]
  18. Lund, H.; Østergaard, P.A.; Connolly, D.; Mathiesen, B.V. Smart energy and smart energy systems. Energy 2017, 137, 556–565. [Google Scholar] [CrossRef]
  19. Mattoni, B.; Nardecchia, F.; Bisegna, F. Towards the development of a smart district: The application of an holistic planning approach. Sustain. Cities Soc. 2019, 48, 101570. [Google Scholar] [CrossRef]
  20. Weiss, R. Decarbonised district heat, electricity and synthetic renewable gas in wind-and solar-based district energy systems. J. Sustain. Dev. Energy Water Environ. Syst. 2021, 9, 1080340. [Google Scholar] [CrossRef]
  21. Finck, C.; Li, R.; Kramer, R.; Zeiler, W. Quantifying demand flexibility of power-to-heat and thermal energy storage in the control of building heating systems. Appl. Energy 2018, 209, 409–425. [Google Scholar] [CrossRef]
  22. Gjorgievski, V.Z.; Markovska, N.; Abazi, A.; Duić, N. The potential of power-to-heat demand response to improve the flexibility of the energy system: An empirical review. Renew. Sustain. Energy Rev. 2021, 138, 110489. [Google Scholar] [CrossRef]
  23. Pastore, L.M.; Lo Basso, G.; Ricciardi, G.; de Santoli, L. Synergies between Power-to-Heat and Power-to-gas in renewable energy communities. Renew. Energy 2022, 198, 1383–1397. [Google Scholar] [CrossRef]
  24. Fonseca, J.D.; Camargo, M.; Commenge, J.M.; Falk, L.; Gil, I.D. Trends in design of distributed energy systems using hydrogen as energy vector: A systematic literature review. Int. J. Hydrog. Energy 2019, 44, 9486–9504. [Google Scholar] [CrossRef]
  25. Buttler, A.; Spliethoff, H. Current status of water electrolysis for energy storage, grid balancing and sector coupling via power-to-gas and power-to-liquids: A review. Renew. Sustain. Energy Rev. 2018, 82, 2440–2454. [Google Scholar] [CrossRef]
  26. Khalid, F.; Aydin, M.; Dincer, I.; Rosen, M.A. Comparative assessment of two integrated hydrogen energy systems using electrolyzers and fuel cells. Int. J. Hydrog. Energy 2016, 41, 19836–19846. [Google Scholar] [CrossRef]
  27. Mathiesen, B.V.; Lund, H.; Connolly, D.; Wenzel, H.; Ostergaard, P.A.; Möller, B.; Nielsen, S.; Ridjan, I.; KarnOe, P.; Sperling, K.; et al. Smart Energy Systems for coherent 100% renewable energy and transport solutions. Appl. Energy 2015, 145, 139–154. [Google Scholar] [CrossRef]
  28. Qadrdan, M.; Abeysekera, M.; Chaudry, M.; Wu, J.; Jenkins, N. Role of power-to-gas in an integrated gas and electricity system in Great Britain. Int. J. Hydrog. Energy 2015, 40, 5763–5775. [Google Scholar] [CrossRef]
  29. Stančin, H.; Mikulčić, H.; Wang, X.; Duić, N. A review on alternative fuels in future energy system. Renew. Sustain. Energy Rev. 2020, 128, 109927. [Google Scholar] [CrossRef]
  30. Pastore, L.M.; Lo Basso, G.; de Santoli, L. Can the renewable energy share increase in electricity and gas grids takes out the competitiveness of gas-driven CHP plants for distributed generation? Energy 2022, 256, 124659. [Google Scholar] [CrossRef]
  31. Pastore, L.M.; Lo Basso, G.; de Santoli, L. Towards a dramatic reduction in the European Natural Gas consumption: Italy as a case study. J. Clean. Prod. 2022, 369, 133377. [Google Scholar] [CrossRef]
  32. Ghaib, K.; Ben-Fares, F.Z. Power-to-Methane: A state-of-the-art review. Renew. Sustain. Energy Rev. 2018, 81, 433–446. [Google Scholar] [CrossRef]
  33. Strakey, J.P.; Forney, A.J.; Haynes, W.P. Methanation in Coal Gasification Processes. 1975. Available online: https://www.osti.gov/biblio/5101832 (accessed on 24 November 2022).
  34. Höhlein, B. Methanation-Pilot Plant ADAM I (NFE Proiect) and Other Methanation Pilot Plants. 1978. Available online: http://juser.fz-juelich.de/record/811153/files/J%C3%BCl_1512_H%C3%B6hlein_1978.pdf (accessed on 24 November 2022).
  35. Haynes, W.; Forney, A. High BTU Gas from Coal: Status and Prospects. 1976. Available online: https://www.osti.gov/biblio/7194589 (accessed on 24 November 2022).
  36. Alarcón, A.; Busqué, R.; Andreu, T.; Guilera, J. Design of a Multi-Tubular Catalytic Reactor Assisted by CFD Based on Free-Convection Heat-Management for Decentralised Synthetic Methane Production. Catalysts 2022, 12, 1053. [Google Scholar] [CrossRef]
  37. Kiendl, I.; Klemm, M.; Clemens, A.; Herrman, A. Dilute gas methanation of synthesis gas from biomass gasification. Fuel 2014, 123, 211–217. [Google Scholar] [CrossRef]
  38. Köchermann, J.; Schneider, J.; Matthischke, S.; Rönsch, S. Sorptive H2S removal by impregnated activated carbons for the production of SNG. Fuel Process. Technol. 2015, 138, 37–41. [Google Scholar] [CrossRef]
  39. Kiewidt, L.; Thöming, J. Predicting optimal temperature profiles in single-stage fixed-bed reactors for CO2-methanation. Chem. Eng. Sci. 2015, 132, 59–71. [Google Scholar] [CrossRef]
  40. Mancini, F.; Romano, S.; Basso, G.L.; Cimaglia, J.; De Santoli, L. How the italian residential sector could contribute to load flexibility in demand response activities: A methodology for residential clustering and developing a flexibility strategy. Energies 2020, 13, 3359. [Google Scholar] [CrossRef]
  41. Mancini, F.; Salvo, S.; Piacentini, V. Issues of Energy Retrofitting of a Modern Public Housing Estates: The “Giorgio Morandi” Complex at Tor Sapienza, Rome, 1975–1979. In Proceedings of the Energy Procedia; Elsevier: Amsterdam, The Netherlands, 2016; Volume 101, pp. 1111–1118. [Google Scholar]
  42. European Commission HotMaps, the Open Source Mapping and Planning Tool for Heating and Cooling. Available online: https://www.hotmaps-project.eu/ (accessed on 10 February 2022).
  43. Merei, G.; Moshövel, J.; Magnor, D.; Sauer, D.U. Optimization of self-consumption and techno-economic analysis of PV-battery systems in commercial applications. Appl. Energy 2016, 168, 171–178. [Google Scholar] [CrossRef]
  44. Pastore, L.M.; Basso, G.L.; Quarta, M.N. Power-to-gas as an option for improving energy self-consumption in renewable energy communities. Int. J. Hydrog. Energy 2022, 47, 29604–29621. [Google Scholar] [CrossRef]
  45. Ram, M.; Child, M.; Aghahosseini, A.; Bogdanov, D.; Lohrmann, A.; Breyer, C. A comparative analysis of electricity generation costs from renewable, fossil fuel and nuclear sources in G20 countries for the period 2015-2030. J. Clean. Prod. 2018, 199, 687–704. [Google Scholar] [CrossRef]
  46. Pastore, L.M.; Basso, G.L.; Sforzini, M.; de Santoli, L. Technical, economic and environmental issues related to electrolysers capacity targets according to the Italian Hydrogen Strategy: A critical analysis. Renew. Sustain. Energy Rev. 2022, 166, 112685. [Google Scholar] [CrossRef]
  47. Mayyas, A.; Wei, M.; Levis, G. Hydrogen as a long-term, large-scale energy storage solution when coupled with renewable energy sources or grids with dynamic electricity pricing schemes. Int. J. Hydrog. Energy 2020, 45, 16311–16325. [Google Scholar] [CrossRef]
  48. EU Science Hub Photovoltaic Geographical Information System (PVGIS). Available online: https://ec.europa.eu/jrc/en/pvgis (accessed on 4 January 2022).
  49. International Renewable Energy Agency. IRENA (2021), Renewable Power Generation Costs in 2020; International Renewable Energy Agency: Abu Dhabi, United Arab Emirates, 2021. [Google Scholar]
  50. IEA. The Future of Hydrogen; IEA: Paris, France, 2019. [Google Scholar]
  51. Minutillo, M.; Perna, A.; Forcina, A.; Di Micco, S.; Jannelli, E. Analyzing the levelized cost of hydrogen in refueling stations with on-site hydrogen production via water electrolysis in the Italian scenario. Int. J. Hydrog. Energy 2021, 46, 13667–13677. [Google Scholar] [CrossRef]
  52. Nami, H.; Rizvandi, O.B.; Chatzichristodoulou, C.; Hendriksen, P.V.; Frandsen, H.L. Techno-economic analysis of current and emerging electrolysis technologies for green hydrogen production. Energy Convers. Manag. 2022, 269, 116162. [Google Scholar] [CrossRef]
  53. Heat Roadmap Europe 4 (HRE4) | EnergyPLAN. Available online: https://www.energyplan.eu/hre4/ (accessed on 3 November 2021).
  54. Baena-Moreno, F.M.; Sebastia-Saez, D.; Pastor-Pérez, L.; Reina, T.R. Analysis of the potential for biogas upgrading to syngas via catalytic reforming in the United Kingdom. Renew. Sustain. Energy Rev. 2021, 144, 110939. [Google Scholar] [CrossRef]
  55. ARERA-Dati Statistici. Available online: https://www.arera.it/it/dati/elenco_dati.htm (accessed on 3 April 2021).
  56. Elexis Spot TTF. Available online: https://my.elexys.be/MarketInformation/SpotTtf.aspx (accessed on 6 April 2021).
Figure 1. Block diagram of the urban energy district configuration with Power-to-Methane system.
Energies 15 09150 g001
Figure 2. SCR versus the PV peak power and the ratio between the energy produced by the PV system and the electricity demand of the community on yearly basis.
Energies 15 09150 g002
Figure 3. SCR versus the rated power of electrolyser in the scenario EPV/EEL equal to 0.5.
Energies 15 09150 g003
Figure 4. SCR versus the rated power of electrolyser in the scenario EPV/EEL equal to 1.
Energies 15 09150 g004
Figure 5. Annual SNG production, expressed by MWh/yr, versus the rated power of electrolyser in the scenario EPV/EEL equal to 0.5.
Energies 15 09150 g005
Figure 6. Annual SNG production, expressed by MWh/yr, versus the rated power of electrolyser in the scenario EPV/EEL equal to 1.
Energies 15 09150 g006
Figure 7. SNG production cost versus the rated power of electrolyser in the scenario EPV/EEL equal to 0.5.
Energies 15 09150 g007
Figure 8. SNG production cost versus the rated power of electrolyser in the scenario EPV/EEL equal to 1.
Energies 15 09150 g008
Figure 9. Electricity and Natural Gas import in the five scenarios.
Energies 15 09150 g009
Figure 10. Annual costs of the energy district in the five scenarios.
Energies 15 09150 g010
Figure 11. Sensitivity analysis of annual costs by changing the energy carrier prices.
Energies 15 09150 g011
Figure 12. Sensitivity analysis of annual costs by changing the CAPEX of PV, electrolyser and methanation systems.
Energies 15 09150 g012
Table 1. Main characteristics along with electricity and heating demand of both REC and dwelling archetypes.
Dwelling ArchetypeNumber of DwellingsInhabitants (n° of People)Surface (m2)Electricity Demand (MWh/Year)Heating Demand (MWh/Year)
A701501.012.62
B702601.523.15
C3041002.495.25
D3021241.436.51
District20060019,900295505
Table 2. Technical and economic assumptions for PV system, electrolyser and methanation reactor.
PV SystemALK ElectrolyserMethanation Reactor
Efficiency/producibility1524 kWh/kW/yr64%77%
CAPEX895900845
Unit for CAPEXEUR/kWEUR/kWelEUR/kWhSNG
O&M costs (% of INV)1.58%2%3%
Lifetime (years)252030
Ref.[44,48,49][50,51][50]
Publisher’s Note: MDPI stays neutral with regard to jurisdictional claims in published maps and institutional affiliations.