Abstract
This work shows an alternative method to determine the Voltage Unbalance Factor in a power grid by using both the mean value of the line voltages and Current Unbalance Factor in induction motors. Twenty unbalanced voltage points on three induction motors were used in order to compare the two methods. The influence of the measurement error of both the voltmeters and the ammeters on the resulting Voltage Unbalance Factor was studied, and the validation was made with laboratory data for one of the three motors analyzed, in addition to the simulations carried out. The proposed Voltage Unbalance Factor was compared with the most typical method in the standards to obtain this factor, showing that the proposed factor has a better approach than the standard factor to determine the value of the Voltage Unbalance Factor in an unbalanced power system.
1. Introduction
Voltage unbalances are disturbances in three-phase electrical systems, which can be present for long periods of time and are regulated in many countries. Most of these standards use the Voltage Unbalance Factor (VUF) to quantify voltage unbalances, by determining appropriate values for an electrical network.
In practice, the correct measurement of the voltage unbalance factor (VUF) is necessary in measurement and control systems such as [1], where, due to the large variations in the power absorbed by trains, it is not possible to adequately limit the unbalance in the three-phase voltages with which, in order to correctly determine the unbalance of the system, it is necessary to accurately calculate the voltage unbalance factor based on the power consumed by the trains, or [2] where the inaccuracy of the formulas that make them unusable when an unbalanced system is connected has been taken into account because they do not consider the active and reactive powers separately. In [3], how to quantify voltage unbalances according to the standards is discussed, and a new methodology is proposed to quantify the voltage unbalance factor (VUF) by measuring the voltage unbalance in three-phase installations by means of a new intelligent sensor based on a unique voltage sensor, which measures the voltage in direct current (DC).
In this sense, in [4] it is indicated that the limit to consider a voltage system as balanced three-phase is VUF = 2%. Among the most relevant investigations in this field are those related to methods of compensating for voltage imbalances in the low-voltage networks of domestic consumers, produced mainly by the connection of single-phase devices in three-phase networks such as photovoltaic installations, batteries, and electric vehicle chargers, among others [5,6,7,8,9]. Another field of study is the determination of the location where imbalances are generated in a three-phase electrical network [10]. However, among the most outstanding studies are the effects produced by voltage unbalances in different types of loads, particularly in three-phase induction motors. In this field, the effects have been analyzed on: performance [11,12,13,14,15], torque [14,16,17], vibrations [16,18], current [17,18], temperature [15,19], power [16], power factor [15], noise [18] or performance types [20], as well as studies that analyze the influence of the power of the loads that generate unbalances in the VUF [21].
A final field of study to highlight is the characterization of voltage unbalances. In [13], the VUF (or other equivalents) and the typology are characterized by two parameters, defining eight different types of VUF. In [17], they are characterized by the VUF, the typology, and the direct component of the triphasic voltage, V1. In [22], they are characterized by the VUF and the Equivalent Voltage Magnitude Factor.
Traditional methods for calculating the VUF (VUF1) are based on measuring the RMS line voltages. In this work, an alternative method is proposed to calculate the VUF (VUF2) from two parameters, the mean value of line voltages and the Current Unbalance Factor (CUF), obtained from the RMS line currents (in this case, the currents of an induction motor). As a result, the proposed method generates lower errors in the VUF calculation than the traditional methods, mainly when the power system presents values around VUF = 2%.
The proposed method to determine the Voltage Unbalance Factor (VUF2) can be applied to determine the unbalance of an electrical network that feeds, among other loads, a three-phase induction motor.
2. Materials and Methods
2.1. Unbalance Factors in Three-Phase Electrical Systems
This section defines the VUF, the current unbalance factor (CUF), and the mean value of a three-phase voltage system (Vmean).
2.1.1. Voltage Unbalance Factor (VUF)
For an unbalanced three-phase voltage system, the VUF can be calculated with the mathematical expression (1), where V2 is the module of the inverse component of the voltage, V1 is the module of the direct component of the voltage, a = 0.5 · (−1 + j·√3), and VAB, VBC, and VCA are the line voltages of the system.
2.1.2. Current Unbalance Factor (CUF)
Similarly, the CUF can be calculated from (2). In this mathematical expression, I2 is the module of the inverse component of the current, I1 is the module of the direct component of the current, and IA, IB, and IC are the line currents of the system.
2.1.3. Mean Voltage (Vmean)
The average value of the voltages (3), in a three-phase system, is a magnitude to be taken into account in the analysis of unbalances. In this mathematical expression, VAB, VBC, and VCA are the modules of the line voltages of the system.
2.2. Voltage Unbalance Points
In this work, 20 voltage unbalance points were considered with 5 reference values for VUF (1, 2, 3, 4, and 5%) and 4 reference values for Vmean (0.85, 0.90, 0.95, and 1.00 pu). From these values, the values of the modules and the angles of the line voltages are determined under the following criteria: no unbalance in the angles is considered; VBC is taken equal to Vmean; VAB and VCA are two equidistant values with respect to VBC, the first lower and the second higher, which determine the VUF and Vmean reference values chosen at each unbalance point.
The mathematical notation of the voltages at each unbalance point is shown in (4) and the values of VUFref, Vmean,ref, VAB, VBC, VCA, φAB, φBA, and φCA for the 20 selected unbalance points are shown in Table 1.

Table 1.
Setpoint values for 20 experimental unbalance points.
2.3. Measuring Instruments
The measurement error in the RMS values of voltage and current determine errors in the calculation of VUF and CUF. The influence of these errors is much greater in the case of VUF. For this reason, in this work a new method for the determination of VUF is proposed.
Although the values of power, voltage, and current at the nominal operating point are different in the three motors analyzed in this work, in order to simplify the calculations, the measuring errors on only one instrument were taken as reference, the Fluke 87V industrial multimeter. This instrument has an accuracy of ±(0.7% + 2) in the RMS voltage measurement and ±(1.0% + 2) in the RMS current measurement.
The error in the measurement of the RMS value of the voltage, for a real RMS value of 100 V, implies that the readings can oscillate between a minimum value of 99.1 V and a maximum value of 100.9 V. The error in the measurement of the value current, for a real value of 10 A, implies that the readings can oscillate between a minimum value of 9.88 A and a maximum value of 10.12 A.
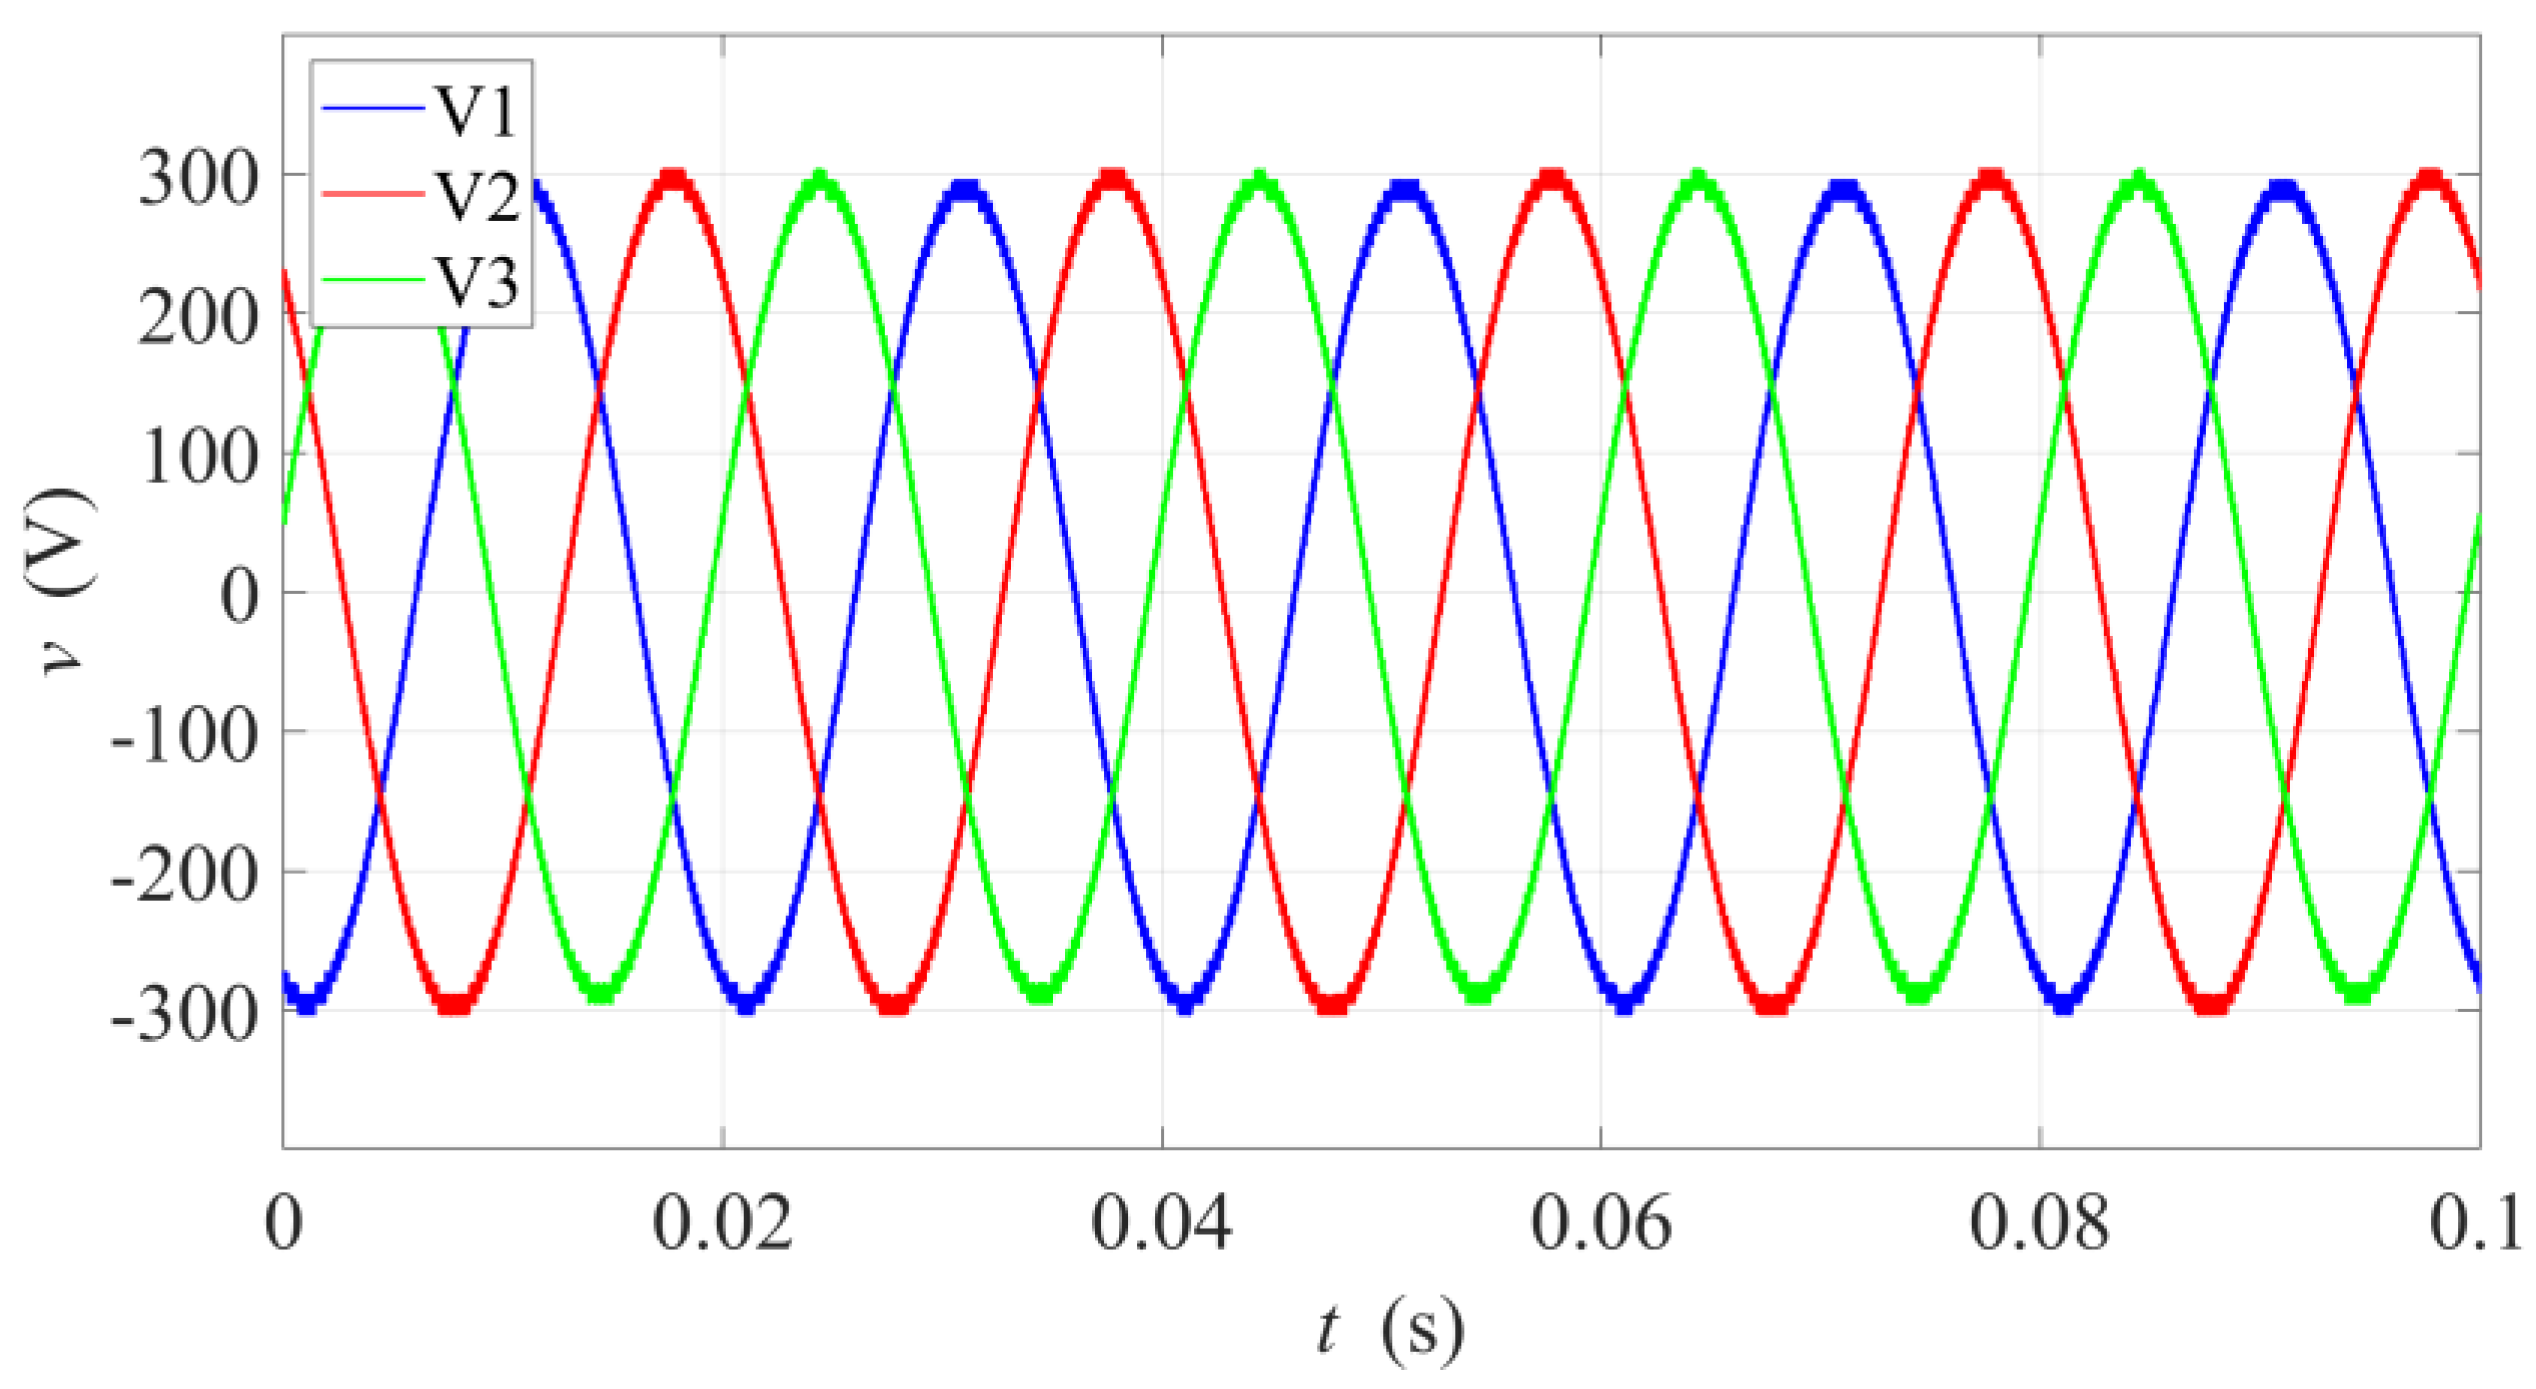
Figure 1 shows the waveform of the 230 V line voltages for Point 2 in Table 1, with VUFref = 1% and Vmean,ref = 0.90.
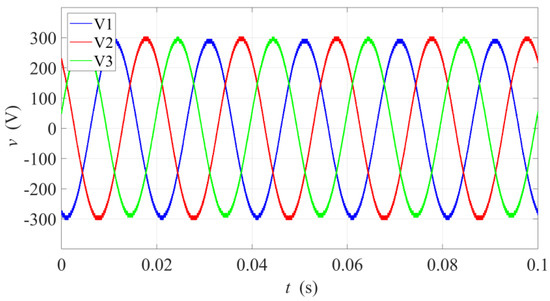
Figure 1.
Three-line unbalance voltages for Point 2 in Table 1, with VUFref = 1% and Vmean,ref = 0.90.
2.4. Induction Motors
In this work, the effect of voltage unbalances in three induction motors has been analyzed: Motor A (1.5 kW), Motor B (7.5 kW), and Motor C (75 kW). The analysis was carried out through tests in the laboratory for Motor A and through simulations for the three motors.
2.4.1. Induction Motors Characteristics
Table 2 shows the characteristics of the 3 motors selected for this work at the rated operating point. Motors with different characteristics were chosen in order to see if the results obtained are similar in all cases.
Table 2.
Characteristics of induction motors at the rated operating point.
2.4.2. Mathematical Model
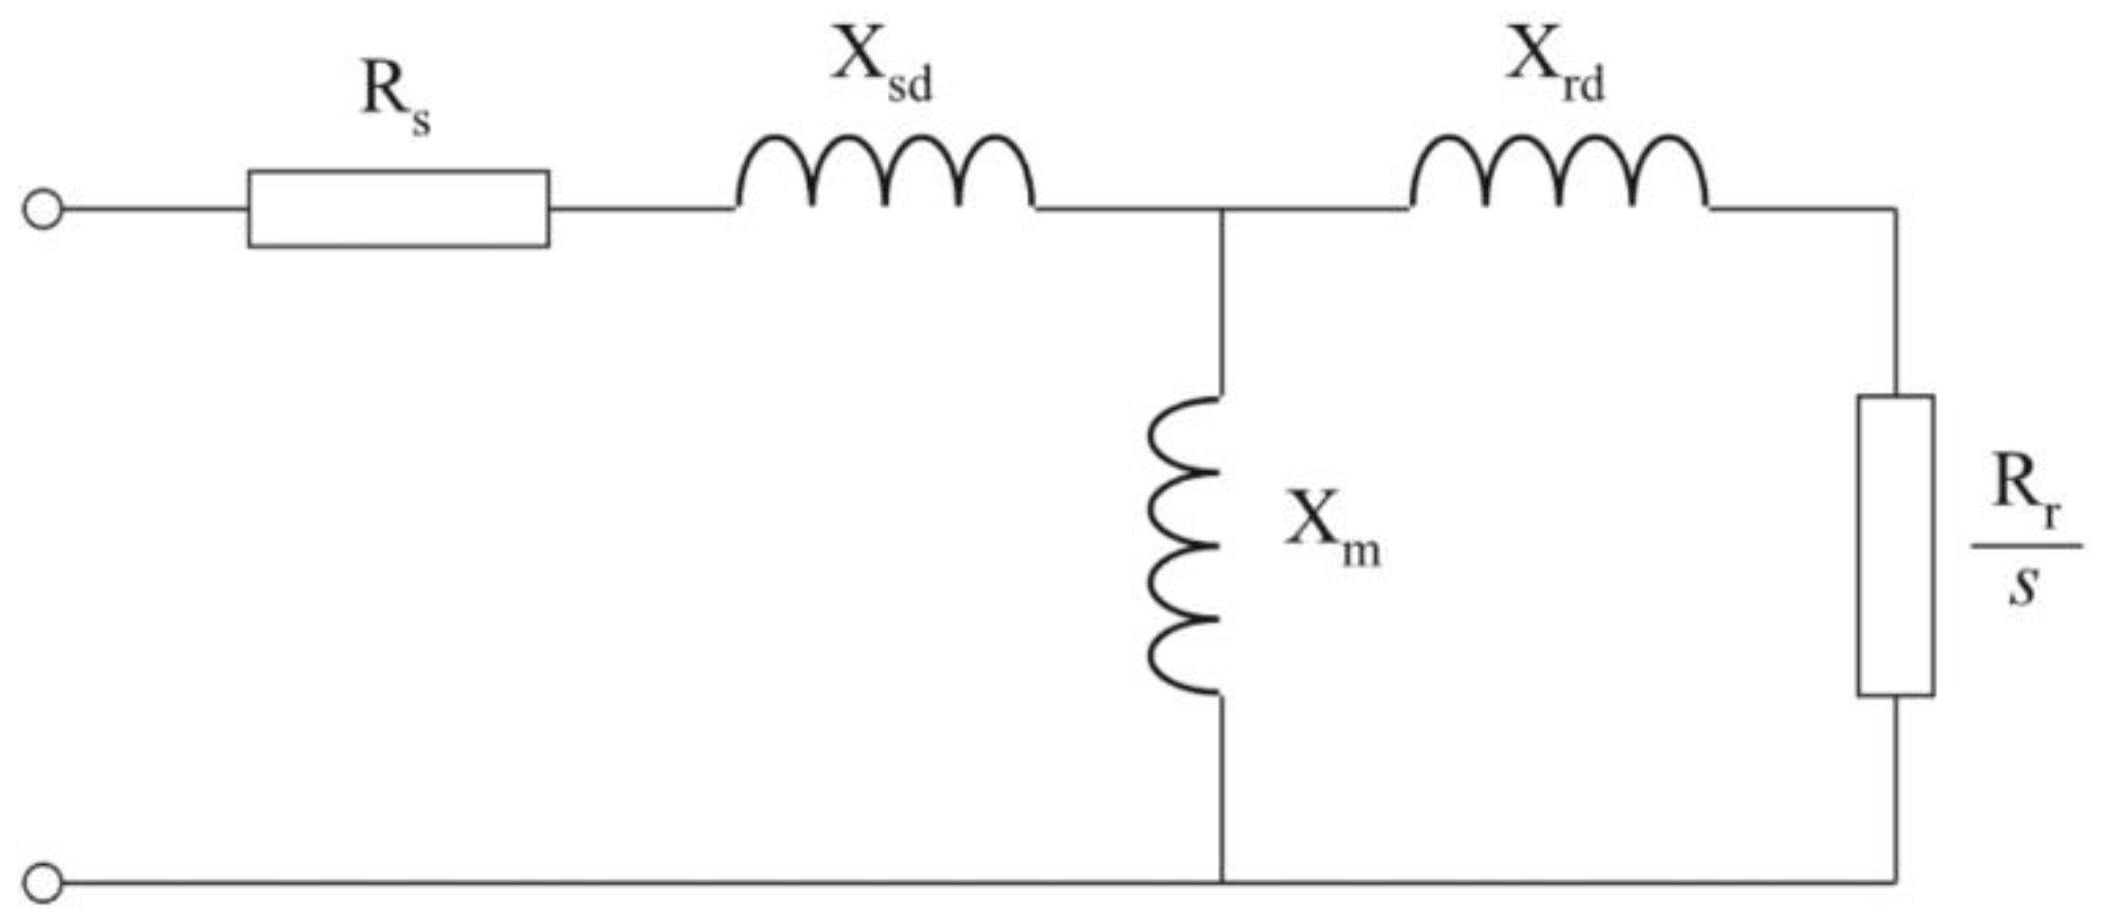
In order to simulate the performance of induction motors under voltage unbalance, the single-cage model with five constant parameters was selected. This model can be represented by the equivalent circuit shown in Figure 2, where Rs and Rr are the stator and rotor resistances, respectively; Xm is the magnetizing reactance; Xsd and Xrd are the stator and rotor reactances, and s is the slip.

Figure 2.
Equivalent circuit with five constant parameters for the single-cage model of the induction motor.
2.4.3. Parameters
Table 3 shows the electrical parameters of the three motors analyzed.
Table 3.
Electrical parameters of the induction motors.
2.5. Laboratory Setup and Methodology
Motor A was tested in the laboratory, at the 20 unbalance points indicated in Table 1.
In each test, the motor was made to reach the rated operating point by means of a programmable voltage source (Figure 3), which was configured to apply the voltages corresponding to the unbalance point. As a mechanical load, a direct current generator was used, which fed a resistive load (Figure 3). With the motor in unbalanced conditions, the following were recorded for one second: line voltages and currents, speed, and torque. From the temporal evolution of the currents, it was possible to obtain the CUF caused by the voltage unbalance.

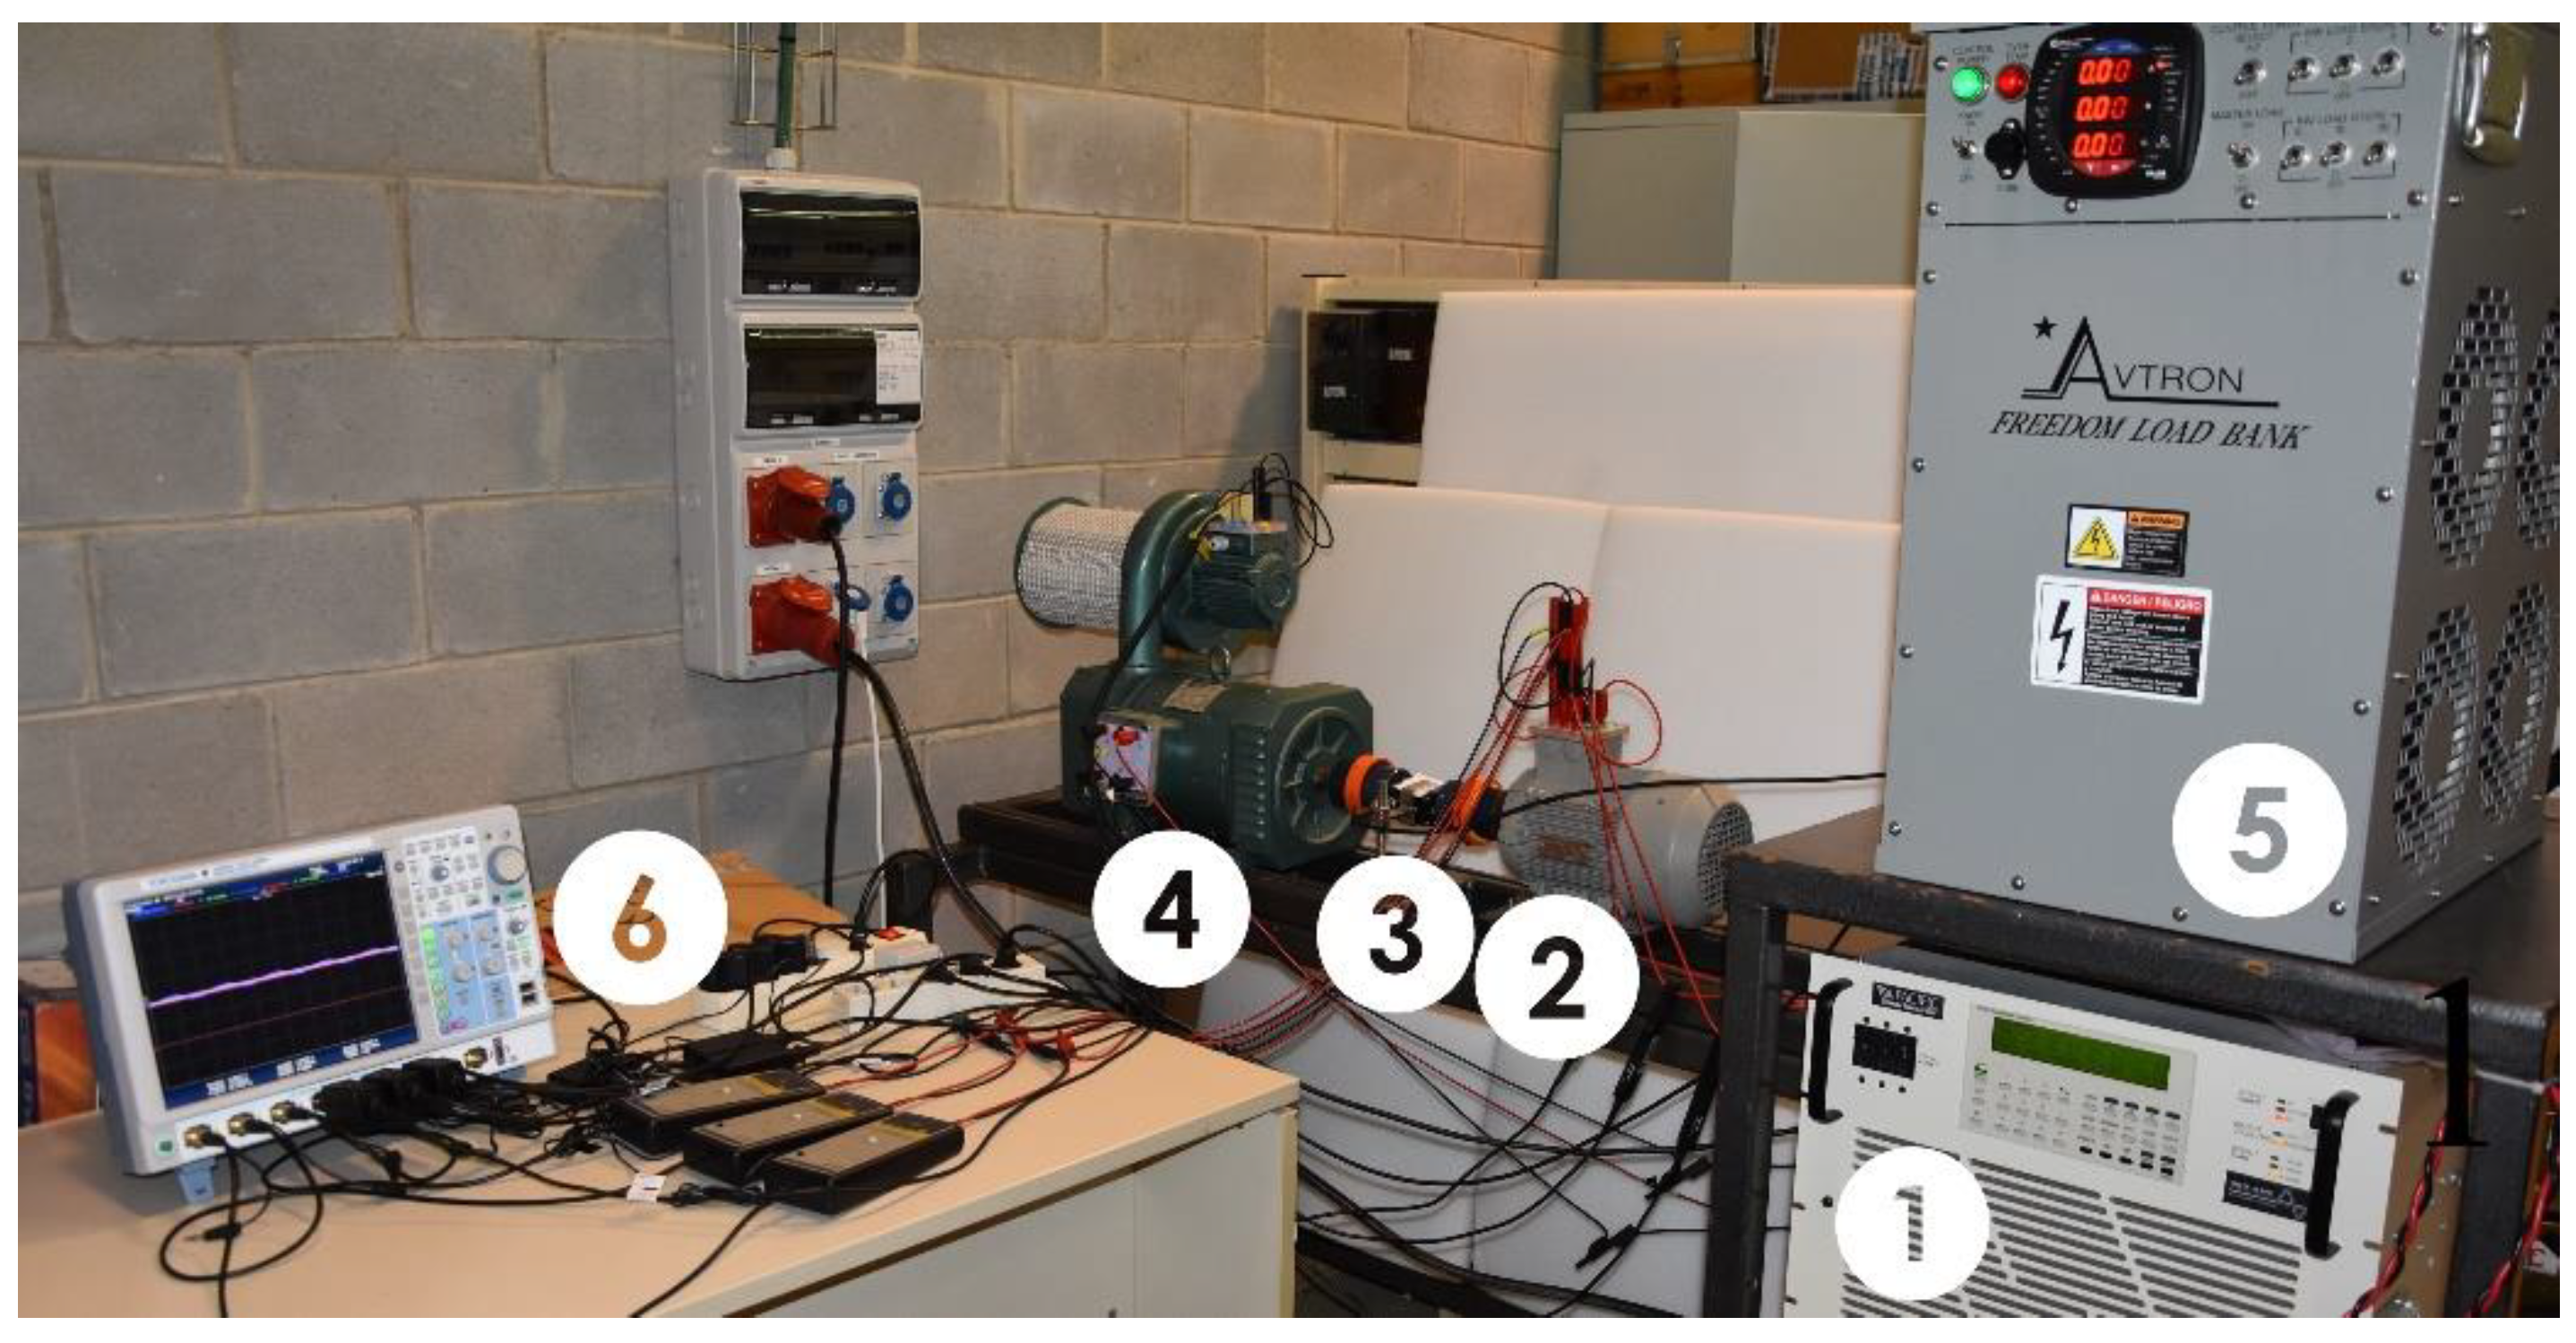
Figure 3.
General overview of laboratory setup used in the tests. The main devices are: (1) programmable power source; (2) induction motor; (3) torque and speed sensors; (4) DC generator; (5) DC generator’s resistive load; (6) oscilloscope.
3. Results
The results are presented in five sections. First, the evolution of the CUF with respect to the VUF is shown, for the experimental and simulation results of Motor A, with constant Vmean.
Then, the influence of the measurement error in the voltmeters for the calculation of the VUF and the influence of the measurement error in the ammeters for the calculation of the CUF in the three analyzed motors are calculated.
Thirdly, the proposed method for calculating the VUF based on Vmean and CUF for the three motors analyzed is presented, assuming that there are no errors in the measurement instruments.
Fourth, the VUF values are calculated as a function of Vmean and CUF, taking into account the maximum possible error in Vmean (generated by the error in the three voltmeters) and the maximum error in CUF (generated by the error in the three ammeters).
Finally, the errors are compared when calculating the VUF directly from the three voltmeters vs. the errors when calculating the VUF from CUF and Vmean.
3.1. CUF vs. VUF Ratio
In [16] it was already shown that there is a practically linear ratio between the values of the VUF and the CUF, when the same value of the direct component of unbalanced voltage (V1) is chosen. In that work, all the results were obtained from the simulation of 13,060 unbalance points for motors B and C.
In this work, Motor A was added, for which the ratio between VUF and CUF was studied, based on the experimental and simulation results in the 20 unbalance points defined in the previous section.
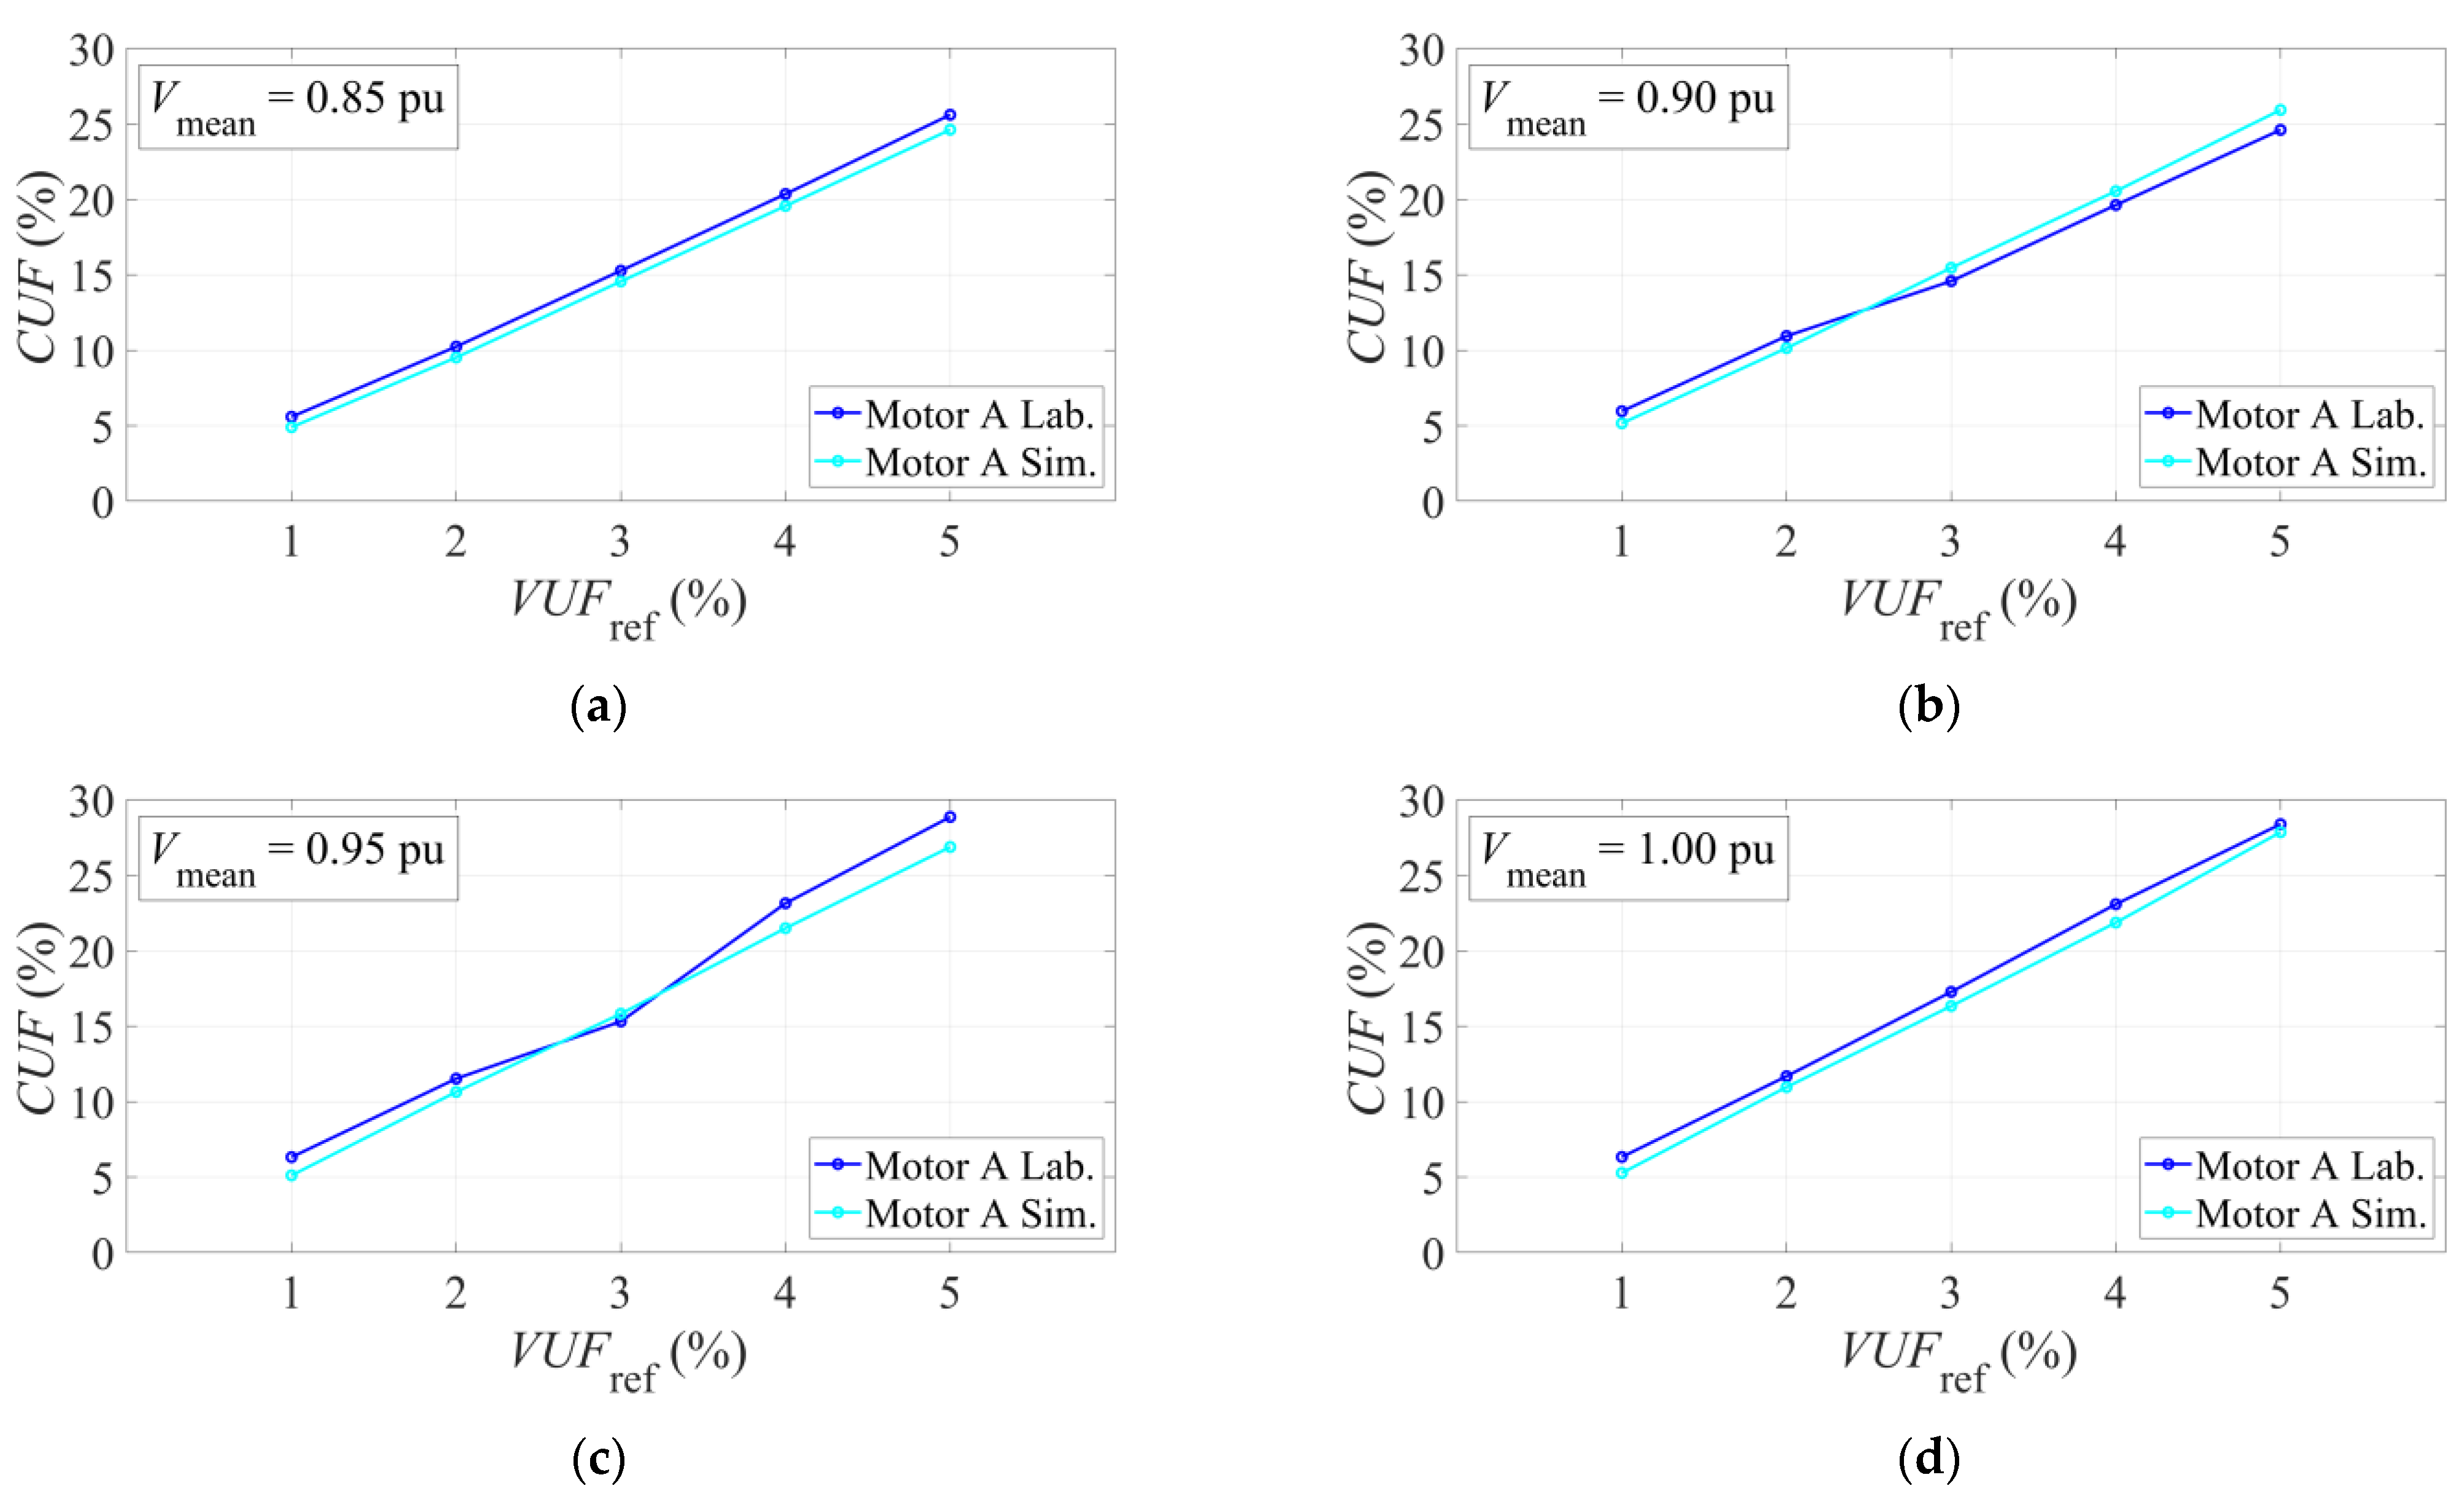
The results are shown in Figure 4, through 4 graphs: (a) Vmean = 0.85 pu; (b) Vmean = 0.90 pu; (c) Vmean = 0.95 pu; (d) Vmean = 1.00 pu. In each graph, the experimental results are shown by means of a blue line, and the simulation results by means of a cyan line. In the four cases, it is observed that the experimental and simulation results are close, but this assessment is quantified later in the discussion section.
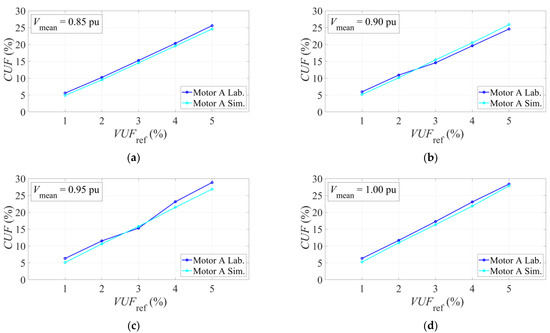
Figure 4.
CUF vs. VUF on motor A for experimental (blue) and simulation (cyan) results, and different values of Vmean: (a) 0.85 pu; (b) 0.90 pu; (c) 0.95 pu; (d) 1.00 pu.
In all the graphs of Figure 4, a practically linear ratio between the values of VUF and CUF is observed, for Vmean constant.
3.2. Impact of Measurement Errors on the VUF and CUF
In this section, the voltage (VUF0.7) and current (CUF1.0) unbalance factors are calculated, when the maximum measurement error in the selected instrument is taken into account, for the 20 unbalance points previously defined.
In the case of voltage, the RMS value of the minimum voltage (VAB) was multiplied by 0.991, and the RMS value of the maximum voltage (VCA) by 1.009, leaving VBC unchanged, as shown in (5).
From the new RMS voltage values (VAB,0.7, VBC,0.7, and VCA,0.7), the new voltage unbalance factor VUF1 was calculated at each of the 20 points according to (6).
This new unbalance value was also compared with the reference value using eVUF1, as shown in (7).
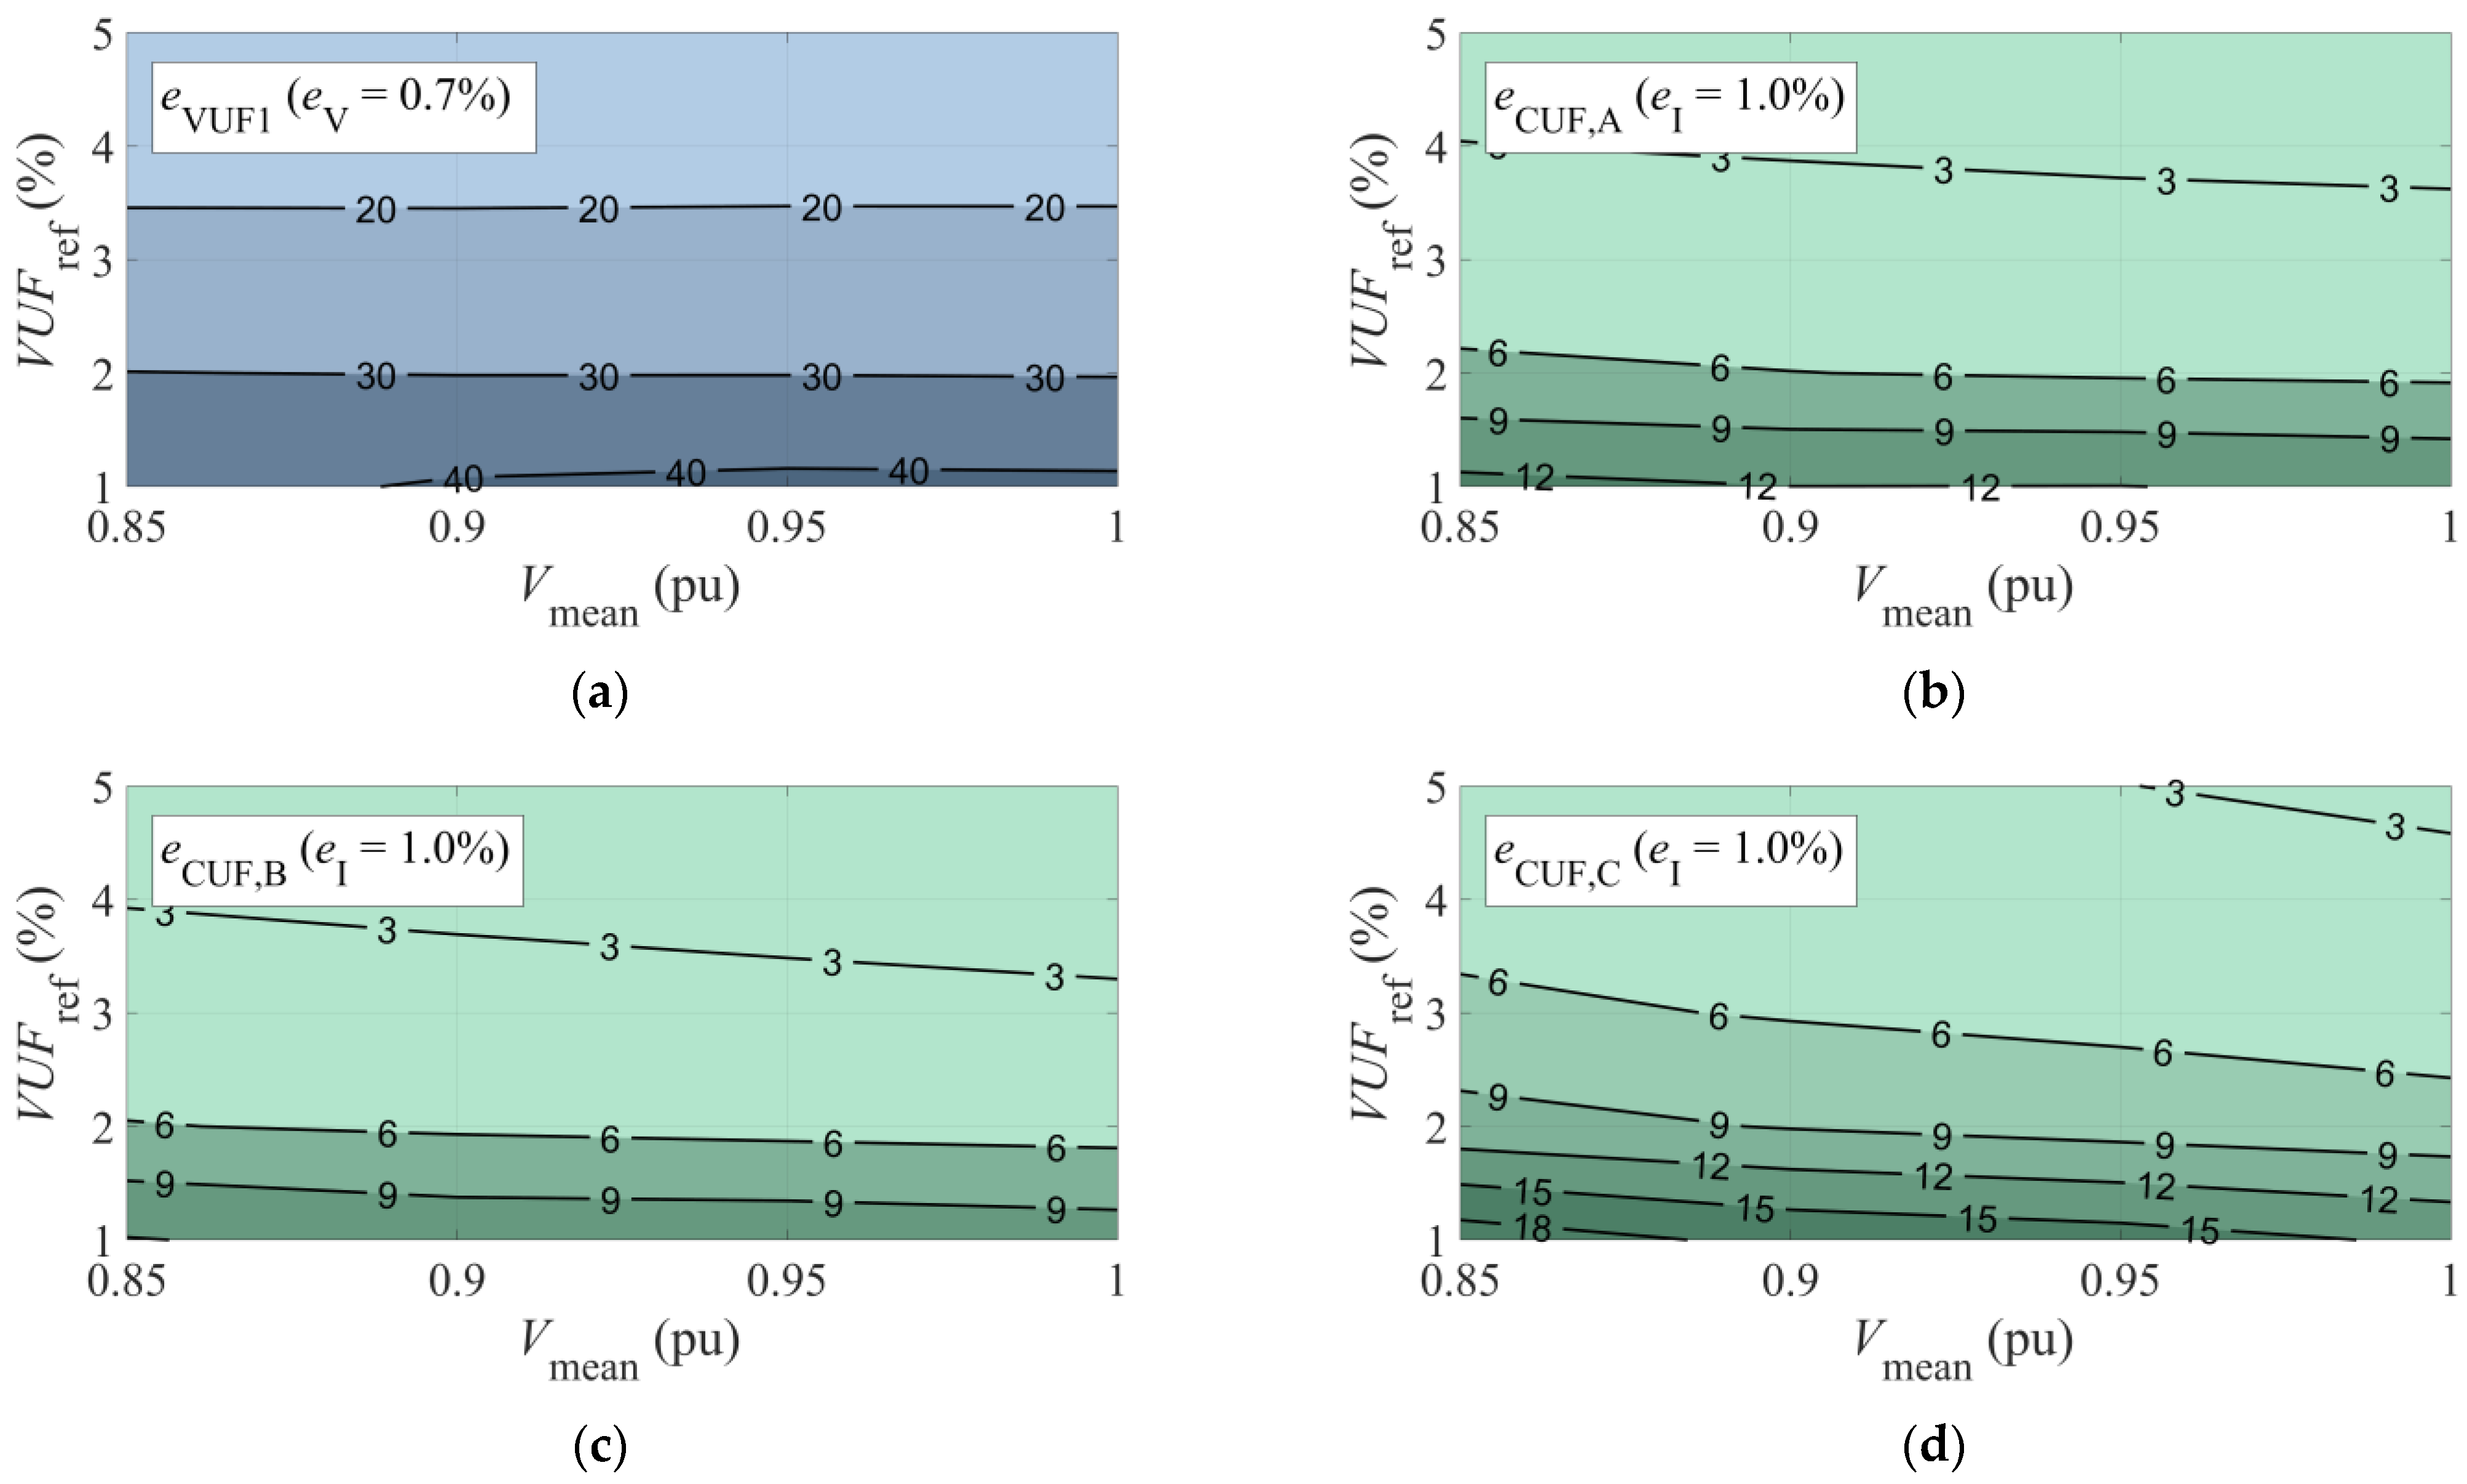
Applying (7) to all the unbalance points, Figure 5a shows the eVUF1 values by means of isolines. The vertical axis corresponds to the reference VUF (VUFref), and the horizontal axis to the mean value of the line voltages (Vmean). Right at the value where many standards mark the unbalance limit, VUFref = 2%, it is observed that the error in the calculation of the VUF through (6), when the measurement error in the effective value of the voltage is 0.7% (ev = 0.7%), can give rise to errors of 30% in the VUF (eVUF1=2% ≈ 30%).
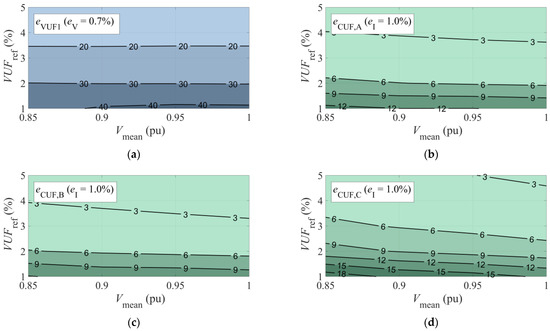
Figure 5.
(a) VUF error (eVUF1) according to Vmean and VUFref when the measurement error in the voltmeters is 0.7%; CUF error (eCUF) according to Vmean and VUFref when the measurement error in the ammeters is 1.0%: (b) Motor A; (c) Motor B; (d) Motor C.
For the current unbalance calculation, the precision in the measurement of the rated value of the current by means of the Fluke 87V industrial multimeter was also taken into account. To obtain the most unfavorable case, the minimum current RMS value of the three phases was multiplied by 0.988, and the maximum current RMS value of the three phases by 1.012, leaving the remaining phase unchanged, which is the median of the three values RMS of current (8).
Regarding the angles of the line currents, both in the experimental results and in the simulation results of the 20 unbalanced points analyzed, it was observed that the phase shift of the currents is not 120°. However, in this work, no error in the measurement of the angles was considered. The new current phasors are defined in (9).
From the new current values, the new current unbalance CUF1.0 (10) was calculated.
Finally, for a given unbalanced point and motor, the error in the CUF, eCUF, can be calculated by using (11).
Figure 5b–d shows the CUF errors for motors A, B, and C, as a function of Vmean and VUFref. As can be seen, despite the fact that the error in the ammeters is greater (1%) than in the voltmeters (0.7%), eCUF is less than eVUF for all values of VUFref because the CUF is much greater than the VUF that originates it, in all engines, and for all operating points. Observing the simulation results of the three motors, for a value VUFref = 2%, eCUF is approximately between 6% and 11%. These values are clearly lower than the errors observed in eVUF for the same reference value, which are around 30% (eVUF=2% ≈ 30%).
3.3. Proposed Method for VUF Calculation (Method 2—VUF2)
Figure 6 shows the VUF value as a function of Vmean and CUF by using isolines: (a) laboratory results for motor A; (b) simulation results for motor A; (c) simulation results for motor B; (d) simulation results for motor C.
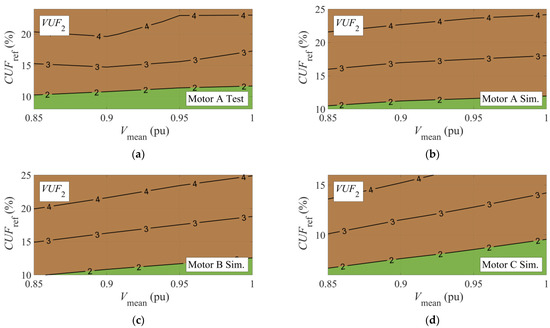
Figure 6.
VUF2 according to Vmean and CUF for: (a) Test results for Motor A; (b) Simulation results for Motor A; (c) Simulation results for Motor B; (d) Simulation results for Motor C.
Using the corresponding graph in Figure 6 (depending on the motor used and whether the starting data are from the laboratory or simulation), the value of VUF2 can be determined from the values of Vmean and CUF (12).
3.4. Influence of Measurement Errors on VUF2
In this section, only the simulation results for the three motors are taken: A, B, and C.
At each of the 20 unbalance points, the maximum error in the VUF, eVUF2,max, is calculated when it is obtained from Vmean and CUF. For this, the maximum error in Vmean due to the voltmeters and the maximum error in the CUF due to the ammeters are considered.
As an example, Figure 7 shows that with values of Vmean = 0.95 pu and CUF = 15%, a VUF of 2.58% is obtained (VUF0.95,15 = 2.58%). If the maximum error of the voltmeters is taken into account to calculate Vmean, when it is 0.95 pu, it implies an oscillation of ±0.09; therefore, Vmean,min = 0.941 and Vmean, max = 0.959. Similarly, if the maximum error of the ammeters is taken into account to calculate the CUF, when it is 15%, it implies an oscillation of 0.7%; therefore, CUFmin = 14.3% and CUFmax = 15.7%. These tolerances give rise to a rectangular surface, where the four vertices, k = {I, II, III and IV}, are the points farthest from the central reference point. The value of VUFk,m is obtained from Vmean and CUF in these four vertices for each motor, where m refers to the test motors, m = {A, B and C}, and the eVUF,k,m is calculated in each of them, according to expression (13). Finally, the eVUF,2 for the coordinate (Vmean, CUF) will be the largest of those calculated at the vertices, as shown in (14). As can be seen, with the parameters in Figure 7, measurement errors can generate VUF values between 2.45% and 2.72%.
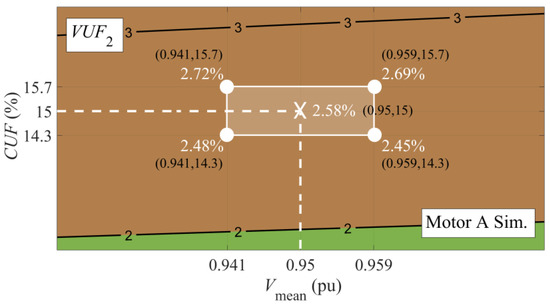
Figure 7.
VUF2 according to measurement errors.
3.5. Comparison of Methods to Obtain VUF
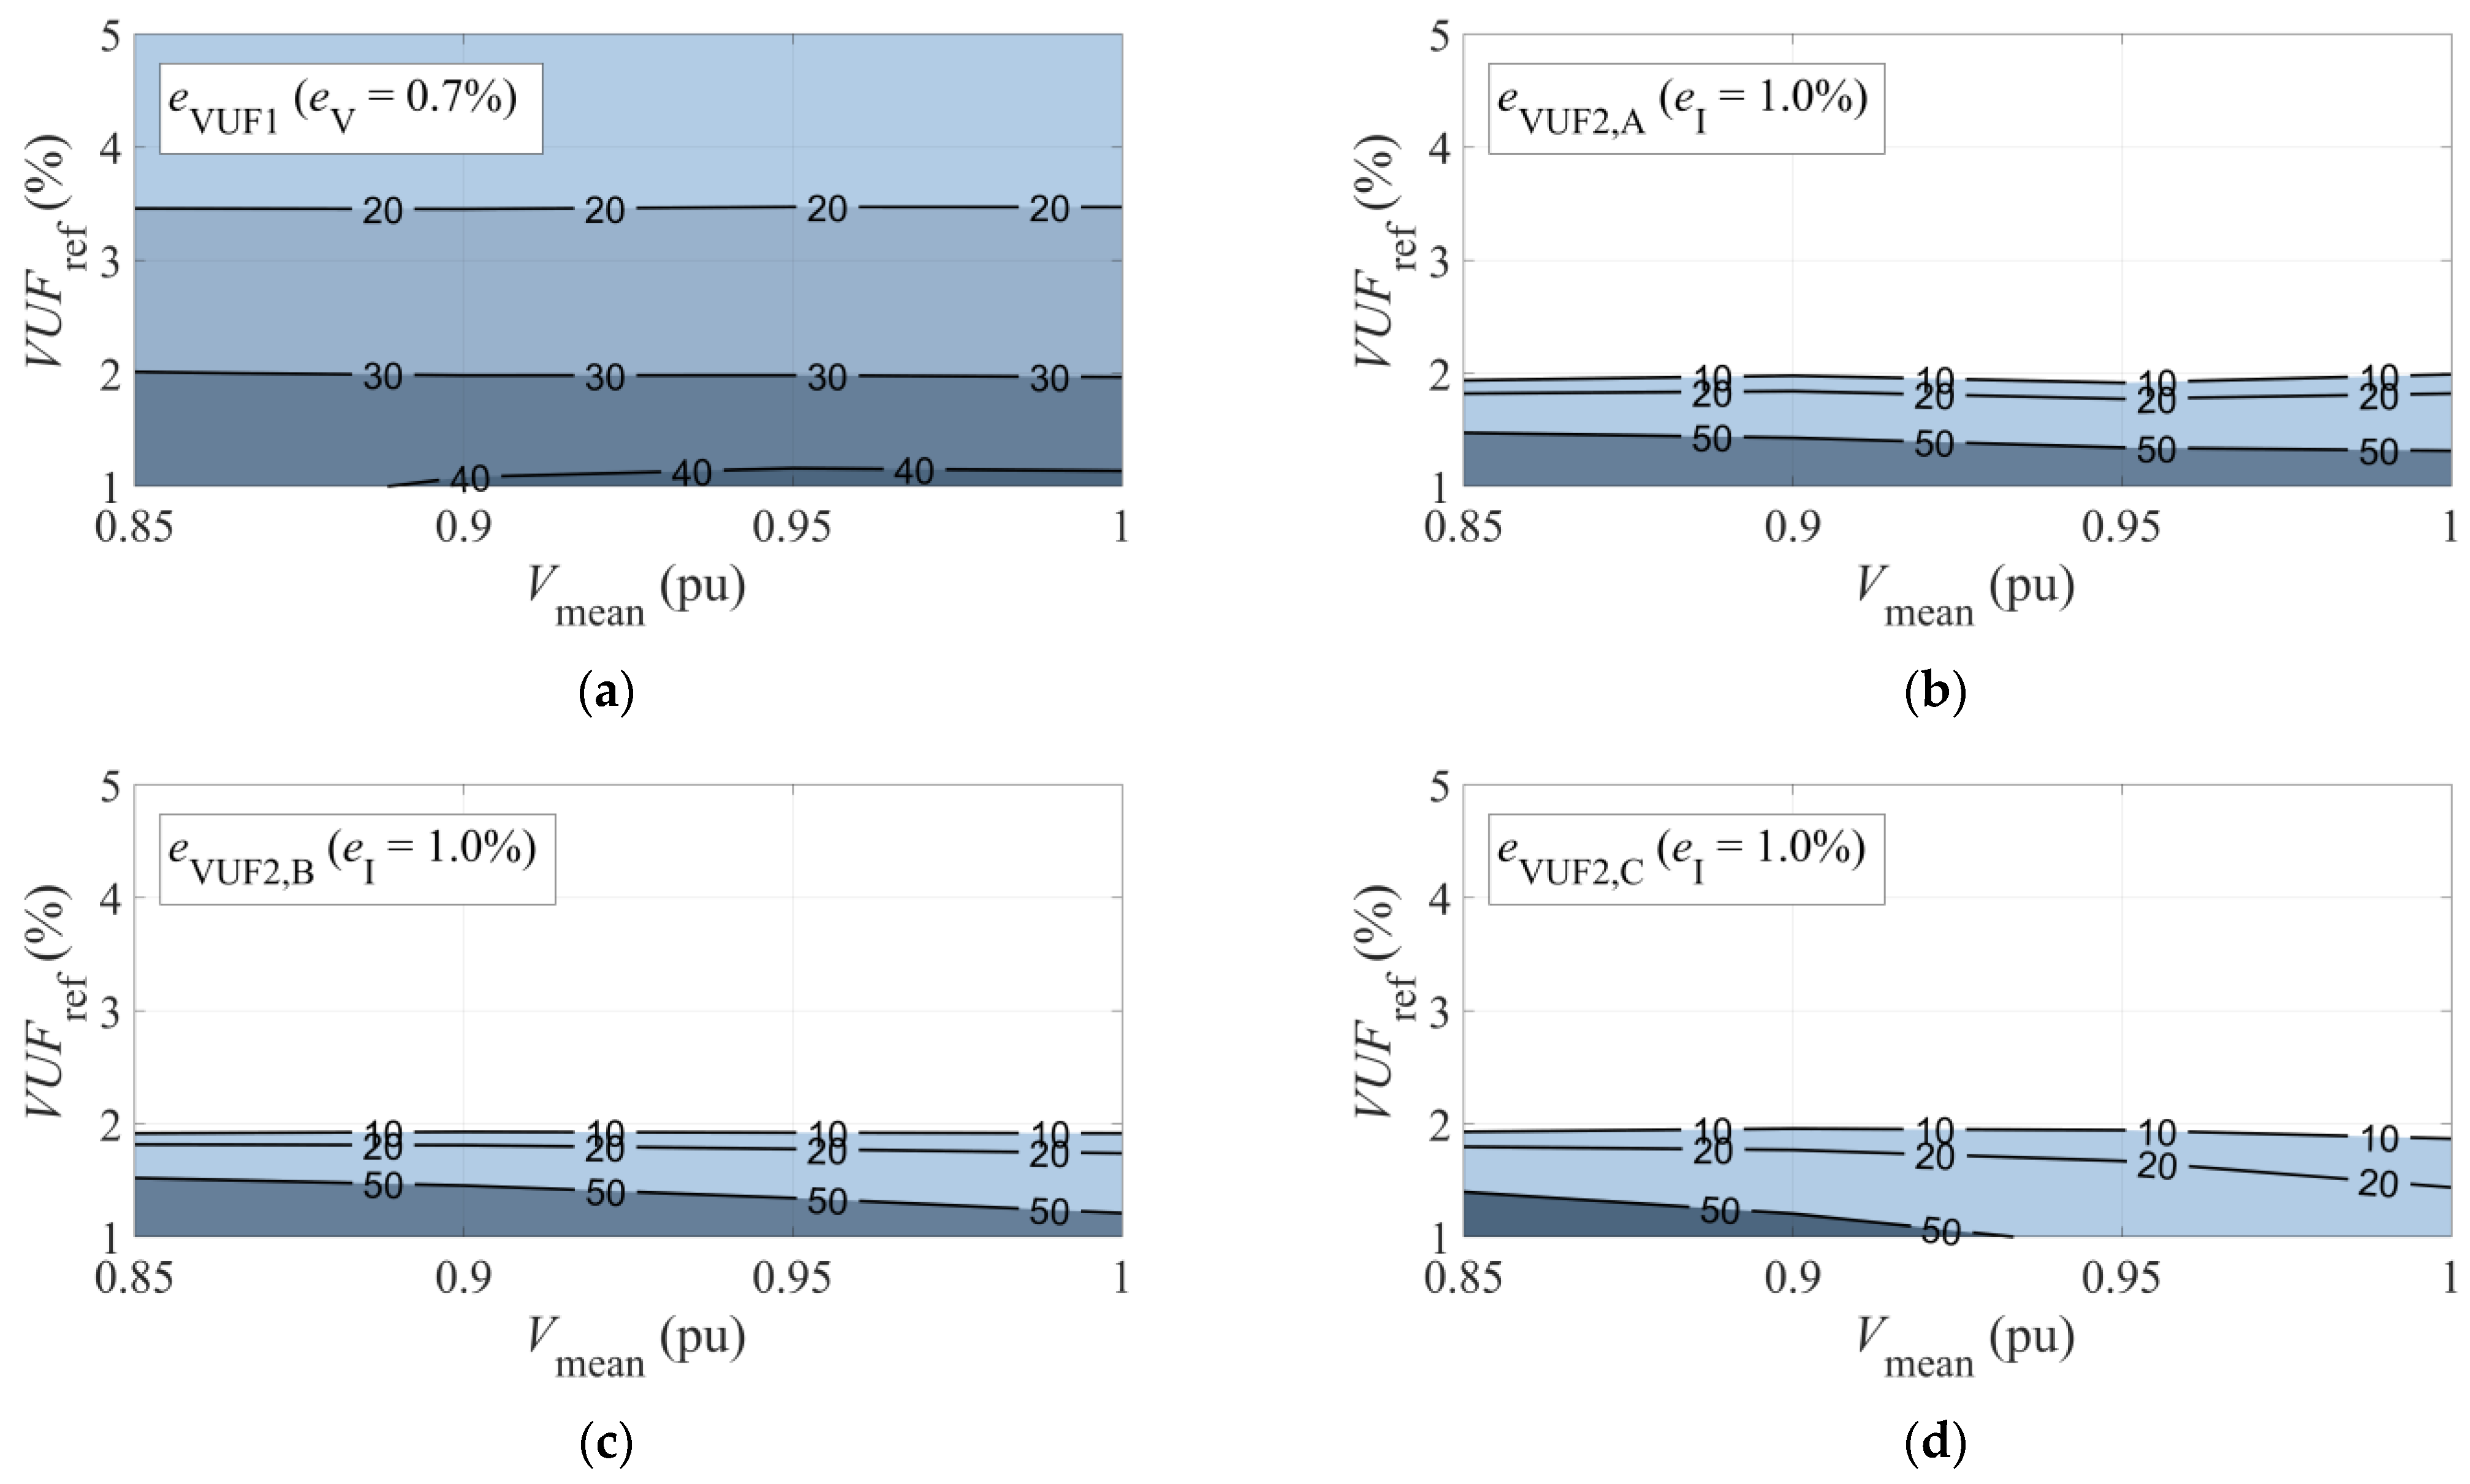
Finally, the errors in the VUF calculation are compared, when it is calculated from the effective value of the three voltmeters -Method 1-, eVUF,1 (Figure 8a), or when it is calculated from Vmean and CUF in each of the three motors analyzed -Method 2-: eVUF2,A (Figure 8b), eVUF2,B (Figure 8c), and eVUF2,C (Figure 8d).
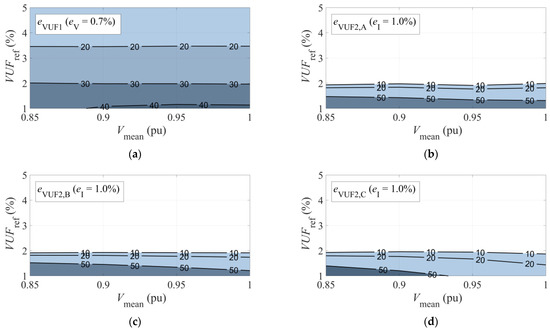
Figure 8.
VUF error according to VUF and Vmean: (a) for Motor A, obtained from eVUF,1; (b) for Motor A, obtained from eVUF2,A; (c) for Motor B, obtained from eVUF2,B; (d) for Motor C, obtained from eVUF2,C.
If all the graphs in Figure 8 are compared for VUFref = 2%, it is observed that eVUF1 ≈ 30%, while eVUF,2,A, eVUF,2,B, and eVUF,2,C are less than 10%.
4. Discussion
This section analyzes the results obtained in the previous section.
4.1. Ratio between CUF and VUF
In order to quantify the error between the CUF values in Motor A, obtained from experimental results (blue lines in Figure 4) and simulation results (cyan lines in Figure 4), the mean square error was calculated in the 20 points of unbalance through (15), obtaining 1.03% as a result.
It is considered that this error corroborates the proximity observed in the previous section between the laboratory and simulation results obtained for Motor A.
4.2. Influence of Measurement Errors on the VUF and CUF
This section presents and analyzes the results of eVUF1, eCUF,A, eCUF,B, and eCUF,C, when VUFref = 2%. The numerical results are presented in Table 4.
Table 4.
VUF and CUF errors for VUFref = 2%.
These results show that the VUF calculation, from the RMS voltage of voltmeters, gives rise to an error of 29.8%, when VUFref = 2%. This fact determines a very high probability of error in determining the balance of the voltage supply provided by an electric company to a customer.
The results also show that in the CUF calculation, from the RMS current in the ammeters, the error is notably lower than that observed in the VUF, when VUFref = 2%. The CUF error is smaller because the current unbalances in three-phase induction motors are considerably higher than the voltage unbalances that originate them.
4.3. VUF as Function of Vmean and CUF
Figure 6a,b shows the VUF values from the laboratory and simulation results for Motor A.
Table 5 shows the VUF2 values, obtained from Vmean and CUFref coordinates, when data come from the laboratory for Motor A, for VUFref ≈ 2%. Similarly, Table 6 shows the values of VUF2, for the same coordinates Vmean and CUFref, from simulation results (VUFref ≈ 2%). The results are quite close to the reference value, being higher when the unbalance is greater.
Table 5.
VUF2 from Vmean and CUFref, from the laboratory tests of Motor A.
Table 6.
VUF2 from Vmean and CUFref, from the simulation results of Motor A.
Comparing the simulation results between the three motors (Figure 6a–c), similar behaviors are observed, but with different numerical values. For a constant CUF value, the VUF decreases roughly linear with increasing Vmean. For a constant Vmean value, the VUF increases roughly linear with increasing CUF.
4.4. Influence of Measurement Errors on Vmean and CUF
Table 7.
VUF errors for VUFref = 2%.
Both the graphical results shown in Section 3.4, and the numerical ones in Table 7, show that obtaining the VUF value has less error if it is calculated from the average value of the three voltmeters and the CUF value (obtained from the three ammeters) than if calculated from the RMS voltage of the voltmeters. Method 2, proposed, is more accurate and appropriate to determine if an electrical energy supply can be considered balanced, or not, according to present regulations.
5. Conclusions
From the experimental results, it is confirmed that there is a roughly linear ratio between the Current Unbalance Factor and the Voltage Unbalance Factor, for a constant value of mean voltage supply lines.
The measurement errors in the voltmeters have a great influence on the calculation of the Voltage Unbalance Factor, particularly for 2%, the maximum value to consider a balanced system according to many standards.
For a three-phase induction motor powered by an unbalanced voltage system, measurement errors in the ammeters also affect the Current Unbalance Factor calculation, but to a lesser extent. This is because the current unbalances are greater than the voltage unbalances that cause them.
A new method for calculating the Voltage Unbalance Factor is proposed, based on the mean voltage supply lines that feed a three-phase induction motor, and the Current Unbalance Factor on the motor. This new method presents less error than the conventional one, where the mean values are obtained from the Root Mean Square value of the line voltages.
Author Contributions
Conceptualization, L.G.-P., S.G.-R., A.A.J.-M. and E.V.-I.; methodology, L.G.-P., S.G.-R., A.A.J.-M. and E.V.-I.; software, L.G.-P. and S.G.-R.; validation, L.G.-P., S.G.-R., A.A.J.-M. and E.V.-I.; formal analysis, L.G.-P., S.G.-R., A.A.J.-M. and E.V.-I.; investigation, L.G.-P., S.G.-R., A.A.J.-M. and E.V.-I.; resources, L.G.-P. and E.V.-I.; data curation, L.G.-P. and A.A.J.-M.; writing—original draft preparation, L.G.-P. and A.A.J.-M.; writing—review and editing, L.G.-P., S.G.-R., A.A.J.-M. and E.V.-I.; visualization, L.G.-P., S.G.-R., A.A.J.-M. and E.V.-I.; supervision, L.G.-P., S.G.-R., A.A.J.-M. and E.V.-I.; project administration, L.G.-P. and E.V.-I.; funding acquisition, E.V.-I. All authors have read and agreed to the published version of the manuscript.
Funding
Grant PID2021-124229NB-I00 funded by MCIN/AEI/10.13039/501100011033 and by “ERDF A way of making Europe”.
Conflicts of Interest
The authors declare no conflict of interest.
References
- Flumian, D.; Ladoux, P.; Sarraute, E. Calculation of the Voltage Unbalance Factor for High-Speed Railway Substations with V-Connection Scheme. Electronics 2022, 11, 595. [Google Scholar] [CrossRef]
- Flumian, D.; Ladoux, P.; Sarraute, E. Calculation of the Voltage Unbalance Factor for 25 kV–50 Hz Railway Substations. In Proceedings of the 2022 International Conference on Harmonics & Quality of Power, Naples, Italy, 29 May–1 June 2022. [Google Scholar]
- Bogarra, S.; Saura, J.; Rolán, A. New Smart Sensor for Voltage Unbalance Measurements in Electrical Power Systems. Sensors 2022, 22, 8236. [Google Scholar] [CrossRef] [PubMed]
- EN50160: ‘Voltage Characteristics of Electricity Supplied by Public Electricity Net-Works’. Available online: https://www.en-standard.eu/21-30431799-dc-bs-en-50160-voltage-characteristics-of-electricity-supplied-by-public-distribution-networks/ (accessed on 1 July 2010).
- Hamici, Z.; Abu-Elhaija, W. Power Conditioning with Intelligent Control Using a Novel Recursive Stochastic Optimization. IEEE Trans. Ind. Electron. 2019, 66, 3721–3730. [Google Scholar] [CrossRef]
- Mousavi, S.Y.M.; Jalilian, A.; Savaghebi, M.; Guerrero, J.M. Flexible compensation of voltage and current unbalance and harmonics in microgrids. Energies 2017, 10, 1568. [Google Scholar] [CrossRef]
- Nakadomari, A.; Shigenobu, R.; Kato, T.; Krishnan, N.; Hemeida, A.M.; Takahashi, H.; Senjyu, T. Unbalanced voltage compensation with optimal voltage controlled regulators and load ratio control transformer. Energies 2021, 14, 2997. [Google Scholar] [CrossRef]
- Saroha, J.; Singh, M.; Jain, D.K. ANFIS-Based add-on controller for unbalance voltage compensation in a low-voltage microgrid. IEEE Trans. Ind. Inform. 2018, 14, 5338–5345. [Google Scholar] [CrossRef]
- Shigenobu, R.; Nakadomari, A.; Hong, Y.Y.; Mandal, P.; Takahashi, H.; Senjyu, T. Optimization of voltage unbalance compensation by smart inverter. Energies 2020, 13, 4623. [Google Scholar] [CrossRef]
- Pérez Vallés, A.; Salmerón Revuelta, P. A new distributed measurement index for the identification of harmonic distortion and/or unbalance sources based on the IEEE Std. 1459 framework. Electr. Power Syst. Res. 2019, 172, 96–104. [Google Scholar] [CrossRef]
- Aderibigbe, A.; Ogunjuyigbe, A.; Ayodele, R.; Samuel, I. The performance of a 3-phase induction machine under unbalance voltage regime. J. Eng. Sci. Technol. Rev. 2017, 10, 136–143. [Google Scholar] [CrossRef]
- Al-Badri, M.; Pillay, P.; Angers, P. A Novel in Situ Efficiency Estimation Algorithm for Three-Phase Induction Motors Operating with Distorted Unbalanced Voltages. IEEE Trans. Ind. Appl. 2017, 53, 5338–5347. [Google Scholar] [CrossRef]
- Deleanu, S.; von Lipinski, G.; Iordache, M.; Stanculescu, M.; Niculae, D. Performance Evaluation of the Three-Phase Induction Motor Operating in Conditions of Unbalanced Voltage Supply. In Proceedings of the 8th International Conference on Modern Power Systems, Cluj-Napoca, Romania, 21–23 May 2019. [Google Scholar]
- Fernandes Neves, A.B.; de Leles Ferreira Filho, A.; de Mendonça, M.V.B. Effects of voltage unbalance on torque and efficiency of a three-phase induction motor. In Proceedings of the International Conference on Harmonics and Quality of Power, Belo Horizonte, Brazil, 16–19 October 2016; pp. 679–683. [Google Scholar]
- Lee, C.Y.; Chen, B.K.; Lee, W.J.; Hsu, Y.F. Effects of various unbalanced voltages on the operation performance of an induction motor under the same voltage unbalance factor condition. Electr. Power Syst. Res. 1998, 47, 153–163. [Google Scholar] [CrossRef]
- Donolo, P.; Bossio, G.; de Angelo, C.; García, G.; Donolo, M. Voltage unbalance and harmonic distortion effects on induction motor power, torque and vibrations. Electr. Power Syst. Res. 2016, 140, 866–873. [Google Scholar] [CrossRef]
- Guasch-Pesquer, L.; Jaramillo-Matta, A.A.; Gonzalez-Molina, F.; Garcia-Rios, S. Analysis of Current Unbalance and Torque Ripple Generated by Simulations of Voltage Unbalance in Induction Motors. In Proceedings of the Workshop on Engineering Applications, Cartagena, Colombia, 27–29 September 2017. [Google Scholar]
- Mollet, Y.; Pergolesi, M.; Sarrazin, M.; Janssens, K.; van der Auweraer, H.; Chiariotti, P.; Castellini, P.; Gyselinck, J. Multi-Physical Signature Analysis of Induction Machines under Unbalanced Supply Voltage. In Proceedings of the International Conference on Electrical Machines, Alexandroupoli, Greece, 3–6 September 2018; pp. 2378–2384. [Google Scholar]
- Gonzalez-Cordoba, J.L.; Osornio-Rios, R.A.; Granados-Lieberman, D.; Romero-Troncoso, R.D.J.; Valtierra-Rodriguez, M. Correlation Model between Voltage Unbalance and Mechanical Overload Based on Thermal Effect at the Induction Motor Stator. IEEE Trans. Energy Convers. 2017, 32, 1602–1610. [Google Scholar] [CrossRef]
- Munoz Tabora, J.; de Lima Tostes, M.E.; Ortiz De Matos, E.; Holanda Bezerra, U.; Mota Soares, T.; Santana De Albuquerque, B. Assessing Voltage Unbalance Conditions in IE2, IE3 and IE4 Classes Induction Motors. IEEE Access 2020, 8, 186725–186739. [Google Scholar] [CrossRef]
- Kim, Y.J. Development and Analysis of a Sensitivity Matrix of a Three-Phase Voltage Unbalance Factor. IEEE Trans. Power Syst. 2018, 33, 3192–3195. [Google Scholar] [CrossRef]
- Quispe, E.C.; Santos, V.S.; López, I.D.; Gómez, J.R.; Viego, P.R. Theoretical Analysis of the Voltage Unbalance Factor to Characterize Unbalance Problems in Induction Motors. Int. Rev. Electr. Eng. 2021, 16, 8–16. [Google Scholar] [CrossRef]


Publisher’s Note: MDPI stays neutral with regard to jurisdictional claims in published maps and institutional affiliations. |
© 2022 by the authors. Licensee MDPI, Basel, Switzerland. This article is an open access article distributed under the terms and conditions of the Creative Commons Attribution (CC BY) license (https://creativecommons.org/licenses/by/4.0/).