Article

Study on the Effect of Fracturing Pump Start and Stop on Tubing Fluid-Structure Interaction Vibration in HPHT Wells via MOC

Xi’an Key Laboratory of Wellbore Integrity Evaluation, Xi’an Shiyou University, Xi’an 710065, China
*
Author to whom correspondence should be addressed.
Energies 2022, 15(24), 9291; https://doi.org/10.3390/en15249291
Submission received: 12 October 2022 / Revised: 24 November 2022 / Accepted: 27 November 2022 / Published: 7 December 2022
(This article belongs to the Special Issue Challenges and Research Trends of Unconventional Oil and Gas)

Abstract

:
The processes of HTHP well fracturing, oil drive, and gas recovery are accompanied by the non-stationary flow of medium in the tubing, which may lead to periodic vibration and cause the failure and fatigue of the tubing, thread leakage, and bending deformation. In this paper, a fluid–structure interaction model with 4-equation was established, which considered the unsteady flow of fluid and the motion state of tubing during the periodic injection, pump start, and shutdown of fluid in the tubing. Further, the discrete solution of MOC was used to obtain the variation of fluid flow rate and pressure, tubing vibration rate, frequency, and additional stress with time. The resonance construction parameters corresponding to different tubing diameters were analyzed by discussing the effects of different start and shutdown times as well as pressure on the tubing vibration parameters. The results show that under the periodic injection condition, increasing the tubing diameter or start inside pressure would lead to a sharp increase in the axial additional stress of the tubing generated by fluid–structure interaction, which is not conducive to the safety protection of the tubing. When the pump was shutdown, excessively short operation times and high pressure in the tubing would lead to excessive transient loads in addition to resonance, which would cause damage to the pipeline. Finally, corresponding to the above analysis results, this paper proposes the optimal injection parameters to avoid the generation of resonance, which provides a theoretical basis and reference range for the safe service conditions of the tubing.

1. Introduction

The fluid–structure interaction of tubing and medium in an oil field is the main factor that causes vibration, and if the effect is too violent, it may lead to the destruction or leakage of tubing, loss of the seal of the packer, and even cause serious accidents such as explosions and combustion [1,2]. The tubing fluid–structure interaction is a coupled interference between the medium and the pipe wall. When a medium with complex boundary conditions, such as pulsating pressure, passes through the tubing, it will generate certain forces on the tubing and thus cause tubing vibration. The vibration of the tubing due to the change in internal pressure is affected by external conditions such as fluid pressure, flow rate, boundary constraints, pressure changes, etc. The main operating conditions include pump start or shutdown and pumping pressure fluctuation [3]. Since the time of pump shutdown is shorter than the time of start, and the pressure in the tubing changes more frequently in a short period of time, the effect of vibration is usually more significant when the pump is stopped [4]. In addition, the vibration displacement and deformation of tubing will also cause space changes in the medium, and the process of mutual coupling is called the fluid–structure interaction of tubing [5]. There are many researches on fluid–structure interaction nowadays, and they have quite in-depth discussions in some areas, such as vibration characteristics analysis, modeling, and theoretical solution algorithms.
Some of the research obtained the tubing vibration behavior through experiments and data analysis. Focusing on fluid–structure interaction, Zeng et al. [6] investigated the vibration attenuation characteristics of periodic composite tubing and predicted the attenuation intensity within the stopping band frequency. Sang et al. [7] performed modal analysis of empty and filled tubing, then investigated the tubing resonance phenomenon. Sunil Kumar et al. [8,9] conducted parametric research and numerical fine-tuning to explore the chattering instability behavior of a cantilevered fluid transfer pipe by using sliding mass and spring. Starting from the pressure pulsation of the pipe caused by the reciprocating pump fluid, Lu et al. [10] calculated the pressure pulsation and unbalanced excitation force in the pipe under the action of reciprocating pump, and then analyzed the vibration regularity of the pipe system by arithmetic example and finally proposed the vibration reduction measures.
In terms of theoretical research on vibration models, Guo et al. [11] used the energy method and Hamilton’s principle to develop a nonlinear vibration model for tubing and analyzed the fatigue life of pipelines in two typical horizontal and directional wells that had different yields and different tubing diameters. Simandjuntak et al. [12] used the RS-fluid structure interaction finite element analysis method to investigate the effect of geometric parameters on the stress distribution in bent pipe. Thari et al. [13] proposed an adaptive reduced-order model to effectively simulate the complexity of time-resolved and nonlinear deformation fluid–structure interaction effects. Moradi et al. [14] obtained a hybrid model by combining an extended Wagner method with a hydroelastic one, which can be extended to three dimensions and applied to more complex structures. Gao et al. [15] proposed a reduced-order modeling approach to support parallel tubing and obtained a new reduced-order model.
In terms of theoretical solution algorithms, numerical methods are currently the mainstream solution. The general approach is to solve the system of partial differential equations in the vibration model with advanced mathematical computational methods and then use the program iteratively to calculate the numerical solution of the unknown parameters. Haeseong Cho et al. [16] implemented a model downscaling of the grid method by using orthogonal decomposition and discrete empirical interpolation methods and obtained the FSI framework based on the semi-implicit coupling method. Schussnig et al. [17] proposed a high-order accurate and additional mass-stable fluid–structure interaction scheme, compared several hidden and semi-implicit variables of the algorithm, and verified the convergence of the algorithm in space and time. With the widespread application of computers, the use of numerical simulation software has gradually developed into the most common method for fluid–structure interaction vibration calculations, and people are constantly developing and researching more accurate and convenient numerical solution software [18].
At present, the fluid–structure interaction of vibration theory has made some progress in oil testing and well completion in the well site. Liu et al. [19] established a dual nonlinear vibration model for oil and gas well tubing, solved it by the Newmark method, and further verified the validity of it through experiments. Wu et al. [20] established a finite element model of tubing buckling with geometric and contact nonlinearity for HTHP gas wells, then simulated this behavior for the whole well section, which provides a technical basis for gas wells. The vibration of fluid–structure interaction caused by periodic fluid injection is very likely to cause long-term resonance due to its long duration of action and close to the inherent frequency of some tubing sections or equipment. Pump starts and shutdowns are inevitable during the production process, and the accident risk on the oil site cost too much, so the theoretical research on vibration hazard containment and protection is urgently needed to be improved.
Based on the above, this paper both introduces the fluctuation disciplinarian of fluid pressure in the periodically injected tubing and considered the pump shutdown condition, then established the downhole tubing fluid–structure interaction vibration equations and solved them theoretically. This research also used the numerical simulation software to calculate and obtain the vibration parameters of the tubing with periodically injected and pump shutdown and analyze their parameter variation regularity. Finally, specific and reasonable construction suggestions are made for the safe construction of tubing in well sites.

2. Method

During the flow of the medium in the tubing, if the encountered cross-section changes, a pressure wave will be generated and move upstream. While the radial fluid pressure will act on the pipe wall, it would cause circumferential stress in the tubing cross-section, which in turn induces a stress wave along the pipeline through the Poisson effect, causing expansion or contraction of the tubing, and finally in turn affecting the fluid pressure wave [20,21]. The process can be solved according to the classical water hammer 4-equation model, with the equation expression as:
  • Motion equations of medium:
v t + 1 ρ l p z = f | v r | v r 4 r t
v z + 1 ρ l a l 2 p t γ r t A s t t A l u z = 0
  • Motion equations of tubing:
u t 1 ρ s σ z z = f ρ l 2 A l | v r | v r 4 r t ρ s A s c s u ρ s A s
u z 1 E s σ z t + γ r t E s t t p t = 0
where:
v—liquid flow rate;
p—liquid pressure;
vr—mean relative velocity of liquid;
ρl—fluid density;
rt—tubing internal diameter;
al—fluid wave velocity;
tt—tubing wall thickness;
γ—Poisson ratio;
As—tubing cross-sectional area;
Al—fluid cross-sectional area;
u—tubing vibration velocity;
σz—tubing axial stress;
f—external forces on the element;
cs—tubing axial damping coefficient;
ρs—tubing density;
Es—modulus of string elasticity;
x,y,z—direction of parameter action;
The coupling equation is written in matrix form as:
A z [ v p u σ z ] + B t [ v p u σ z ] = F
A = [ 0 1 ρ l 0 0 1 0 γ r t A s t t A l 0 0 0 0 1 ρ s 0 0 1 0 ] , B = [ 1 0 0 0 0 1 ρ l a l 2 0 0 0 0 1 0 0 γ r t E s t t 0 1 E s ] , F = [ f | v r | v r 4 r t 0 f ρ l 2 A l | v r | v r 4 r t ρ s A s c s u ρ s A s 0 ]
Perform factor substitution, let a 23 = γ r t A s t t A l , a 34 = 1 ρ s , b 22 = 1 ρ l a l 2 , b 42 = γ r t E s t t , b 44 = 1 E s , F 1 = f | v r | v r 4 r t , F 3 = f ρ l 2 A l | v r | v r 4 r t ρ s A s c s u ρ s A s , finding the characteristic roots gives:
Δ = | A λ B | = | λ 1 ρ l 0 0 1 λ b 22 a 23 0 0 0 λ a 34 0 λ b 42 1 λ b 44 | = 0
If we expanded the fourth-order determinant, there would be 24 terms. Omit 0 items, such as: C13, C14, C24, C31, C32, C41, then it could become C11C22C33C44 + C43C34C21C12 + C11C23C34C42 − C12C21C33C4X − C43C34C22 C11 = 0, thus the characteristic equation becomes:
λ 4 b 22 b 44 + a 34 ρ l + λ 2 a 23 a 34 b 42 λ 2 ρ l λ 2 a 34 b 22 = 0
Substituting the coefficients into the above equation:
λ 4 1 ρ l a l 2 E s λ 2 ( γ r t A s t t A l 1 ρ s γ r t E s t t + 1 ρ l 1 ρ s ρ l a l 2 ) 1 ρ l ρ s = 0
Then, the characteristic root was:
λ 1 , 2 = ± a ˜ l = ± a s 1 2 ( 1 + a l 2 / a 2 ) 1 2 ( 1 + a l 2 / a 2 ) 2 4 a l 2 / a s 2 λ 3 , 4 = ± a ˜ s = ± a s 1 2 ( 1 + a l 2 / a 2 ) + 1 2 ( 1 + a l 2 / a 2 ) 2 4 a l 2 / a s 2
where:
as—tubing stress wave velocity;
λ—eigenvalue;
In these equations, l, and s are the actual wave velocity after the coupling of liquid pressure and tubing stress, which
a s = E s ρ s , a l = E l ρ l ( 1 + E l d t / E s t t ) , a = a s 2 γ 2 ( r t / t t ) ( ρ l / ρ s ) + 1 , the axial stress in the tube section can be expressed as, σ z = f z A s . Then, the system of partial differential equations can be reduced to a system of ordinary ones as follows:
C 1 { d v d t + 1 λ ρ l d p d t + 2 γ a s 2 / λ 2 1 d u z d t 2 γ λ ρ s A s ( a s 2 / λ 2 1 ) d f z d t = F 1 + 2 γ [ F 3 c d u z / ρ s A s ] a s 2 / λ 2 1 d z d t = λ = ± a ˜ l
C 2 { d v d t + 1 λ ρ l d p d t ρ s t t ( λ 2 / a l 2 1 ) ρ l r t γ d u z d t + t t ( λ 2 / a l 2 1 ) λ A s ρ l r t γ d f z d t = F 1 + ρ s t t ( λ 2 / a l 2 1 ) [ F 3 c d u z / ρ s A s ] ρ l r t γ d z d t = λ = ± a ˜ s
Therefore, the compatibility equation can be expressed as:
v p v A 1 + 1 a ˜ l ρ l ( p p p A 1 ) + 2 γ a s 2 / a ˜ l 2 1 ( u z p u z A 1 ) 2 γ a ˜ l ρ s A s ( a s 2 / a ˜ l 2 1 ) ( f z p f z A 1 ) = A 1 p F 1 d t + 2 γ a s 2 / a ˜ l 2 1 A 1 p ( F 3 c d u z / ρ s A s ) d t
v p v A 2 1 a ˜ l ρ l ( p p p A 2 ) + 2 γ a s 2 / a ˜ l 2 1 ( u z p u z A 2 ) + 2 γ a ˜ l ρ s A s ( a s 2 / a ˜ l 2 1 ) ( f z p f z A 2 ) = A 2 p F 1 d t + 2 γ a s 2 / a ˜ l 2 1 A 1 p ( F 3 c d u z / ρ s A s ) d t
v p v A 3 + 1 a ˜ p ρ l ( p p p A 3 ) ρ s t t ( a ˜ p 2 / a l 2 1 ) ρ l r t γ ( u z p u z A 3 ) + t t ( a ˜ p 2 / a l 2 1 ) a ˜ p A s ρ l r t γ ( f z p f z A 3 ) = A 3 p F 1 d t ρ s t t ( a ˜ p 2 / a l 2 1 ) ρ l r t γ A 3 p ( F 3 c d u z / ρ s A s ) d t
v p v A 4 1 a ˜ p ρ l ( p p p A 4 ) ρ s t t ( a ˜ p 2 / a l 2 1 ) ρ l r t γ ( u z p u z A 4 ) t t ( a ˜ p 2 / a l 2 1 ) a ˜ p A s ρ l r t γ ( f z p f z A 4 ) = A 4 p F 1 d t ρ s t t ( a ˜ p 2 / a l 2 1 ) ρ l r t γ A 4 p ( F 3 c d u z / ρ s A s ) d t
The entrance boundary conditions are p 0 j = c o n s t , u z , 0 j = 0 , v 0 j = c o n s t . According to Equations (12) and (14), there was results can be obtain as follows:
v p = v A 2 + 1 a ˜ l ρ l ( p p p A 2 ) 2 γ a s 2 / a ˜ l 2 1 ( u z p u z A 2 ) 2 γ a ˜ l ρ s A s ( a s 2 / a ˜ l 2 1 ) ( f z p f z A 2 ) A 2 p F 1 d t 2 γ a s 2 / a ˜ l 2 1 A 1 p ( F 3 c d u z / ρ s A s ) d t
f z p = [ 1 a ˜ l ρ l ( p p p A 4 ) ( v p v A 4 ) 2 γ a s 2 / a ˜ l 2 1 ( u z p u z A 4 ) + A 4 p F 1 d t + 2 γ a s 2 / a ˜ l 2 1 A 4 p ( F 3 c d u z / ρ s A s ) d t ] / 2 γ a ˜ l ρ s A s ( a s 2 / a ˜ l 2 1 ) + f z A 4
Additionally, the exit boundary conditions is p i j = p 0 j Δ p ρ l g h , v i = u z , i , and the substitution calculation process is similar to the above method, so the calculation is omitted here for brevity.

3. Results

Based on the established fluid–structure interaction model, the vibration parameters of the 6500 m downhole tubing were calculated under the periodic injection of fluid and the pump shutdown condition, and the initial setting parameters were taken as shown in Table 1. The results include the fluid pressure, flow rate, tubing vibration speed, frequency, and additional stress in the tubing. These results were calculated under different pressure, flow rate and time.

3.1. Calculation Results of Cycle Injection

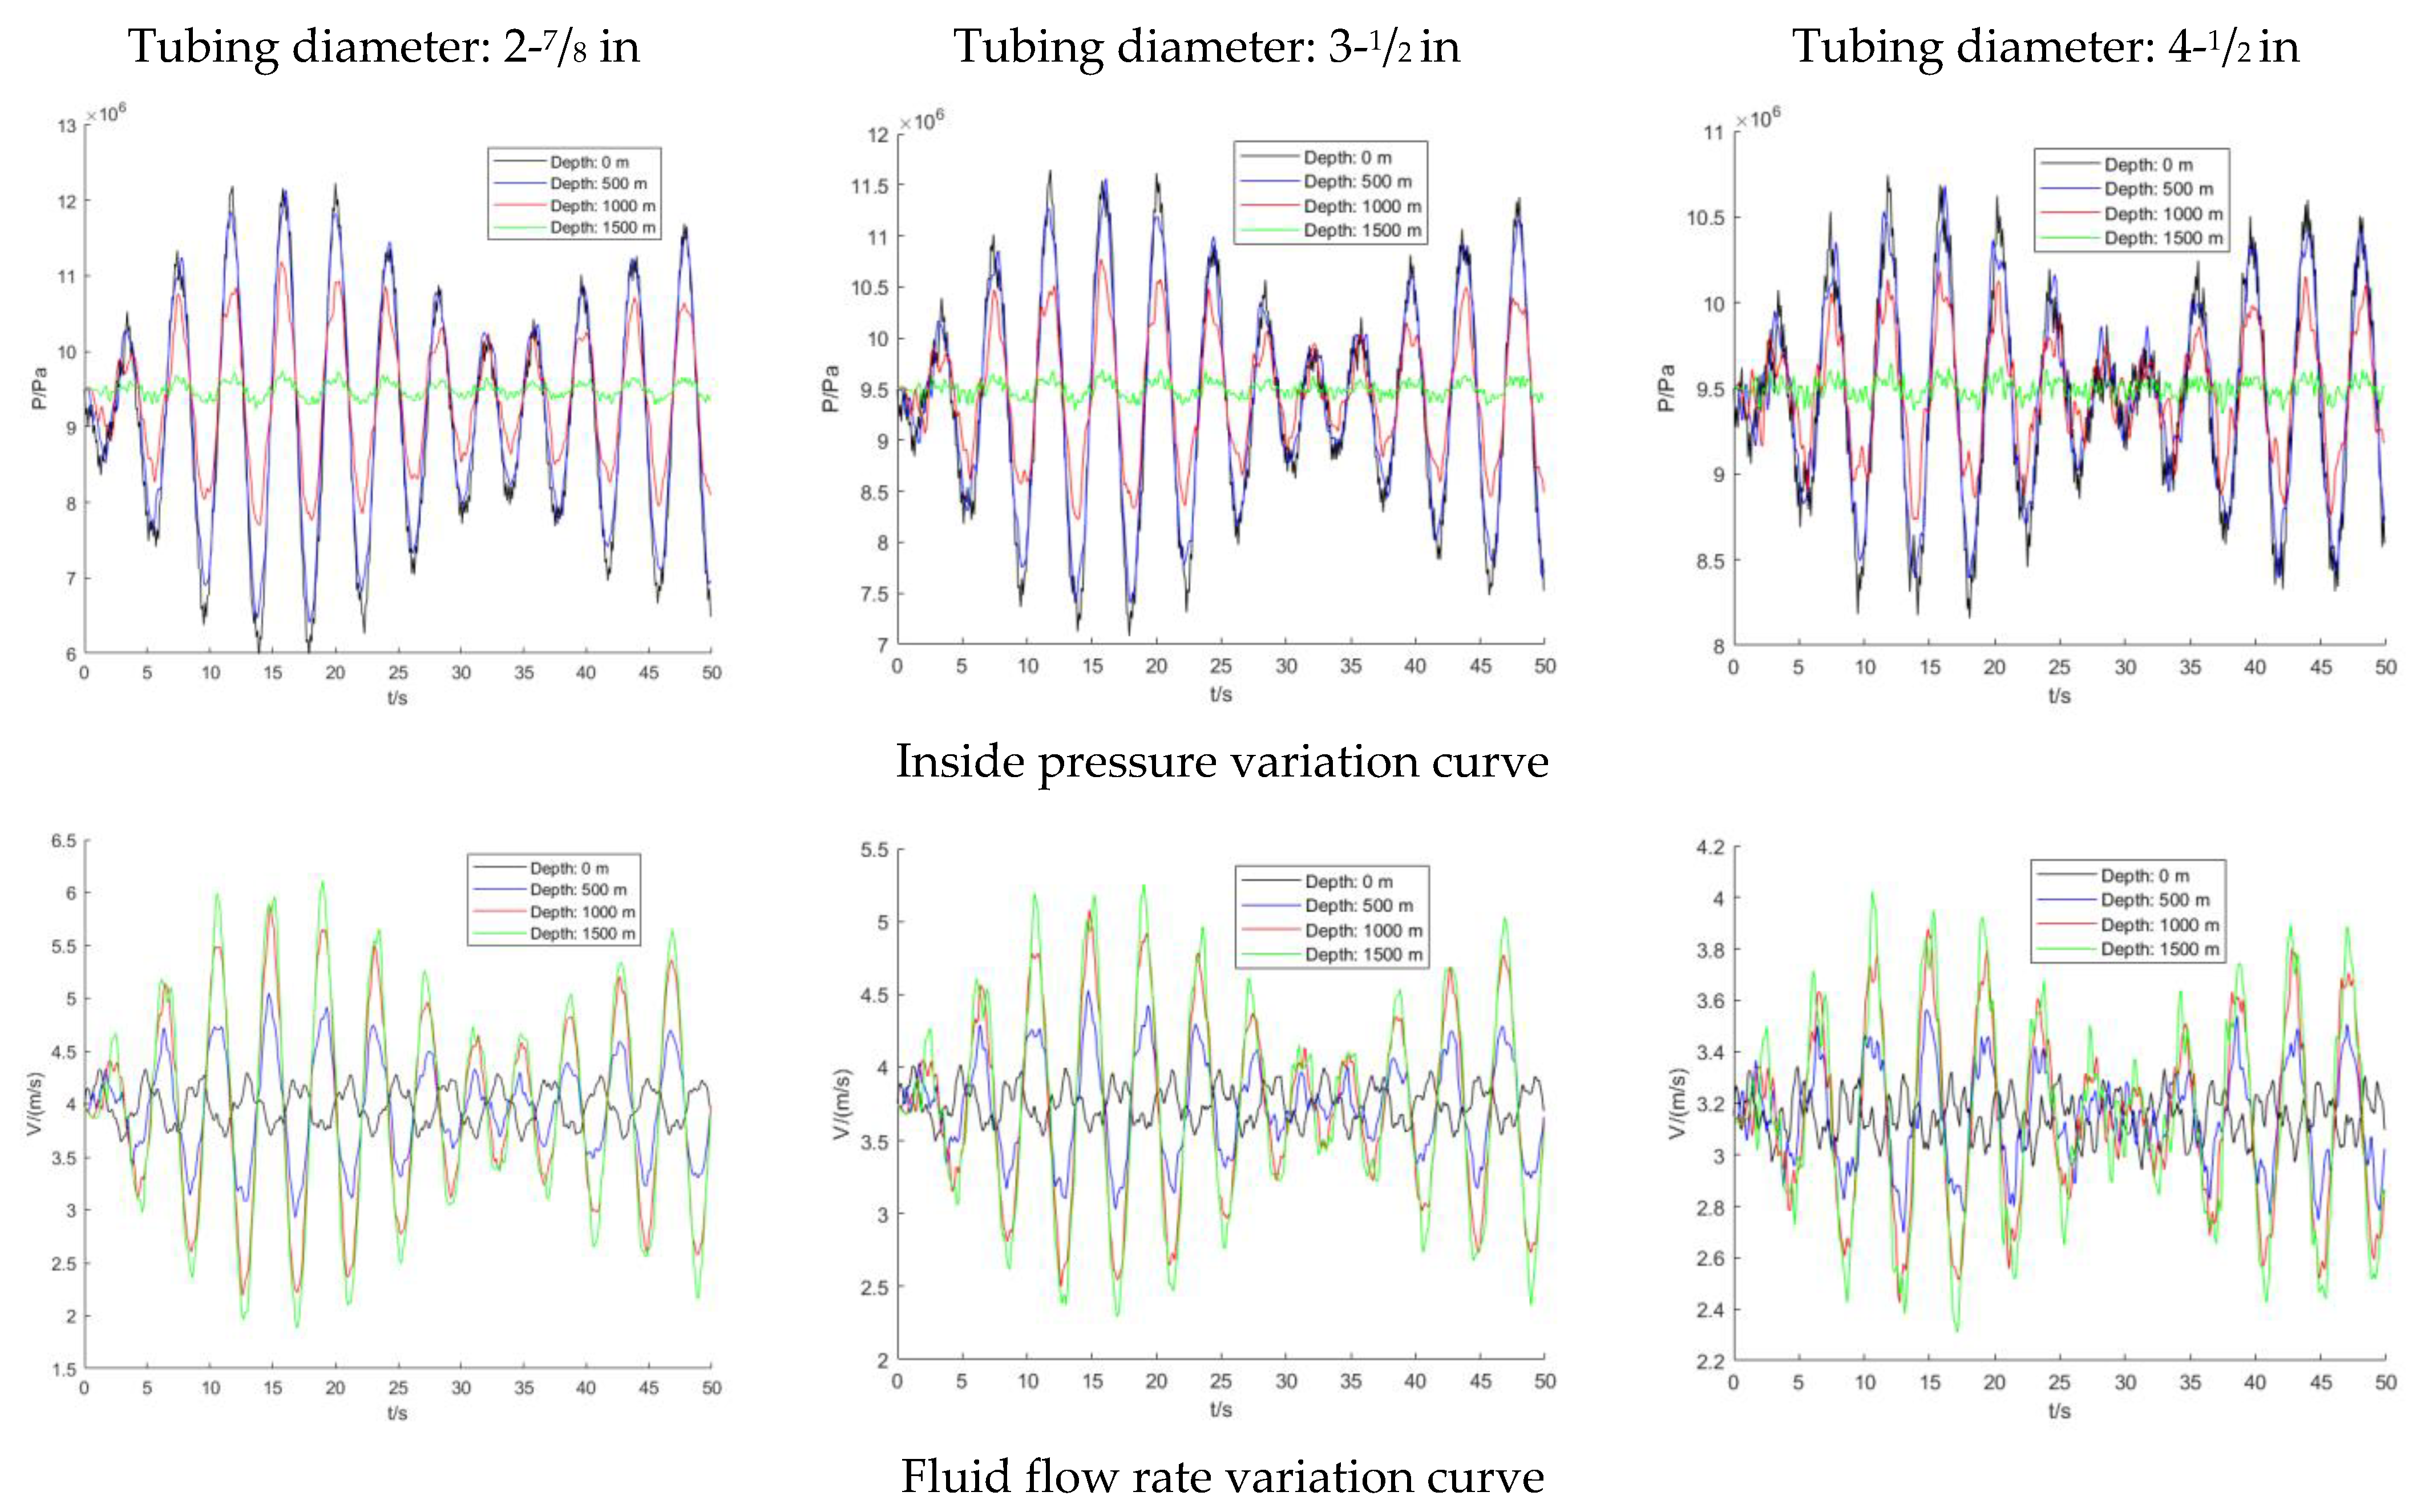
3.1.1. Calculation Results of Periodic Injection Flow Field Parameters

When the length of the tubing with a single inner diameter is too long, the natural frequency will decrease sharply. In order to observe the periodic response of the flow field during the periodic injection process, the tubing length selected as 1500 m. When the same initial pressure of 9.5 MPa was applied with the tubing of different internal diameters, the calculation results were shown in Figure 1. It could be seen that, affected by the tubing vibration, the change of pressure not only has the short period of 4 s, but also close to 30 s or longer. This was due to multiple pressure waves generated by the tubing movement, and it could influence the pressure superposition cycle, and finally promote each other and cut the peak situation.
The pressure in the tubing decreases with the increase of the diameter, and the peak pressure at the initial end of the three diameters was 12.67 MPa, 11.78 MPa and 10.82 MPa, respectively, with the peak pressure in the 4-1/2″ tubing decreasing by 15% compared to the 2-7/8″. At the same time, the inside pressure also decreases gradually with increasing depth. In the 2-7/8″ tubing, the inside pressure at 1500 m depth is only 9.65 MPa, compared to the initial end of the same diameter tubing, it dropped near 24%. This was due to the fact that the pressure variation exists near the wellhead tubing, and it is reduced by friction when transmitted inside the tubing, and the pressure variation is weakened when it is transmitted downhole. Although the internal pressure decreases as the diameter increases, the frequency of change is significantly faster.
The change trend of the flow rate frequency of different tubing diameters is consistent with the inside pressure. Meanwhile, the fluid flow rate in the tubing also decreases with the increase diameter. The peak flow velocities at 1500 m downhole for the three diameters were 6.11 m/s, 5.25 m/s and 4.02 m/s, respectively, with the peak flow velocity of the 4-1/2″ tubing decreasing by 60% compared to the 2-7/8″ one. In the 2-7/8″ tubing, the fluid flow rate in the 1500 m deep tubing increased by 41% compared to the wellhead flow rate of 4.32 m/s.
When different initial pressures were applied to the 3-1/2″ inner diameter tubing, the calculation results of the pressure variation parameters were shown in Figure 2. For the same size of tubing, the stress amplitude of the inside pressure would be different for different initial pressures, but the frequency of the pressure was similar. The higher the initial pressure, the higher the inside pressure amplitude. The corresponding peak values were 10.20 MPa, 11.28 MPa, and 12.30 MPa at the pump start pressure of 8 MPa, 9 MPa, and 10 MPa, respectively. The flow field pressure when starting the pump with 10 MPa was increased nearly 21% compared to the same operation with 8 MPa. At the same time, the pressure gradient decreases from wellhead to downhole in order, with the inside pressure at the wellhead being the maximum.
The period variation regularity of the fluid flow velocity in the tubing was similar to that of the pressure, and both have similar large and small period rules. At the same time, the flow velocity of the flow field in the tubing is almost identical at three different pump start pressures. Additionally, for the flow velocity gradient in the distribution along the pipeline, the deeper the depth, the faster the flow velocity. The flow velocity at 1500 downhole at the pump start was 5.25 m/s, while it was only 4.01 m/s at the initial position of the tubing, which was 23.6% lower compared to 1500 downhole.

3.1.2. Calculation Results of Periodic Injection Tubing Parameters

When the initial pressure of 9.5 MPa was given to different tubing diameters, the axial vibration velocity curves and axial additional stresses of the obtained tubing were shown in Figure 3. It can be observed that the axial vibration velocity of the tubing is not significantly affected by the difference in tubing diameter, and the peak values fluctuate between 0.13 m/s and 0.14 m/s. The vibration velocity of the tubing at the wellhead is the highest, and nearer to the bottom of the well was smaller.
When a large diameter tubing was used, the additional axial stress amplitude was affected by the flow field coupling vibration in the tubing. The maximum stress value was 39 MPa when the diameter with 2-7/8″ in, and 4-1/2″ reaches more than 42 MPa, an increase of nearly 7%. The additional axial stress at the bottom of the well was the highest, while the stress near the wellhead was lower. It is also clear from the parameter vibration curve that the frequency of the additional stress in the axial direction would be accelerated when the diameter of the tubing increases.
When different initial pressures were applied to the downhole tubing with a diameter of 3-1/2″, the interaction vibration parameters of the tubing affected by the flow field were shown in Figure 4. The trend of axial vibration velocity was basically the same, which indicates that the initial pressure was not the main factor affecting the axial vibration velocity of the tubing. The axial vibration velocity at the wellhead of the tubing was the fastest. However, closer to the bottom of the well, the vibration velocity is slower. When the same initial start pressure was applied to different inner diameters of the tubing, it could be observed from the calculation results that there were several relative extreme values of the axial vibration speed amplitude of the tubing from the start of the pump until 50 s of operation. However, in the three different tubing dimensions, the smaller extreme values increase as the diameter rises. This indicated that the tubing diameter influenced the average speed of axial vibration to a certain extent, and the larger the tubing diameter was, the higher the average vibration speed would be.
It can be seen from the calculation results of additional axial stress that the maximum value of additional axial stress increases with the increase of initial pressure. When the pump was started at 8 MPa, the maximum axial additional stress of the tubing was 34 MPa, while when the pump was started at 10 MPa, the axial additional stress was close to 40 MPa, with an increase of 18%. The stress value at the bottom of the hole was the highest, and the closer it was to the wellhead, the smaller it was.

3.2. Calculation Results of Pump Shutdown Operating Parameters

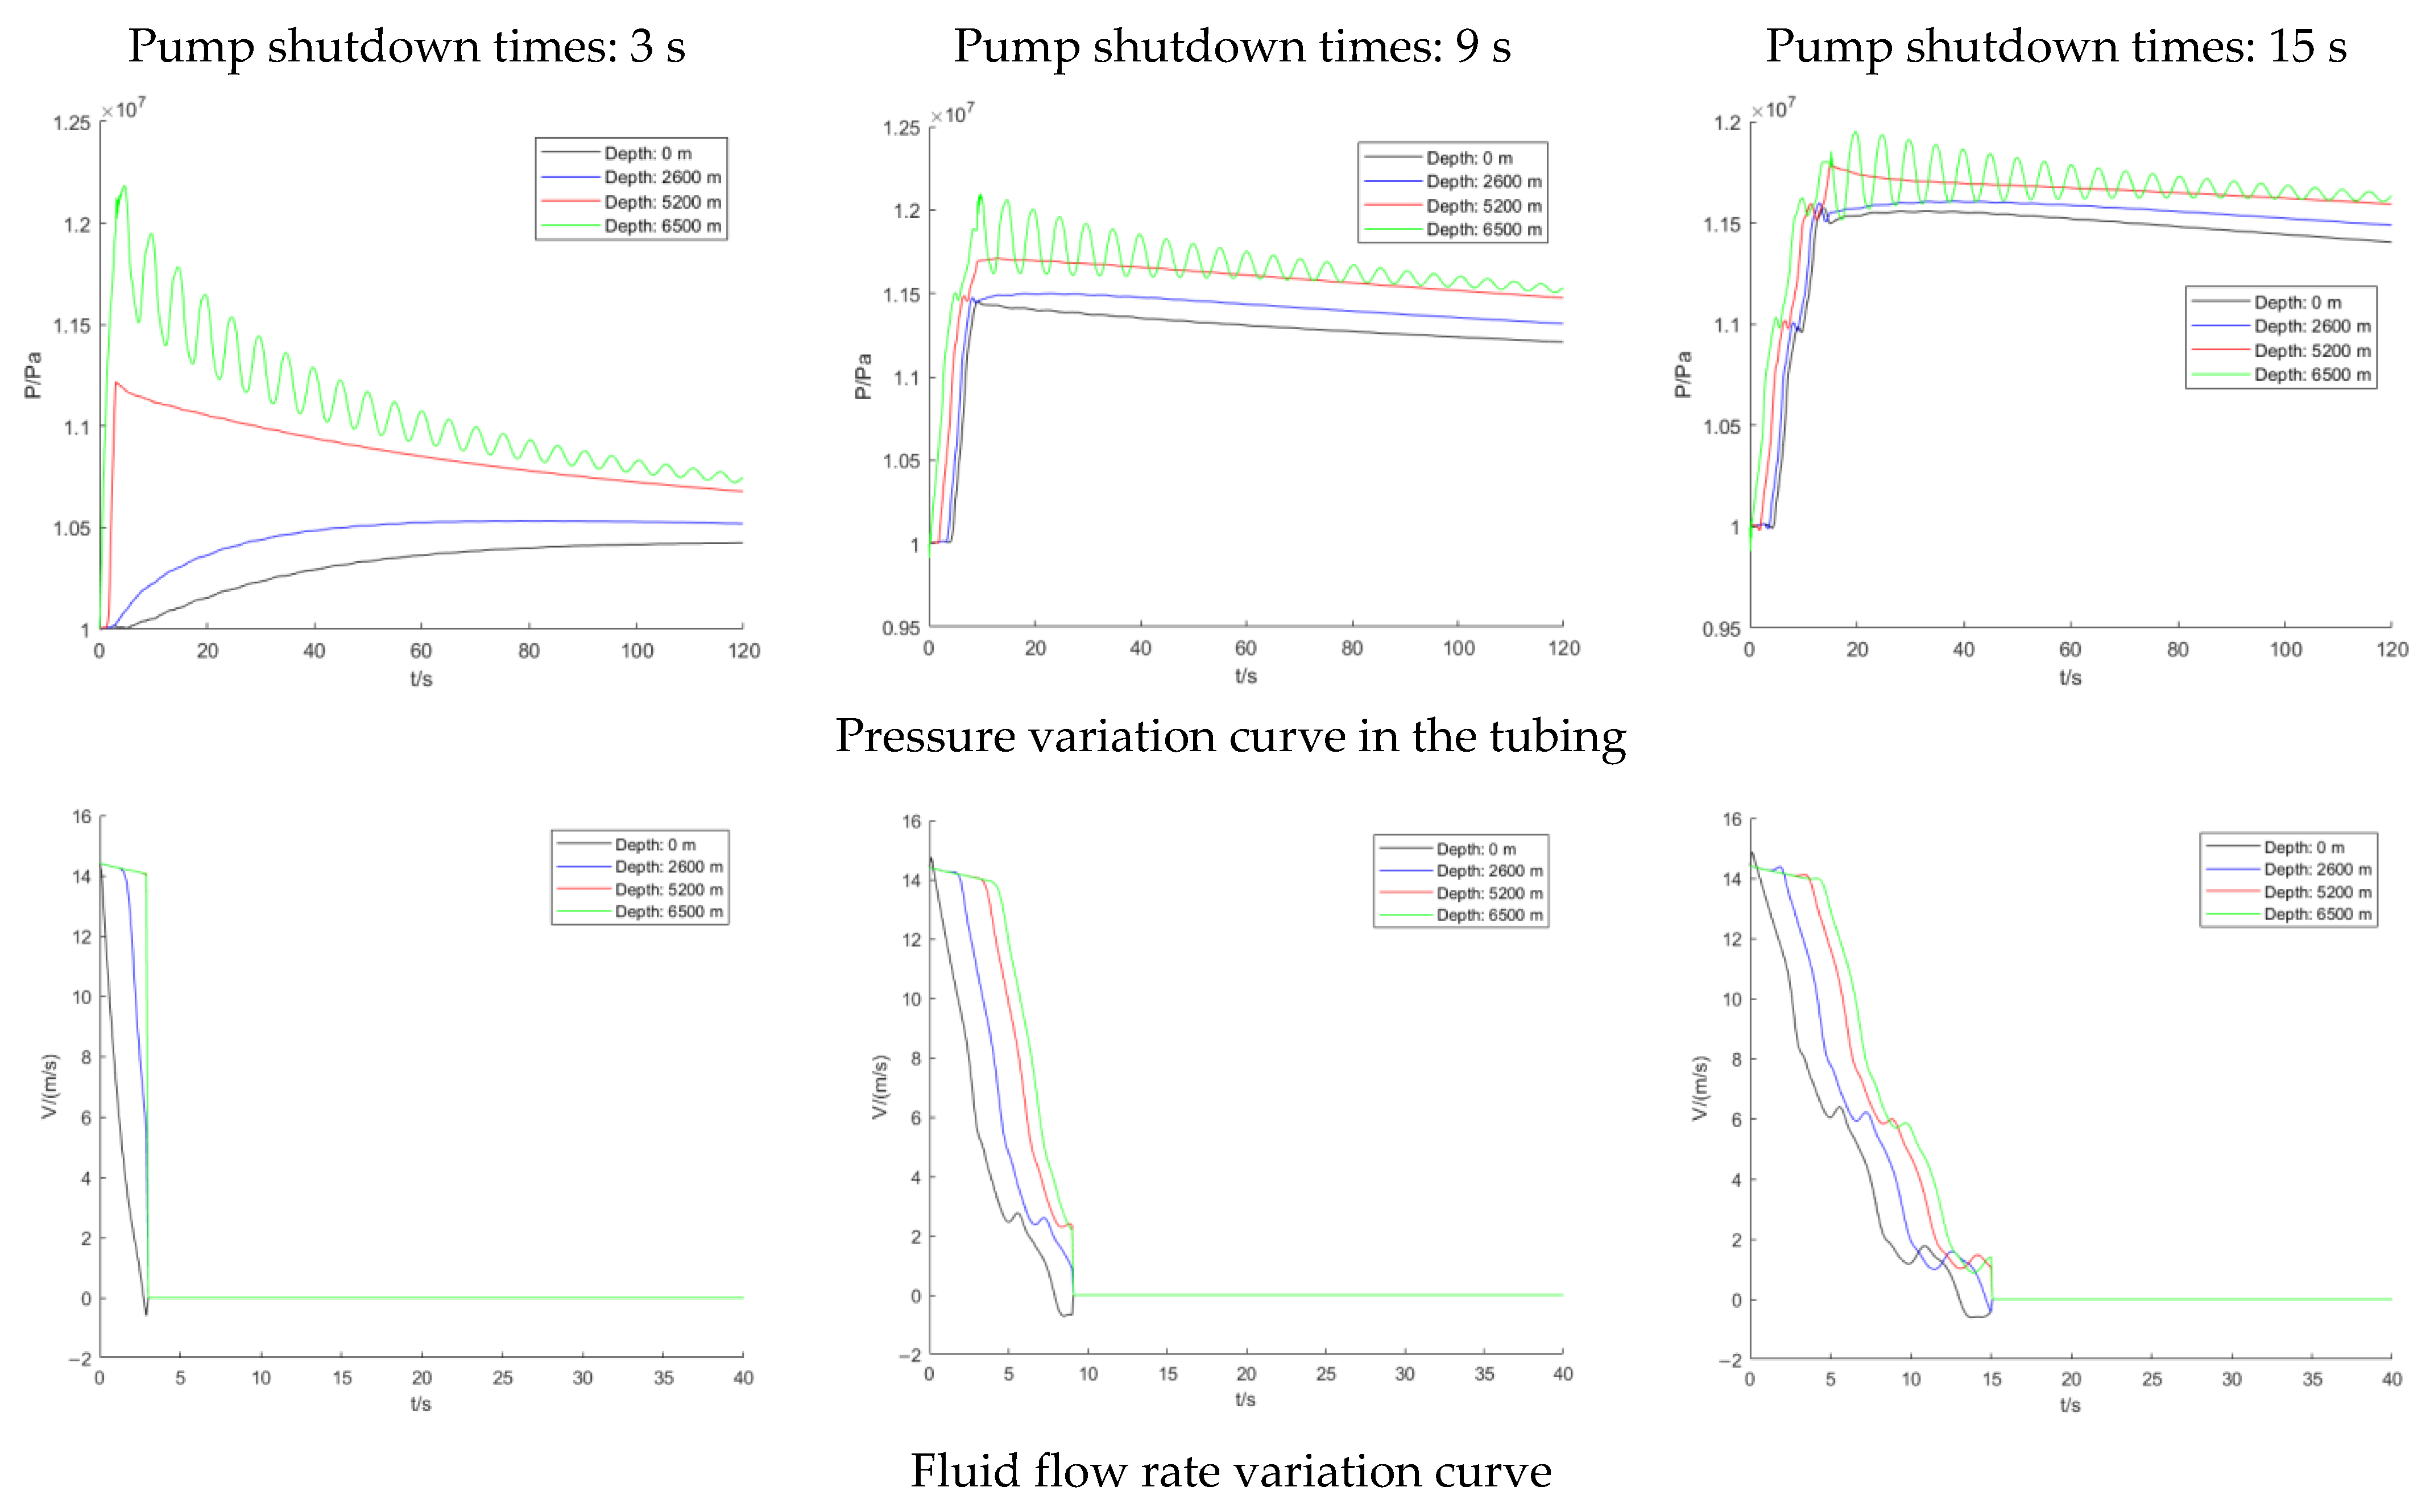
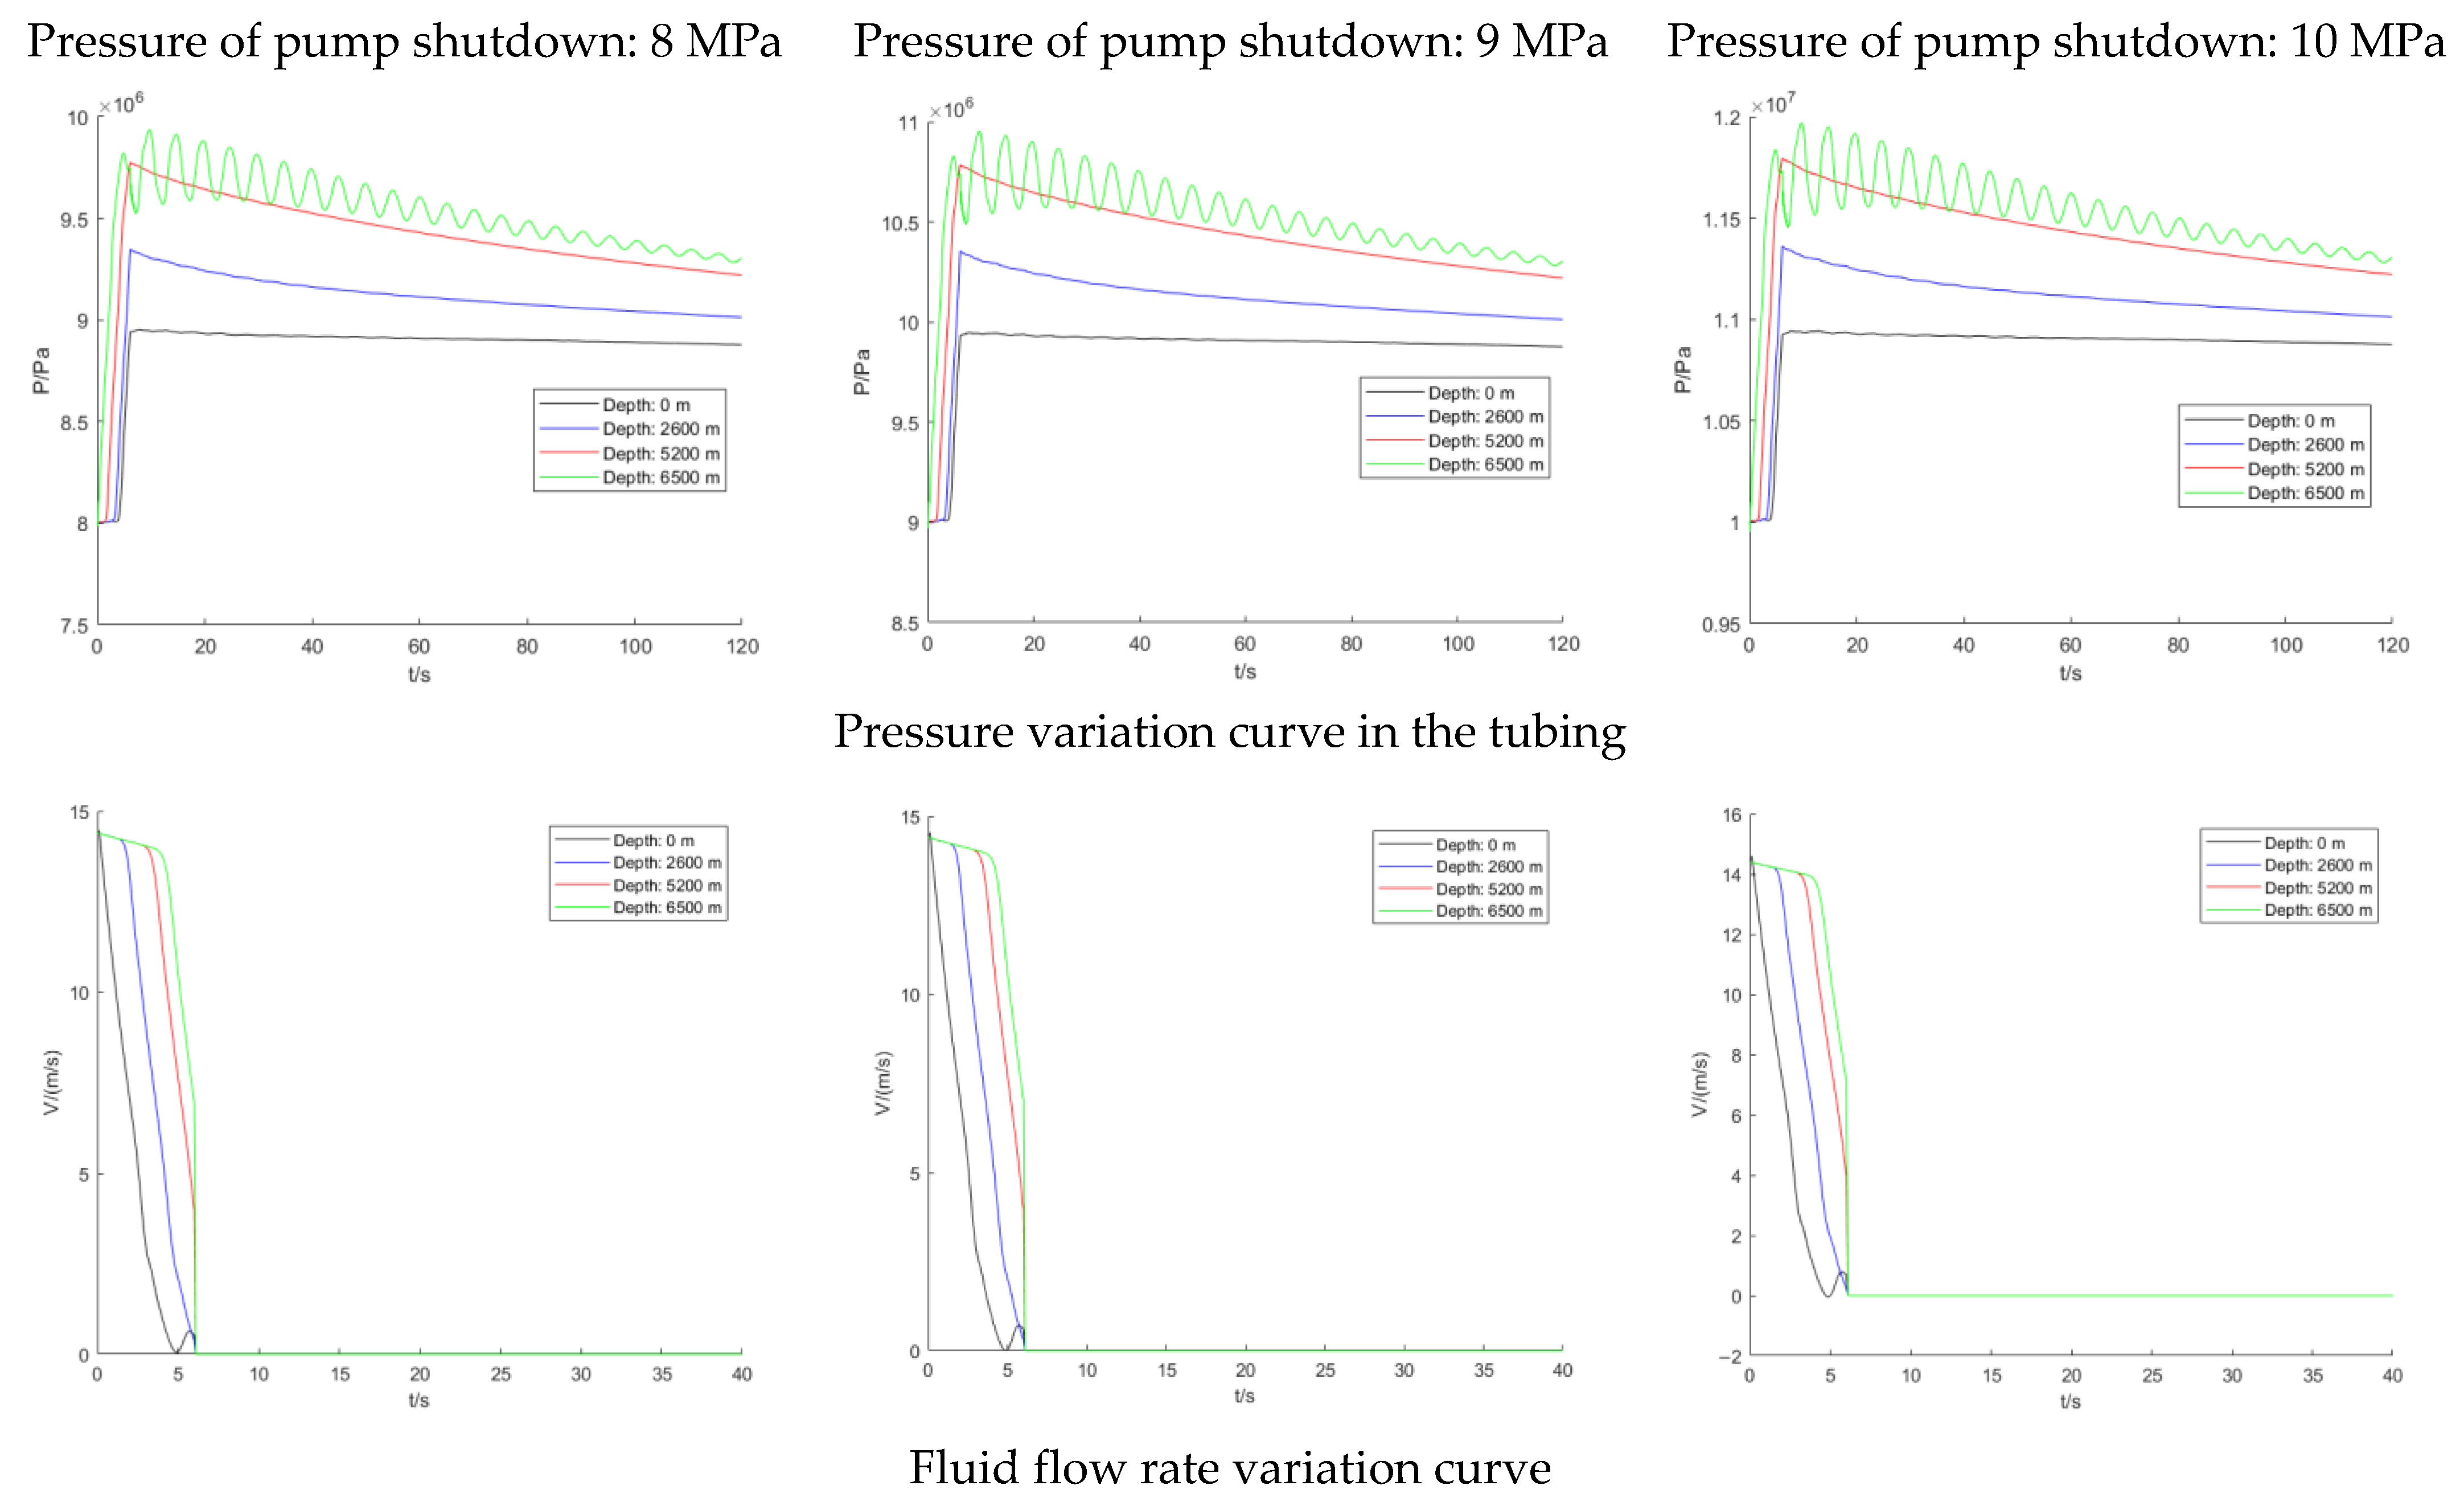
3.2.1. Calculation Results of Flow Field Parameters in Pump Shutdown Condition

When the initial pump shutdown pressure of the surface pipeline is 10 MPa and the pump stop time is 3 s, 9 s, and 15 s, the variation curve of the parameters of pressure and flow velocity in the tubing with time is calculated with different pump shutdown times of the 6500 m pipeline, as shown in Figure 5. Both tubing pressure and flow velocity will fluctuate at the instant of pump stop. For the pressure inside the tubing, when the pump shutdown occurs, the tubing pressure would increase rapidly in a short time during the process. The tubing pressure would be reduced after the pump stops. In the whole time domain of numerical fluctuation, the pressure in the bottomhole tubing was the highest. When the pump was shut down for 3 s, the pressure in the bottomhole tubing could rise to 12.2 MPa at its highest. It also decreases along the line to the wellhead. Additionally, the longer the pump stop time, the smaller the peak fluctuation of pressure in the tubing, and the inverse relationship.
For the flow rate of the medium in the tubing, the flow rate at the bottom of the well was the largest throughout the range of numerical fluctuations and decreases to the wellhead in the direction of the pipeline. The overall trend of the flow rate decreases in an approximately linear relationship until stationary at different pump shutdown times.
The calculated inside pressure and flow velocity at 6 s pump shutdown under different inside pressures were shown in Figure 6. The effect of initial pressure on the variation of the inside flow field is only reflected in the numerical difference, and the effect on the fluctuation trend was small. At different shutdown pressures, the inside pressure increases rapidly during the shutdown process, reached a peak at the end of the operation, and finally decreases gradually after the finish. At all three different initial pressures, the inside pressure at the bottom of the well was maximum and decreased continuously along the pipeline direction to the wellhead. However, due to the different magnitude of the initial shutdown pressure, the flow field pressure showed a large difference in values. The maximum flow field pressure was close to 9.9 MPa when the pump was shut down at 8 MPa, and it was also close to 12 MPa when the pump was stopped at 10 MPa, an increase of about 20%. The overall situation showed that the higher the initial pressure in the tubing when the pump is shutdown, the higher the peak fluctuation.
However, the flow velocity in the tubing variation with the different pump shutdown pressure was not significant, as all fluctuations were between 14.5 m/s to 14.6 m/s. The overall situation showed that the flow rate at the bottom of the well was much higher than the wellhead position during the pump shutdown.

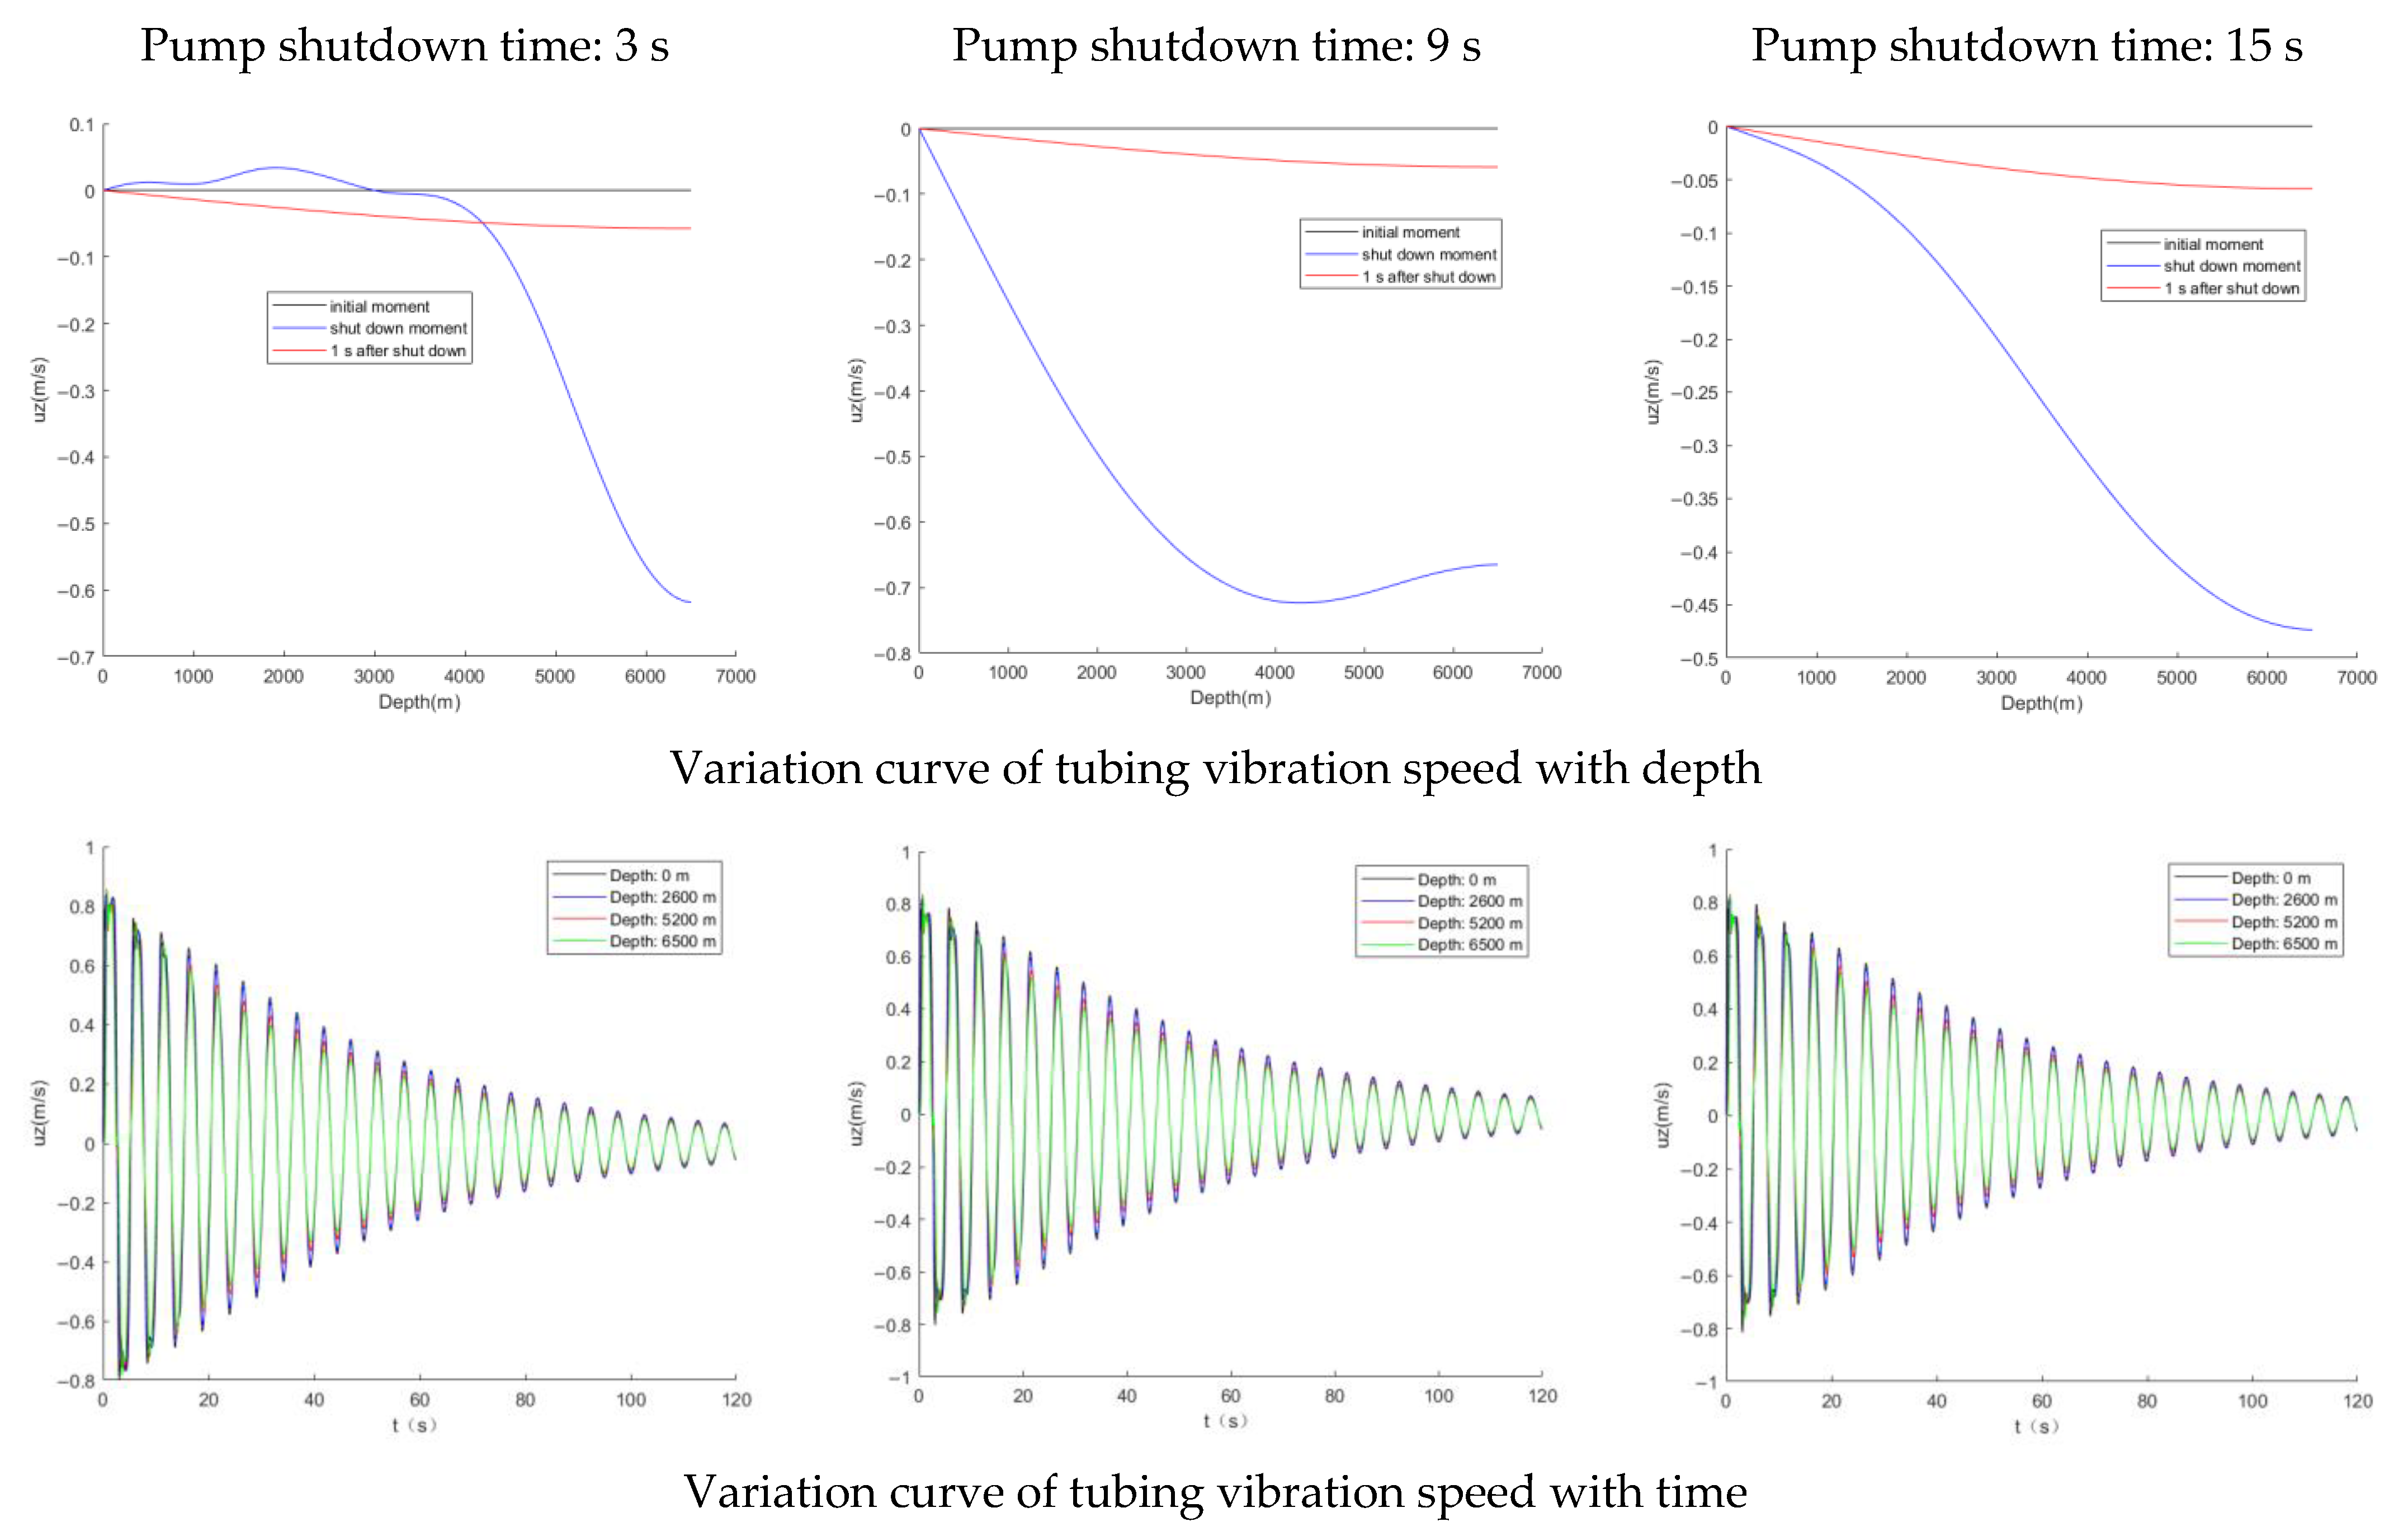
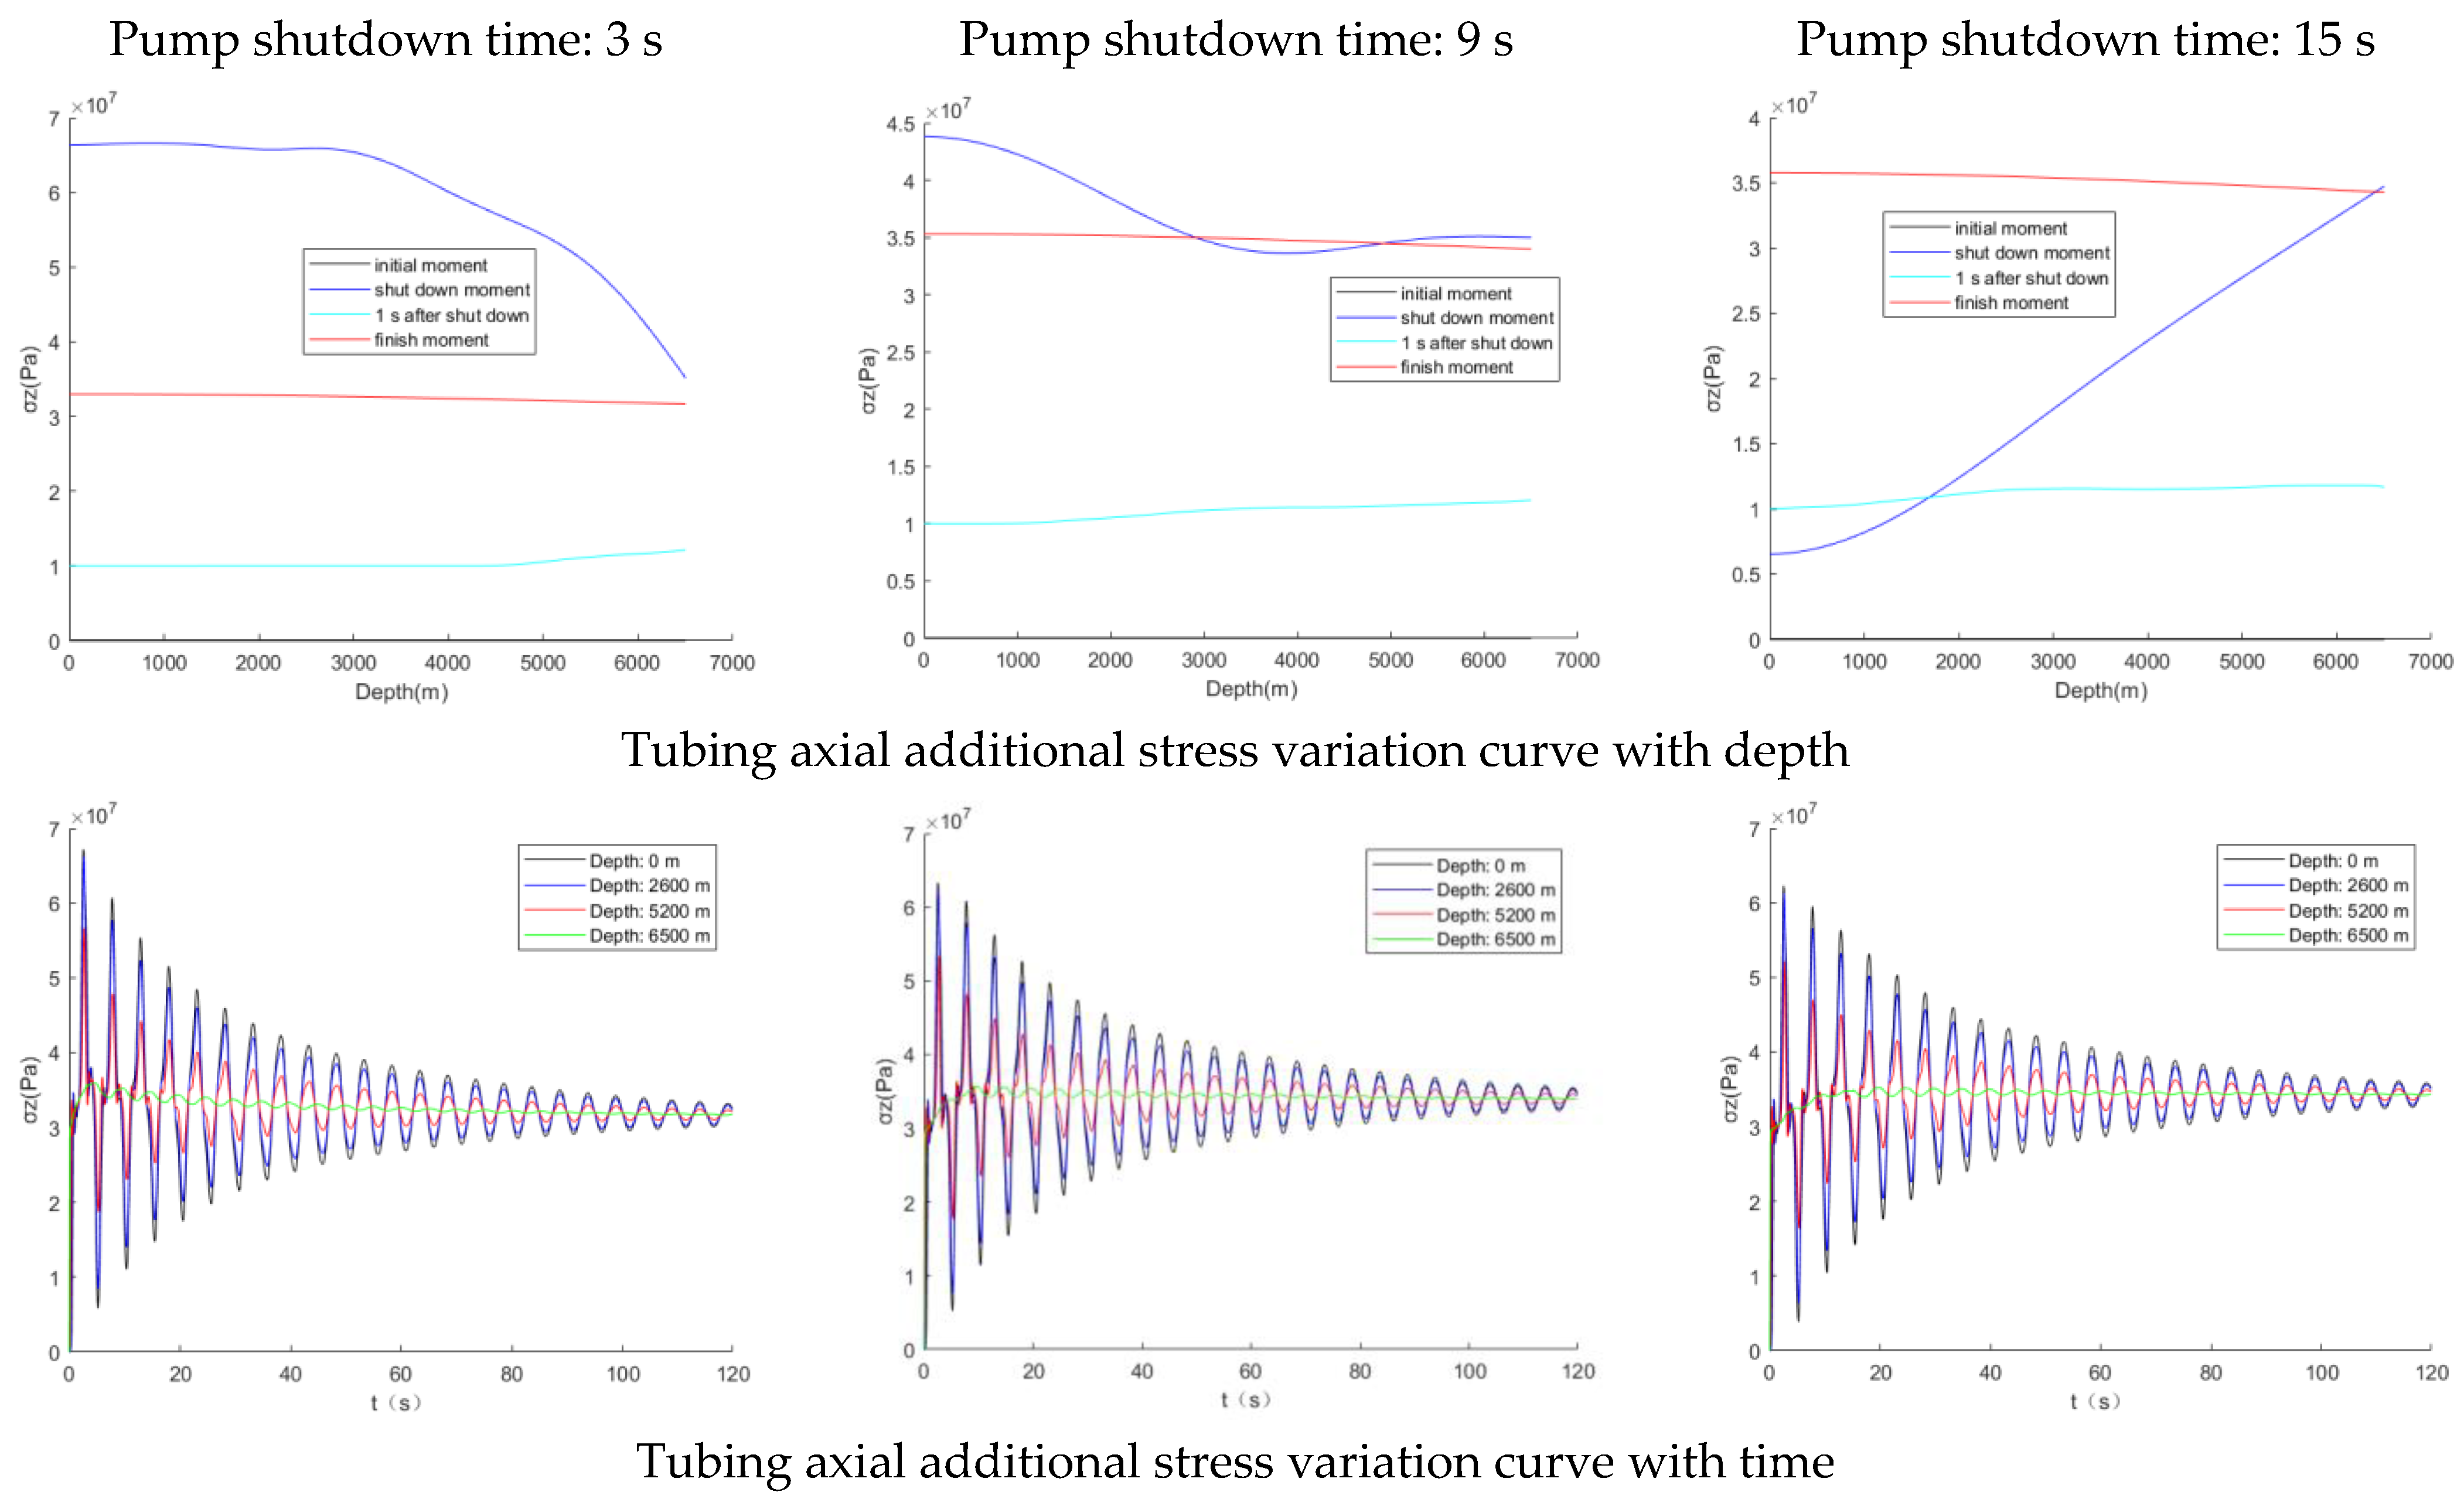
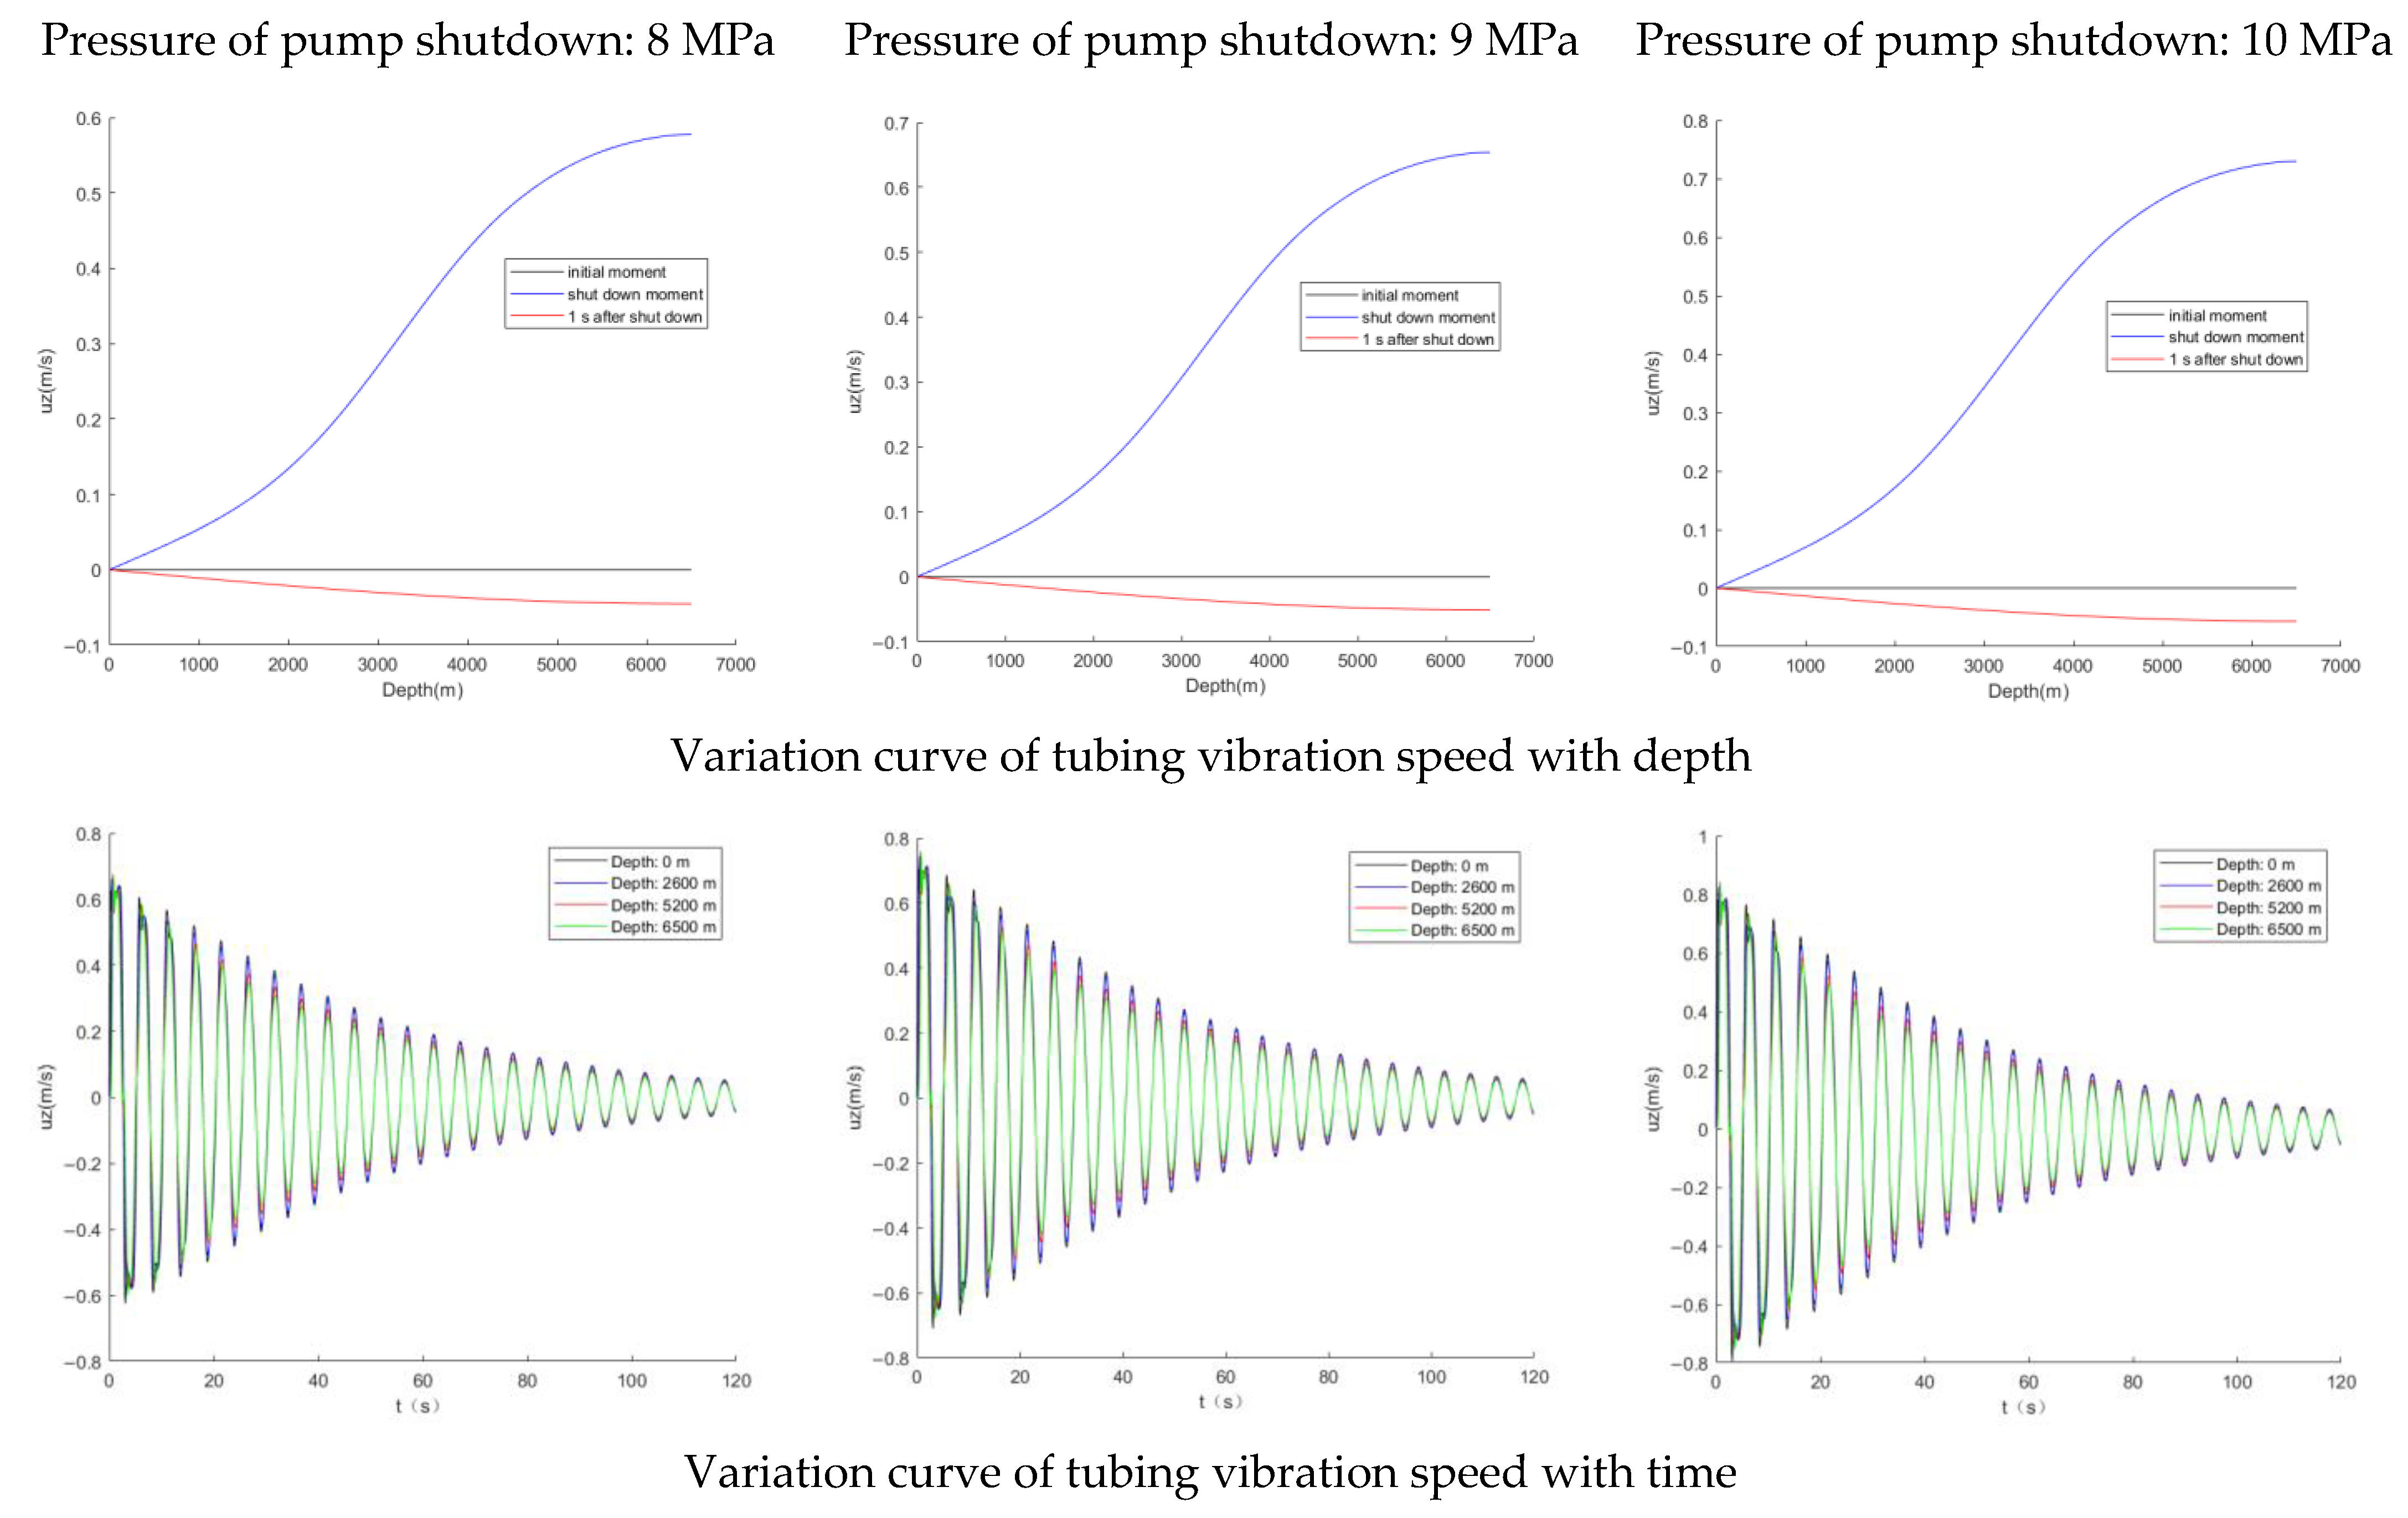
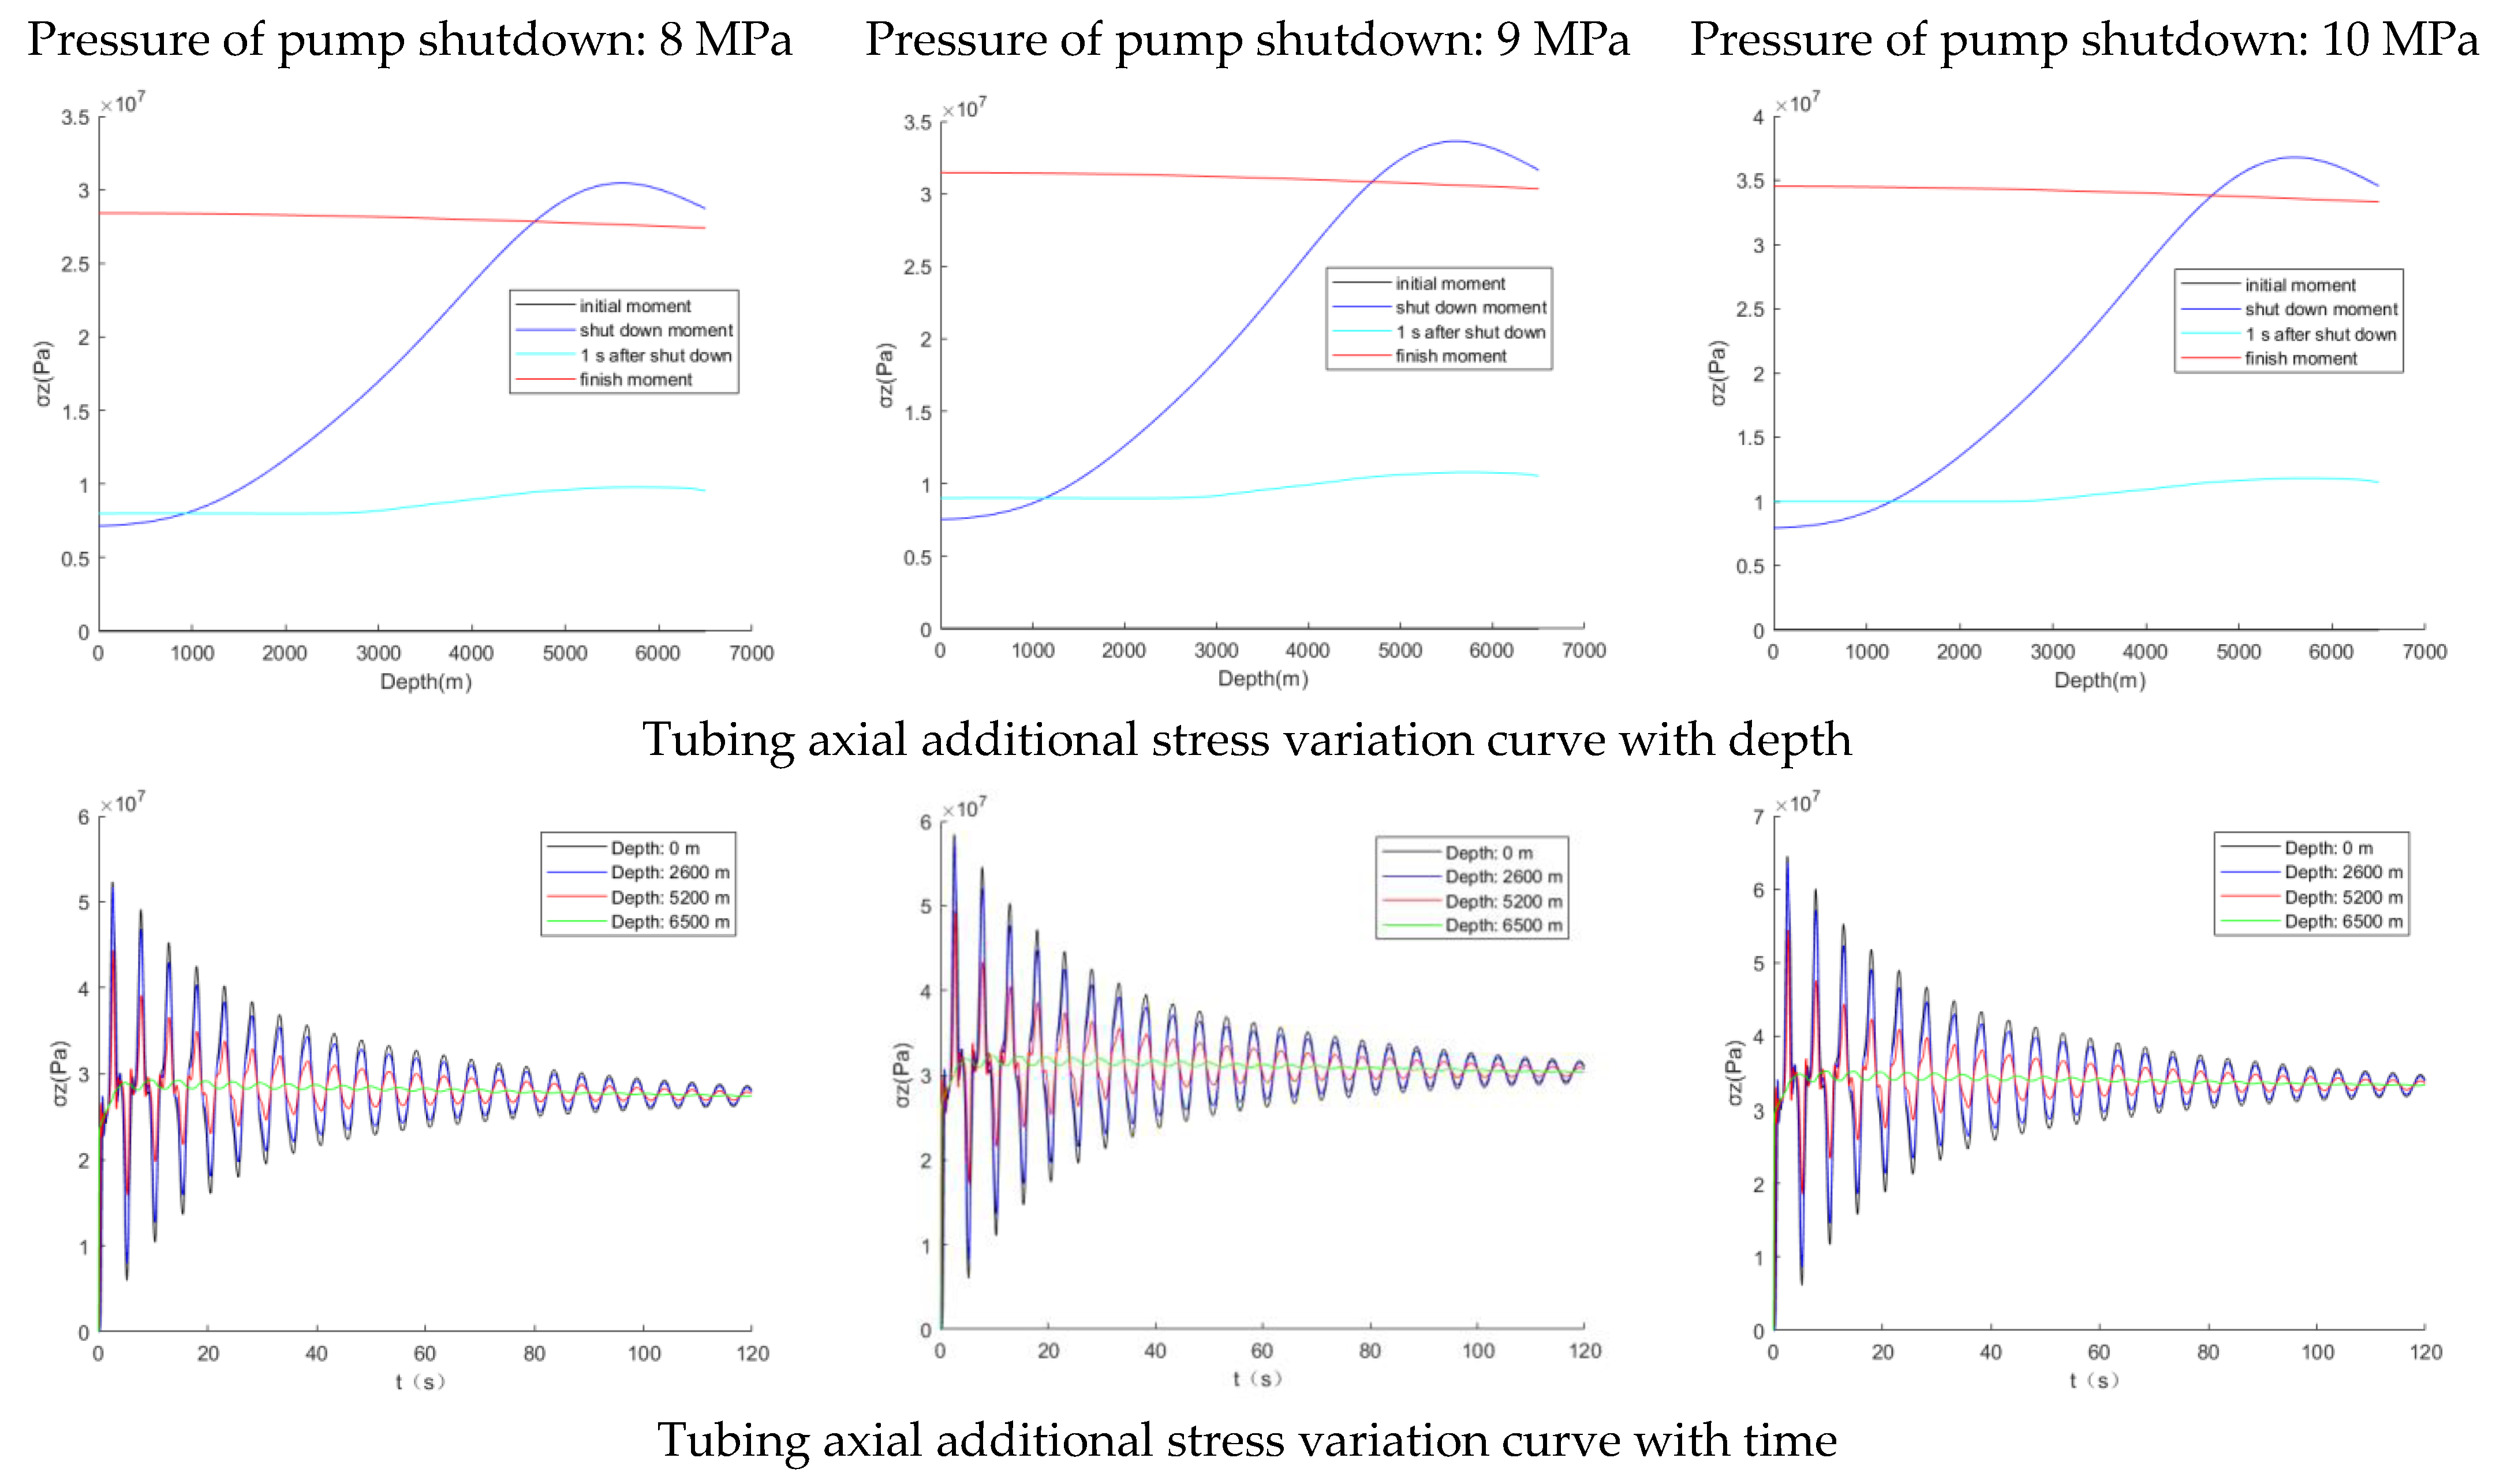
3.2.2. Calculation Results of Tubing Parameters in Pump Shutdown Condition

When the pump shutdown operation was performed at a pressure of 10 MPa in the tubing, the calculated results of the tubing effected by the interaction vibration of the flow field are shown in Figure 7 and Figure 8. For the variation of axial vibration velocity and additional stress of the tubing with depth, the figures of the variation parameters at the initial time, the moment of well shutdown and 1 s after finish are obtained, respectively, the results of were calculated under 3 s, 9 s and 15 s pump shutdown time, as well as the calculated results of the above parameters in the time domain.
As can be seen from Figure 7, at the time of well shutdown, if the operation time was 3 s, then the tubing would shake violently, and the phenomenon of flickering occurs from the wellhead to 3000 m downhole, where the reverse vibration speed appears. In contrast, the 9 s and 15 s vibration speeds were not affected by the above phenomenon. At the time of pump shutdown, the overall tubing vibration speed along the pipeline to the bottom of the well was increasing in trend distribution.
At the end of the pipe shutdown, the axial vibration velocity of the tubing at all depths of each section gradually decreases with time in the form of cyclic cycles due to the frictional influence of the downhole boundary conditions. The effect of pump shutdown time on the amplitude of vibration velocity was not significant, and the wellhead vibration velocity is maximum on the overall tubing section and decreases gradually down the well depth.
For the axial additional stress of the tubing, it could be seen from Figure 8 that the shorter the time of pump shutdown, the higher the instantaneous load at the wellhead. At 3 s of pump shutdown, the axial additional stress at the wellhead could reach 66 MPa, which was 8.5 times higher compared with 7 MPa at 15 s. Additionally, as the time of pump shutdown increases, the stress increase due to tubing resonance manifests itself at the bottom of the well. The longer the tubing length, the lower the intrinsic frequency, the more likely it was to resonate, and the superposition of the resonance-induced axial stresses would lead to higher stresses at the bottom of the well than wellhead. The stress at the bottom of the well at the 15 s pump shutdown in this paper was close to 35 MPa, much higher than wellhead.
During the entire pump shutdown cycle, the stress amplitude at the wellhead was the highest and decreases gradually along the pipeline toward the bottom of the well. Additionally, for the hole tubing, the stress would decreases and disappears with damping effected. The stress at the wellhead was greater than at the bottom of the well for the entire period of time between the pump shutdown and tubing standstill, and the deeper the well, the lower the stress. Additionally, then it gradually decreased in a cyclic manner until it comes to rest.
According to the calculation results in Figure 9 and Figure 10, the variation curves of tubing vibration speed and axial additional stress were obtained when the pump was stopped after giving different initial pressures to the downhole tubing at the same time. In this paper, the vibration parameters of the tubing at 8 MPa, 9 MPa, and 10 MPa were calculated, respectively.
As could be seen from Figure 9, for the tubing axial vibrational velocity, the variation curve at the well shutdown moment was basically the same for the three different inside pressures, all of which increase with depth, and the difference in the peak stress variation was not obvious. This indicates that the relationship between different inside pressures and the vibrational velocity of the tubing was not closed at the instant of well shutdown. Additionally, from the time domain calculation results, it could be seen that the vibration velocity at the wellhead was the largest, while it decreased along the tubing direction to the bottom of the well due to the influence of downhole damping.
For the axial additional stress in the tubing, it could be seen from Figure 10 that the stress amplitude at the wellhead was the largest at the three different shutdown pressures and decreased and stabilizes along the pipeline direction to the bottom of the well throughout the shutdown cycle. The different effects of inside pressure were reflected in the magnitude of stress fluctuations in the time domain. The axial stress in the tubing could reach 52 MPa at 8 MPa shutdown, while the stress magnitude at 10 MPa shutdown was close to 64 MPa, which was a 23% increase compared to 8 MPa condition.

4. Discussion

In the two conditions discussed in this paper, the periodic injection of the flow field and pump shutdown can be regarded as simple harmonic external excitation acting in the fluid-tubing system, so the behavior of downhole tubing during the fracturing process is forced simple harmonic excitation vibration. During well site operations, tubing damage due to an unsteady flow field is more often come from resonance. In addition, the pressure impact during pump shutdown also causes tubing damage by deformation of press and instability. In the 3-1/2″ tubing calculated results, the maximum additional axial stress of the tubing under the cyclic injection condition was 36.2 MPa, while when it was under the pump shutdown, the maximum value was 61.6 MPa, which was an increase of 70.2%.
Under the periodic injection condition, the periodic disturbance of the flow causes the change of the tubing vibration frequency triggered by the flow field as an external excitation, and resonance occurs when it approaches the intrinsic frequency of some of the tubing sections. Mao [22] concluded that the amplitude and phase difference of the steady-state response depend only on the physical properties of the system itself and the frequency of the excitation and force spokes, independent of the initial conditions of the system. Therefore, for the tubing itself, its inherent frequency is affected by factors such as mass, geometry, and material, according to the inherent frequency calculation equation:
ω = k m
where:
ω—the intrinsic frequency of the tubing in Hz;
k—the stiffness of the tubing in N/m;
m—the mass in kg.
Due to the shape characteristics of the downhole tubing, it can be approximated and treated as a model of beam, and the expression of the stiffness of the tubing is obtained as:
k = E A l
where:
E—the modulus of elasticity of the tubing;
A—the cross-sectional area;
l—the length of the tubing.
Substituting Equation (16) into Equation (15) yields:
ω = E l 2 ρ
where:
ρ—the tubing density.
In the research by Xu et al. [23], it was pointed out that the tubing buckling phenomenon was a potential risk to production safety in the high-pressure environment of ultra-deep wells, and severe tubing buckling deformation can lead to a series of catastrophic accidents such as shutdown and waste of wells. Therefore, combined with the above research and within the reference range given by it, thickened tubing with an elastic modulus of 210 GPa and a tubing density of 7850 kg/m3 was selected for the downhole tubing material in this paper.
From the above equations, it can be seen that the longer the length of the downhole tubing, the higher the intrinsic frequency will be. Additionally, the vibration frequency of the tubing under the action of external excitation increases from zero to peak and then decreases. By calculating the vibration frequency of three different tubing diameters subjected to 0.25 Hz disturbance pressure variation, it was concluded that the peak vibration frequency of the tubing decreases gradually with the increase of the diameter, but the maximum value does not exceed 12 Hz. Therefore, in order to avoid the resonance of the inherent frequency of the tubing close to the flow field frequency, it should be greater than its peak vibration frequency as far as possible, which requires the length of the tubing to set the longest safety threshold. The design of oil well tubing mostly uses composite connection types, and its diameter commonly ranges between 2-3/8″ and 4-1/2″, and the longer the length of the tubing, the denser the inherent frequency will be, and it is not easy to avoid the resonant excitation frequency of the system at this time [24]. Table 2 was calculated and gives the maximum value of the tubing vibration frequency and the upper limit of the safe depth of the tubing at different diameters. The results show that when the inner diameter of the tubing increases, the depth location where resonance begins to occur increases accordingly. For combined tubing, the tubing diameter sizes are generally distributed decreasingly from the wellhead to the bottom of the well. The data listed in Table 2 provided a basis for well design to avoid tubing resonance and have useful engineering value. The operator can choose the combination of casing at different depths according to different downhole conditions to achieve safe operation and production.
Under the pump shutdown condition, the water hammer effect will also cause the unsteady flow field in the tubing to change drastically. For the same stoppage time and shutdown pressure, the tubing vibration frequency is 55.43 Hz for 2-7/8″, and 55.37 Hz for 3-1/2″, which is 0.11% lower than that of 2-7/8″, while the tubing vibration frequency is 55.27 Hz for 4-1/2″, which is 0.29% lower than that of 2-7/8″. It can be seen that the change in tubing vibration frequency caused by pump shutdown is very little affected by the inner diameter size. At the same time, the vibration frequency of the 3-1/2″ tubing is 82.5 Hz at 8 MPa and 83.22 Hz at 10 MPa, which is 0.87% higher than that of 8 MPa. When the pump shutdown with inside pressure at 12 MPa, the tubing vibration frequency was 83.92 Hz, which was 1.72% higher than that at 8 MPa. Therefore, the change in tubing vibration frequency caused by the difference in pressure when the pump shutdown is also extremely small. Therefore, the main factor affecting the resonance is the stopping time of the pump. After calculation, the obtained downhole tubing hazardous resonance location schematic was shown in Figure 11. The resonance potential of the tubing will be extended from its dangerous resonance depth to the bottom of the well, and with the increase of the pump shutdown time, its dangerous resonance location will be closer to the bottom of the well, thus shortening the length of the tubing section that may produce resonance. On the other hand, the operation time when shutdown of the pump should not be too short, which will lead to the dangerous resonance position close to the wellhead, thus making too long tubing sections have resonance safety hazards.
The severe impact caused by the transient load when the pump set valve is closed is the main form of tubing damage under pump shutdown conditions, and the tubing will generate very strong axial additional stresses. At this time, the tubing diameter size, pump shutdown time, and the pressure during pump shutdown will have an impact on the additional axial stress of the tubing [25]. Figure 12 shows the peak axial stresses for different tubing diameters at the same stopping time and shutdown pressure, and it can be observed that the larger the tubing diameter is, the higher the additional axial stresses are. The peak stress of the 2-3/8″ tubing was 57.27 MPa, while the 4-1/2″ tubing was 79.9 MPa, and the stress increase has reached 40%. Therefore, the coarse tubing diameter should be given priority when analyzing the axial stress impact damage during pump shutdown so that vibration damping measures can be applied at the corresponding combined tubing section locations. As can be seen from Figure 13, the shorter the pump shutdown time, the greater the additional axial stress generated. Among them, in Figure 13, the peak value of additional axial stress was 67.14 MPa at 3 s pump shutdown, while it dropped to 62.25 MPa at 15 s, with a dropped of 7% in the selected tubing diameter and working condition. In Figure 14, it could be found that the pressure in the tubing at the time of pump shutdown and the additional axial stress generated by it were close to the proportional linear relationship, in which the peak value of the additional axial stress was 52.32 when the pump shutdown pressure was 8 MPa, and the peak value of the stress was close to 76.7 MPa when the pumping stop pressure increases to 12 MPa, with a growth rate of 47%.
The material service performance of tubing could be affected by multiple factors such as physical, chemical or biological, which could accelerate its fatigue damage and reduce its material toughness affecting the safety factor. In the research done by Ahmed et al. [26], fluid pipelines were subjected to factors such as corrosion or temperature differences, which resulted in wall thickness thinning. This could be a fatigue crack extension in the pipe due to circumferential stresses, which could eventually damage the pipe body causing losses. Meng Li et al. [27] pointed out that the impact load on the tubing during production was a key factor in determining the safety of strength design and tubing material selection for deep and ultra-deep wells, and the safety factor method was commonly used as its direct measure. As for the selection of tubing materials, in the study of Li [28], it was pointed out that in the complex operating environment of the downhole, J55 steel was often used as oil downhole casing and tubing material because of its high tensile and yield strength as well as great impact properties. In the J55 steel downhole tubing used in this paper, the tubing safety factors for different tubing diameters, pump shutdown times and inside pressures were given in Table 3, Table 4 and Table 5, respectively, in relation to the above pump shutdown conditions. Among them, the larger the tubing diameter, the smaller the safety factor. The 4-1/2″ tubing diameter safety factor compared to 2-3/8″ decreased by 25%. The longer the pump shutdown time, the higher the safety factor. Compared with 3 s stop time, extending it to 15 s, the safety factor can be increased by 6%. The effect of shutdown pressure on the safety factor is significant, the higher the stopping pressure, the lower the safety factor. Compared with the pump shutdown at 8 MPa, the safety factor is reduced by 32% at 12 MPa. As a result, the most effective way to protect against the pump shutdown condition is to release the pressure in the tubing before stopping the pump, and then consider extending the operation time while shutting down the well in steps based on the different diameters.
In summary, for downhole tubing, the hazards caused by the resonance of tubing due to unsteady flow fields such as periodic injection and water hammer damage must be avoided in construction and design. When the wellhead pump was closed, the velocity of the fluid in the tubing begins to decrease until eventually the flow stops. Then, when the elastic wave at the wellhead with reduced pressure reaches the bottom of the well, the backflow occurs. In the study by Tang et al. [29], the pressure fluctuation due to valve closure was shown to be 1.37 MPa, and the pressure fluctuation due to fluid–structure interaction could be up to 8.27 MPa, an increase of up to 6.03 times, which could cause a serious risk of damage to the tubing. The main reasons for this damage are the resonance caused by the variation in frequency of the unsteady flow field, which is close to the inherent frequency of some tubing sections, and the increase in damage load also caused by the water hammer impact on the tubing due to sudden pump shutdown. Whichever type of pipeline damage is caused, the economic affordability pressure is huge for costly oilfield operations [30].Therefore, combined with the analysis results in this paper, in order to avoid resonance, the tubing combination with different working conditions need to make suitable selections, as far as possible to eliminate the frequency of easy to resonate parts, so as to achieve the purpose of protection. For the pump shutdown condition, increasing the operate time and decompression before process are effective protection measures. Meanwhile, the tubing diameter should not be too large when designing. Therefore, in the construction, operators could calculate the possible pressure variations amplitude of pump shutdown according to the parameters in the tubing, and then carry out the pump group to shutdown step by step or increase the vibration mitigation restraint at the local tubing section to limit the amplitude of tubing swing. This is conducive to slowing down the vibration of the downhole tubing, which could effectively avoid structural instability, local deformation, and other failures to ensure production safety.

5. Conclusions

In this paper, aimed at the fluid–structure interaction vibration of the tubing caused by the unsteady flow of the medium inside the tubing and its possible failure, the influence of the vibration caused by the variation of the flow field and the tubing parameters due to external excitation was calculated, and the main conclusions were obtained as follows:
(1)
The tubing diameter and pump start pressure are the main factors for the vibration damage under the periodic injection condition. When the diameter increases, the flow field pressure and flow velocity will decrease, and the axial stress will also increase. When the pump begins to operate at a higher pressure, the impact on the flow field increases, as does the axial stress in the tubing.
(2)
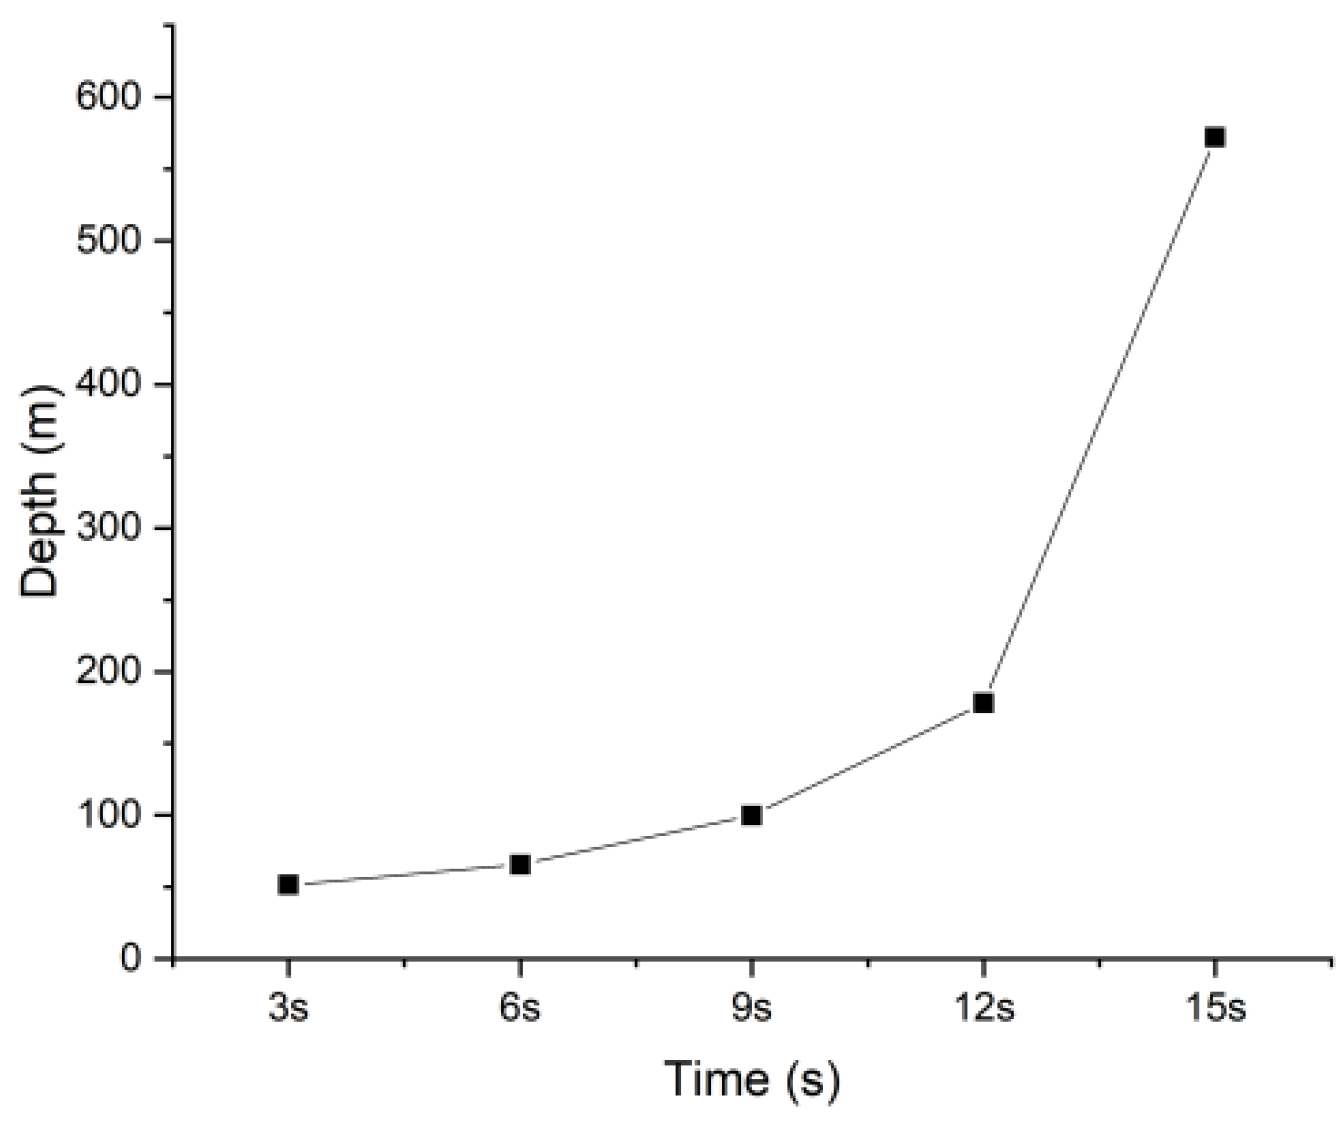
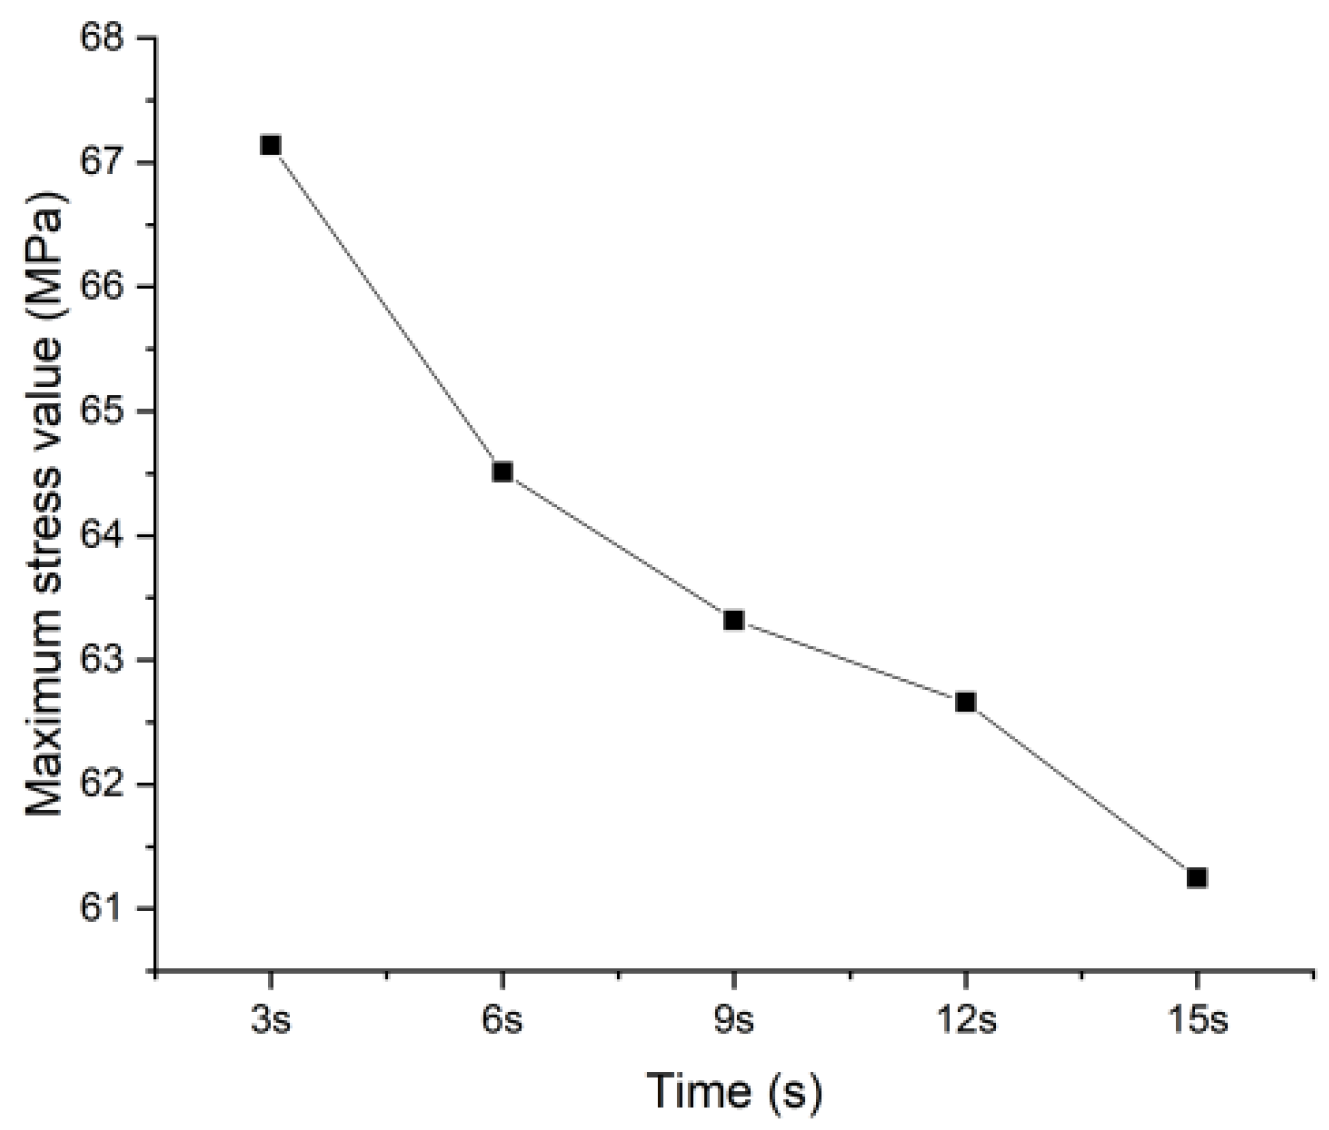
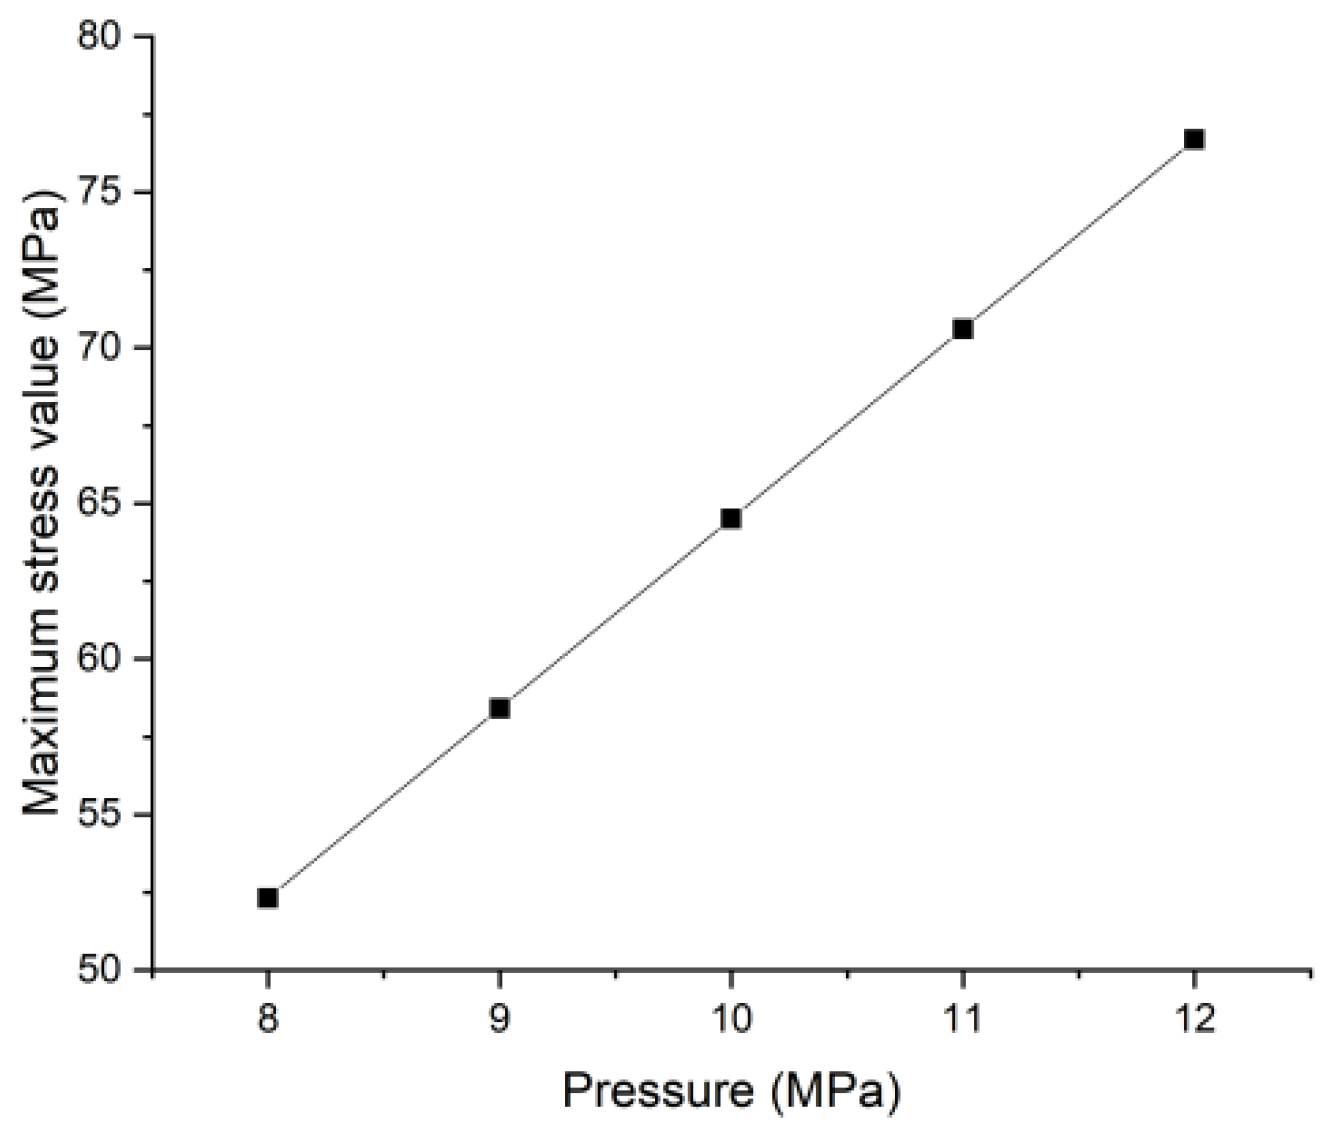
In addition to resonance, the tubing damage under the pump shutdown condition comes more from the surge of transient load. The pump shutdown time and inside pressure are the main influencing factors. The shorter the shutdown time, the greater the pressure of the flow field in the tubing, and the more rapid the flow velocity fluctuation trend. The axial additional stress caused by it would increase. The higher the inside pressure at operation of shutdown, the more pressure inside the tubing when it is interacted with. As this flow field variation acts on the tubing, the additional axial stress would rise sharply.
(3)
The resonance damage of tubing originates from its vibration frequency being close to its inherent one, so combined with the calculation results of tubing vibration parameters, the maximum safe pipeline length under different tubing diameters was obtained by analyzing its inherent frequency distribution regulation. It has excellent practical engineering value and provides a theoretical basis and reference range for the safety selection of tubing groups in actual operation.

Author Contributions

F.Q. and J.C. designed the models and algorithms; L.C. and F.Q. wrote the program; M.L. and Y.X. verified and changed the manuscript. All authors have read and agreed to the published version of the manuscript.

Funding

Thanks are due to the “National Natural Science Foundation of China” (grand no.52274006; 52105209; 51305348), for financial support, and to the working group The Youth Innovation Team of Shaanxi Universities and Xi’an Key Laboratory of Wellbore Integrity Evaluation.

Data Availability Statement

The data presented in this study are available on request from the corresponding author. The data are not publicly available due to it also forms part of an ongoing study.

Conflicts of Interest

The authors declare no conflict of interest.

References

  1. Yang, Y.; Fan, J.; Liu, D.; Ma, F. Monitoring and Diagnosis System of Downhole Tubing Leakage. In Modern Management based on Big Data II and Machine Learning and Intelligent Systems III: Proceedings of the MMBD 2021 and MLIS 2021, Online, 8–11 November 2021. Ed.; IOS Press: Amsterdam, The Netherlands, 2021; pp. 676–687. [Google Scholar]
  2. Wu, S.; Zhang, L.; Fan, J.; Zheng, W.; Zhou, Y. Real-time risk analysis method for diagnosis and warning of offshore downhole drilling incident. J. Loss Prev. Process Ind. 2019, 62, 103933. [Google Scholar] [CrossRef]
  3. Qian-Bei, Y.; Xiao-Xiao, W.; Yue-Qiu, L.; Wen, C.; Qiang, Z. Failure evaluations for packers in multistage fracturing technology with immobile strings. J. Pet. Sci. Eng. 2021, 206, 109039. [Google Scholar] [CrossRef]
  4. Zhang, Z.; Wang, J.; Li, Y.; Liu, H.; Meng, W.; Li, L. Research on the influence of production fluctuation of high-production gas well on service security of tubing string. Oil Gas Sci. Technol. 2021, 76, 54. [Google Scholar] [CrossRef]
  5. Keramat, A.; Fathi-Moghadam, M.; Zanganeh, R.; Rahmanshahi, M.; Tijsseling, A.S.; Jabbari, E. Experimental investigation of transients-induced fluid structure interaction in a pipeline with multiple-axial supports. J. Fluids Struct. 2020, 93, 102848. [Google Scholar] [CrossRef]
  6. Zeng, Q.; Wang, D.; Zang, F.; Zhang, Y. Vibration attenuation of periodic composite pipeline considering Fluid-structure interaction, Virtual, Online, 2021. Am. Soc. Mech. Eng. 2021, 4, 9. [Google Scholar]
  7. Sang, Y.; Liu, P.; Wang, X.; Sun, W. Fluid-structure interaction analysis of the return pipeline in the high-pressure and large-flow-rate hydraulic power system. Prog. Comput. Fluid Dyn. 2021, 21, 38–51. [Google Scholar] [CrossRef]
  8. Sunil Kumar, H.S.; Anand, R.B.; Prabhakara, D.L. Numerical Investigation on Vibration and Stability of Cutting Fluid Delivery Viscoelastic Conduits. Arab. J. Sci. Eng. 2019, 44, 5765–5778. [Google Scholar] [CrossRef]
  9. Seghir, A. Coupled free vibrations of Fluid-structure interaction system. UPB Scientific Bulletin. Ser. D Mech. Eng. 2020, 83, 45–60. [Google Scholar]
  10. Lu, H.; Wu, X.; Huang, K. Study on the effect of reciprocating pump pipeline system vibration on oil transportation stations. Energies 2018, 11, 132. [Google Scholar] [CrossRef] [Green Version]
  11. Guo, X.; Liu, J.; Dai, L.; He, Y.; Huang, L.; Wang, G.; Yu, L. Fatigue investigation of tubing string in high-yield curved wells. J. Nat. Gas Sci. Eng. 2021, 85, 103688. [Google Scholar] [CrossRef]
  12. Simandjuntak, S.; Lin, B.; Affendy, B.; Akther, F. Combined residual stresses and Fluid-structure interaction finite element analysis on bent pipes. Mater. High Temp. 2021, 38, 351–357. [Google Scholar] [CrossRef]
  13. Thari, A.; Pasquariello, V.; Aage, N.; Hickel, S. Adaptive reduced-order modeling for non-linear fluidstructure interaction. Comput. Fluids 2021, 229, 105099. [Google Scholar] [CrossRef]
  14. Moradi, H.; Ranji, A.R.; Haddadpour, H.; Moghadas, H. A hybrid model for simulation of Fluid-structure interaction in water entry problems. Phys. Fluids 2021, 33, 017102. [Google Scholar] [CrossRef]
  15. Gao, P.; Zhang, Y.; Liu, X.; Yu, T.; Wang, J. Vibration analysis of aero parallel-pipeline systems based on a novel reduced order modeling method. J. Mech. Sci. Technol. 2020, 34, 3137–3146. [Google Scholar] [CrossRef]
  16. Cho, H. Efficient semi-implicit coupling Fluid-structure interaction analysis via model-order reduction of dynamic grids. Aerosp. Sci. Technol. 2022, 121, 107356. [Google Scholar] [CrossRef]
  17. Schussnig, R.; Pacheco DR, Q.; Fries, T. Efficient split-step schemes for fluidstructure interaction involving incompressible generalised Newtonian flows. Comput. Struct. 2022, 260, 106718. [Google Scholar] [CrossRef]
  18. Nikpour, M.R.; Nazemi, A.H.; Dalir, A.H.; Shoja, F.; Varjavand, P. Experimental and Numerical Simulation of Water Hammer. Arab. J. Sci. Eng. 2014, 39, 2669–2675. [Google Scholar] [CrossRef]
  19. Liu, J.; Guo, X.; Wang, G.; Liu, Q.; Fang, D.; Huang, L.; Mao, L. Bi-nonlinear vibration model of tubing string in oil&gas well and its experimental verification. Appl. Math. Model. 2020, 81, 50–69. [Google Scholar]
  20. Wu, B.; Zhang, Q.; Li, J.; Ding, L.; Wang, J.; Lian, Z. Study on nonlinear buckling behavior of tubing string in HPHT gas wells. Arab. J. Sci. Eng. 2021, 47, 11439–11451. [Google Scholar] [CrossRef]
  21. Zhang, Q.; Kong, X.; Huang, Z.; Yu, B.; Meng, G. Fluid-structure-interaction analysis of an aero hydraulic pipe considering friction coupling (october 2018). IEEE Access 2019, 99, 1–13. [Google Scholar] [CrossRef]
  22. Mao, J.; Lin, M.; Huang, Y.; Hu, X. Double stochastic energetic resonance of underdamped two-scale bistable system. Phys. Scr. 2022, 97, 405208. [Google Scholar] [CrossRef]
  23. Xu, J.; Mou, Y.; Xue, C.; Ding, L.; Wang, R.; Ma, D. The study on erosion of buckling tubing string in HTHP ultra-deep wells considering fluid–solid coupling. Energy Rep. 2021, 7, 3011–3022. [Google Scholar] [CrossRef]
  24. Liu, E.; Wang, X.; Zhao, W.; Su, Z.; Chen, Q. Analysis and research on pipeline vibration of a natural gas compressor station and vibration reduction measures. Energy Fuels 2020, 35, 479–492. [Google Scholar] [CrossRef]
  25. Kandil, M.; Kamal, A.M.; El-Sayed, T.A. Effect of pipematerials on water hammer. Int. J. Press. Vessel. Pip. 2020, 179, 103996. [Google Scholar] [CrossRef]
  26. Reda, A.; Sultan, I.A.; Shahin, M.A.; McKee, K.K.; Lagat, C. Fitness-for-service analysis for corrosion resistant alloy clad pipeline damaged due to lodged intelligent pig. Int. J. Press. Vessel. Pip. 2022, 198, 104683. [Google Scholar] [CrossRef]
  27. Li, M.; Liu, J.; He, H.; Su, K.; Guo, X.; Chen, W. Safety and reliability evaluation of casing in ultra-deep well based on uncertainty analysis of extrusion load. Process Saf. Environ. Prot. 2021, 148, 1146–1163. [Google Scholar] [CrossRef]
  28. Sedmak, A.; Arsić, M.; Šarkoćević, Ž.; Medjo, B.; Rakin, M.; Arsić, D.; Lazić, V. Remaining strength of API J55 steel casing pipes damaged by corrosion. Int. J. Press. Vessel. Pip. 2020, 188, 104230. [Google Scholar] [CrossRef]
  29. Tang, Y.; Ouyang, L. A Dynamic Simulation Study of Water Hammer for Offshore Injection Wells To Provide Operation Guidelines. SPE Prod. Oper. 2010, 25, 509–523. [Google Scholar]
  30. Li, Z.; Zhang, C.; Song, G. Research advances and debates on tubular mechanics in oil and gas wells. J. Pet. Sci. Eng. 2017, 151, 194–212. [Google Scholar] [CrossRef]
Figure 1. Variation curves of flow field parameters at different tubing diameters.
Energies 15 09291 g001
Figure 2. Variation curves of flow field parameters at different initial pump start pressures.
Energies 15 09291 g002
Figure 3. Variation curve of tubing parameters at different diameters.
Energies 15 09291 g003
Figure 4. Variation curve of tubing parameters at different initial pump start pressure.
Energies 15 09291 g004
Figure 5. Variation curves of flow field parameters under different pump shutdown times.
Energies 15 09291 g005
Figure 6. Variation curves of flow field parameters at different initial shutdown pressures.
Energies 15 09291 g006
Figure 7. Variation curve of tubing vibration speed under different pump shutdown time.
Energies 15 09291 g007
Figure 8. Variation curve of tubing axial additional stress under different pump shutdown time.
Energies 15 09291 g008
Figure 9. Variation curve of tubing vibration speed under different initial shutdown pressure.
Energies 15 09291 g009
Figure 10. Variation curve of tubing axial additional stress under different initial shutdown pressure.
Energies 15 09291 g010
Figure 11. Dangerous resonance position of tubing under different pump shutdown times.
Energies 15 09291 g011
Figure 12. Maximum value of additional axial stress for different tubing diameters. (Uniform pump shutdown time of 6 s and inside pressure of 10 MPa).
Energies 15 09291 g012
Figure 13. Maximum value of additional stress in the axial direction for different pump shutdown times. (Uniform tubing diameter of 3-1/2″, inside pressure of 10 MPa).
Energies 15 09291 g013
Figure 14. Maximum value of axial additional stress for different pump shutdown pressures. (Uniform tubing diameter of 3-1/2″, pump shutdown time of 6 s).
Energies 15 09291 g014
Table 1. Values of tubing vibration parameters.
Construction ParametersValueModel Solving ParametersValue
Length6500 mInitial pressure8 MPa, 8.5 MPa, 9 MPa, 9.5 MPa, 10 MPa
Bulk modulus2.2 × 109 PaStop the pump time3 s, 6 s, 9 s, 12 s, 15 s
Initial flow0~4 m3/minCoefficient of friction resistance0.0159
Viscosity of liquid motion5 × 10−6 Pa·sVortex frequency0.25 Hz
Elasticity modulus210 GPaSpace interval50 m
The tubing density7850 kg/m3Time step0.5 s
Poisson ratio0.29Total steps of time500
The liquid density1.142 × 103 kg/m3Diameter2-3/8″ × 4.83 mm
2-7/8″ × 5.51 mm
3-1/2″ × 6.45 mm
4″ × 6.65 mm
4-1/2″ × 6.88 mm
Table 2. Resonance occurrence depth of tubing with different diameters.
2-3/82-7/83-1/24″4-1/2
Maximum frequency of flow field (Hz)11.6710.549.5879.1298.721
Critical safety tubing length (m)443.204490.721539.501566.567593.074
Table 3. Safety factors for different tubing diameters (Uniform pump shutdown time of 6 s and inside pressure of 10 MPa).
Different Diameter2-3/82-7/83-1/24″4-1/2
Safety factor5.725.385.164.654.28
Table 4. Safety factors for different pump shutdown times (Uniform tubing diameter of 3-1/2″, inside pressure of 10 MPa).
Different Finish Time (s)3691215
Safety factor4.915.085.165.215.24
Table 5. Safety factors for different inside pressures (Uniform tubing diameter of 3-1/2″, pump shutdown time of 6 s).
Different Stress (MPa)89101112
Safety factor6.285.625.084.644.24
Publisher’s Note: MDPI stays neutral with regard to jurisdictional claims in published maps and institutional affiliations.

