
Classification and Assessment of Core Fractures in a Post-Fracturing Conglomerate Reservoir Using the AHP–FCE Method
Abstract
:1. Introduction
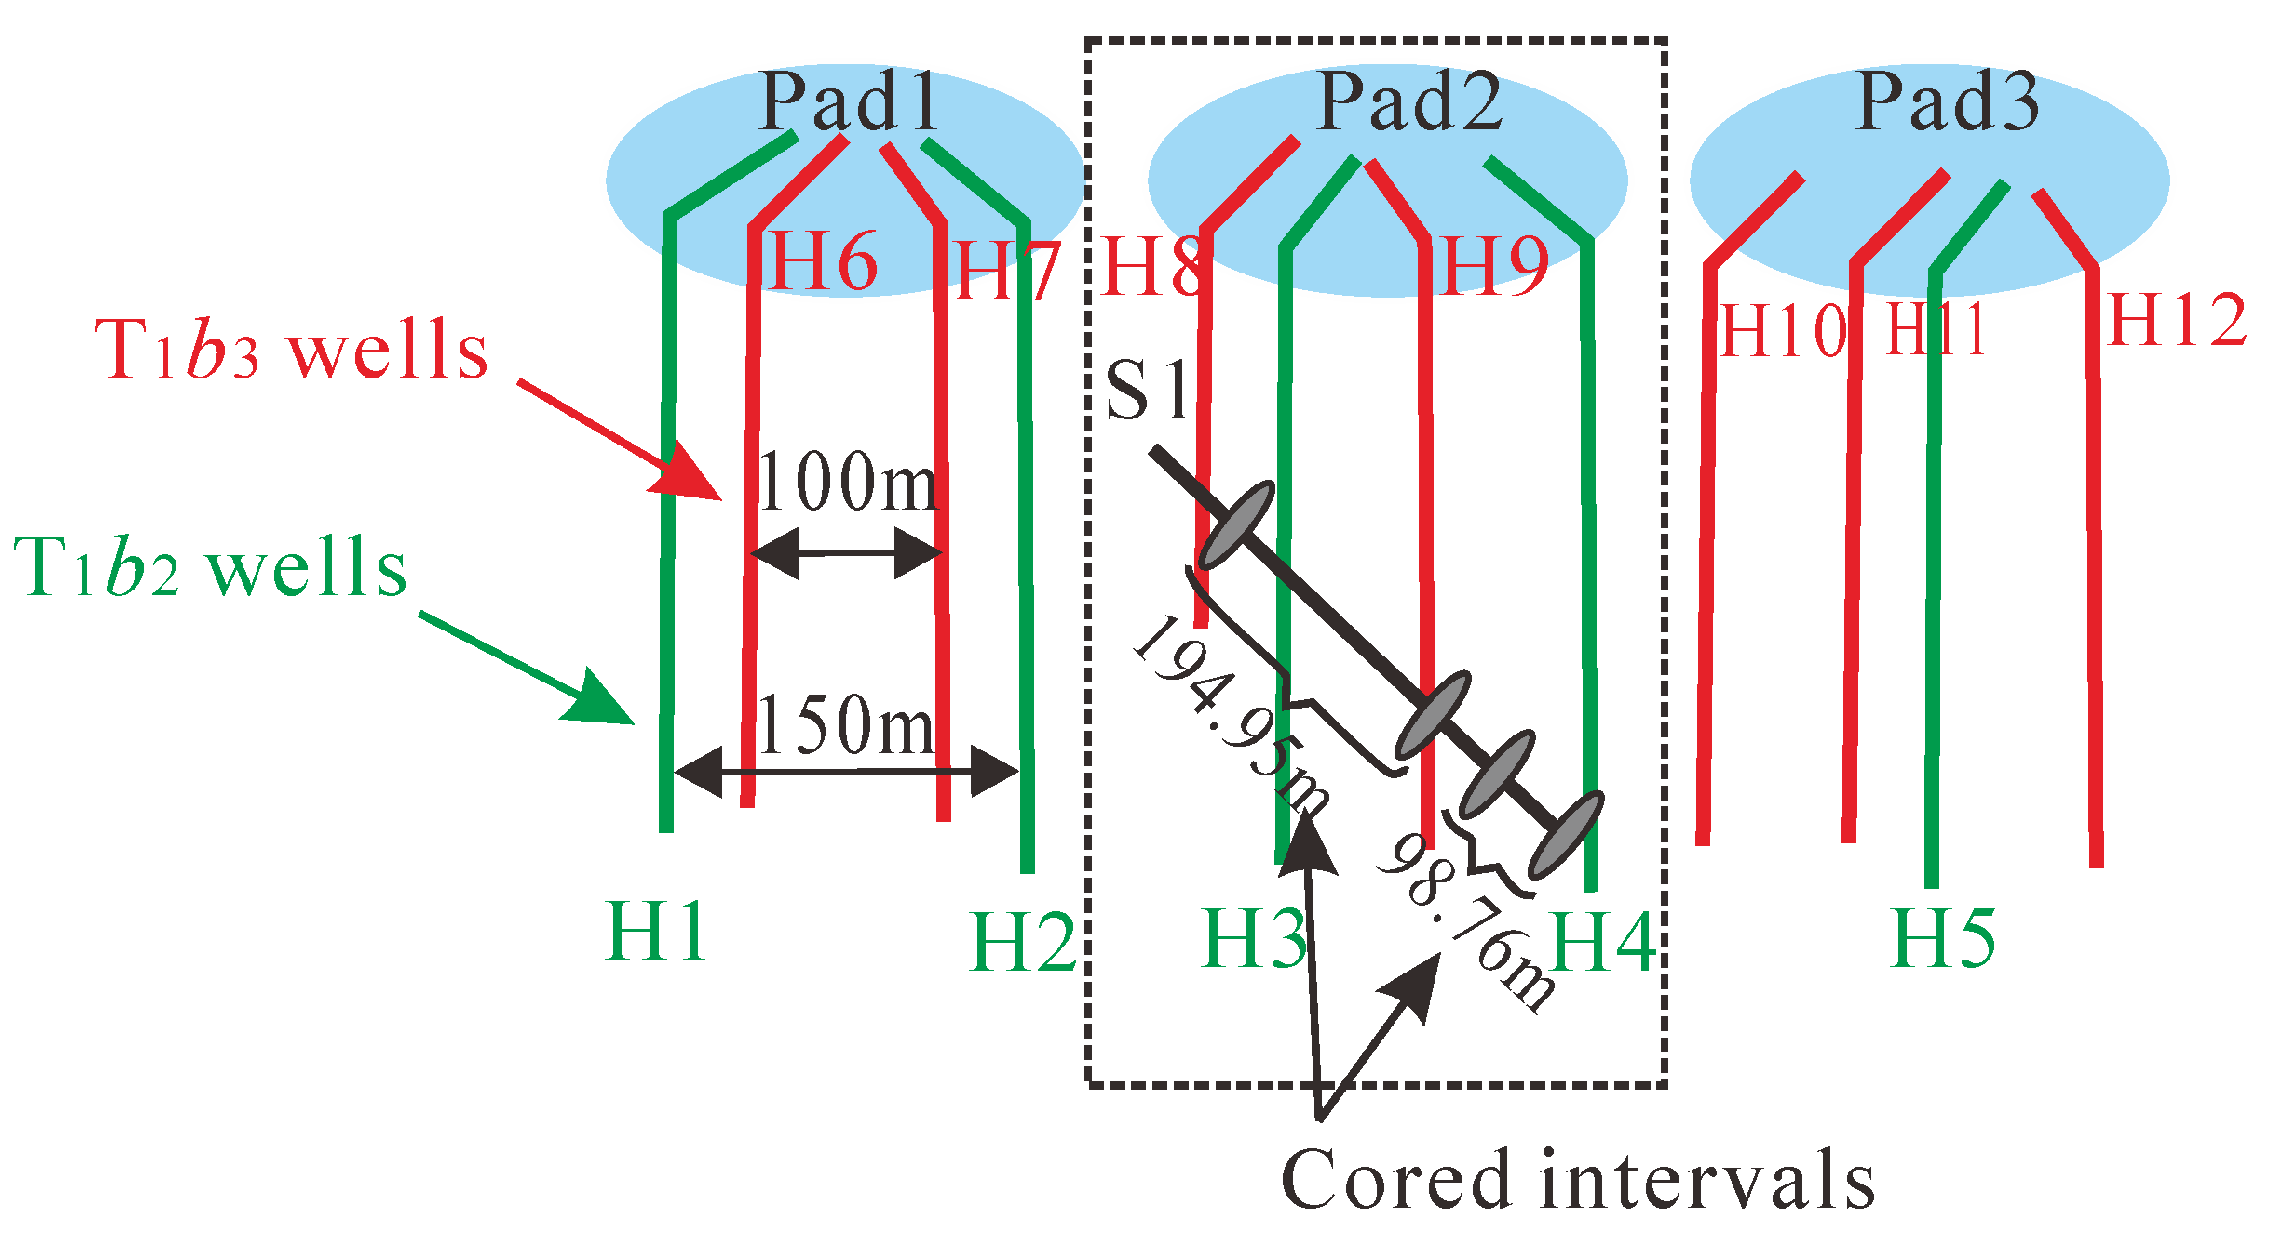
2. CHFTS Overview
3. Core Fracture Classification Indexes
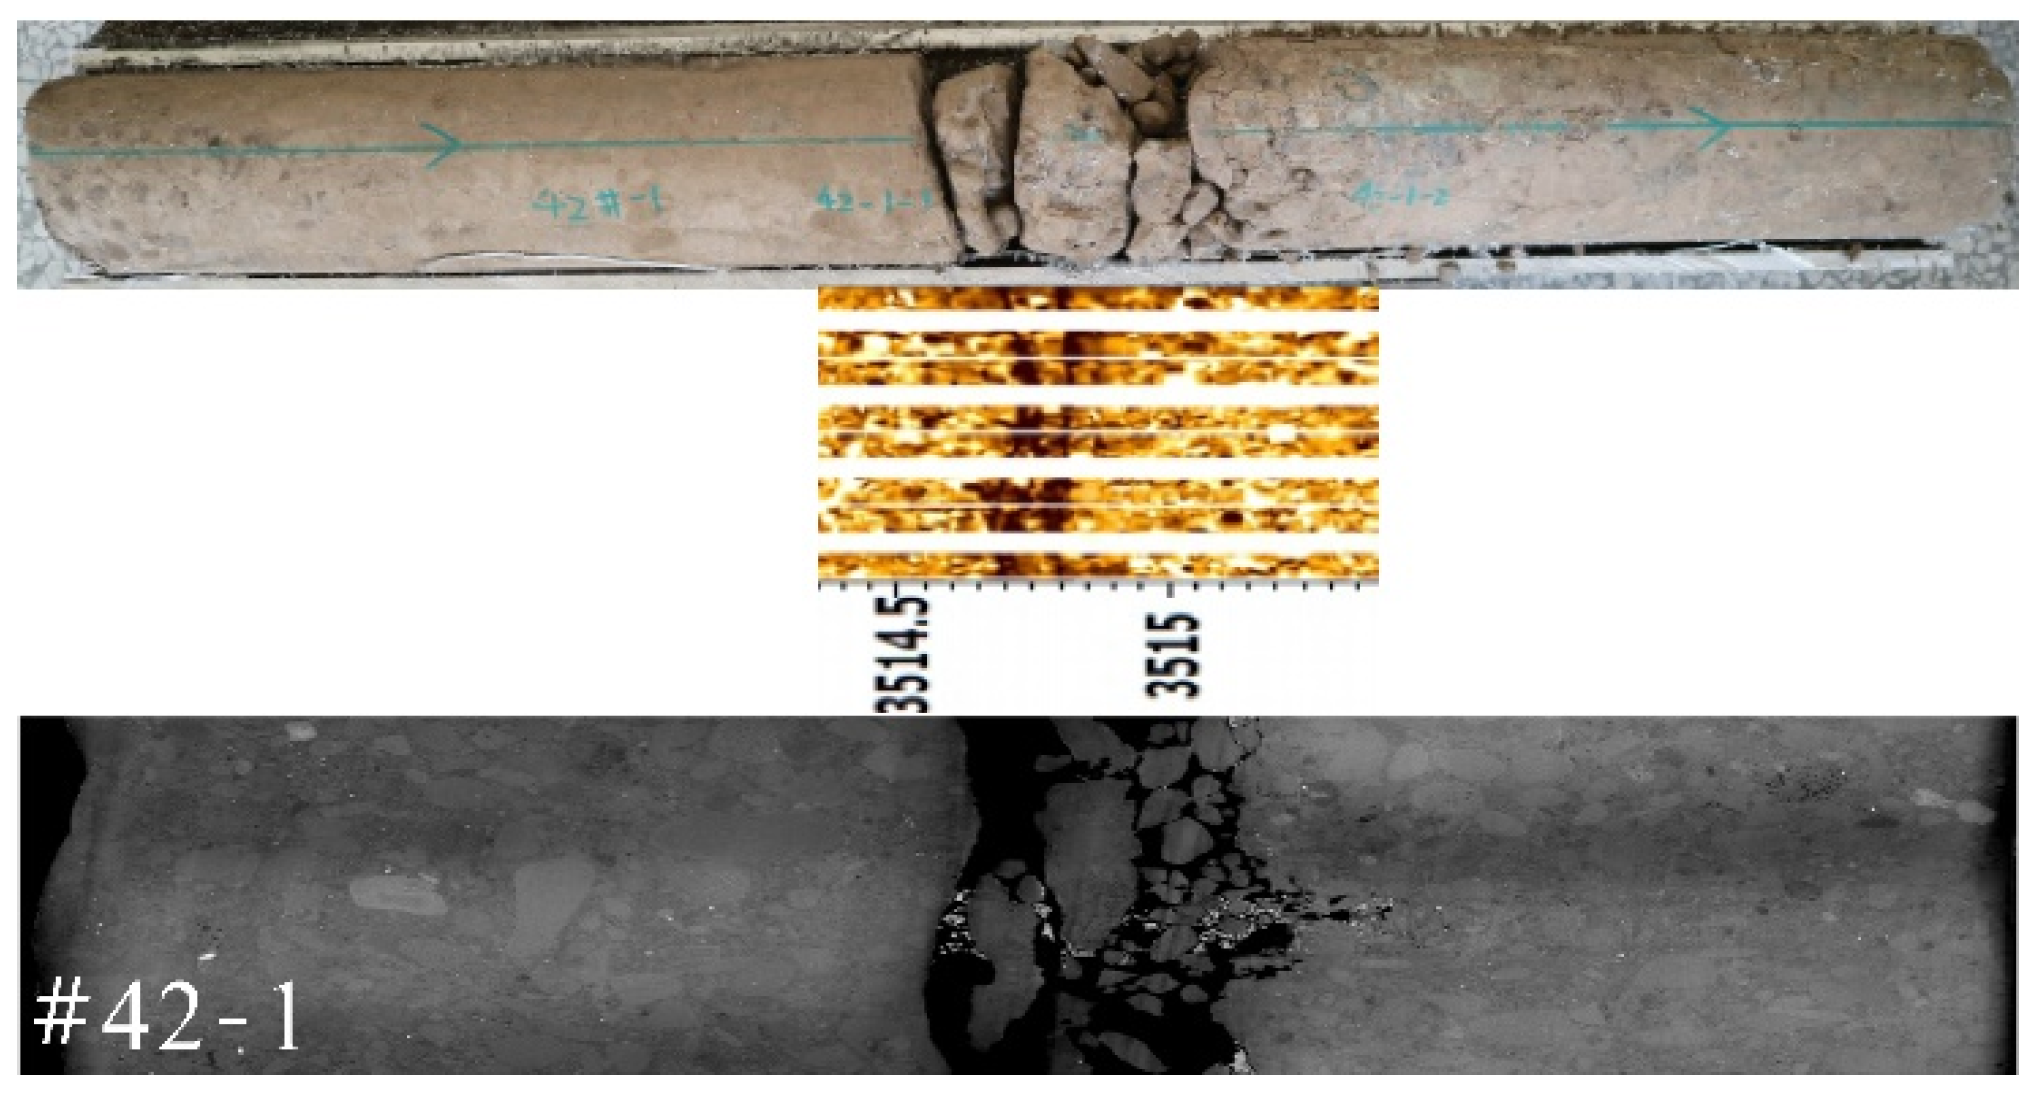
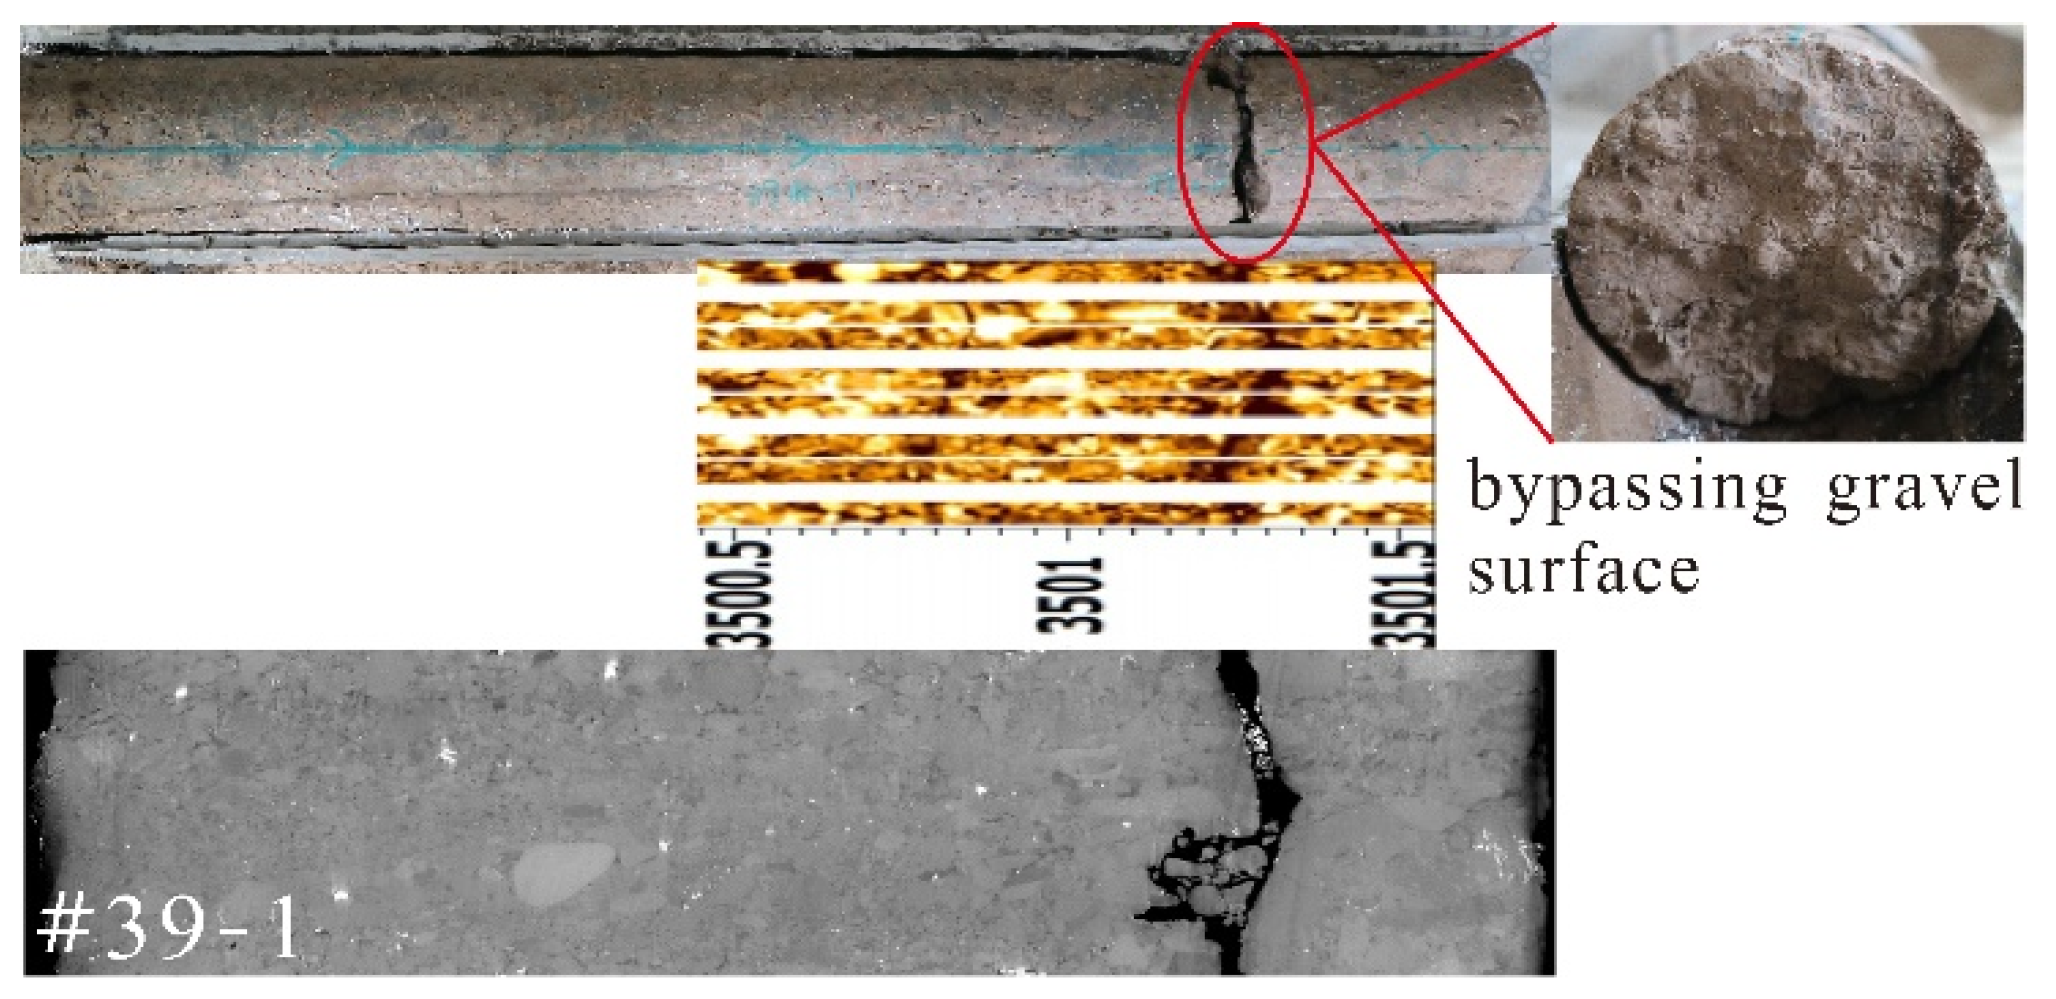
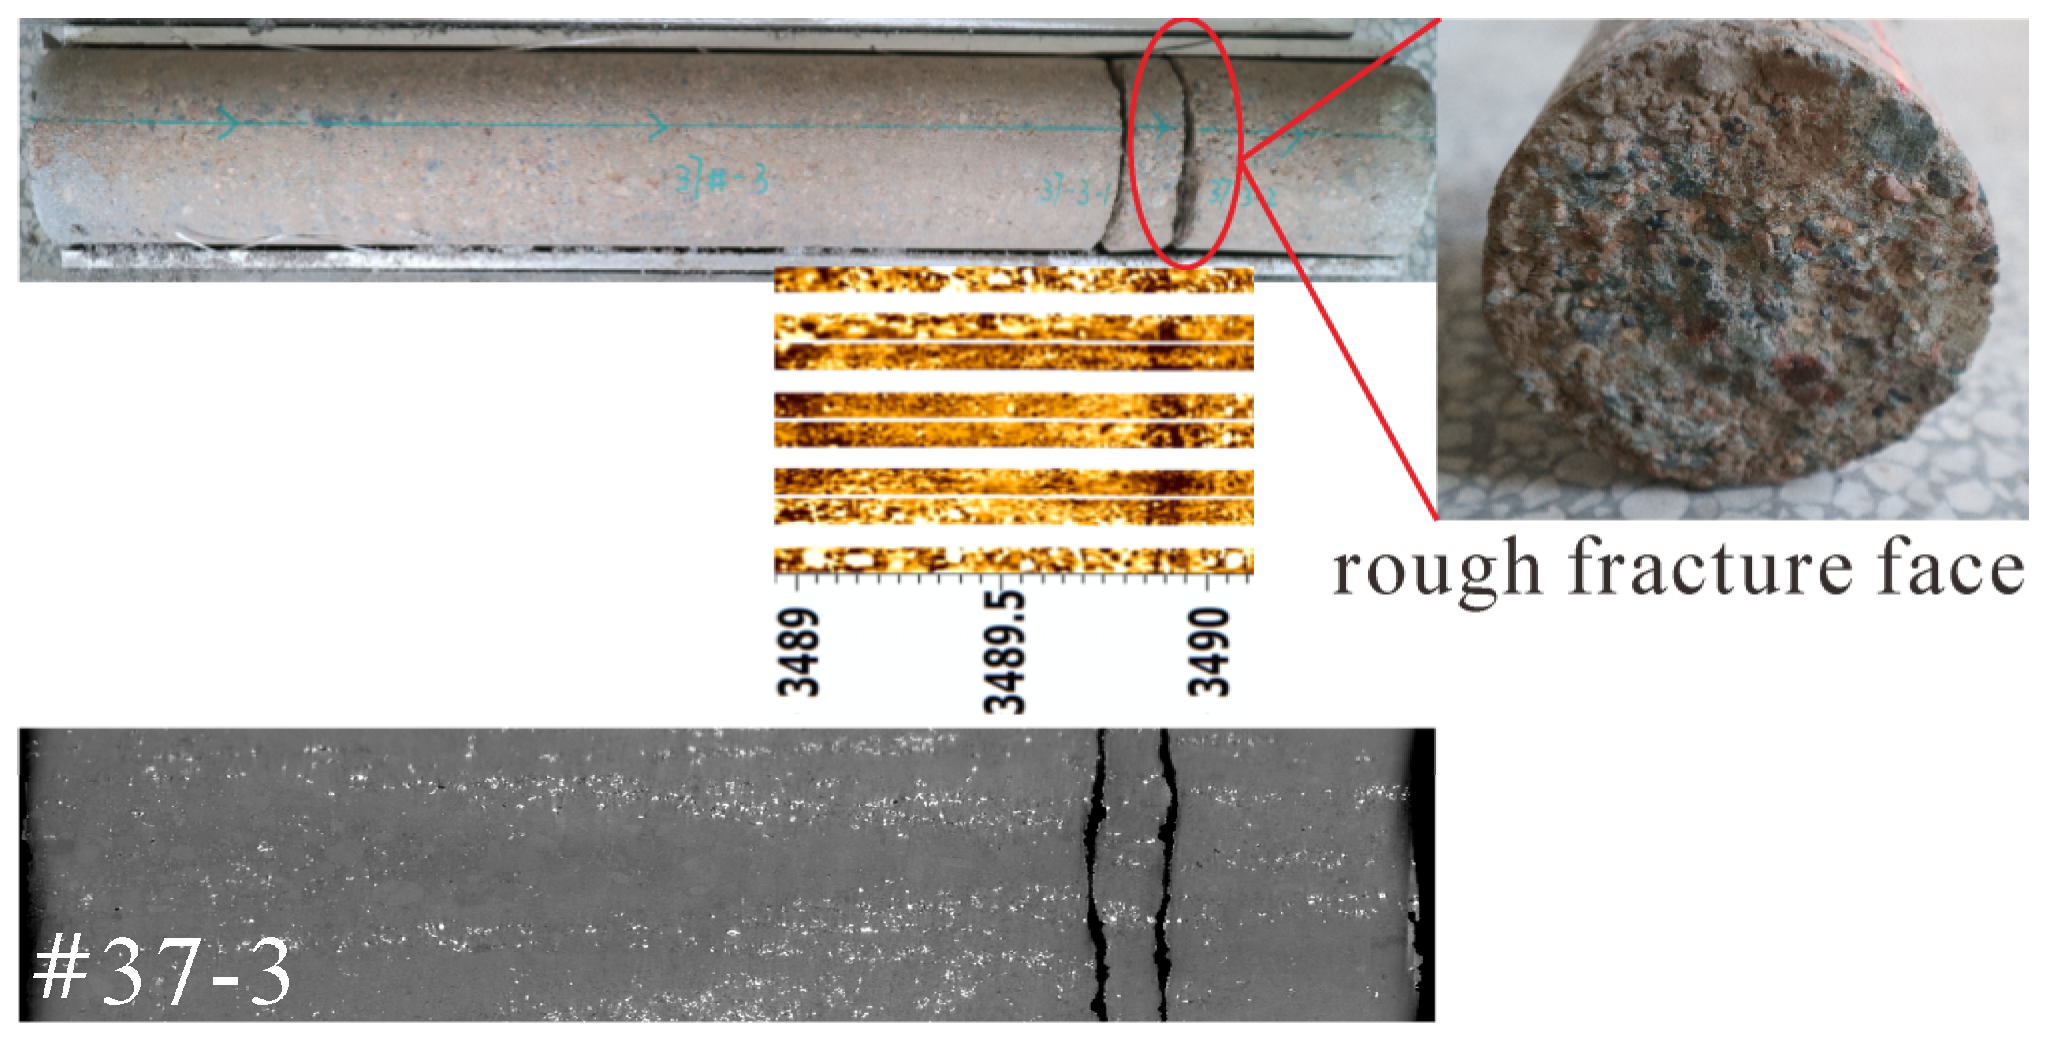
3.1. Hydraulic Fracture (HF)
3.2. Drilling-Induced Fracture (DF)
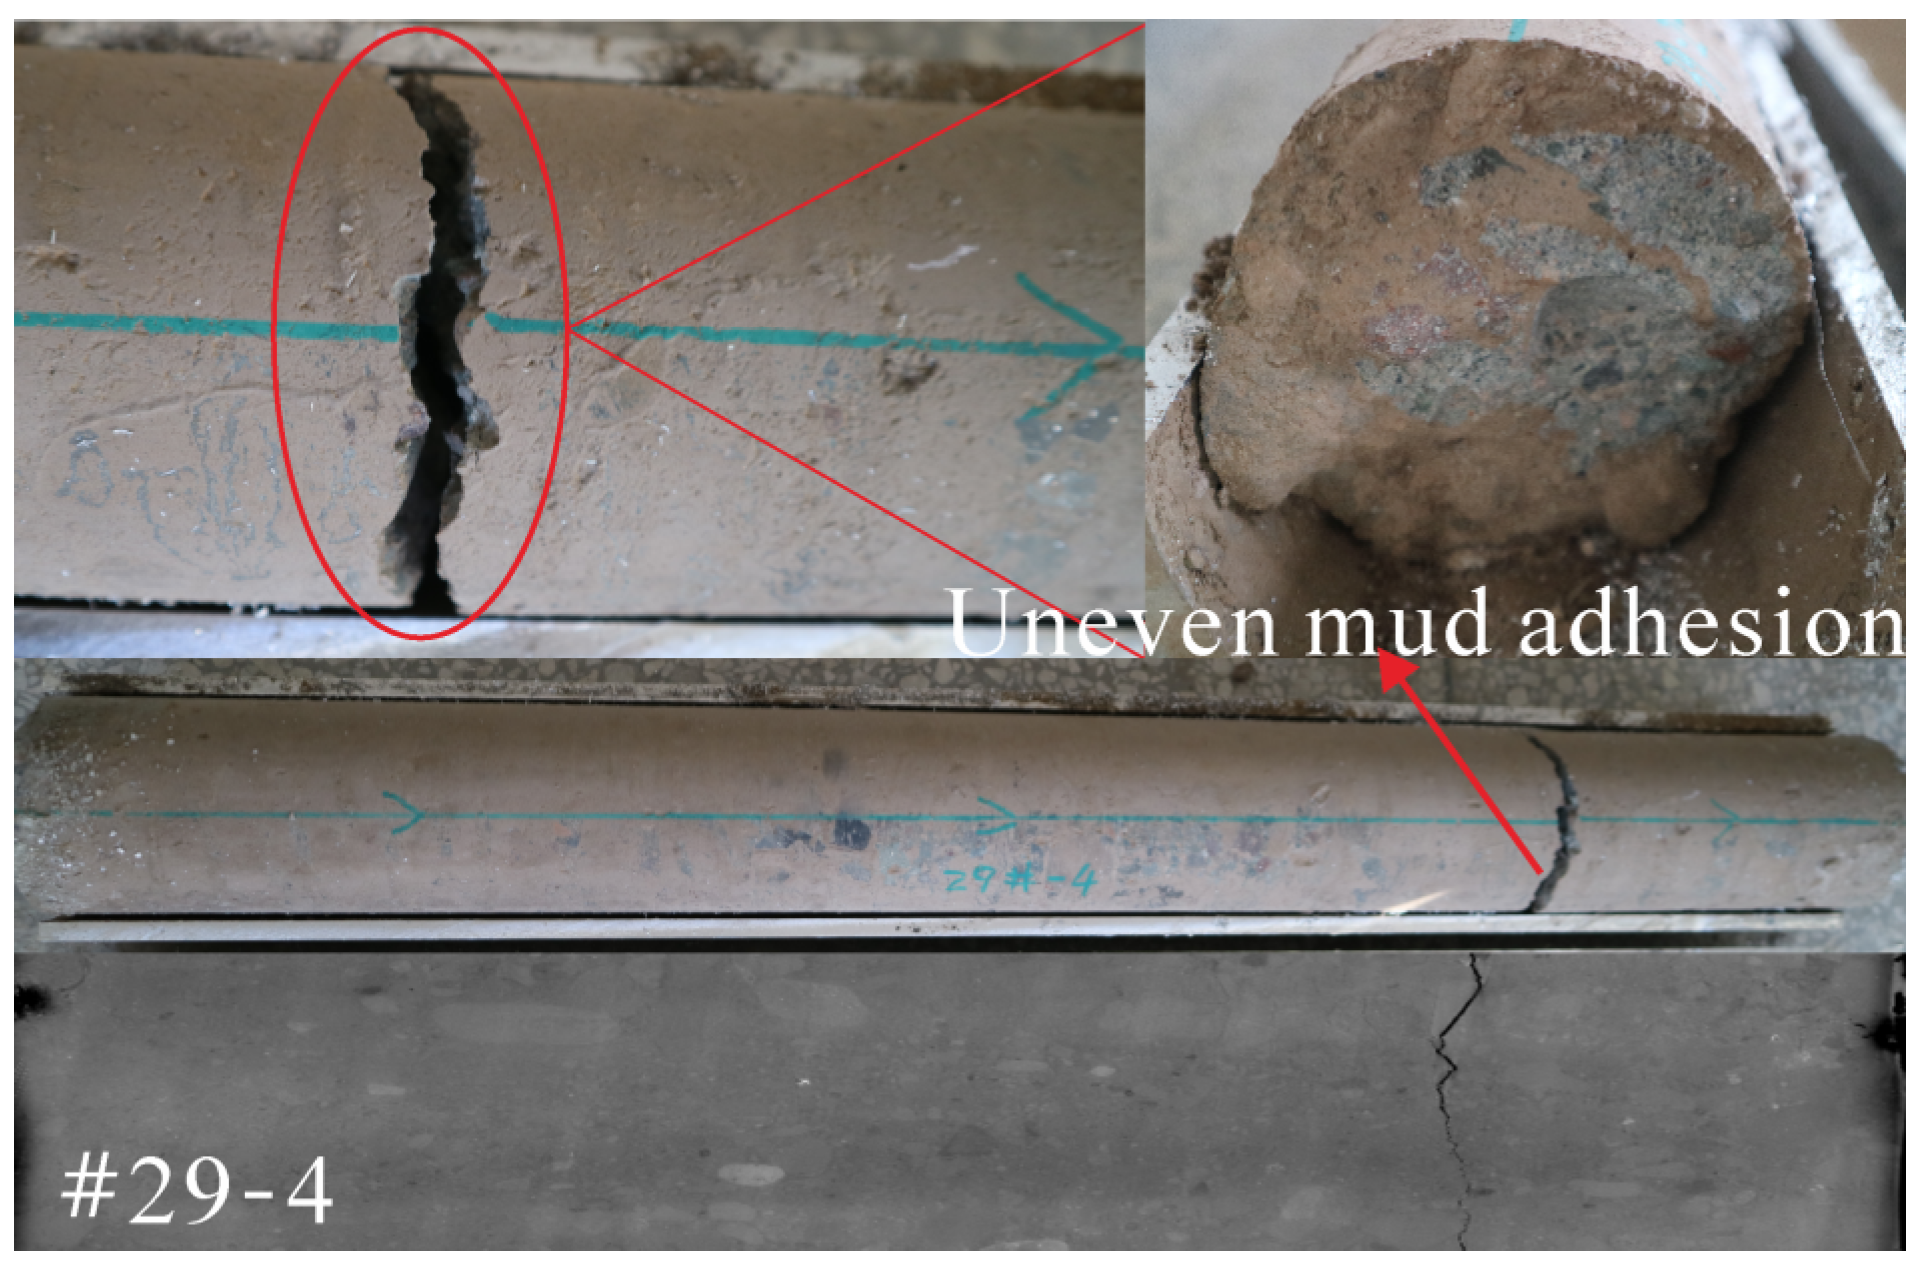
3.3. Core Cutting-Induced Fracture (CF)
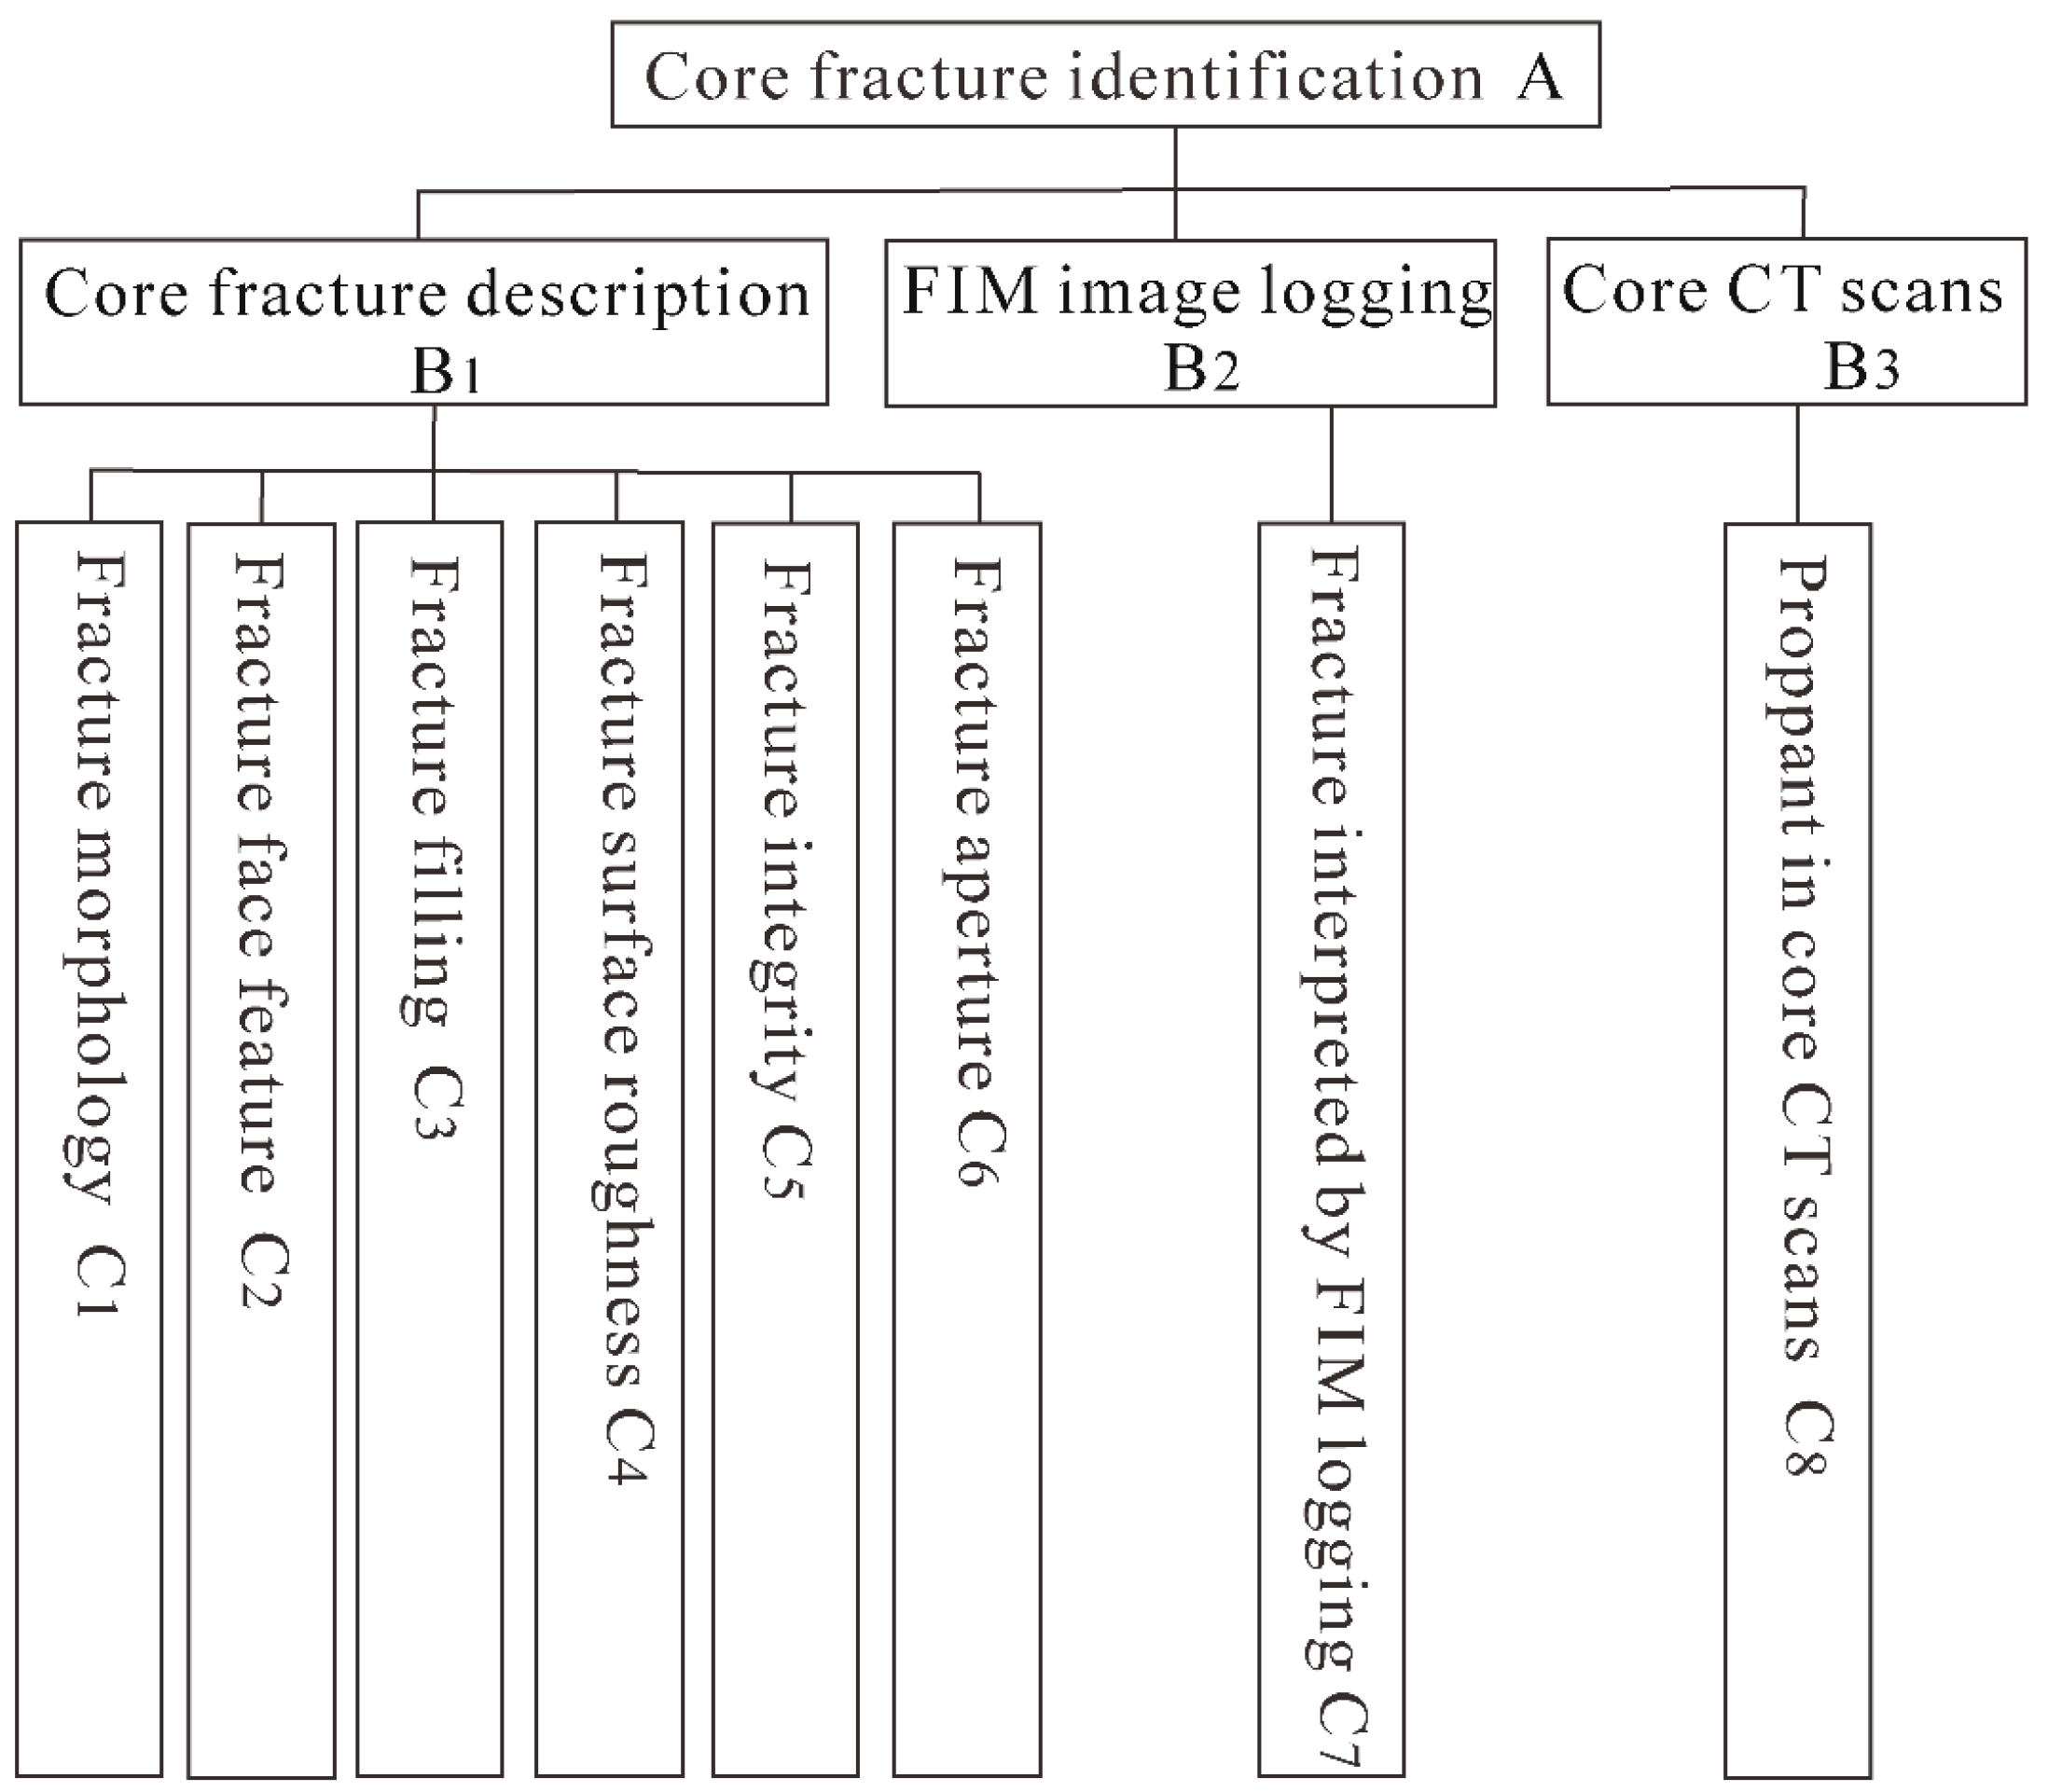
4. AHP–FCE Method of Core Fracture Identification
4.1. Index Weight of Index Determination Using AHP
4.2. Core Fracture Type Confirmation Using FCE
- (1)
- Create a single-index fuzzy evaluation matrix. According to practical experience or expert evaluation, a fuzzy mapping can be obtained from the indexes set to the evaluation set; it expresses the membership grade of an index to fracture types.
- (2)
- Construct a fuzzy evaluation matrix for a single fracture. According to experts’ judgment of a fracture, obtain the membership grade of each characteristic index of the fracture to the fracture types, as shown in Table 5.
- (3)
- Calculate the fuzzy evaluation set. The fuzzy evaluation set (B) is calculated by multiplying the index weight W and the fuzzy evaluation matrix R, as follows:
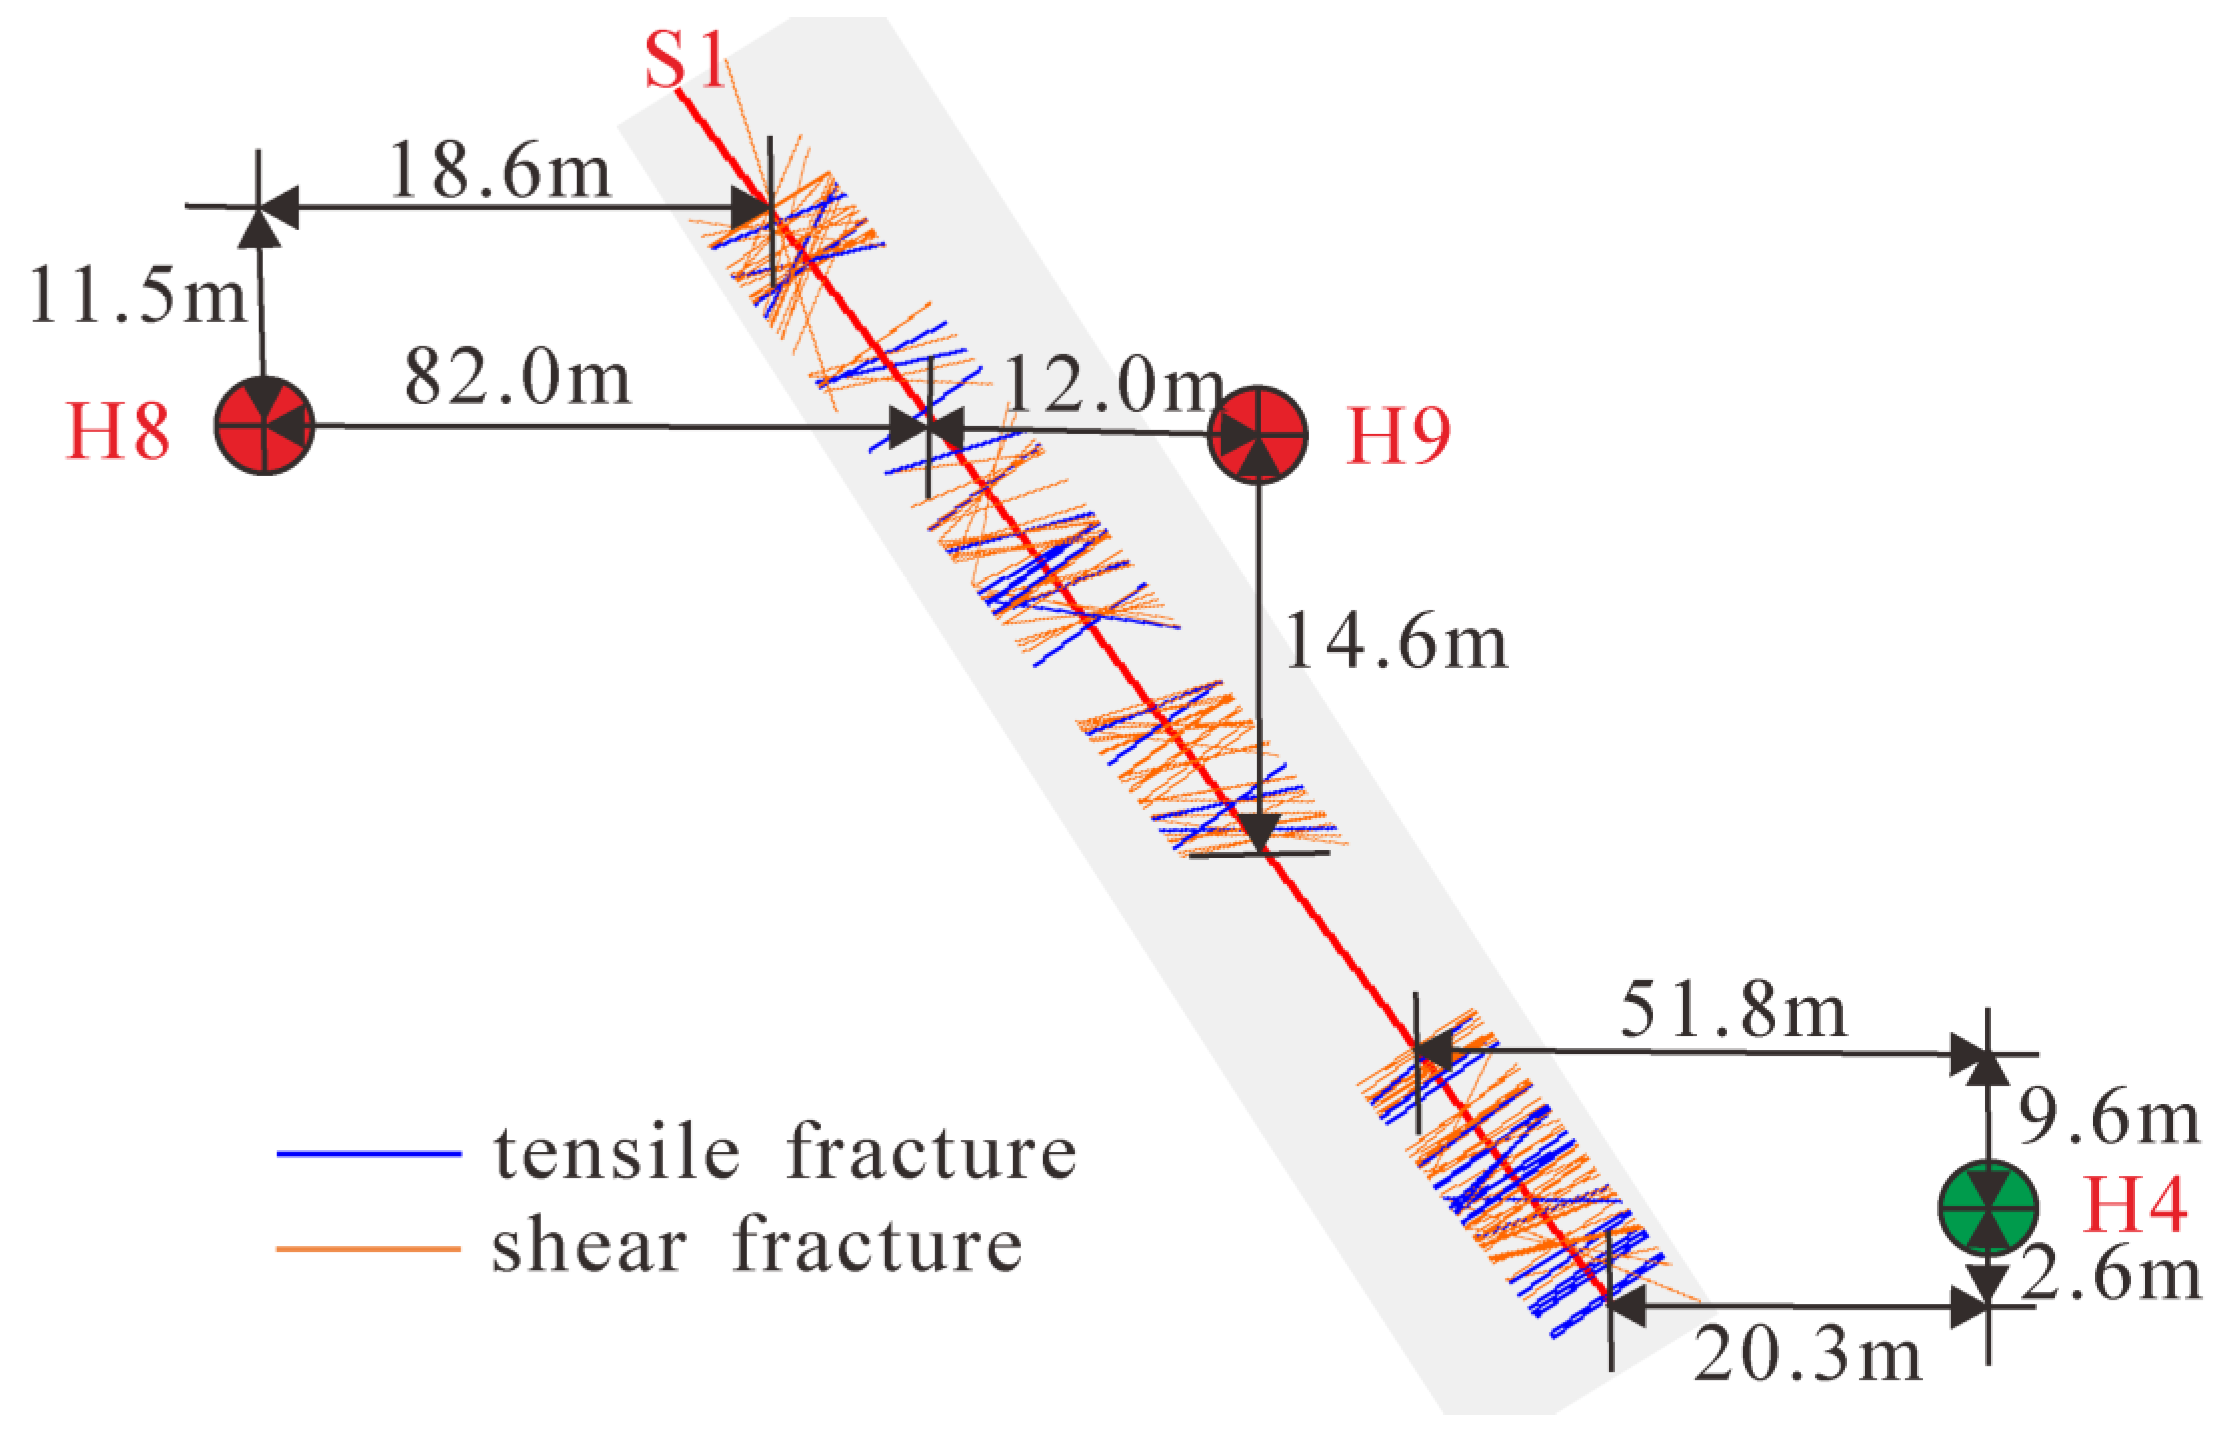
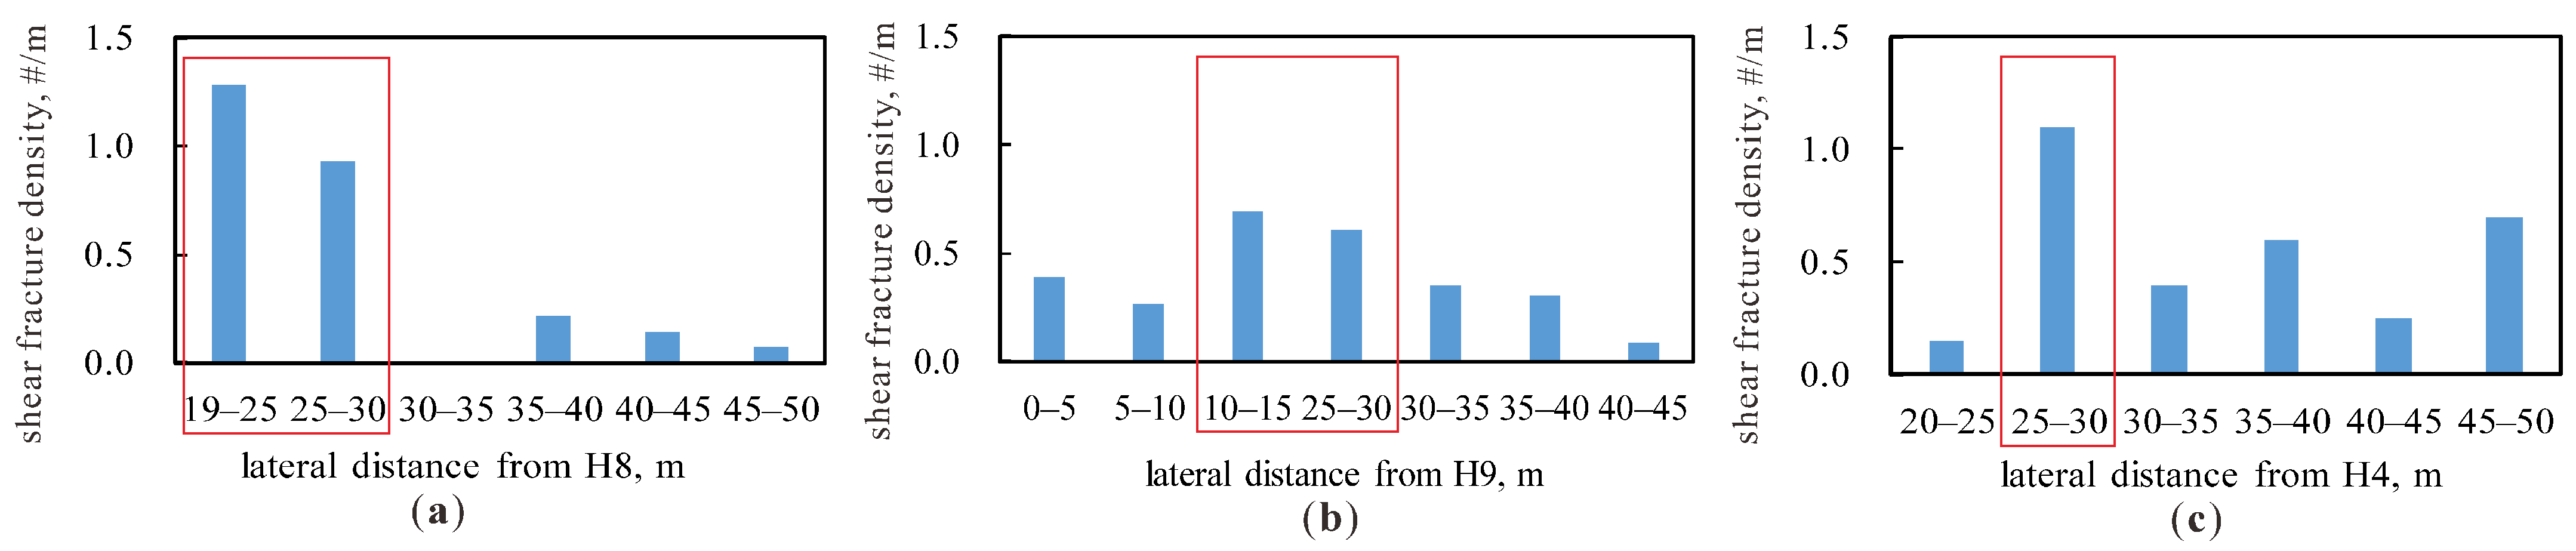
5. Core Fracture Classification Results and Verification
6. Conclusions
- (1)
- The hydraulic fractures of the CHFTS were mainly linear and microwave in morphology, and the fracture surface was characterized by through-penetrating gravel and bypassing gravel patterns.
- (2)
- According to the characteristics of the core fractures of the CHFTS, the hydraulic fractures were subdivided into tensile fractures and shear fractures. It was necessary to take the spatial distribution of tension fractures and shear fractures into consideration when obtaining the formation mechanism of hydraulic fractures.
- (3)
- The APH–FCE method was used to identify core fracture types in the post-fracturing conglomerate reservoir, which provided good agreement with numerical simulation results.
- (4)
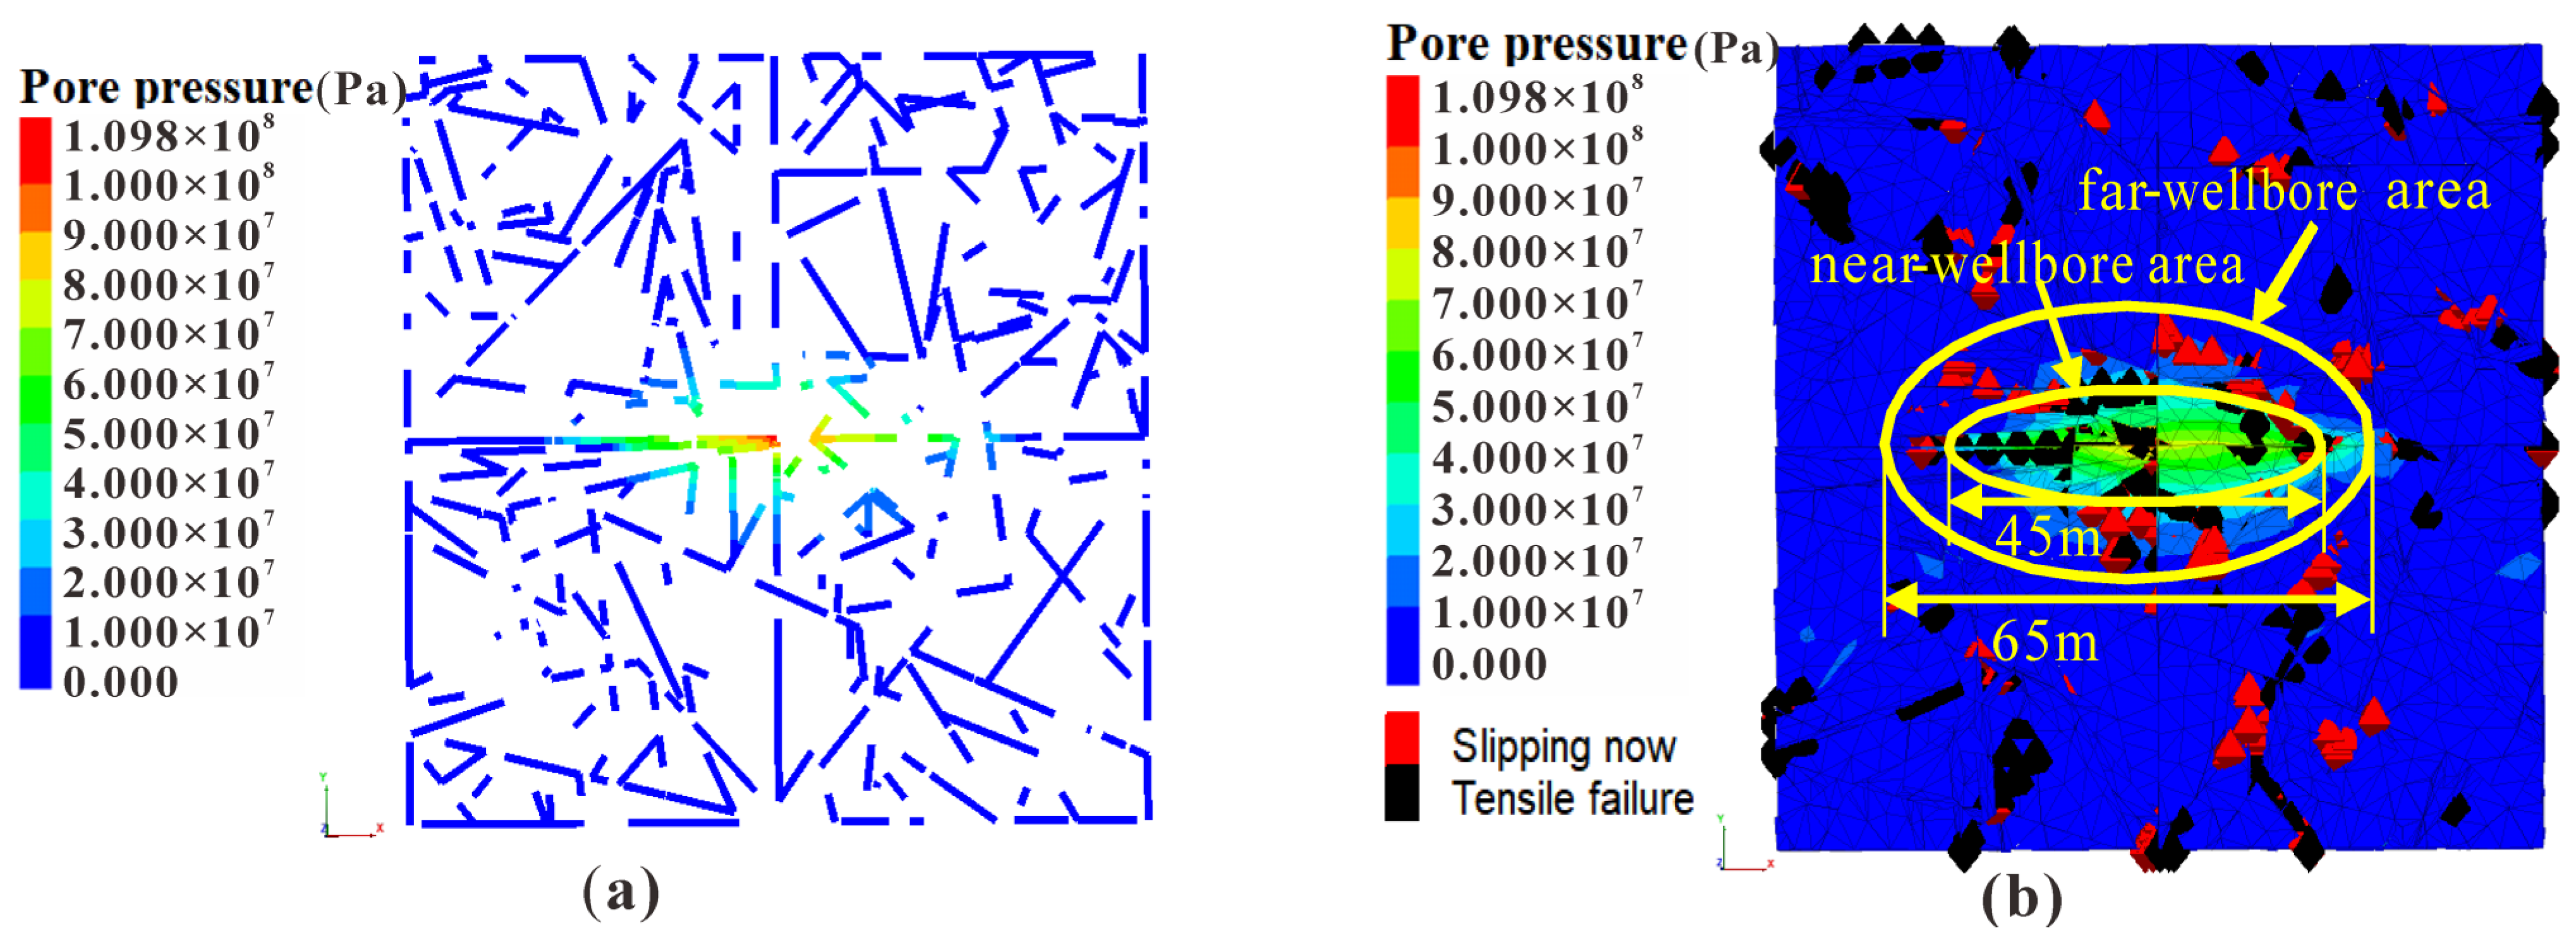
- According to the fracture classification results in this study, the tensile fractures were mainly in the near-wellbore area with lateral distances of less than 20–25 m from the wellbore. The shear fractures were mainly in the far-wellbore area with lateral distances of 20–30 m from the wellbore.
Author Contributions
Funding
Institutional Review Board Statement
Informed Consent Statement
Data Availability Statement
Acknowledgments
Conflicts of Interest
References
- Liu, X.; Xiong, J.; Liang, L.; You, X. Rock Mechanical Characteristics and Fracture Propagation Mechanism of Sandy Conglomerate Reservoirs in Baikouquan Formation of Mahu Sag. Xin Jiang Pet. Geol. 2018, 39, 83–91. [Google Scholar]
- He, X.; Ma, J.; Liu, G.; Shi, S.; You, J.; Wu, J. Analysis of Rock Mechanics and Assessments of Hydraulic Fracture Network in Conglomerate Reservoirs of Mahu Oilfield. Xin Jiang Pet. Geol. 2019, 40, 701–707. [Google Scholar]
- Li, Q.; Cheng, Y.; Ansari, U.; Han, Y.; Liu, X.; Yan, C. Experimental Investigation on Hydrate Dissociation in Near-Wellbore Region Caused by Invasion of Drilling Fluid: Ultrasonic Measurement and Analysis. Environ. Sci. Pollut. Res. 2022, 29, 36920–36937. [Google Scholar] [CrossRef] [PubMed]
- Xv, C.; Zhang, G.; Lyu, Y.; Wang, P. Experimental study on hydraulic fracture propagation in conglomerate reservoirs. In Proceedings of the 53rd US Rock Mechanics/Geomechanics Symposium, New York, NY, USA, 23–26 June 2019. [Google Scholar]
- Liu, P.; Ju, Y.; Ranjith, P.G.; Zheng, Z.; Chen, J. Experimental investigation of the effects of heterogeneity and geostress difference on the 3D growth and distribution of hydrofracturing cracks in unconventional reservoir rocks. J. Nat. Gas Sci. Eng. 2016, 35, 541–554. [Google Scholar] [CrossRef]
- Yu, T.; Yuan, F.; Zhou, P.; Hao, L.; Zou, Y.; Ma, X.; Zhang, Z. Fracture Propagating Shapes in Gravel-Supported Conglomerate Reservoirs of Upper Wuerhe Formation on Manan Slope, Mahu Sag. Xinjiang Pet. Geol. 2021, 42, 53–62. [Google Scholar]
- Dong, J.; Chen, M.; Li, Y.; Wang, S.; Zeng, C.; Zaman, M. Experimental and Theoretical Study on Dynamic Hydraulic Fracture. Energies 2019, 12, 397. [Google Scholar] [CrossRef] [Green Version]
- Shentu, J.; Lin, B.; Dong, J.; Yu, H.; Shi, S.; Ma, J. Investigation of hydraulic fracture propagation in conglomerate reservoirs using discrete element method. In Proceedings of the ARMA-CUPB Geothermal International Conference, Beijing, China, 5–8 August 2019. [Google Scholar]
- Liang, H.; Tang, H.; Qin, J.; Li, Y.; Zhou, X.; Zhang, L. Multi-Scale Investigations on the Geometries of Hydraulic Fractures in Conglomerate Reservoirs. In Proceedings of the International Petroleum Technology Conference, Riyadh, Saudi Arabia, 21–23 February 2022. [Google Scholar]
- Katterbauer, K.; Qasim, A.; Shehri, A.A.; Zaidy, R.A. A Deep Learning Formation Image Log Classification Framework for Fracture Identification–A Study on Carbon Dioxide Injection Performancefor the New Zealand Pohokura Field. In Proceedings of the 2022 SPE Annual Technical Conference and Exhibition, Houston, TX, USA, 3–5 October 2022. [Google Scholar]
- Udegbe, E.; Morgan, E.; Srinivasan, S. Big Data Analytics for Seismic Fracture Identification, Using Amplitude-Based Statistics. In Proceedings of the 2018 SPE Annual Technical Conference and Exhibition, Dallas, TX, USA, 24–26 September 2018. [Google Scholar]
- Cai, H.; Zuo, H.; Wen, C.; Qian, F.; Shi, H.; Zhang, Y. Fault and Fracture identification in volcanic reservoirs: A case study from the Junggar Basin. In Proceedings of the 2017 SEG International Exposition and Annual Meeting, Houston, TX, USA, 24–29 September 2017. [Google Scholar]
- Wang, S.; Tan, Y.; Sangnimnuan, A.; Khan, S.; Liang, B.; Rijken, P. Learnings from the Hydraulic Fracturing Test Site (HFTS) #1, Midland Basin, West Texas—A Geomechanics Perspective. In Proceedings of the Unconventional Resources Technology Conference, Denver, CO, USA, 22–24 July 2019. [Google Scholar]
- Gale, J.F.W.; Elliott, S.J.; Li, J.Z.; Laubach, S.E. Natural Fracture Characterization in the Wolfcamp Formation at the Hydraulic Fracture Test Site (HFTS), Midland Basin, Texas. In Proceedings of the Unconventional Resources Technology Conference, Denver, CO, USA, 22–24 July 2019. [Google Scholar]
- Vissotski, A.; Singh, A.; Rijken, P.; Reverol, R. Analysis of Completion Design Impact on Cluster Efficiency and Pressure-Based Well Communication in HFTS-2 Delaware Basin. In Proceedings of the Unconventional Resources Technology, Houston, TX, USA, 26–28 July 2021. [Google Scholar]
- Zhang, Z.; DiSiena, J.; Bevc, D.; Ning, I.L.C.; Tan, Y.; Swafford, L.; Craven, M.; Hughes, K.; Vissotski, A. Hydraulic fracture characterization by integrating multidisciplinary data from the Hydraulic Fracturing Test Site 2 (HFTS-2). In Proceedings of the Unconventional Resources Technology Conference, Houston, TX, USA, 26–28 July 2021. [Google Scholar]
- Gulliver, D.; Sarkar, P.; Tinker, K.; Means, N.; Fazio, J.; Xiong, W.; Hakala, A.; Lopano, C.; Leleika, S.; Harmon, A.; et al. Novel Geochemistry Determined from High Pressure, High Temperature Simulation Experiments of Hydraulic Fracture Test Site 2. In Proceedings of the Unconventional Resources Technology Conference, Houston, TX, USA, 26–28 July 2021. [Google Scholar]
- Shi, S.; Zhuo, R.; Cheng, L.; Xiang, Y.; Ma, X.; Wang, T. Fracture Characteristics and Distribution in Slant Core from Conglomerate Hydraulic Fracturing Test Site (CHFTS) in Junggar Basin, Northwest China. Processes 2022, 10, 1646. [Google Scholar] [CrossRef]
- Xie, D.; Guo, S.; Li, S. The Study of Green Risk Assessment for Construction Project Based on “AHP–FCE” Method. In Modeling Risk Management in Sustainable Construction (Computational Risk Management); Wu, D., Ed.; Springer: Berlin, Heidelberg, 2011. [Google Scholar]
- LI, X.; MA, X.; XIAO, F.; ZHANG, S. Combined method of candidate fracturing well in tight oil reservoirs based on fuzzy comprehensive evaluation. Pet. Geol. Oilfield Dev. Daqing 2022, 41, 147–156. [Google Scholar]
- Weijermars, R.; Pham, T.; Stegent, N.; Dusterhoft, R. Hydraulic Fracture Propagation Paths Modeled using Time-Stepped Linear Superposition Method (TLSM): Application to Fracture Treatment Stages with Interacting Hydraulic and Natural Fractures at the Wolfcamp Field Test Site (HFTS). In Proceedings of the 54th US Rock Mechanics/Geomechanics Symposium, Golden, CO, USA, 28 June–1 July 2020. [Google Scholar]


| Classification Indexes | Fracture Types | |||||
|---|---|---|---|---|---|---|
| One-Level Indexes | Two-Level Indexes | Tensile Fracture | Tensile-Shear Fracture | Compression-Shear Fracture | Drilling-Induced Fracture | Core Cutting-Induced Fracture |
| Core fracture description | Fracture morphology | Microwave | Microwave or Crushed zone | Straight or Crushed zone | Serrate | Serrate |
| Fracture integrity | Incomplete | Incomplete or Partially-complete | Incomplete or Partially-complete | Complete | Complete | |
| Fracture surface feature | Bypassing gravel | Through-penetrating gravel | Through-penetrating gravel | Bypassing gravel | Bypassing gravel | |
| Fracture surface roughness | Rough | Rough | Relatively smooth | Rough | Rough | |
| Fracture filling | Mineral deposits or drilling mud | Mineral deposits or drilling mud | Drilling mud | Uneven mud | No | |
| Fracture aperture (cm) | ≥0.5 | ≥0.5 | <0.5 | <0.5 | <0.5 | |
| FIM imaging logging | Fracture interpreted by FIM | Yes | Yes | Yes or no | No | No |
| Core CT scans | Proppant | Yes or no | Yes or no | Yes or no | No | No |
| A | B1 | B2 | B3 | |||||
|---|---|---|---|---|---|---|---|---|
| B1 | 1 | 2 | 3 | 1.8171 | 0.5396 | 0.5396 | 1.6238 | 3.0092 |
| B2 | 1/2 | 1 | 2 | 1.0000 | 0.2970 | 0.2970 | 0.8936 | 3.0092 |
| B3 | 1/3 | 1/2 | 1 | 0.5503 | 0.1634 | 0.1634 | 0.4918 | 3.0092 |
| - | - | - | - | Total | 1 | 1 | - | 9.0276 |
| n | 1 | 2 | 3 | 4 | 5 | 6 | 7 | 8 | 9 |
| RI | 0.00 | 0.00 | 0.58 | 0.90 | 0.12 | 1.24 | 1.32 | 1.41 | 1.45 |
| One-Level Indexes | Two-Level Indexes | WA−B | WB−C | W |
|---|---|---|---|---|
| B1 | C1 | 0.5396 | 0.3246 | 0.1752 |
| C2 | 0.1137 | 0.0614 | ||
| C3 | 0.2256 | 0.1217 | ||
| C4 | 0.0553 | 0.0298 | ||
| C5 | 0.2256 | 0.1217 | ||
| C6 | 0.0553 | 0.0298 | ||
| B2 | C7 | 0.2970 | 1 | 0.2970 |
| B3 | C8 | 0.1634 | 1 | 0.1634 |
| Indexes | Value of Indexes | Fuzzy Evaluation Matrix |
|---|---|---|
| C1 | Microwave | u(1) = (0.4, 0.4, 0.2, 0, 0) |
| C2 | Incomplete | u(2) = (0.4, 0.4, 0.2, 0, 0) |
| C3 | Bypassing gravel | u(3) = (0.4, 0, 0, 0.3, 0.3) |
| C4 | Rough | u(4) = (0.25, 0.15, 0.1, 0.25, 0.25) |
| C5 | Drilling mud | u(5) = (0.3, 0.3, 0.3, 0.1, 0) |
| C6 | ≥0.5 | u(6) = (0.4, 0.4, 0.2, 0, 0) |
| C7 | Yes | u(7) = (0.33, 0.33, 0.34, 0, 0) |
| C8 | No | u(8) = (0.2, 0.2, 0.2, 0.2, 0.2) |
Disclaimer/Publisher’s Note: The statements, opinions and data contained in all publications are solely those of the individual author(s) and contributor(s) and not of MDPI and/or the editor(s). MDPI and/or the editor(s) disclaim responsibility for any injury to people or property resulting from any ideas, methods, instructions or products referred to in the content. |
© 2022 by the authors. Licensee MDPI, Basel, Switzerland. This article is an open access article distributed under the terms and conditions of the Creative Commons Attribution (CC BY) license (https://creativecommons.org/licenses/by/4.0/).
Share and Cite
Zhuo, R.; Ma, X.; Zhang, S.; Ma, J.; Xiang, Y.; Sun, H. Classification and Assessment of Core Fractures in a Post-Fracturing Conglomerate Reservoir Using the AHP–FCE Method. Energies 2023, 16, 418. https://doi.org/10.3390/en16010418
Zhuo R, Ma X, Zhang S, Ma J, Xiang Y, Sun H. Classification and Assessment of Core Fractures in a Post-Fracturing Conglomerate Reservoir Using the AHP–FCE Method. Energies. 2023; 16(1):418. https://doi.org/10.3390/en16010418
Chicago/Turabian StyleZhuo, Renyan, Xinfang Ma, Shicheng Zhang, Junxiu Ma, Yuankai Xiang, and Haoran Sun. 2023. "Classification and Assessment of Core Fractures in a Post-Fracturing Conglomerate Reservoir Using the AHP–FCE Method" Energies 16, no. 1: 418. https://doi.org/10.3390/en16010418