1. Introduction
In the context of climate change and global warming, humanity has today recognized that its greenhouse gas emissions must be urgently and drastically reduced. CO2 is one of the most important components being significantly produced by the transportation system worldwide. Personal transportation by cars is today considered an important element for the reduction or cancellation of a significant part of all CO2 emissions.
In addition to the well-known contribution of electrical vehicles (EVs), whose most important disadvantages are the limited autonomy and the poor capacity to be rapidly recharged, other alternatives can be seen in the recently proposed fuel-cell vehicles (FCVs) supplied by hydrogen pressurized in a specific reservoir [
1,
2]. These vehicles have the advantage of their rapid refueling capacity, and the production of hydrogen is currently receiving innovative approaches [
3,
4,
5]. However, FCVs must be placed in the category of “low efficiency chain” vehicles. The supply chain consists of a water electrolysis system followed by a pressurization step, and then a vehicle’s internal fuel cell supplying the electric propulsion train. Such a chain represents a cascade of successive transformations with individual low efficiency, leading to a severely debatable result.
Another way of reducing CO
2 emissions can be found in using alternative renewable fuels for conventional vehicles moved by internal combustion engines (ICEs). Such solutions include most often so-called biofuels or biogases, with the added advantage of maintaining a nearly unchanged infrastructure in the vehicles and the distribution of the carburants [
6]. Similarly, a propulsion system for cars based on sustainable methanol or green methanol (e-methanol) has been proposed [
7,
8,
9]. This e-methanol system is based on hydrogen and CO
2 combination, where hydrogen is produced by water electrolysis powered by photovoltaic electricity, and CO
2 is captured from the ambient air. Compared to conventional fuels, renewable methanol reduces carbon dioxide emissions by up to 95%, reduces nitrogen oxide (NOx) emissions by up to 80%, and completely eliminates sulfur oxide (SOx) emissions and emissions of particulate matter. However, in addition to these advantages, the use of ICEs for vehicle propulsion has the disadvantage of presenting a very low energy efficiency between the tank and the wheels.
This paper discusses the different amounts of resources and reactants needed in the production process of e-methanol, starting from the equivalent surface area of a PV plant needed for the water electrolysis producing H2 to the quantities required in the methanol reactor, and including the indispensable infrastructure for the capture of the low content of CO2 from the ambient air. The main motivation of the study is at the level of highlighting the quantitative aspects and limitations related to a process that basically has all the advantages required to be chosen as a sustainable solution without greenhouse gas emissions.
2. The Components of the e-Methanol Production Process
The main components of the considered e-methanol production process are represented in
Figure 1. The output variable m
e-meth on the right side of the figure corresponds to the annual production of e-methanol in mass. This is the output of the process reactor. The input quantities of the reactor are hydrogen and CO
2. CO
2 is captured from the ambient air, and the hydrogen is produced by the electrolyser, which further produces oxygen. The electric power feeding the electrolyser is obtained from a large photovoltaic plant. The necessary surface area of this plant is indicated as A
PV and will be estimated on the basis of the parameters obtained from an already operating large PV plant of several hundreds of MW of power.
The electrolyser receives a given amount of desalinized water from the sea. The salinity of the pumped water is 3.5%, and the salinity of the discharged water is 8%.
Near the represented main sub-components, which are used for the main conversions and electrochemical transformations, several auxiliary devices, and additional sub-processes are used to complete the system. Between the PV plant and the electrolyser, diverse power electronic converters and transformers are needed. Especially in the case of a very large PV arrangement, the problem of transporting electrical power over long distances in the order of magnitude of tens of kilometers with an acceptable efficiency demands a dedicated collection network where medium-voltage DC systems or medium- or high-voltage AC systems must be used [
10,
11].
At the output of the electrolyser, the hydrogen generated must be conditioned and stored due to the day/night intermittency of sun irradiation when the CO
2 hydrogenation process is run 24 h per day. Hydrogen storage can be realized in different forms, compression in pressurized vessels being the easiest to implement and showing an acceptable efficiency [
12].
Similar auxiliary conditioning equipment is used at the output of the CO2 capture system, for the real operation of the reactor, or within the seawater desalination system. In a general way, the mass transfer conditions are not considered in this study; nor is the energy demand of auxiliary devices such as water pumps, gas compressors, cooling devices, active heat exchangers, or other conditioning equipment.
3. Hydrogenation of CO2 (Synthesis of Methanol)
For the synthesis of methanol, different processes have been proposed based on the use of copper/zinc oxide-based catalysts [
13,
14]. For the evaluation of the quantities of reactants involved, the process can be described through the three individual reactions illustrated in
Table 1.
Reaction (1) summarizes the reaction of CO2 with hydrogen for the production of methanol and water. It is accompanied by Reaction (2) as a secondary reaction, the reaction of the gas with water in the reverse sense (RWGS), which consumes the same reactants, but which is not desired in the process (the hydrogenation of CO2 into CH3OH). The production of CO through RWGS leads to the appearance of an additional path for the synthesis of methanol: by hydrogenation of CO (Reaction (3)). Reaction (1) and Reaction (3) are exothermic, whereas RWGS is endothermic.
Reaction (1) can be rewritten in terms of the different atomic masses of the involved chemical species
as
or
Related to the masses of matter involved in the process, namely m
H2 for the mass of hydrogen,
mCO2 for the carbon dioxide, and
mH2O for the produced mass of water the following relations can be written in dependency of the produced mass of methanol
mCH3OH 4. Quantitative Design
The main goal of this study is to evaluate the feasibility of a methanol synthesis plant as described in
Figure 1, under nearly realistic quantitative conditions. An assumption is made that 500,000 tons of methanol should be produced per year. This value corresponds approximately to the annual fuel consumption of 300,000 cars, each car consuming 10 L per 100 km and driving 20,000 km per year, based on an ICE engine needing around 1.5 times the consumption of classic fuel. The density of methanol is 0.83.
The indicated number of cars that could be supplied from a methanol plant of 500,000 tons should be compared with the real number of cars circulating in a region. For example, Switzerland has more than 4 million cars; while in Germany, the total number of passenger vehicles registered for use on public roads has increased to over 48.5 million in 2022. In such a context, a conversion to e-methanol of the whole German car fleet would need more than 160 times the described infrastructure.
Thus, introducing the value of 500,000 t of methanol in Equations (4) and (5), the following amounts of hydrogen
mH2 and CO
2 mCO2 are needed:
According to Equation (6), the reactor produces a mass of water
mH2OFollowing the analysis of the hydrogenation process regarding the different amounts of reactants and output quantities as described in
Table 1, the energetic balance can also be evaluated, in the sense of the produced heat due to the exothermic nature of the main reaction. For Reaction (1), the CO
2 reaction which produces methanol and water, the released thermal energy is given as 49.5 kJ/mol.
The number of moles of methanol generated is calculated with the value of its molar mass (M (CH
3OH) = 32.04 g/mol); thus, the number of moles becomes:
The released thermal energy during the reaction for the 500,000 tons of methanol becomes:
or
For this energy, which is dissipated over one year, if the reactor is run 24 h a day, the instantaneous power becomes:
This power must be continuously evacuated from the reactor, requiring auxiliary equipment. It could be reused elsewhere in the process, for example, for a specific type of electrolyzer based on high-temperature steam electrolysis [
12,
15]. Otherwise, the heat must be discharged, most probably in a water body. This adds to the complexity of the implementation of the facility and its negative impact on the local environment.
The next sections will be dedicated to the evaluation of the needed infrastructure, from the photovoltaic plant to the CO2 capture system and to the needed amount of seawater to be desalinized.
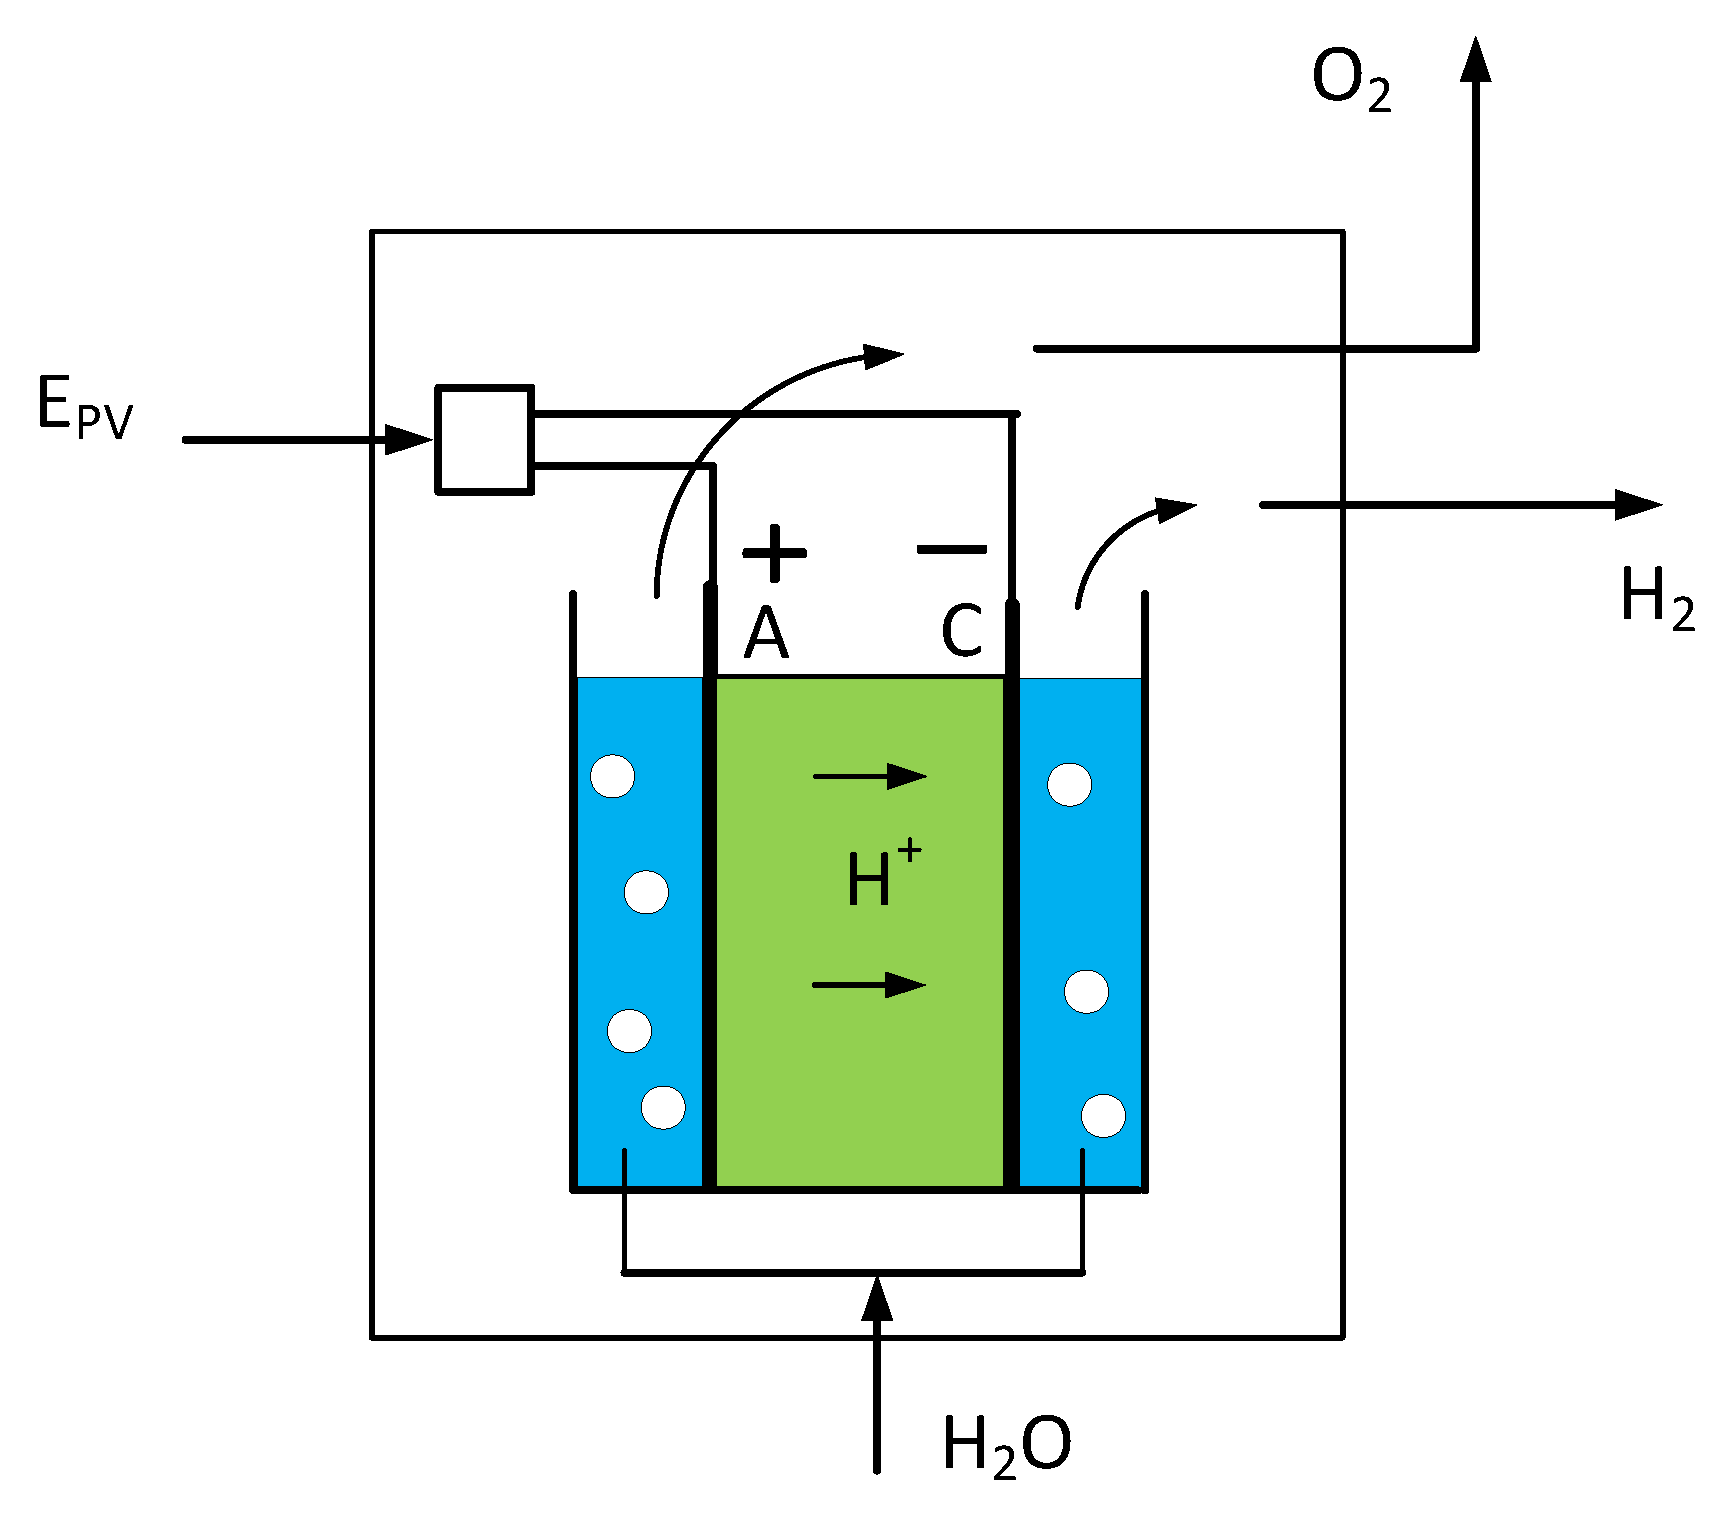
4.1. Hydrogen from Water Electrolysis
The production of hydrogen from water electrolysis is shown in
Figure 2. The amount of hydrogen to be produced annually is defined in Equation (7). This section calculates the electrical energy to be provided for the electrolysis on the base of the efficiency of the electrochemical converter. This efficiency is defined as the ratio of the heat value of the produced hydrogen E
H2 to the electrical energy fed to the electrolyser.
The needed electric power feeding the electrolyser is calculated with its energy efficiency:
This amount corresponds to an optimistic value calculated with an ideal value of the efficiency and does not consider any need for power for pressurization or purification of the hydrogen [
11].
This electric power can be produced by a large photovoltaic plant, the surface area of which is calculated on the basis of the example of the Agua Caliente PV plant (Arizona) [
16]. This plant has an area of 971 ha and produces an annual net output of 727 GWh. The annual production per ha of this real plant is then:
Thus, the surface area of the PV plant in
Figure 1 for a production of 500,000 t of methanol becomes:
Knowing that 1 km2 = 106 m2 and 1 ha = 104 m2, 1 ha = 104/106 km2 = 10−2 km2.
The needed surface area is finally calculated as:
Following the reflection made in
Section 4 on the impact of an infrastructure dedicated to the hypothetic conversion of the whole German car fleet, the needed surface area of the photovoltaic plant would become:
This surface area corresponds to a square with an edge of 105 km. A comparative representation of this surface area (blue square) is given in
Figure 3.
The required power for the PV plant shown in
Figure 1 is calculated based on a possible daily production of 6.8 h/day according to the average of daily hours from the Agua Caliente plant, which has a rated power of 290 MW
The needed power of the methanol plant electrolyzer becomes:
The power to supply the hypothetical plant for the conversion of the German car fleet becomes:
As In addition to the needed surface area required for the power of the photovoltaic plants, the question of a possible integration in this country is addressed. Recent evaluations indicate a large and, currently, underestimated, potential in the sector of building envelopes [
17]. According to [
18], roofs and facades could offer a technical potential in the order of 1000 GW. In that study, only surfaces that receive at least 500 kWh/(m
2a) of irradiation were considered. PV modules can not only be mounted on existing flat or pitched roofs, but products for building integration (BIPV, “Building-integrated PV”) are also commercially available. These include PV roof tiles, PV roof sheets, modules for cold facades, external thermal insulation composite systems (ETICS) with PV, and opaque and transparent PV insulating glass.
As an alternative, desert regions could be considered. However, their water supply, as well as the transportation of the produced methanol to the users, raises another series of questions to which there are currently no answers.
4.2. Hydrogen/Oxygen Production and Water Consumed
The electrolyzer produces simultaneously the required hydrogen and an additional amount of oxygen, which is calculated on the basis of the atomic masses of the reactants in the water equation:
The relation with the corresponding mass units can be written as:
One can so define the two mass unit ratios as:
From Equations (7) and (17) the corresponding mass of oxygen produced by the electrolyzer is calculated as:
From Equations (7) and (18) the corresponding mass of water needed is calculated as:
4.3. Feeding the Electrolyzer with Water
Equation (20) gives a value of 843,750 tons for the water needed by the electrolyser. This large amount is obtained from two sources, one is water fed back from the output of the methanol reactor, amounting to a mass of 281,250 tons, as was calculated in Equation (9); the other is water is pumped from the sea and must be desalinized before use.
Desalination technologies are generally classified as either thermal or membrane-based technologies. Although membrane-based technologies, particularly reverse osmosis (RO), constitute the majority of installed desalination capacity worldwide, thermal desalination remains the dominant technology in the regions where desalination has been used for many years (the Middle East). The two main thermal desalination technologies used are multiple evaporative distillation (MED) and multistage flash (MSF). However, the bulk of newly installed desalination capacity around the world runs on reverse osmosis membranes, which are not only more energy efficient than thermal desalination processes but also offer modularity and ease of installation [
19,
20]. In the design of the process described in this study, the reverse osmosis technique is retained, even though the discharge of water with a high salt content can locally create additional nuisances.
The amount of desalinized seawater becomes:
One can suppose the salinity of the pumped water to be 3.5% and the discharged water to be 8%. With the definitions of the pumped water amount
mp and the discharged water amount
mr, the condition that all salt of the pumped water is returned through the discharged mass to the sea can be written as:
A second relation specifies that the difference between the desalinized pumped water and the discharged water corresponds to the amount of water fed to the electrolyser
Combining the two relations, the mass of pumped sea water becomes:
The amount of discharged water is calculated from Equation (22) as:
Numerically, mp = 941,422 t and mr = 411,872 t.
4.4. CO2 Capture from the Ambient Air
Direct air capture (DAC) of CO
2 from the ambient air has become an important subject in scientific investigation and experimental engineering [
21]. DAC is currently categorized as being at “technology readiness level” 6 (on a scale of 1 to 9), meaning it is still in the large-scale and prototype phase and not yet ready for full commercial deployment. However, this also means that there is ample opportunity to improve performance and reduce costs through learning from early iterations of the technology [
21].
In the context of the present investigations regarding the quantitative impacts on used materials, process quantities, and involved industrial equipment, one important question is the amount of air that needs to be taken from the surroundings from which the needed amount of CO
2 is extracted, especially considering the low concentration of CO
2 in the air of 414 ppm or 414 g/t.
This mass should be increased as the full content of CO
2 is not extracted in the process. Considering a yield of 80%, the final mass of air becomes:
The CO
2 extraction can be run all day, all year round, leading to a flow of air of:
or
With a density of air of 1.3 kg/m
3:
The needed pressure of the air pushed through the CO
2 extractor is not known, but a rough evaluation of a fan system is made: a fan of 100,000 m
3/h is considered, which has a diameter of 1250 mm and consumes 30 kW (
Figure 4).
The airflow of the fan (100,000 m
3/h) corresponds to 27 m
3/s; thus, the number of fans required becomes:
These fans could be arranged in around 43 columns of 43 rows according to
Figure 5.
The diameter of one fan being 1250 mm, the square area becomes:
Another parameter of the fan arrangement is the velocity of the air blown. In one fan, the airflow of 100,000 m
3/h in an area of π × D
2/4 becomes:
4.4.1. Verification of the Airspeed in the Fans
This calculation tries to verify the previous result for the velocity of the air in the fans. The parameters of the fan are given in
Table 2, and the model adopted for the calculation is shown in
Figure 6.
For the calculation of the air velocity, an average rotation radius of the blades is considered:
For the angular velocity:
The tangential speed becomes:
The pitch angle of the blades is chosen as α = 20° at the equivalent radius of 0.375 m. This verifies the plausibility of the previously calculated air velocity (33).
4.4.2. Power Consumed by the Blowers
The power needed by the blowers is calculated as:
4.5. Efficiency Considerations
The process of production of e-methanol can be characterized by equivalent energy efficiency. The goal of such an evaluation is to be able to compare two different alternative solutions for future automotive systems, the first being the use of green e-methanol in a conventional ICE (Internal Combustion Engine)-driven vehicle, while the second is an EV (Electrical Vehicle) powered by a battery when this battery is recharged from the same renewable source (PV).
4.5.1. Efficiency of e-Methanol Production and Use
The efficiency of e-methanol production based on a renewable source is here defined as the ratio of the heat value of the produced fuel divided by the renewable energy fed into the process. Two components for the energy input are considered in this evaluation, the electric energy fed to the electrolyzer (5.16 × 10
6 MWh from Equation (11)) and the needed power for the CO
2 capture (56.4 MW from Equation (38), the corresponding energy of which is:
The sum of the provided renewable energy from the PV becomes:
The heat value of the 500,000 tons of e-methanol is calculated as:
Finally, the efficiency of e-methanol production can be given as:
In
Figure 7, the whole chain of e-methanol production and use is presented. In this presentation, the efficiency of the propulsion system based on the ICE engine (tank-to-wheels) is given as 0.15. The cascade of the fuel production efficiency (0.51) and the propulsion gives an extremely low value of 0.077.
4.5.2. Efficiency of an Electric Vehicle Powered from PV
Figure 8 shows the complete chain of an EV powered from photovoltaic panels. The indicated value of the efficiency of the power train (η = 0.72) corresponds to the cascade of an electric motor (η = 0.9) and a power electronic converter (η = 0.95) and with 8% standby/idle losses and 6% additional losses for the driveline and auxiliaries.
The resultant efficiency becomes 68.4% if the battery is charged via a power electronic charger of 95% efficiency.
6. Conclusions
An industrial e-methanol production process has been described and the quantitative design of the main process and its subcomponents has been calculated. A realistic design of the components has been made on the basis of an annual production of 500,000 tons of synthetic fuel. Huge amounts of reactants for the process are needed, and also the ground surface area for the PV plant feeding the electrolyser has been evaluated on the basis of the experienced productivity of a large reference plant in Arizona. The obtained results together with a comparison of the needed quantities in relation to a hypothetical conversion of the actually circulating cars in different countries show the difficulty of realizing a substitution at a large scale of conventional fossil fuels by synthetic ones produced with renewable sources.
A further assessment has been made by comparing the whole well-to-wheel efficiency of an e-methanol-powered conventional vehicle and an EV-powered from photovoltaics.
The e-methanol fuel could in this sense only become a limited sectorial contribution to the world decarbonization process of transportation, in combination with several other CO2-free solutions. Quantitative limitations within the realization of the other solutions according to the obtained results in this evaluation would lead to a forced reduction of the number of cars circulating.


