Article

Modeling and Simulation of Silicon Solar Cells under Low Concentration Conditions

1
Faculty of Physics and Technology, Al-Farabi Kazakh National University, 71 Al-Farabi, Almaty 050040, Kazakhstan
2
Power Electronics and Renewable Energy Research Laboratory, Department of Electrical Engineering, University of Malaya, Kuala Lumpur 50603, Malaysia
3
School of Software and Electrical Engineering, Swinburne University of Technology, Melbourne VIC 3122, Australia
4
Center of Research Excellence in Renewable Energy and Power Systems, King Abdulaziz University, Jeddah 21589, Saudi Arabia
5
Department “Alternative Energy Sources”, Tashkent State Technical University Named after Islam Karimov, University Street 2, Tashkent 700095, Uzbekistan
*
Author to whom correspondence should be addressed.
Energies 2022, 15(24), 9404; https://doi.org/10.3390/en15249404
Submission received: 9 November 2022 / Revised: 7 December 2022 / Accepted: 9 December 2022 / Published: 12 December 2022

Abstract

:
Today’s research on concentrated photovoltaic (CPV) cells focuses on creating multi-junction semiconductor solar cells capable of withstanding high temperatures without losing their properties. This paper investigated silicon low concentrated photovoltaic (LCPV) devices using Fresnel lenses. The parameters of the silicon CPV cell were measured to simulate its operation based on a single-diode model with four and five parameters. The most optimal position of the Fresnel lens relative to the solar cell was shown, and the dependence of the CPV efficiency on the concentration ratio, incident solar power, and temperature was studied. Experiments on heating of a solar cell were conducted to build a model of heating of a solar cell under different solar radiation based on machine learning. Additionally, a cooling system was developed, and experiments were conducted for one LCPV cell. The resulting LCPV model was used to predict electrical power output and temperature change pattern using clear day data. Results of modeling show increase in generated energy by 27% compared with non-concentrated solar cells. Cooling system energy consumption was simulated, and the optimum cooling regime was determined. The proposed LCPV system can be used as a hybrid heat and electricity source, increase power generation, and does not require new solar cell production technologies.

1. Introduction

Today, with the development of green energy and increasing demand for alternative energy sources, more and more attention is paid to ways to increase the efficiency of solar panels. In the development and research of solar cells in recent decades, two main trends can be replaced: the creation of more efficient semiconductor materials and the development of additional devices to increase the efficiency of solar cells. Such devices include solar trackers [1,2,3], MPPT controllers [4], and solar concentrators [5,6,7]. Developments in the field of increasing the degree of solar flux concentration up to 1000 suns (1 sun = 1000 W/m2) using various optical techniques inevitably entail the development and creation of new semiconductor materials capable of withstanding such operating conditions. The most important limitation of such systems is the use of expensive semiconductor elements and the need for very accurate orientation to the sun due to the small size of the solar cell.
The classification of concentrating photovoltaic systems today includes modules with high concentration (HCPV), medium concentration (MCPV), and low concentration (LCPV). The concentration ratio C is determined by the ratio of the intensity of solar radiation per square meter with the Gx optical system to the average standard solar radiation G = 1000 W/m2 and is measured in suns. For HCPV, the value of C is in the range of 300–2000 suns; for MCPV, the concentration ratio is 40–300 suns; and for LCPV, the concentration ratio is 1–40 suns [8]. A high concentration ratio can be obtained by using lenses of various shapes and parameters. The most commonly used optical systems in this field are Fresnel lenses and mirror parabolic concentrators [9]. The positive aspects of Fresnel lenses are their relative cheapness and durability, whereas the surface of mirror parabolic concentrators degrades over time [10,11,12].
HCPV and MCPV systems use semiconductor hetero-structures capable of withstanding high concentration ratios and high temperatures without failing [13,14,15,16]. The sizes of such semiconductors range from 1 mm2 to 1 cm2 [17]. Currently, the efficiency of such systems reaches 45% [18]. However, such systems use solar cells with high resistance to external influences (solar radiation, temperature, etc.), which increases the cost of the elements by about 100 times higher than that of traditional silicon cells. In the articles [19,20,21], solar concentrators with a high concentration ratio were studied, and triple-junction solar cells were used. Such semiconductor solar cells are not produced on a commercial scale, and the high cost of electricity generated in this method creates a need to look for new methods. Increasing the concentration ratio entails a number of necessary changes in the design of the solar battery. The most important thing is to provide solar cells with a cooling system. The authors of [22] show a silicon CPV system using a cooling system and a linear Fresnel lens, with which it was possible to increase the amount of generated energy by 28%. Most laboratories dealing with this issue use water as a heat carrier and aluminum pipes [23]. The solar energy converted into heat is removed by water flowing through a pipe to which the solar cells are attached. The heat transfer properties of an aluminum radiator improve with an increase in the aspect ratio of its cross section [24].
Commercial silicon polycrystalline solar cells fail quickly at high temperatures. Due to Auger recombination, the efficiency of silicon solar cells cannot exceed 36–37%, regardless of the concentration ratio [25]. Reference [26] discusses six ways of using silicon solar cells for concentrating PV systems by creating hetero-structures with several junctions. The maximum efficiency of silicon CPV systems reached 27.6% with a concentration ratio of 92 suns [27]. Reference [28] shows experimental silicon LCPVs for the purpose of comparing concentrating systems with a Fresnel lens and an optical mirror system. This study shows a decrease in the efficiency of the solar cell from 7.5 to 5% with an increase in the concentration ratio from 1 to 12.
To use CPV systems in practice, it is necessary to accurately ensure that the light spot hits the solar cell. For this purpose, solar trackers of various designs are used [29,30].
There are many papers that provide accurate models of PV cells [31,32]. Modeling the behavior of silicon solar cells under concentrated conditions is complicated and requires a lot of experimental data.
In reference [33], the analytical five-point method, which is very similar to curve fitting techniques, but is faster and more convenient, was used in order to extract parameters of a single-diode model, and the authors obtained accurate, reliable results that can describe the performance of a solar cell.
Reference [34] presents a general approach to modeling photovoltaic modules. The short circuit current point (0, Isc), open circuit voltage point (Voc, 0), and the maximum power point (Vmpp, Impp) points were chosen for the parameter determination. The needed data of CIS thin film and m-Si and c-Si solar modules for the model were obtained from either the products’ data sheet or experimental testing results.
An improved and comprehensive mathematical model for photovoltaic (PV) devices, developed in MATLAB based on the basic circuit equation of a solar cell with the basic data provided by the manufacturer, was presented in [35]. The effects of solar radiation, ambient temperature, and cell types, including monocrystalline and polycrystalline silicon, are fully considered.
Single-diode and double-diode models of solar cell and their parameter extraction methods were described by mathematical techniques in [35]. The photocurrent, Iph; the reverse diode saturation current, I0; the ideality factor of diode, n; the series resistance, RS; and the shunt resistance, Rsh, were the main parameters of a solar cell.
Celik in [32] and Chan in [33] proposed a model based on the five parameters, IL, I0, Rs, Rsh, and n, at a certain temperature and solar irradiance level within the limits of Voc, Isc, Vmpp, and Impp. Additionally, Valerio [36] and Brano [37] provided their model based on a single-diode model with five parameters and Merbaha [38] based on a double-diode model.
Celik constructed a four-parameter model in [32] based on the assumption that Rsh is infinite and thus can be ignored. A four-parameter model based on single-diode model was devised by Tivanov [39], and the parameters of the solar cell, such as Rsh, Rs, I0, and n were calculated from the I–V characteristic at different illumination levels, and Iph was equal to Isc. Besides, a four-parameter model was proposed by Tivanov [39], Chegaar [40], and Khan [41] based on single-diode model and Kaminski [42] based on double-diode model.
In this paper, the parameters of a polycrystalline silicon solar cell are experimentally determined at different temperatures and at different incident solar radiation with and without a Fresnel lens. Based on the obtained parameters, a mathematical model of the solar cell is developed herein. CPV cell performance is calculated by experiments and a model of concentrated solar cells is proposed using a model of a solar cell based on a five-parameter on a single-diode model.

2. Model of Solar Cell

In our work, cheap commercial polycrystalline solar cells were used. A mathematical single-diode model of a solar cell was built based on five parameters, such as photocurrent Iph, reverse saturation current I0, series resistance Rs, shunt resistance Rsh, and ideality factor n [31]. The equivalent circuit of the solar cell is shown in Figure 1.
Equation (1) is used to describe the solar cell:
I =   I ph I 0 exp q V + R s I nkT 1 V + R s I R sh
where I is the output current of the solar cell, V is the output voltage, k is the Boltzmann constant, and T is the absolute temperature. Reference [32] shows the five-parameter model of a solar cell as a function of open circuit voltage Voc, voltage at maximum power Vmp, short circuit current Isc, and current at maximum power Imp. These parameters are given by the manufacturer or experimentally determined. Using Equations (2)–(6), we determine the parameters of the solar cell.
n = q V mp + I mp R s 0 V oc kT ln I sc V mp R sh I mp ln I sc V oc R sh + I mp I sc V oc R sh
I 0 = I sc V oc R sh exp qV oc nkT
I ph = I sc 1 + R s R sh + I 0 exp 1 + qI sc R s nkT 1
R s =   R s 0 nkT qI 0 exp qV oc nkT
R sh =   R sh 0
where Rs0 is the inverse value of the tangent slope at no-load voltage, and Rsh0 is the inverse value of the tangent slope at the short circuit current.
Besides the five-parameter model, in this work we investigated the four-parameter model [43] in order to compare and identify which model works properly. Thus, the four-parameter model will be described in the following paragraphs. This model is also based on single-diode model but there are four parameters, such as Rsh, Rs, n, and I0. Equation (1) is used to describe the model, but Iph is considered as Isc. However, Rsh, Rs, n, and I0 are determined as follows in Equations (7)–(9):
R sh =   R sc
R s =   R OC ( V m +   R OC I mpp   V OC )   I m + ln I sc   I mpp   ln I sc I sc  
n = V m + I mpp R OC V oc ln I sc   I mpp   ln I sc V T
I 0 = nV T R OC   R s exp qV oc n V T
where Rsc is short circuit resistance and Roc is open circuit resistance, Isc is short circuit current, Voc is open circuit voltage, I mpp is the current at maximum power point, and V m is the voltage at maximum power point. V T = kT, where k is the Boltzmann constant and T is the absolute temperature.

3. Extracting Parameters of Solar Cell

Let us determine the optimal position of the lens using geometric constructions, placing the solar cell so that the rays coming from the edges of the Fresnel lens pass through the extreme points of the solar cell as shown in Figure 2.
Thus, the task is to determine the variable h—height of the lens relative to the solar cell. We introduce the notation llen—the length of the lens, lcell—the length of the solar cell, d = l len 2   , x = l len l cell   2 , y—a ray of the beam connecting the extreme points of the lens and the solar cell, and f—focal length. Define the angles: β =   atan d f , α = 180 ° 90 ° β = 90 ° +   β , γ =   α 90 ° = 90 ° +   β 90 ° =   β . Let us define y from the ratio sin β =   sin γ = x y , taking into account x, we get y = x sin β = l len l cell 2 sin β .
Using geometric constructions, we write an expression for h taking into account x and y:
h = ( l len l cell   2 sin β ) 2 ( l len l cell   2 ) 2
Simplifying Formula (11) and expressing the desired value only in terms of the length of the solar cell and the length and focal length of the Fresnel lens, we finally get the following formula for h:
h = l len l cell   2   1 sin atan l len 2 f 2 1
If f = 17 cm, llen = 15 cm, and lcell = 5.2 cm, then h will take the value 10.453 cm.
An important ratio for CPV cells is the geometrical concentration ratio Cgeo. It is defined by the fraction of the aperture area Aaperture and the designated area of the solar cell Acell,des, where the designated area is the illuminated area of the solar cell.
C geo = A aperture   A cell . des
If we calculate Cgeo for our system, then Cgeo = (15 × 15) cm2/(5.2 × 5.2) cm2 = 8.321.
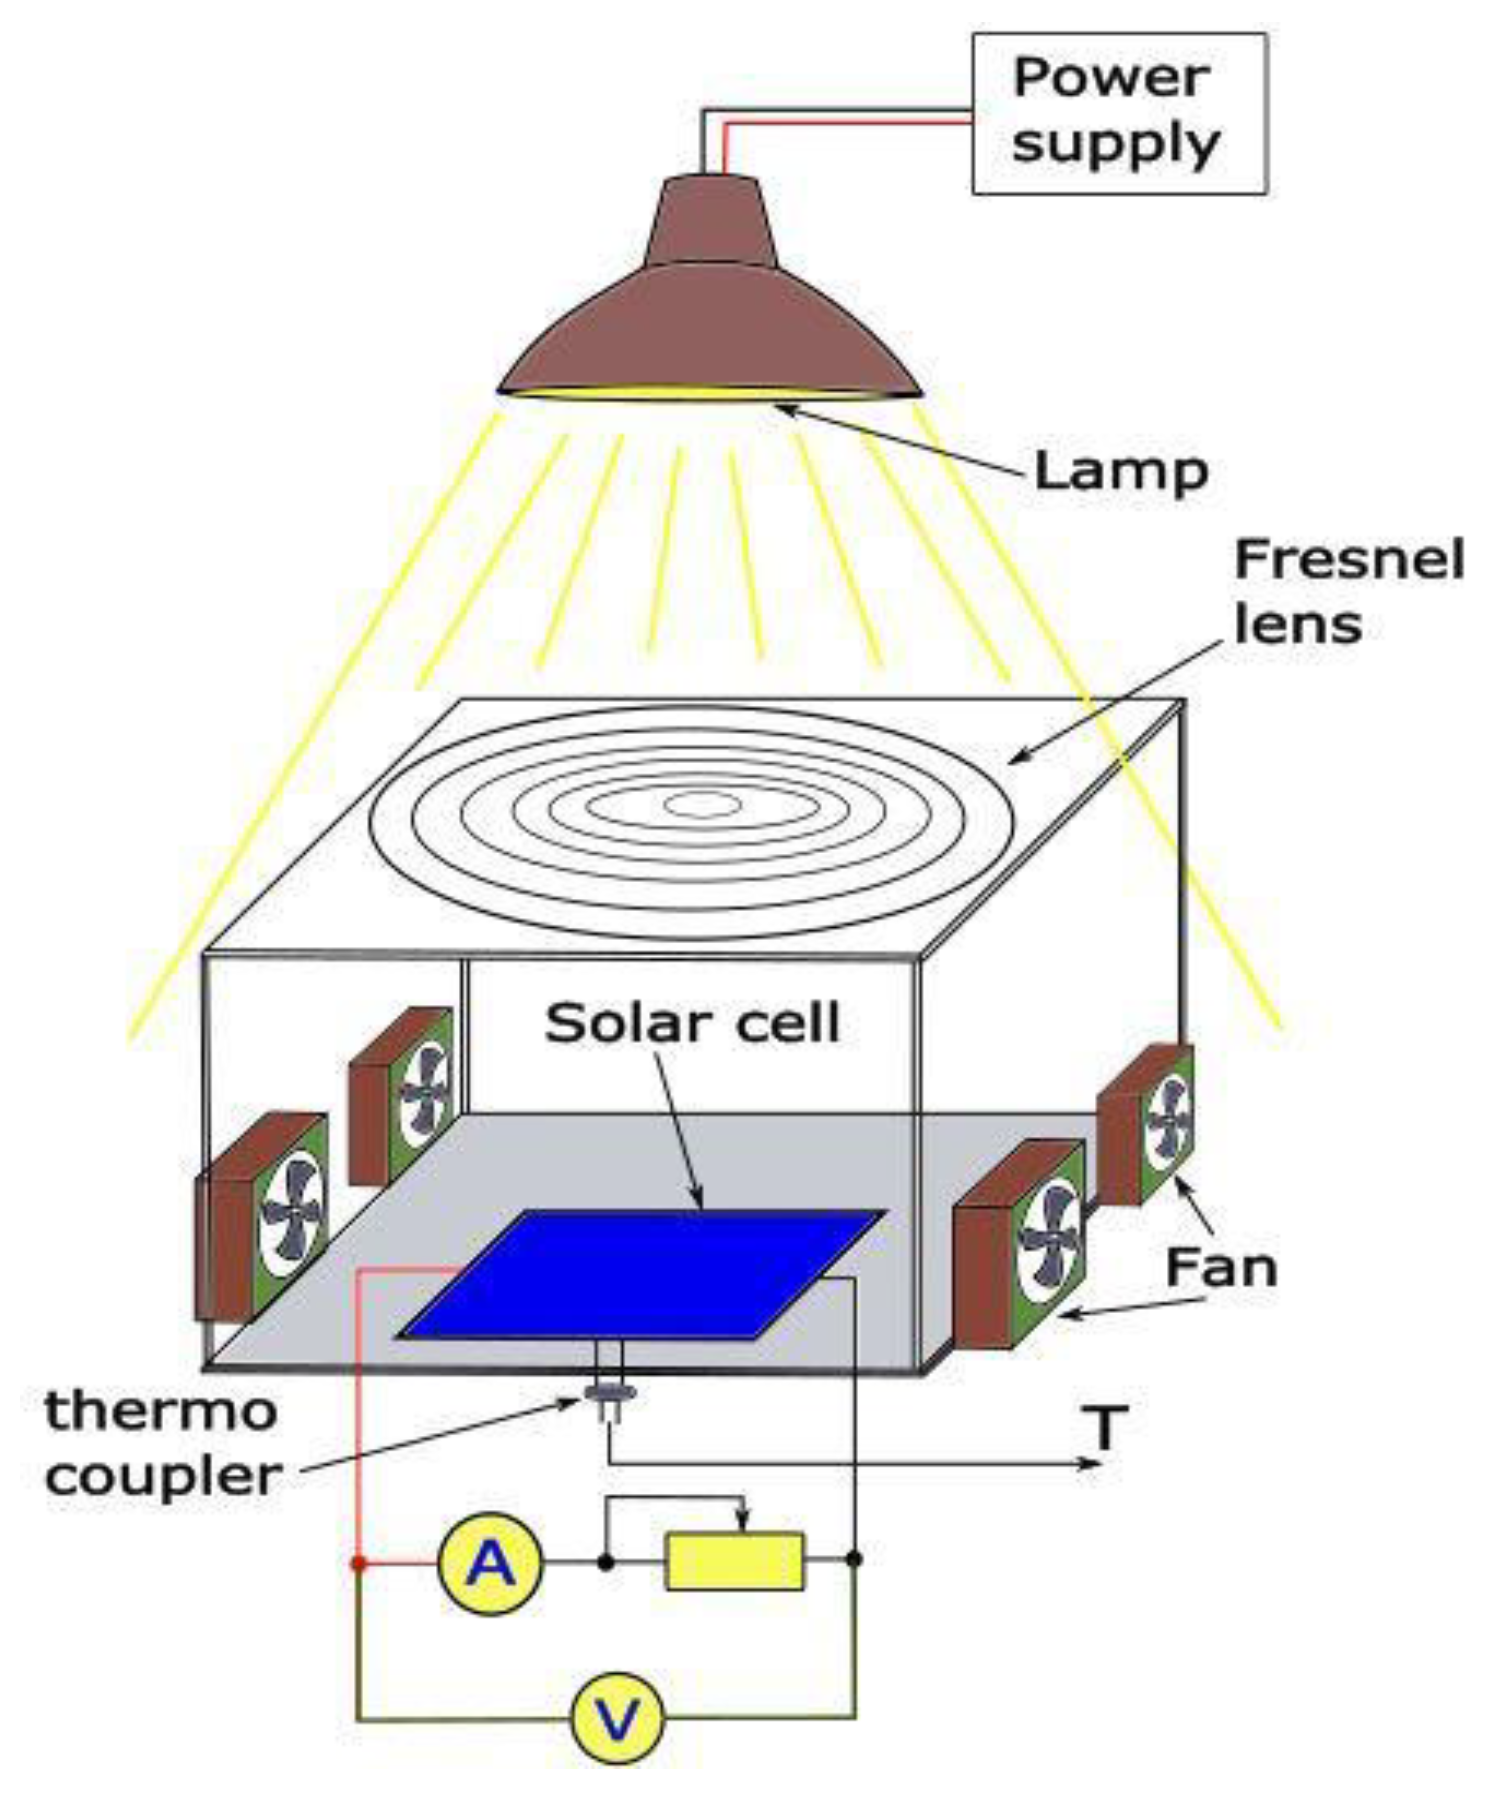
The experimental setup for studying the light characteristics of a concentrating silicon solar cell is a solar cell with a temperature sensor fixed on the back side. The experimental setup is shown in Figure 3. The temperature sensor is a K-type thermocoupled with a range of measured temperatures from 0 °C to 400 °C. The solar cell is fixed on the surface with a slot for the temperature sensor. A height-adjustable Fresnel lens is installed above the solar cell. A pyranometer is used to determine the power of solar radiation. Incandescent lamps are used as a simulator of solar radiation. Coolers are used to control the temperature of the solar cell.
The experimental installation for the study of the temp characteristics of the solar cell is a heater bed with temperature control, on which the solar cell is installed. The experimental setup is shown in Figure 4. A temperature sensor is installed near the solar cell. The solar cell is covered by a dark cover.
In order to experimentally determine the optimal position of the Fresnel lens relative to the solar cell, a number of measurements of the current–voltage characteristics of the solar cell were carried out at different temperatures and heights h of the Fresnel lens relative to the solar cell at a constant incident radiation power of 200 W/m2. The results of the experiment are shown in Figure 5. The surface constructed for h = 10 cm is higher than all other surfaces, confirming the geometric constructions. A further increase in h to 12 cm and 14 cm leads to a decrease in output power, respectively, and the surfaces corresponding to these values lie lower and symmetrically repeat the surfaces for h = 8 cm and h = 6 cm.
The graphs show that the ideality factor (Figure 6a) decreases linearly with increasing temperature and is inversely proportional to the radiation power. The reverse saturation current (Figure 6d) and the photocurrent (Figure 6b) slowly increase depending on the temperature; however, if the first value is inversely proportional to the radiation power, then the second value is directly proportional to the radiation power. The shunt resistance (Figure 6e) practically does not depend on the power of solar radiation and has a logarithmic dependence on temperature. The series resistance (Figure 6c) has the most complex dependence among the parameters of the solar cell and is in the range between 0.2 and 0.3 Ohms.

4. Modeling Silicon CPV Solar Cell Using Extracted Parameters

Using the experimental data, Equations (1)–(8) and the measured five parameters of the solar cell, we constructed models of solar cells at different radiation powers and different temperatures. The optical concentration ratio X is the most important parameter for CPV cells and must be included, so Equation (1) is rewritten as Equation (14):
I =   XI ph I 0 exp q V + R s I nkT 1 V + R s I R sh
where concentration ratio X as the ratio of the short circuit current Isc CPV of the CPV cell and the silicon cell Isc cell is defined as shown in Equation (15). Optical concentration ration X and geometrical concentration ratio Cgeo are related through optical efficiency ηopt as shown in Equation (16) [44].
X = I sc   CPV   I sc   cell  
X = C geo · η opt  
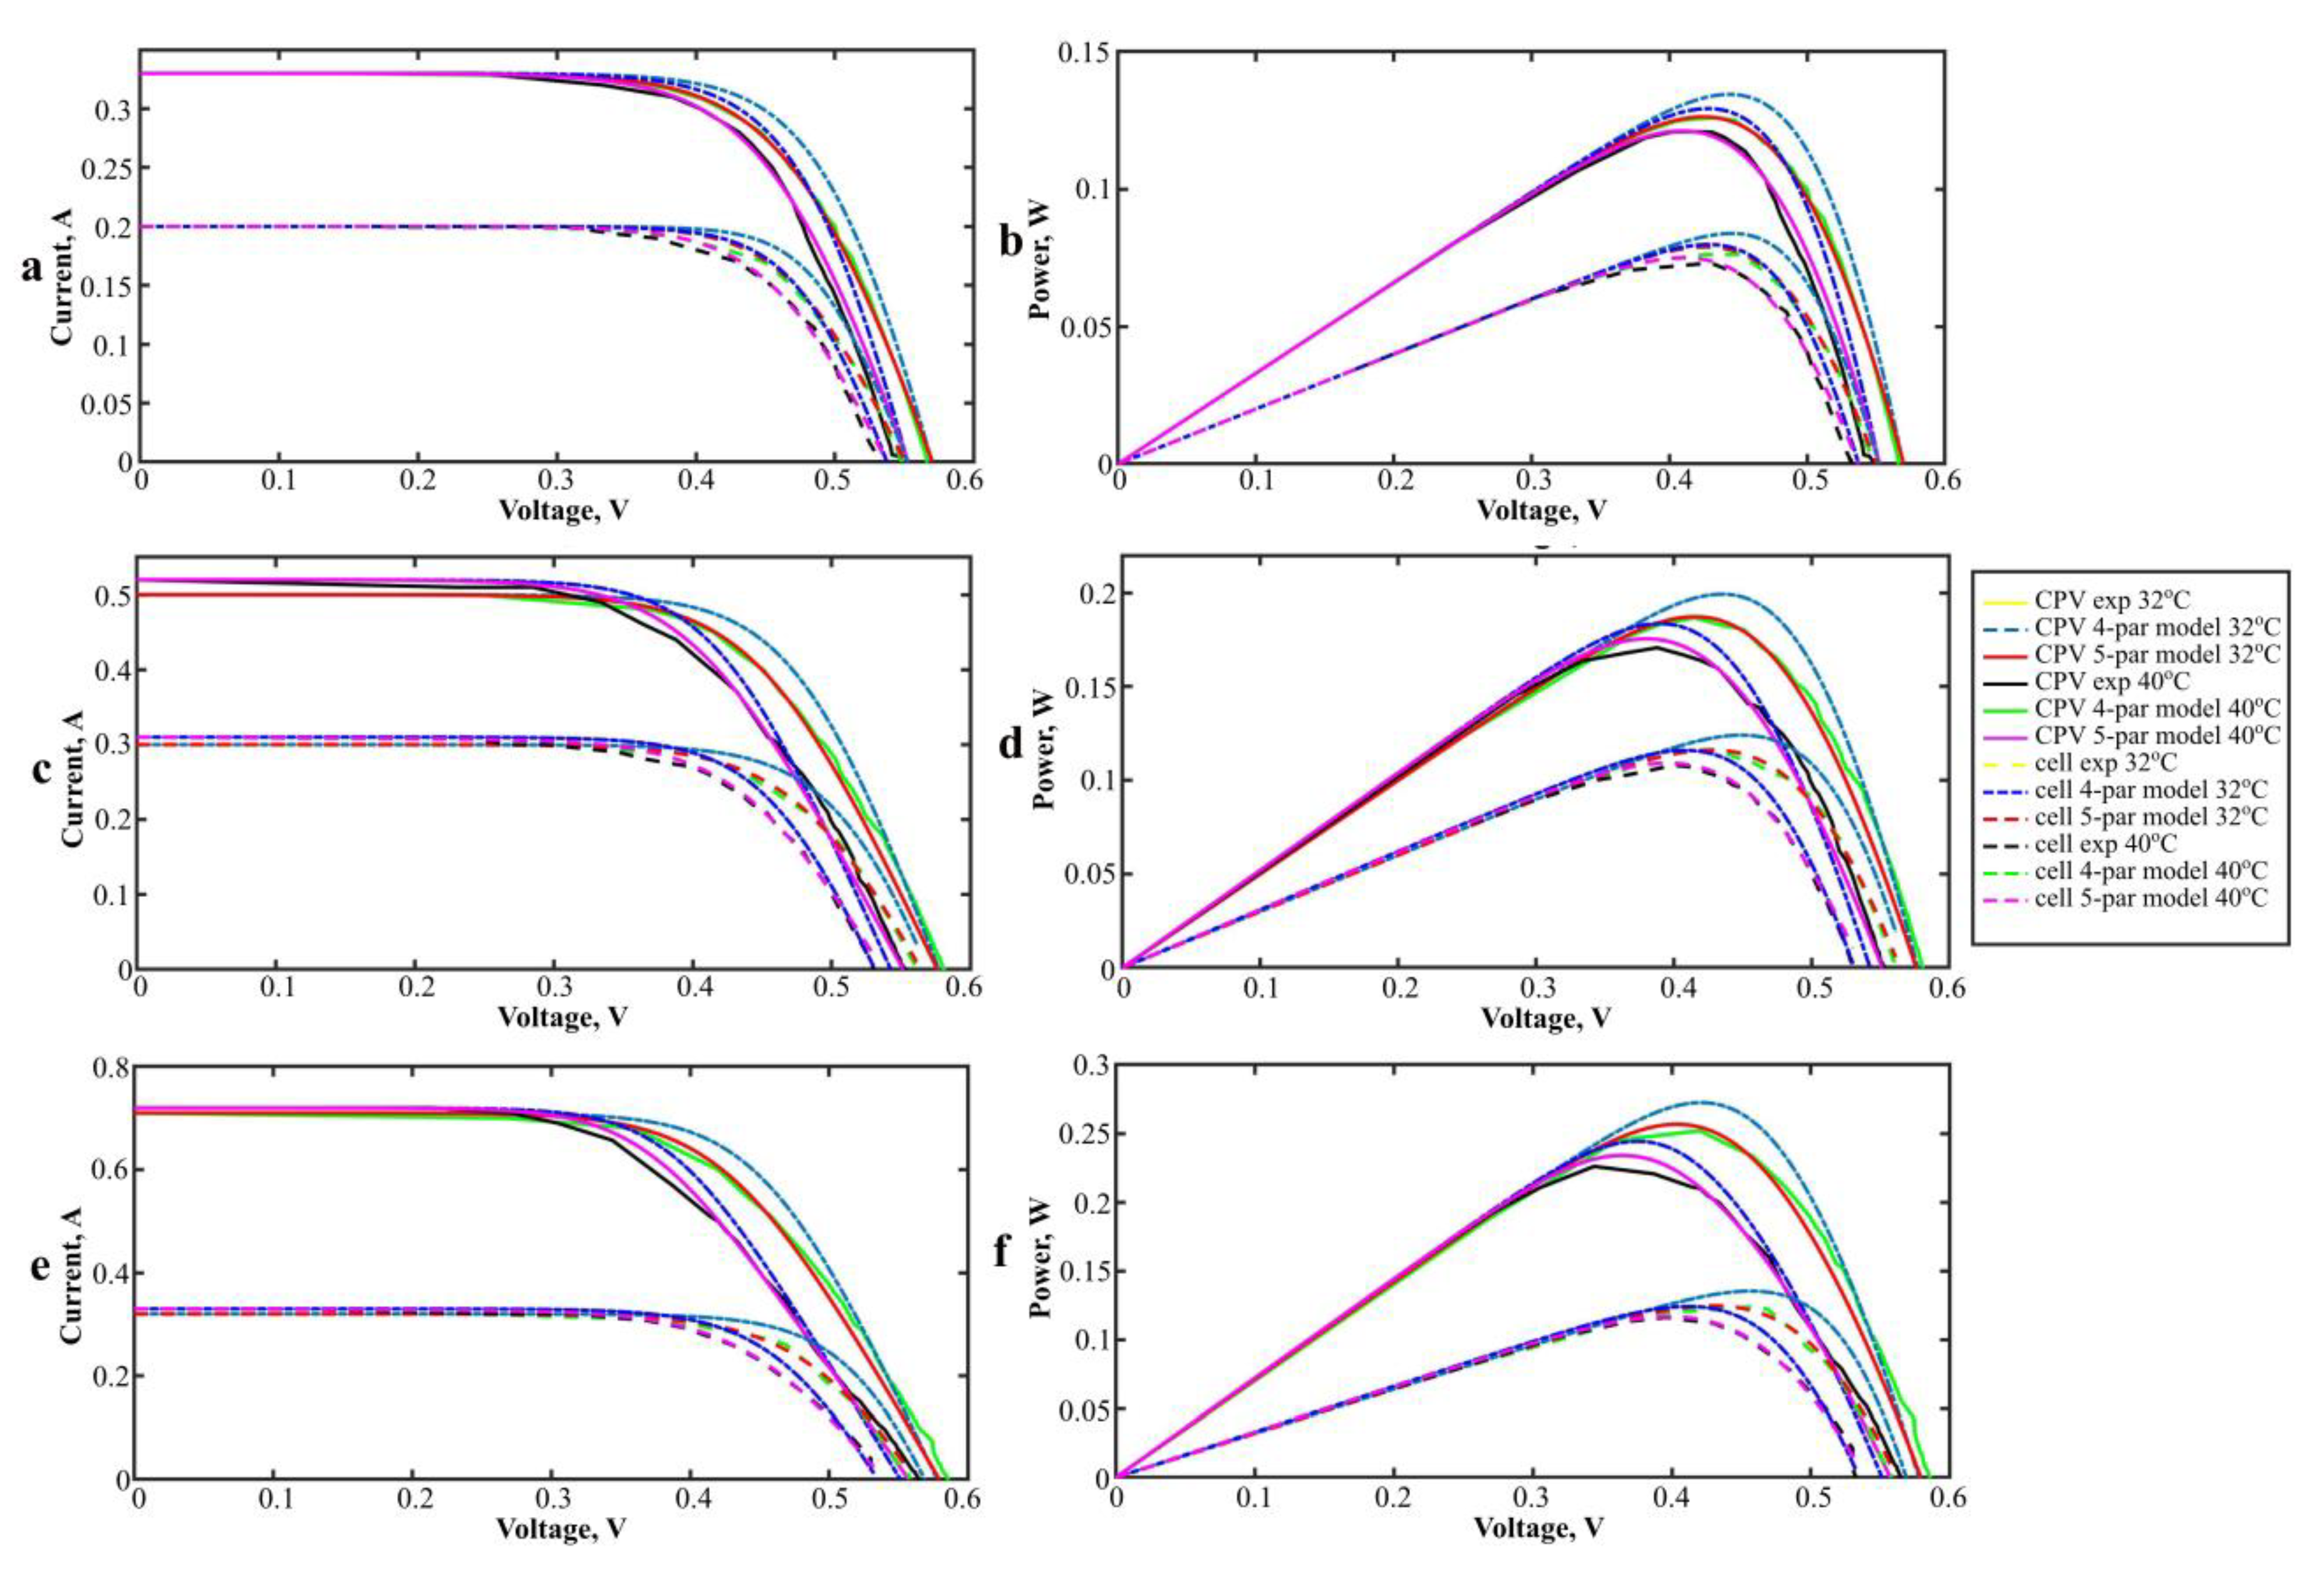
Figure 7 shows the experimental I–V characteristics and power graphs of the silicon cell and CPV cell at temperatures of 32 °C and 40 °C and at radiation powers of 200 W/m2, 300 W/m2, and 400 W/m2. In addition, the graphs obtained as a result of modeling the solar cell using a single-diode model based on the measured five and four parameters for the silicon cell and CPV cell are shown here. As we can see on the graphs, the five-parameter model has better predicting ability than the four-parameter model. Therefore, we will use the five-parameter one moving forward. Additionally, from the graphs, it can be seen that with an increase in the power of the incident radiation, the inverse dependence of the output power on temperature becomes more pronounced than for the silicon cell; therefore, the cooling system is the cornerstone for the CPV cell.
Thus, we plot the dependence of the CPV cell efficiency on the concentration ratio at different incident solar radiation (Figure 8a). As the concentration ratio increases, the efficiency of the solar cell decreases, and there is an increase in temperature and radiation power (Figure 8b).
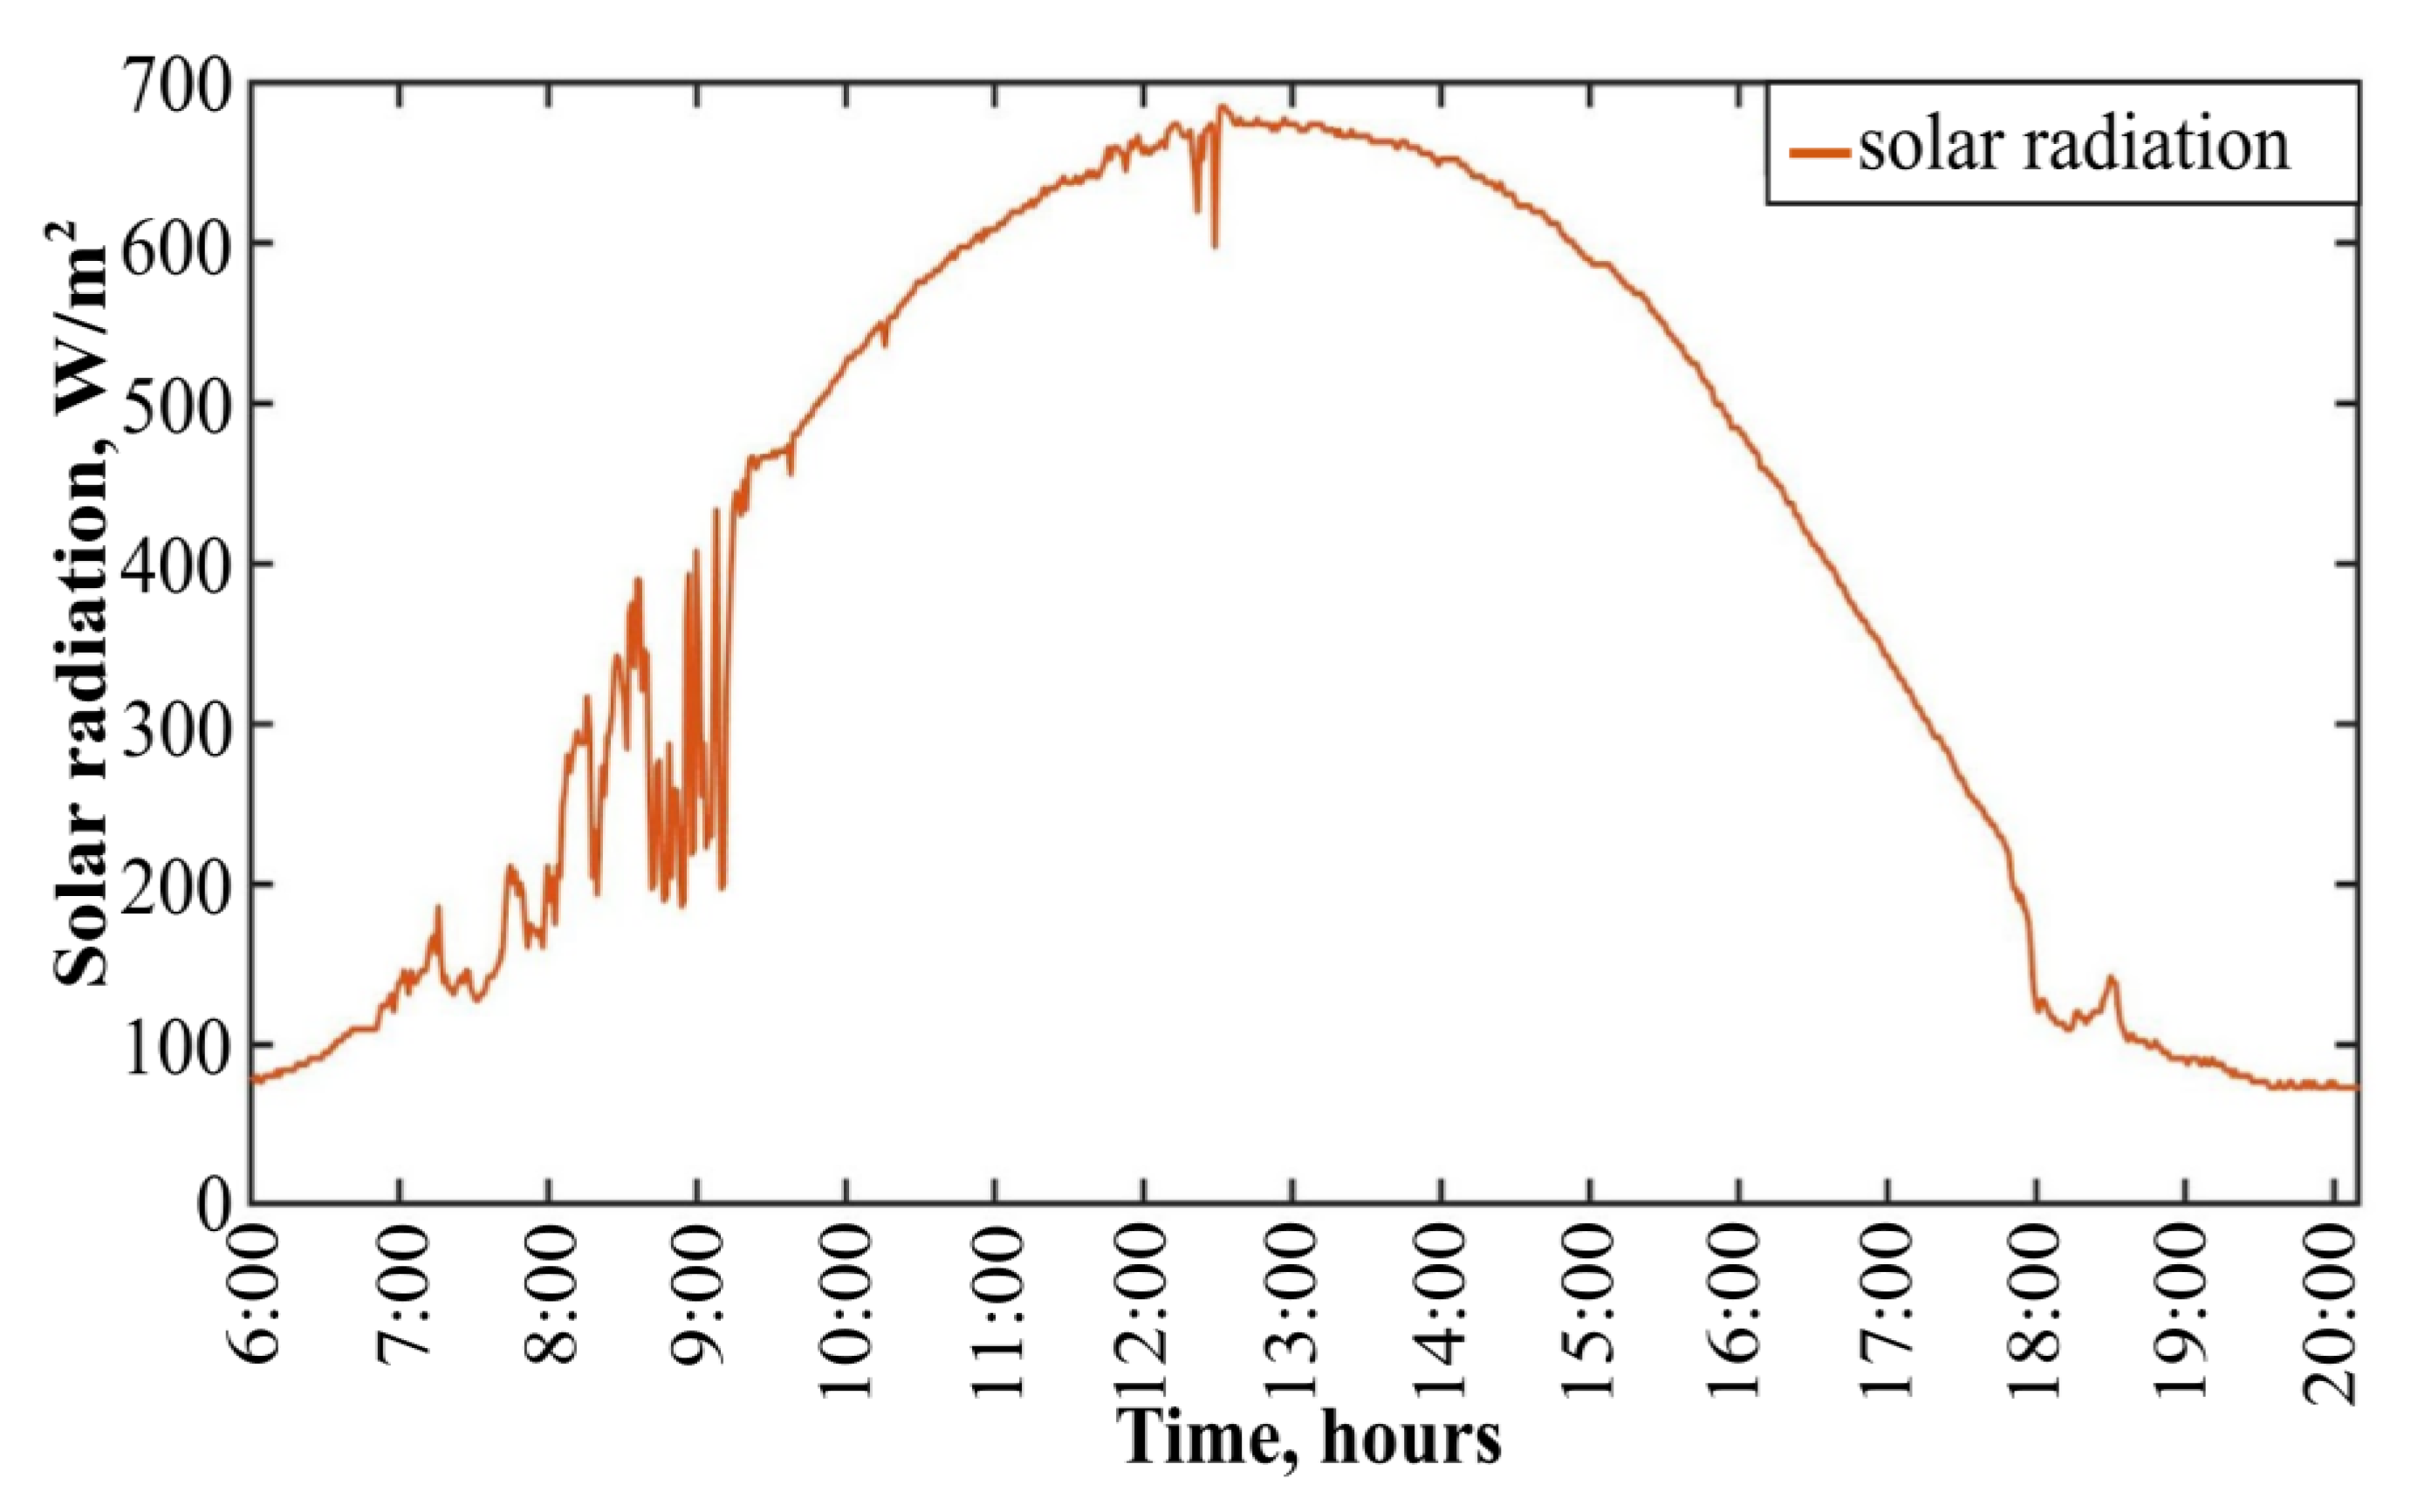
Using the obtained parameters of the solar cell at different temperatures and solar radiations, we will make an approximation for these parameters for real power levels on a clear sunny day on 23 August 2021 in Almaty, Kazakhstan. Figure 9 shows experimentally measured values of solar radiation on the day of 23 August 2021 in Almaty, Kazakhstan.
The results of the approximation for the solar cell parameters and LCPV are shown in Figure 10 for temperatures of 32° and 40° depending on the power of the incident solar radiation. Approximations are based on the dataset shown in Figure 6 and the polynomial regression method using the fourth degree polynomial. This approximation aims to expand values received from experiments, determine the parameters of the solar cell, and show changing of these parameters when using a Fresnel lens when exposed to solar radiation with the power shown in Figure 9 at fixed temperatures.

5. Silicon LCPV Cooling System

The previous chapter shows the results of modeling the parameters of a solar cell depending on the temperature and the power of the incident radiation. An increase in the temperature of the solar cell when using a concentrating lens leads to a decrease in efficiency, as shown in the previous chapter. As a result, it is necessary to use a cooling system. The cooling system in this work is, as shown in Figure 11, a wireless network. The nodes are connected to a network based on the Long-Range Wide-Area Network (LoRa WAN) protocol. The sensor unit consists of four thermocouples that measure the temperature of the solar cell, the temperature of the water in the hot water tank, the temperature of the water in the cold water tank, and the ambient temperature, as well as the water flow sensor. This unit sends data to turn on and off the water pump with a certain preset power and sends data to the dispatcher device. The control is carried out using threshold temperature levels, to which the water pump reacts. The power of the pump can be set manually or automatically changed depending on the power of the incident solar radiation.
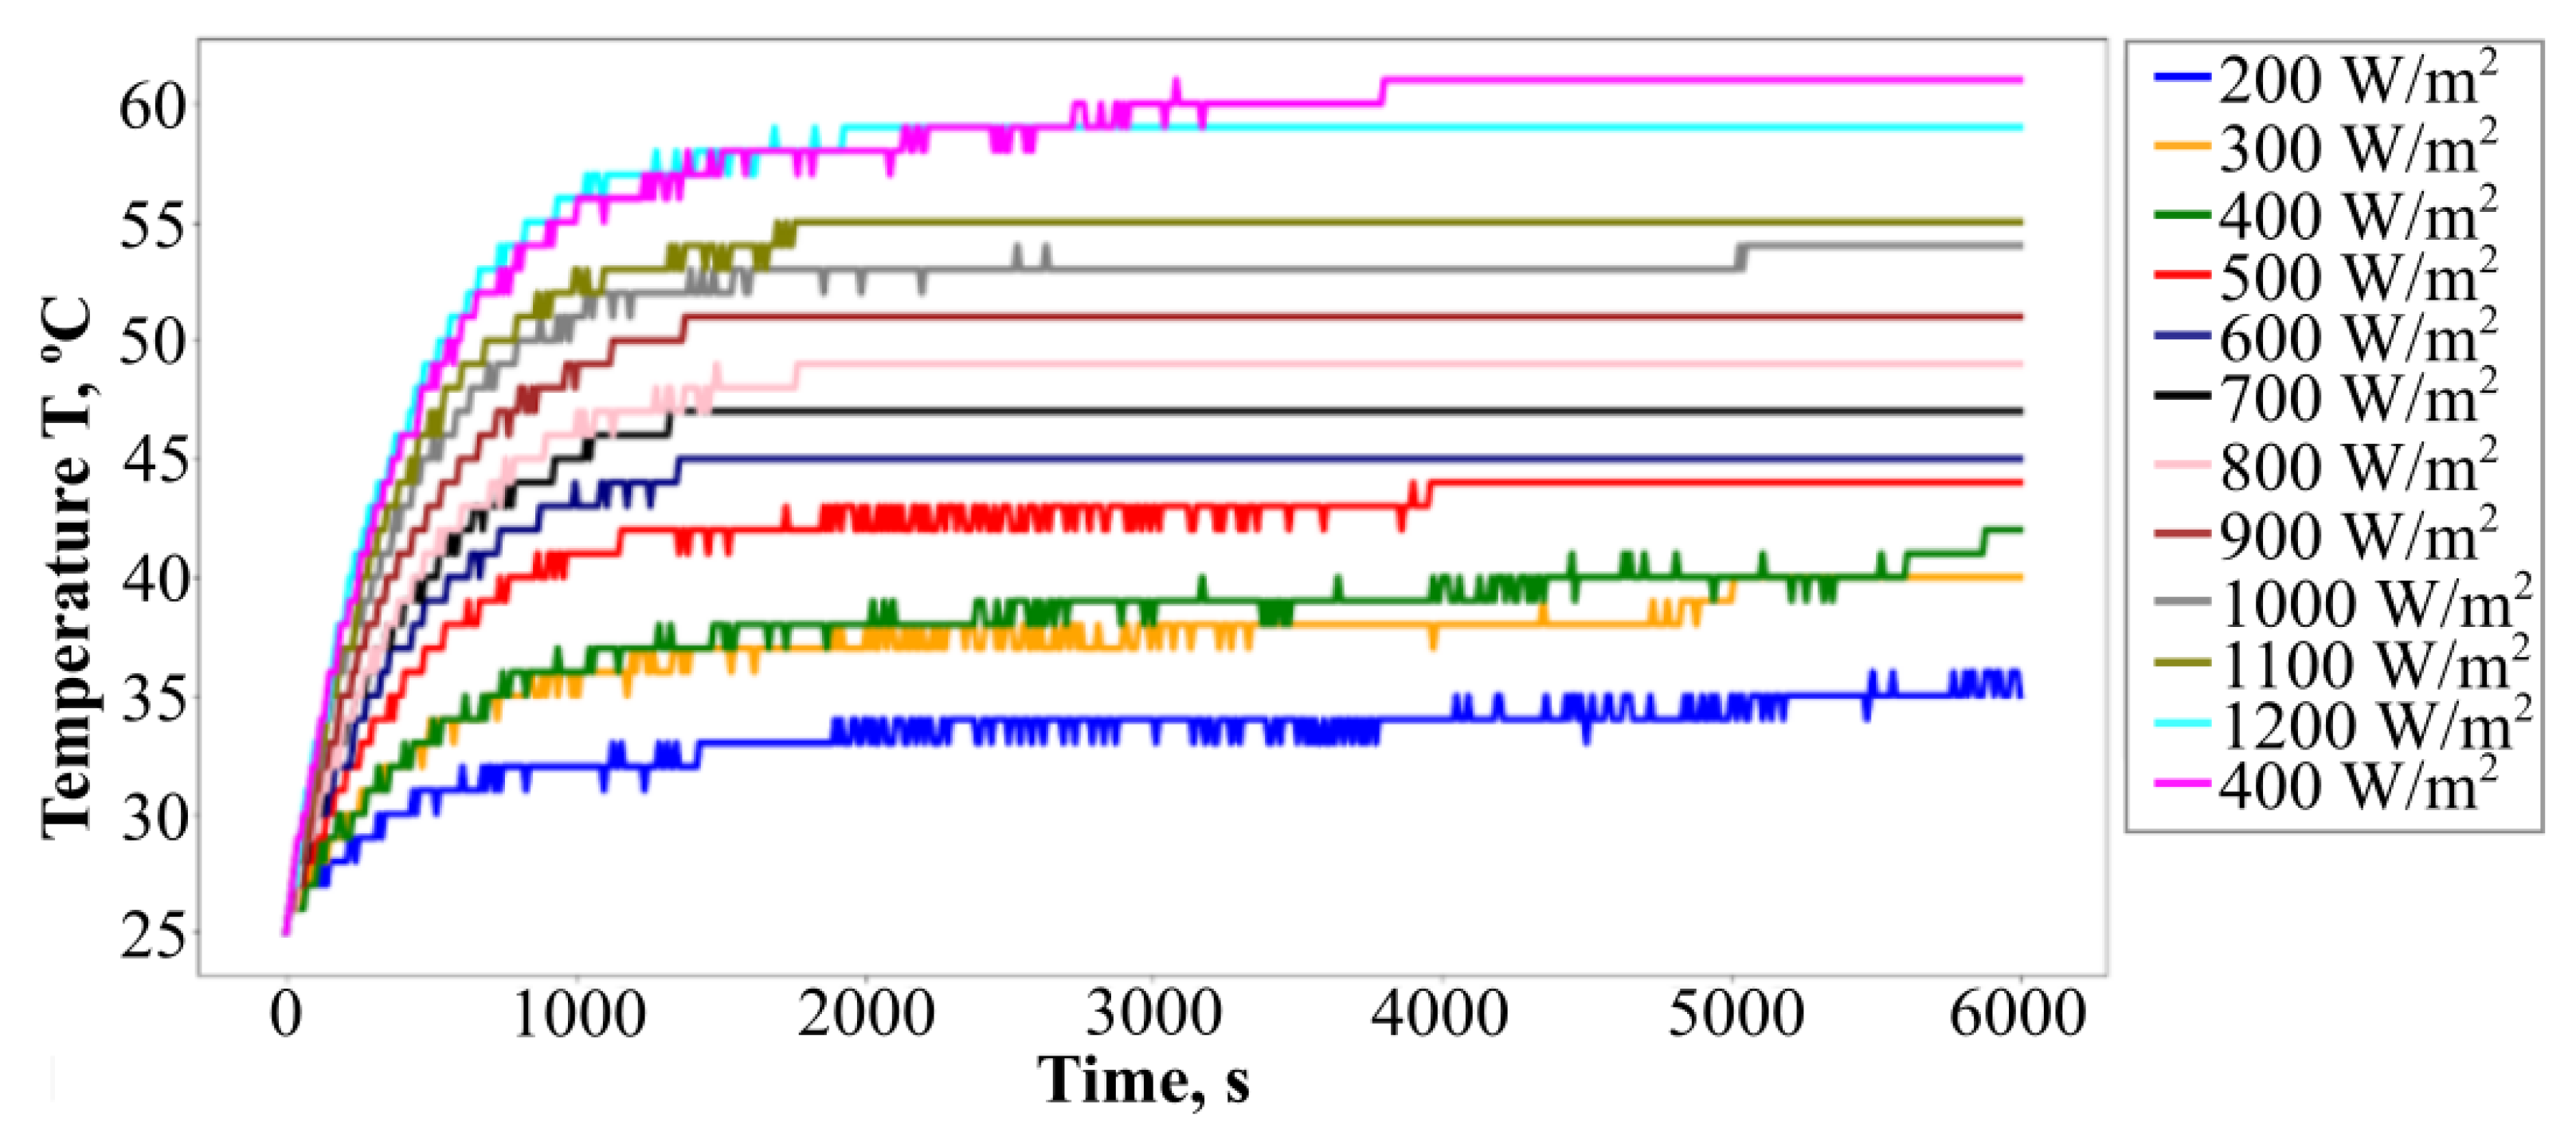
The cooling system was tested using a solar radiation simulator with adjustable power. The power of artificial solar radiation was measured using a BGT-TBQ pyranometer. In order to simulate the temperature of a solar cell depending on the incident solar radiation using machine learning, experiments were conducted to study the dynamics of heating the element at different values of the power of incident radiation from incandescent lamps. The results of the experiments are shown in Figure 12.
It can be seen from the graph that with an increase in the power of incident radiation, the maximum heating temperature of the solar cell increases, and the graph has a saturation character. The dependence of the maximum heating temperature of the solar cell on the incident radiation power is linear, as shown in Figure 13. Cooling is carried out using water supplied by a pump with adjustable power in the range from 1.8 W to 4.7 W and a voltage of 12 V. Figure 14 shows the cooling time of the solar cell depending on the incident radiation power from the maximum heating temperature to 25 °C. The pump operating mode at 1.8 W has lowest power consumption and situated above other lines due to long cooling time.

6. Results of Modeling Energy Generation and Temperature of Silicon LCPV Cell and Discussion

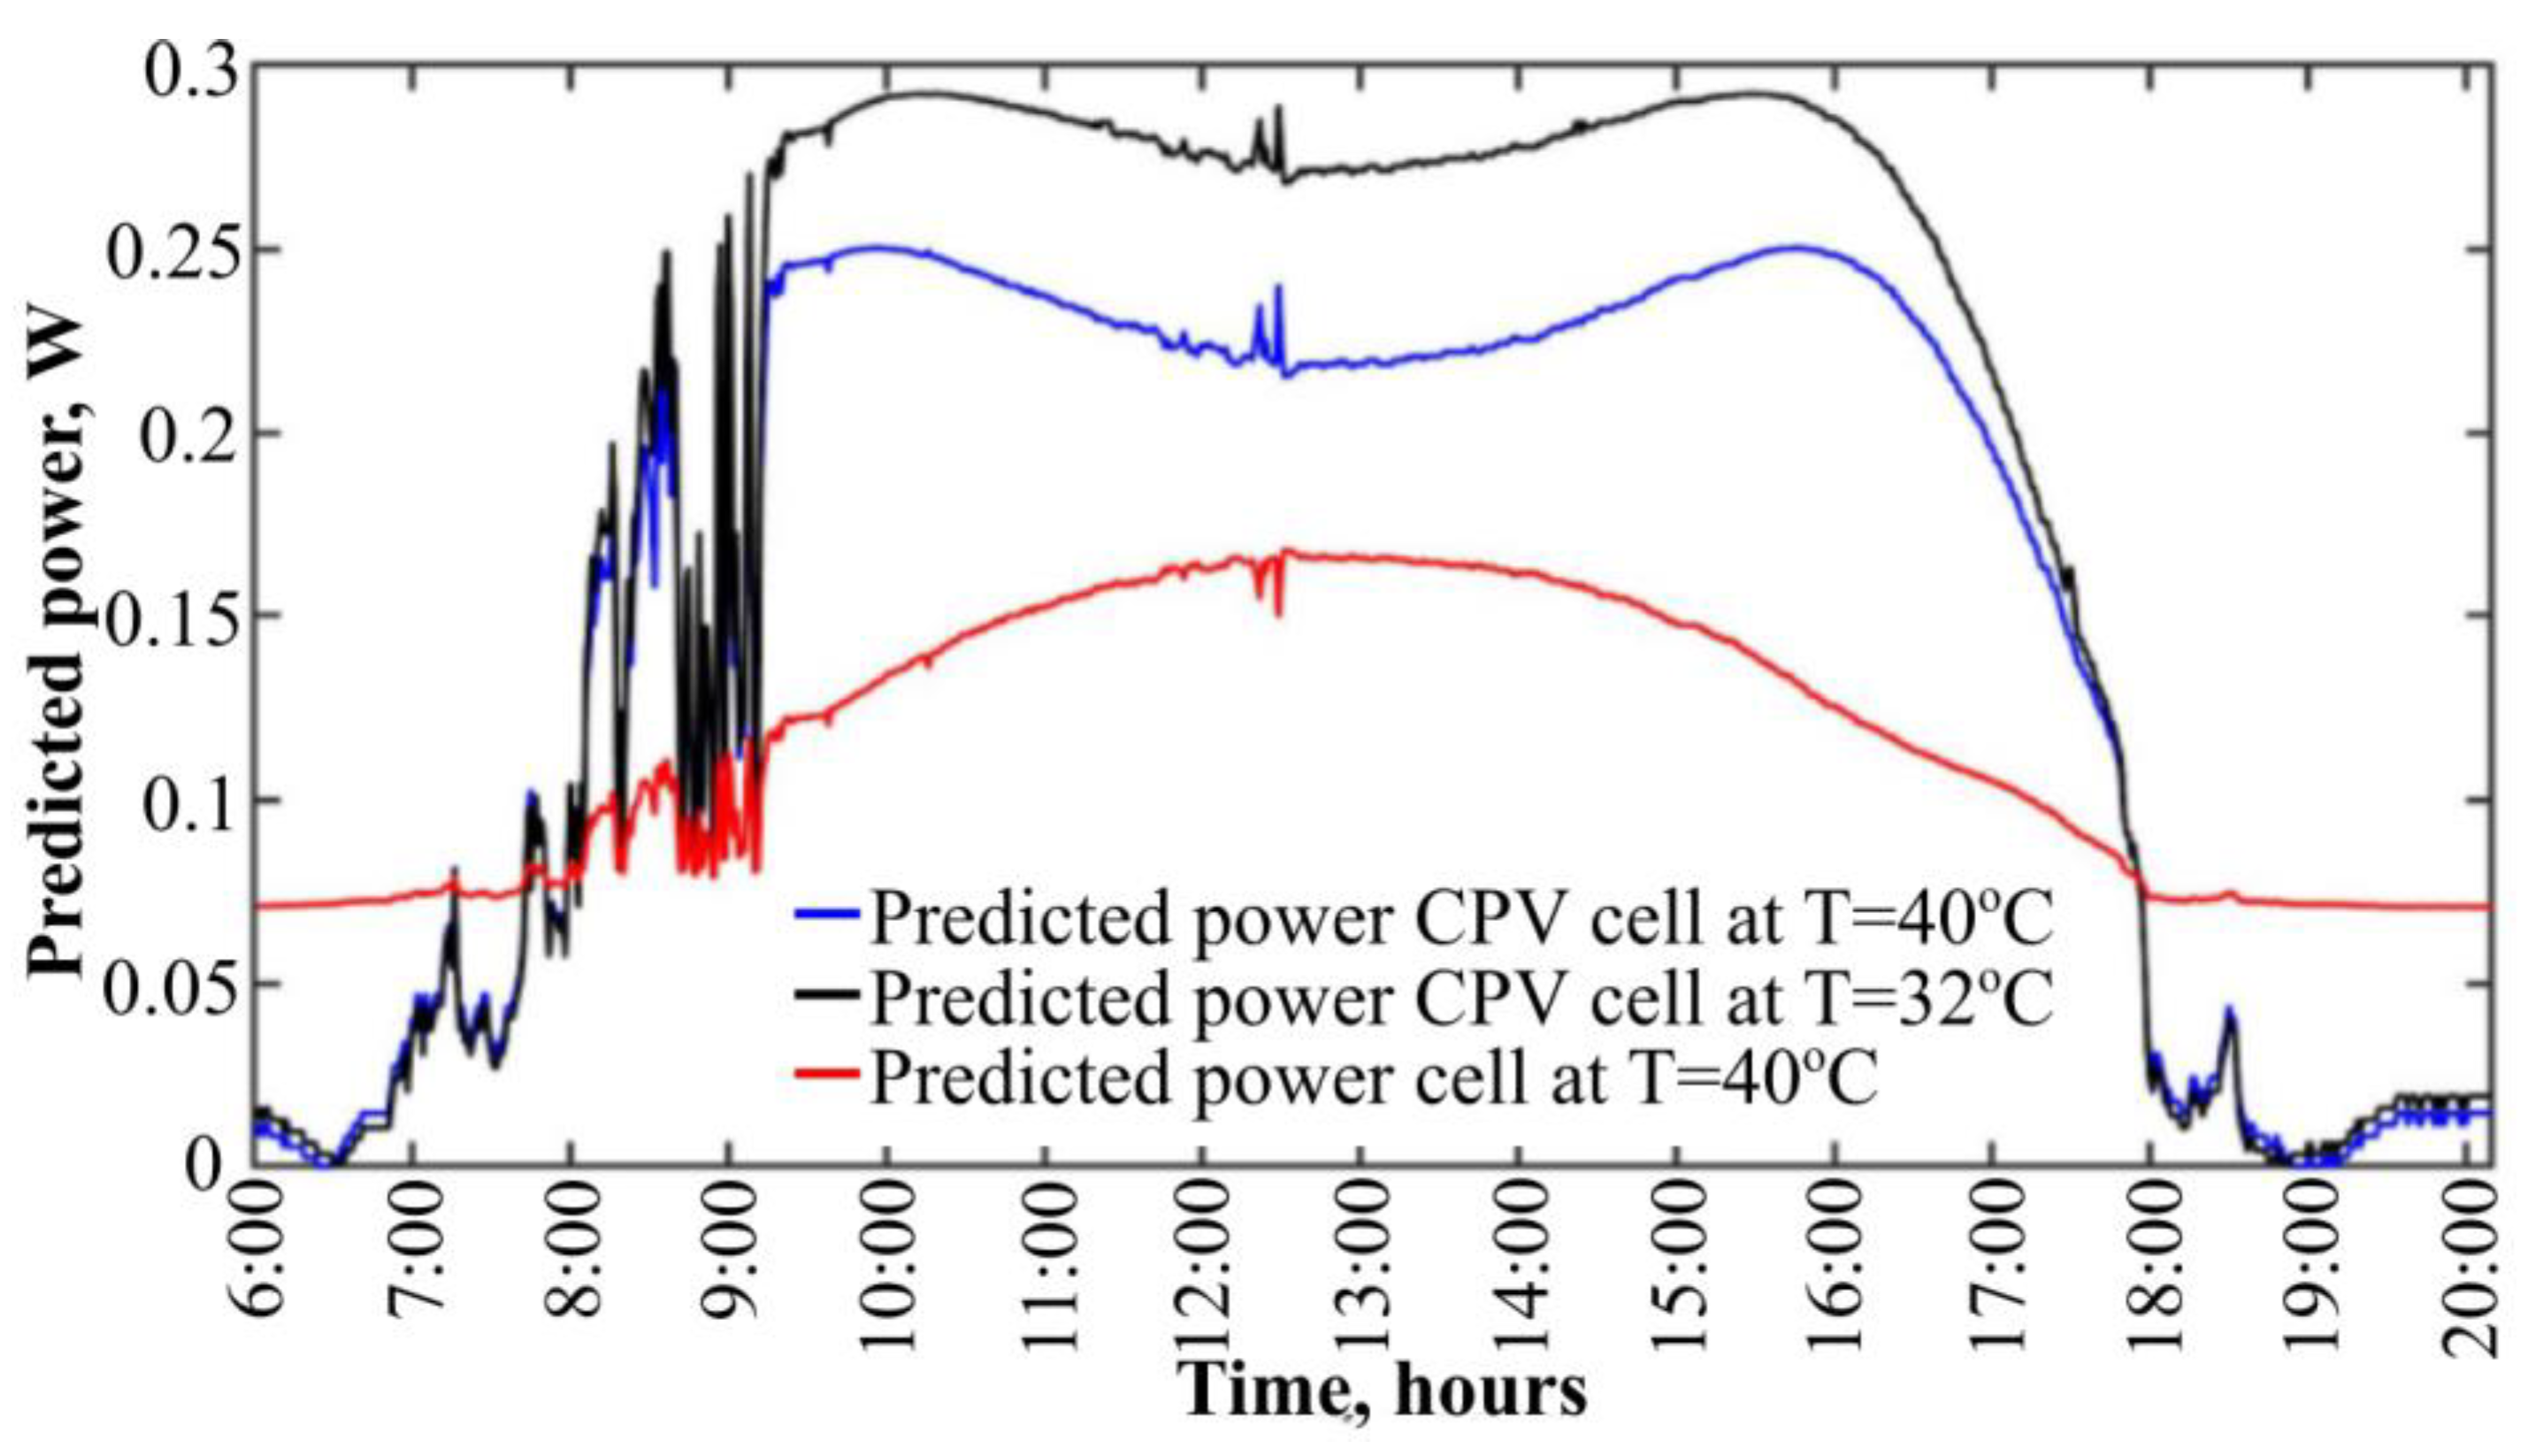
The simulation of energy generation and temperature of a silicon LCPV solar cell is based on the five-parameter model shown in Section 2. The simulation results are shown in Figure 15.
As shown in Figure 15, an increase in the concentration ratio and power of radiation leads to a decrease in the output power of the solar cell. Obviously, during peak hours, an increase in the power of solar radiation and, accordingly, the concentration ratio, leads to a decrease in the efficiency and the output power of the solar cell. Although the efficiency of a solar cell drops when using a Fresnel lens, the amount of energy generated increases. For comparison, at a constant temperature T = 40 °C, the silicon cell energy was 1.7747 Wh, and the CPV cell is 27% higher and is equal to 2.254 Wh.
Modeling solar cell heating processes is performed using machine learning methods. Using the heating temperature data as a function of time and incident radiation power shown in Figure 12, the model was trained using the Random Forest regression method with five trees. Evaluation metrics of the model are shown in Table 1. It can be seen that mean absolute error (MAE) is 0.125, and mean square error and root mean square error (MSE, RMSE) are 0.0879 and 0.2965, respectively. It can be seen from the table that the coefficient of determination R2 is close to one. These metrics show that model has good prediction accuracy.
The resulting model was used to simulate the dynamics of heating of a solar cell at the experimental values of incident radiation shown in Figure 9. Figure 16 shows the results of modeling the dynamics of heating of a solar cell at an incident radiation power of 200 W/m2.
Figure 17 shows a solar cell’s temperature simulation using a cooling system that turns on if the temperature of the element exceeds 40 °C for the first 30 min of work. Similar graphs can be built for another threshold temperature of 32 °C. Graph shows heating of a solar cell several times and after each temperature drops heating time decreases because of rising solar radiation power.
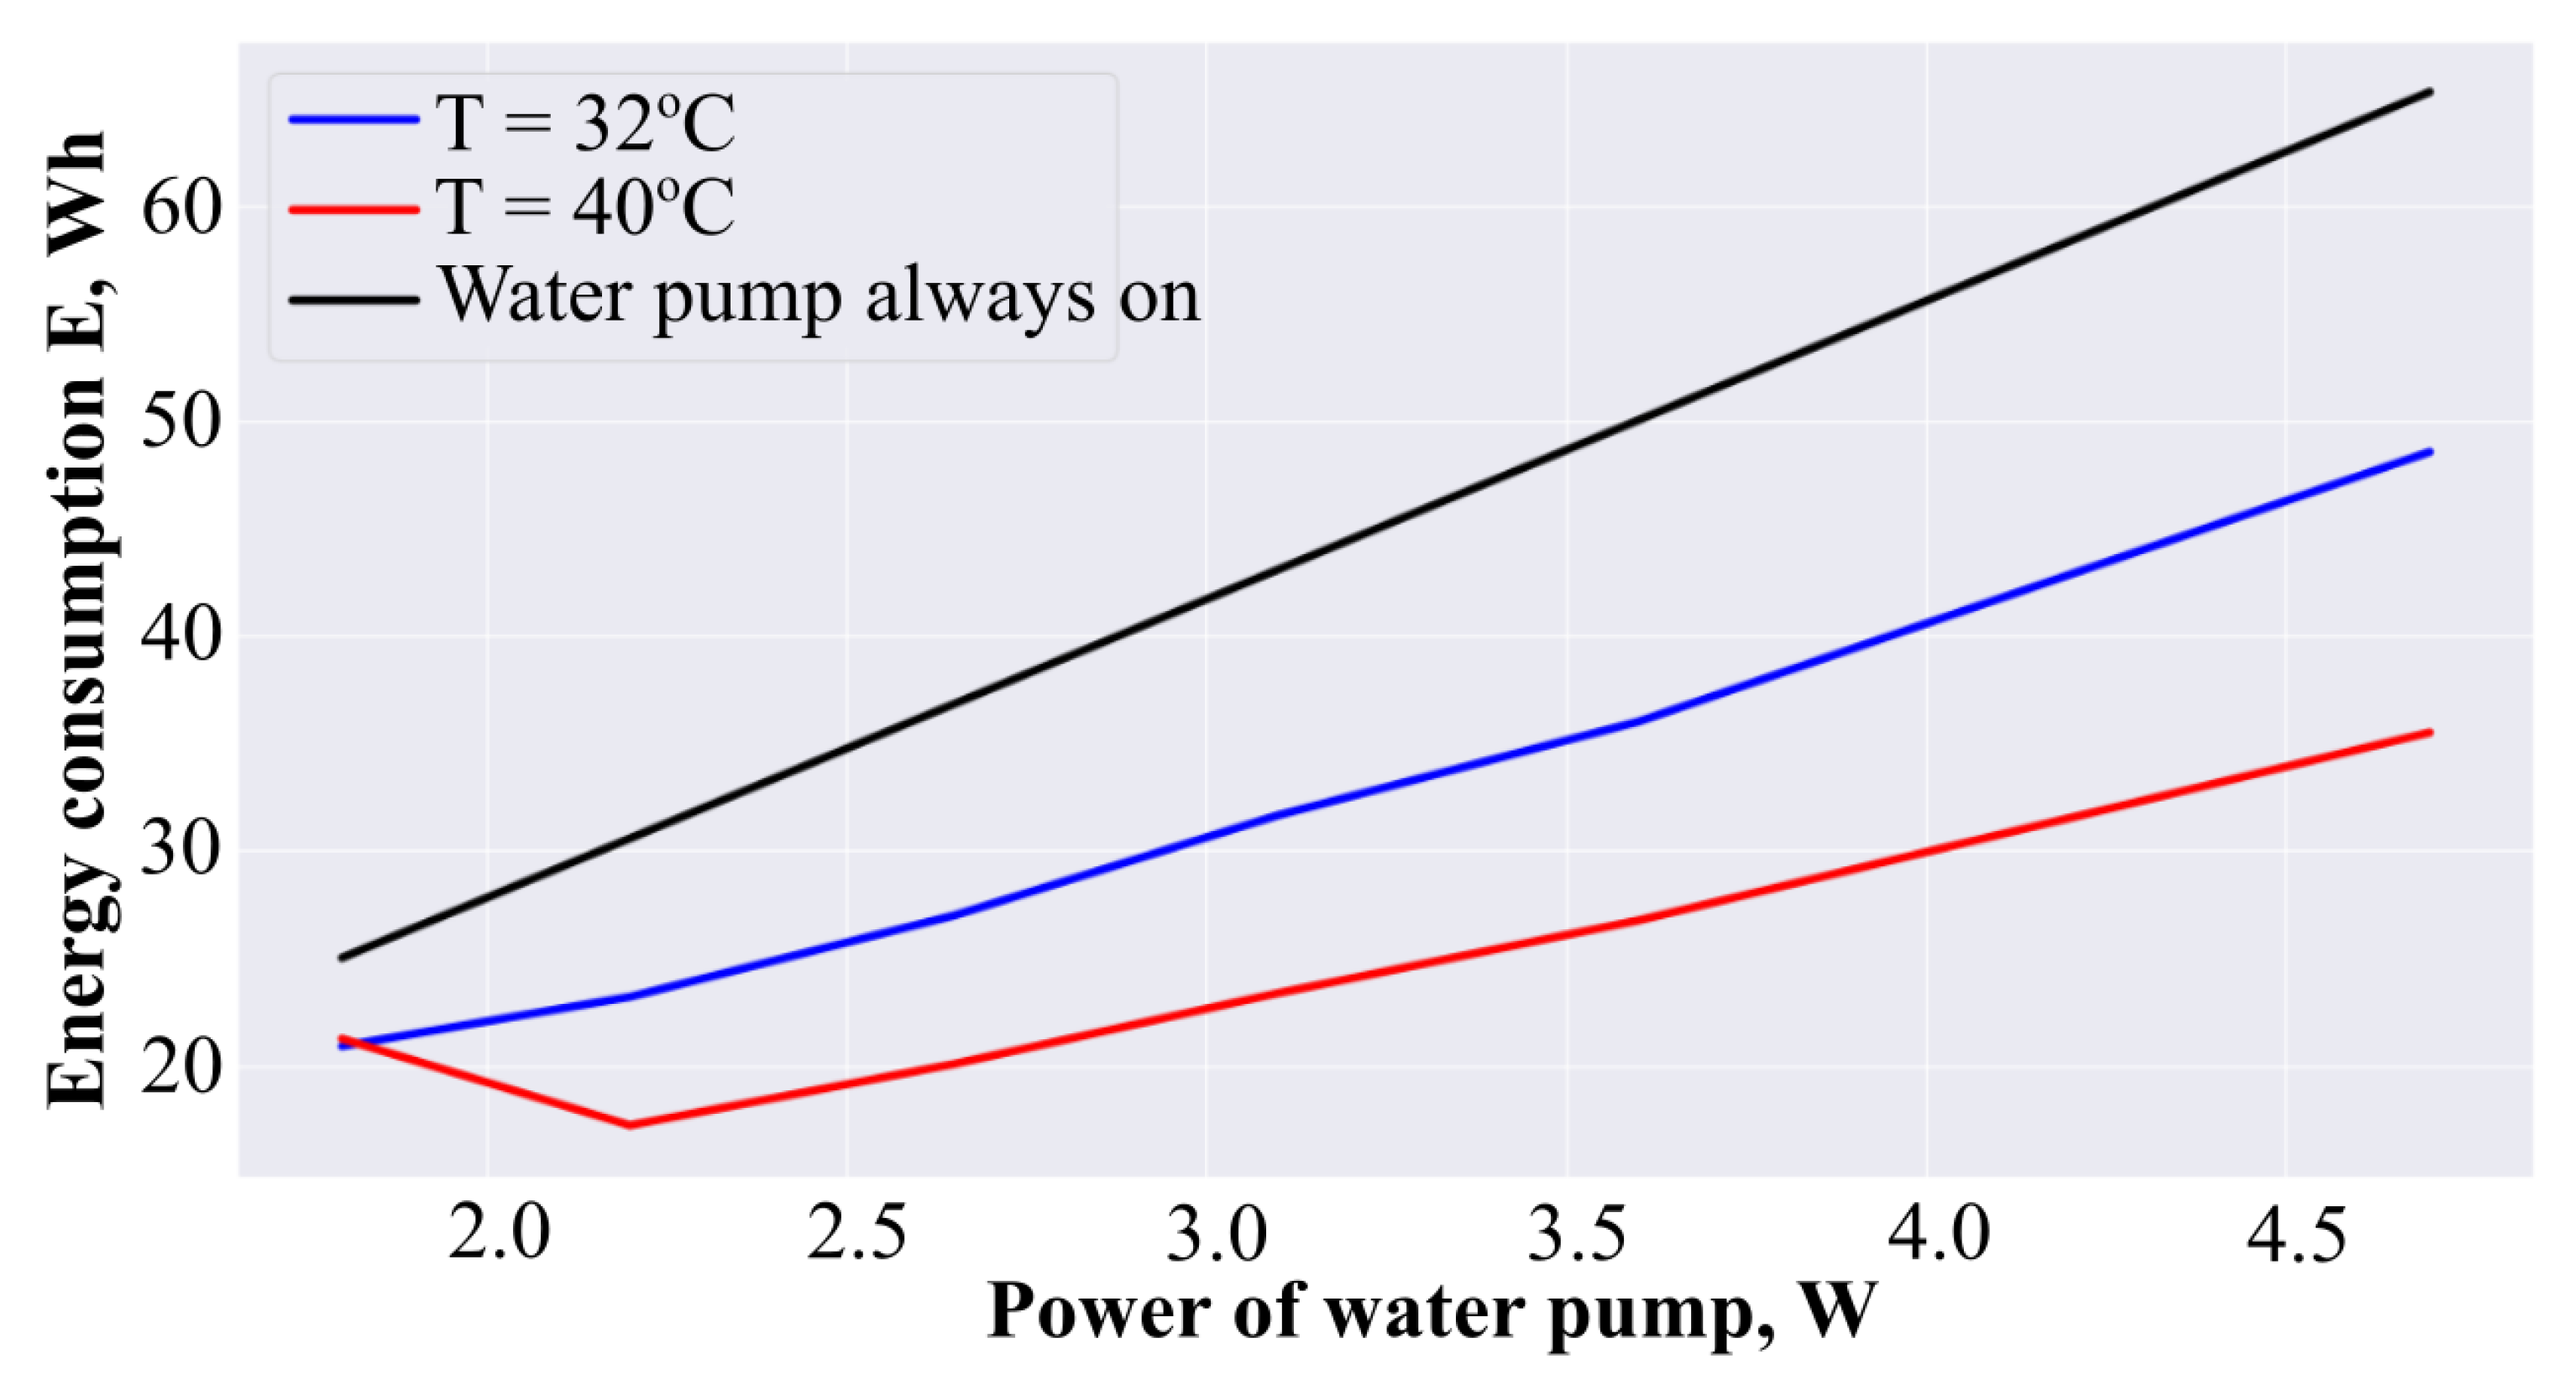
The power consumption of the water pump will be determined in three operating modes: in the temperature threshold mode of 32 °C, 40 °C, and in the continuous cooling mode. The simulation results are shown in Figure 18. As seen from the figure, if the cooling system runs constantly, then the energy consumption will be maximum. If the permissible heating temperature of the solar cell is limited to 40 °C, then the consumption of the cooling system will be minimal. At the same time, this curve has a break that corresponds to the most optimal operating mode of the pump with a consumption of 2.2 W.
As a result, a silicon LCPV cell model was obtained using a Fresnel lens with a water cooling system. A five-parameter mathematical model for the lens case was used to model the solar cell. Due to the increase in the degree of concentration of solar radiation, a water cooling system was used. For realistic solar cell simulation, a solar cell heating model was built based on experiments using machine learning methods. To simulate the temperature regimes of LCPV, experiments were carried out on heating a solar cell and cooling it with a water pump when the cell was illuminated with radiation of various powers. The results of the experiments were used to simulate the temperature and energy generation of the LCPV cell for real solar power data during the day. Results of modeling of the cooling system show that cooling from 40 °C to 25 °C is more efficient than cooling from 32 °C. In other words, the greater the difference between the temperature threshold and the minimum, the less energy the cooling system consumes. Furthermore, there is the most optimal operation mode of the water pump, in which energy consumption will be minimal.
The results of the work can be used to create hybrid LCPV batteries based on the most common polycrystalline silicon solar cells and Fresnel lenses to generate electrical and thermal energy.

7. Conclusions

In this paper, the model of a silicon LCPV cell with a cooling system was developed using a five-parameter model. In order to develop a mathematical model of the CPV cell, silicon cell and CPV cell parameters were studied using a Fresnel lens at various temperatures and incident radiation for LCPV systems. By approximating the silicon cell and CPV cell parameters, their power outputs were simulated using real solar power values on a clear day on 23 August 2021, in Almaty, Kazakhstan, at a constant temperature. The simulation results show a 27% increase in generated energy when using the CPV cell. The heating of a solar cell was modeled using machine learning. Experimental results of the developed cooling system based on wireless communication were used to model temperature patterns using the cooling system under real solar radiation. The proposed model can be used only for commercial polycrystalline silicon solar cells under low concentration. It was shown that the greater the difference between threshold temperature and minimum temperature of the cooling system, the lower the consumption of the water pump. Additionally, the modeling of the cooling system showed optimum water pump power consumption for our experimental model. The proposed LCPV system can be used as a hybrid system for heating water and, at the same time, generate electrical energy without affecting the existing production process for the manufacture of polycrystalline silicon solar cells.

Author Contributions

Conceptualization, Y.S. and S.M. (Sergey Manakov); methodology, M.N., A.S. and I.Y.; software, M.N.; formal analysis, A.K. and S.O.; investigation, N.K. (Nurzhigit Kuttybay), N.K. (Nursultan Koshkarbay) and B.Z.; writing—original draft preparation, G.D.; writing—review and editing, S.M. (Saad Mekhilef) and A.S. All authors have read and agreed to the published version of the manuscript.

Funding

This work has been supported financially by the research project AP05132464 of the Ministry of Education and Science of the Republic of Kazakhstan.

Institutional Review Board Statement

Not applicable.

Informed Consent Statement

Not applicable.

Data Availability Statement

Not applicable.

Conflicts of Interest

The authors declare no conflict of interest.

References

  1. Singh, R.; Kumar, S.; Gehlot, A.; Pachauri, R. An imperative role of sun trackers in photovoltaic technology: A review. Renew. Sustain. Energy Rev. 2018, 82, 3263–3278. [Google Scholar] [CrossRef]
  2. Kuttybay, N.; Saymbetov, A.; Mekhilef, S.; Nurgaliyev, M.; Tukymbekov, D.; Dosymbetova, G.; Svanbayev, Y. Optimized single-axis schedule solar tracker in different weather conditions. Energies 2020, 13, 5226. [Google Scholar] [CrossRef]
  3. Saymbetov, A.; Mekhilef, S.; Kuttybay, N.; Nurgaliyev, M.; Tukymbekov, D.; Meiirkhanov, A.; Svanbayev, Y. Dual-axis schedule tracker with an adaptive algorithm for a strong scattering of sunbeam. Sol. Energy 2021, 224, 285–297. [Google Scholar] [CrossRef]
  4. Sarvi, M.; Azadian, A. A comprehensive review and classified comparison of mppt algorithms in pv systems. Energy Syst. 2022, 13, 281–320. [Google Scholar] [CrossRef]
  5. Cristobal, A.; Vega, A.M.; López, A.L. (Eds.) Next Generation of Photovoltaics: New Concepts; Springer: Berlin/Heidelberg, Germany, 2012; Volume 165. [Google Scholar]
  6. Shanks, K.; Baig, H.; Singh, N.P.; Senthilarasu, S.; Reddy, K.S.; Mallick, T.K. Prototype fabrication and experimental investigation of a conjugate refractive reflective homogeniser in a cassegrain concentrator. Sol. Energy 2017, 142, 97–108. [Google Scholar] [CrossRef]
  7. Vossier, A.; Chemisana, D.; Flamant, G.; Dollet, A. Very high fluxes for concentrating photovoltaics: Considerations from simple experiments and modeling. Renew. Energy 2012, 38, 31–39. [Google Scholar] [CrossRef]
  8. Khamooshi, M.; Salati, H.; Egelioglu, F.; Hooshyar Faghiri, A.; Tarabishi, J.; Babadi, S. A review of solar photovoltaic concentrators. Int. J. Photoenergy 2014, 2014, 958521. [Google Scholar] [CrossRef]
  9. Wu, Y.; Eames, P.; Mallick, T.; Sabry, M. Experimental characterisation of a Fresnel lens photovoltaic concentrating system. Sol. Energy 2012, 86, 430–440. [Google Scholar] [CrossRef] [Green Version]
  10. Kumar, V.; Shrivastava, R.L.; Untawale, S.P. Fresnel lens: A promising alternative of reflectors in concentrated solar power. Renew. Sustain. Energy Rev. 2015, 44, 376–390. [Google Scholar] [CrossRef]
  11. Shanks, K.; Senthilarasu, S.; Mallick, T.K. Optics for concentrating photovoltaics: Trends, limits and opportunities for materials and design. Renew. Sustain. Energy Rev. 2016, 60, 394–407. [Google Scholar] [CrossRef]
  12. Jing, L.; Liu, H.; Wang, Y.; Xu, W.; Zhang, H.; Lu, Z. Design and optimization of Fresnel lens for high concentration photovoltaic system. Int. J. Photoenergy 2014, 2014, 539891. [Google Scholar] [CrossRef] [Green Version]
  13. Renno, C.; Petito, F.; Landi, G.; Neitzert, H.C. Experimental characterization of a concentrating photovoltaic system varying the light concentration. Energy Convers. Manag. 2017, 138, 119–130. [Google Scholar] [CrossRef]
  14. Shanks, K.; Ferrer-Rodriguez, J.P.; Fernández, E.F.; Almonacid, F.; Pérez-Higueras, P.; Senthilarasu, S.; Mallick, T. A> 3000 suns high concentrator photovoltaic design based on multiple Fresnel lens primaries focusing to one central solar cell. Sol. Energy 2018, 169, 457–467. [Google Scholar] [CrossRef]
  15. Chemisana, D. Building integrated concentrating photovoltaics: A review. Renew. Sustain. Energy Rev. 2011, 15, 603–611. [Google Scholar] [CrossRef]
  16. Xu, N.; Ji, J.; Sun, W.; Huang, W.; Li, J.; Jin, Z. Numerical simulation and experimental validation of a high concentration photovoltaic/thermal module based on point-focus Fresnel lens. Appl. Energy 2016, 168, 269–281. [Google Scholar] [CrossRef]
  17. Ghassan, Z.; Bernal-Agustín, J.L.; Fracastoro, G.V. High concentration photovoltaic systems applying III–V cells. Renew. Sustain. Energy Rev. 2009, 13, 2645–2652. [Google Scholar]
  18. Miller, N.; Patel, P.; Struempel, C.; Kerestes, C.; Aiken, D.; Sharps, P. Terrestrial concentrator four-junction inverted metamorphic solar cells with efficiency> 45%. In Proceedings of the 2014 IEEE 40th Photovoltaic Specialist Conference (PVSC), IEEE, Denver, CO, USA, 8–13 June 2014. [Google Scholar]
  19. Hornung, T.; Steiner, M.; Nitz, P. Estimation of the influence of Fresnel lens temperature on energy generation of a concentrator photovoltaic system. Sol. Energy Mater. Sol. Cells 2012, 99, 333–338. [Google Scholar] [CrossRef]
  20. Guter, W.; Schöne, J.; Philipps, S.P.; Steiner, M.; Siefer, G.; Wekkeli, A.; Welser, E.; Oliva, E.; Bett, A.W.; Dimroth, F. Current-matched triple-junction solar cell reaching 41.1% conversion efficiency under concentrated sunlight. Appl. Phys. Lett. 2009, 94, 223504. [Google Scholar] [CrossRef]
  21. Li, D.; Xuan, Y.; Yin, E.; Li, Q. Conversion efficiency gain for concentrated triple-junction solar cell system through thermal management. Renew. Energy 2018, 126, 960–968. [Google Scholar] [CrossRef]
  22. Karimi, F.; Xu, H.; Wang, Z.; Chen, J.; Yang, M. Experimental study of a concentrated PV/T system using linear Fresnel lens. Energy 2017, 123, 402–412. [Google Scholar] [CrossRef]
  23. Du, B.; Hu, E.; Kolhe, M. Performance analysis of water cooled concentrated photovoltaic (CPV) system. Renew. Sustain. Energy Rev. 2012, 16, 6732–6736. [Google Scholar] [CrossRef]
  24. Chemisana, D.; Ibáñez, M.; Rosell, J.I. Characterization of a photovoltaic-thermal module for Fresnel linear concentrator. Energy Convers. Manag. 2011, 52, 3234–3240. [Google Scholar] [CrossRef]
  25. Campbell, P.; Green, M.A. The limiting efficiency of silicon solar cells under concentrated sunlight. IEEE Trans. Electron Devices 1986, 33, 234–239. [Google Scholar] [CrossRef]
  26. Xing, Y.; Han, P.; Wang, S.; Liang, P.; Lou, S.; Zhang, Y.; Hu, S.; Zhu, H.; Zhao, C.; Mi, Y. A review of concentrator silicon solar cells. Renew. Sustain. Energy Rev. 2015, 51, 1697–1708. [Google Scholar] [CrossRef]
  27. Levi, D.H.; Green, M.A.; Hishikawa, Y.; Dunlop, E.D.; Hohl-Ebinger, J.; Ho-Baillie, A.W. Solar cell efficiency tables (version 51). Prog. Photovolt. 2017, 26, 1062–7995. [Google Scholar]
  28. Boumaaraf, H.; Talha, A.; Saidi, N.; Habireche, A. Experimental study of low-concentrator photovoltaic systems: Electrical and thermal. Electr. Eng. 2018, 100, 2569–2578. [Google Scholar] [CrossRef]
  29. Burhan, M.; Oh, S.J.; Chua, K.J.E.; Ng, K.C. Double lens collimator solar feedback sensor and master slave configuration: Development of compact and low cost two axis solar tracking system for CPV applications. Sol. Energy 2016, 137, 352–363. [Google Scholar] [CrossRef]
  30. Zsiborács, H.; Baranyai, N.H.; Vincze, A.; Weihs, P.; Schreier, S.F.; Gützer, C.; Pintér, G. The Impacts of Tracking System Inaccuracy on CPV Module Power. Processes 2020, 8, 1278. [Google Scholar] [CrossRef]
  31. Humada, A.M.; Hojabri, M.; Mekhilef, S.; Hamada, H.M. Solar cell parameters extraction based on single and double-diode models: A review. Renew. Sustain. Energy Rev. 2016, 56, 494–509. [Google Scholar] [CrossRef] [Green Version]
  32. Celik, A.N.; Acikgoz, N. Modelling and experimental verification of the operating current of mono-crystalline photovoltaic modules using four-and five-parameter models. Appl. Energy 2007, 84, 1–15. [Google Scholar] [CrossRef]
  33. Chan, D.S.H.; Phillips, J.R.; Phang, J.C.H. A comparative study of extraction methods for solar cell model parameters. Solid-State Electron. 1986, 29, 329–337. [Google Scholar] [CrossRef]
  34. Xiao, W.; Dunford, W.G.; Capel, A. A novel modeling method for photovoltaic cells. In Proceedings of the 2004 IEEE 35th Annual Power Electronics Specialists Conference (IEEE Cat. No. 04CH37551), IEEE, Aachen, Germany, 20–25 June 2004; Volume 3. [Google Scholar]
  35. Ma, T.; Gu, W.; Shen, L.; Li, M. An improved and comprehensive mathematical model for solar photovoltaic modules under real operating conditions. Sol. Energy 2019, 184, 292–304. [Google Scholar] [CrossRef]
  36. Brano, V.L.; Orioli, A.; Ciulla, G.; Di Gangi, A. An improved five-parameter model for photovoltaic modules. Sol. Energy Mater. Sol. Cells 2010, 94, 1358–1370. [Google Scholar] [CrossRef]
  37. Brano, V.L.; Ciulla, G. An efficient analytical approach for obtaining a five parameters model of photovoltaic modules using only reference data. Appl. Energy 2013, 111, 894–903. [Google Scholar] [CrossRef]
  38. Haouari-Merbah, M.; Belhamel, M.; Tobias, I.; Ruiz, J. Extraction and analysis of solar cell parameters from the illuminated current–voltage curve. Sol. Energy Mater. Sol. Cells 2005, 87, 225–233. [Google Scholar] [CrossRef]
  39. Tivanov, M.; Patryn, A.; Drozdov, N.; Fedotov, A.; Mazanik, A. Determination of solar cell parameters from its current–voltage and spectral characteristics. Sol. Energy Mater. Sol. Cells 2005, 87, 457–465. [Google Scholar] [CrossRef]
  40. Chegaar, M.; Azzouzi, G.; Mialhe, P. Simple parameter extraction method for illuminated solar cells. Solid-State Electron. 2006, 50, 1234–1237. [Google Scholar] [CrossRef]
  41. Khan, F.; Baek, S.-H.; Kim, J.H. Intensity dependency of photovoltaic cell parameters under high illumination conditions: An analysis. Appl. Energy 2014, 133, 356–362. [Google Scholar] [CrossRef]
  42. Kaminski, A.; Marchand, J.; Laugier, A. I–V methods to extract junction parameters with special emphasis on low series resistance. Solid-State Electron. 1999, 43, 741–745. [Google Scholar] [CrossRef]
  43. Khan, F.; Baek, S.H.; Park, Y.; Kim, J.H. Extraction of diode parameters of silicon solar cells under high illumination conditions. Energy Convers. Manag. 2013, 76, 421–429. [Google Scholar] [CrossRef]
  44. Renno, C.; Perone, A. Experimental modeling of the optical and energy performances of a point-focus CPV system applied to a residential user. Energy 2021, 215, 119156. [Google Scholar] [CrossRef]
Figure 1. Traditional single-diode equivalent electrical circuit of a solar cell.
Energies 15 09404 g001
Figure 2. Determining the optimal position of the lens relative to the solar cell.
Energies 15 09404 g002
Figure 3. Diagram of the experimental setup for obtaining the light characteristics of a solar cell.
Energies 15 09404 g003
Figure 4. Diagram of the experimental setup for obtaining dark characteristics of a solar cell.
Energies 15 09404 g004
Figure 5. Graphs of CPV power at different heights of the Fresnel lens relative to the solar cell at different temperatures and constant incident radiation power of 200 W/m2.
Energies 15 09404 g005
Figure 6. Temperature dependence of solar cell parameters and CPV at different radiation powers (a) ideality factor n, (b) photocurrent Iph, (c) series resistance Rs, (d) reverse saturation current I0, and (e) shunt resistance Rsh.
Energies 15 09404 g006
Figure 7. I–V characteristics of solar cell and CPV cell at temperatures of 32 °C and 40 °C for solar radiation level: (a) 200 W/m2, (c) 300 W/m2, and (e) 400 W/m2; and graphs of output power of solar cell and CPV cell for solar radiation level: (b) 200 W/m2, (d) 300 W/m2, and (f) 400 W/m2.
Energies 15 09404 g007
Figure 8. Efficiency as a function of (a) concentration ratio and (b) temperature and radiation power.
Energies 15 09404 g008
Figure 9. Experimentally measured solar radiation during the day.
Energies 15 09404 g009
Figure 10. Approximation of the parameters of a silicon solar cell and LCPV at temperatures of 32 °C and 40 °C.
Energies 15 09404 g010
Figure 11. Silicon LCPV cooling system.
Energies 15 09404 g011
Figure 12. Heating of a solar cell at different incident radiation powers.
Energies 15 09404 g012
Figure 13. Dependence of the final heating temperature of the solar cell on the incident radiation power.
Energies 15 09404 g013
Figure 14. Cooling time of the solar cell depends on the incident radiation power.
Energies 15 09404 g014
Figure 15. Energy generation by silicon solar cell and LCPV during the day.
Energies 15 09404 g015
Figure 16. Example of model based on machine learning and real temperature dependence of the solar cell temperature on the time at incident solar power 200 W/m2.
Energies 15 09404 g016
Figure 17. Simulation of temperature of the solar cell during first 2000 s.
Energies 15 09404 g017
Figure 18. Power consumption of the water pump in three operating modes.
Energies 15 09404 g018
Table 1. Metrics of model.
MAEMSERMSE R 2
0.1250.08790.29650.99896
Publisher’s Note: MDPI stays neutral with regard to jurisdictional claims in published maps and institutional affiliations.