Article

Multi-Criteria Future Energy System Planning and Analysis for Hot Arid Areas of Iran

by
Hossein Yousefi
1,
Mohammad Hasan Ghodusinejad
1,* and
Armin Ghodrati
2
1
Renewable Energies and Environmental Engineering Department, Faculty of New Sciences and Technologies, University of Tehran, Tehran 14166-34793, Iran
2
School of Advanced Technologies, Iran University of Science and Technology, Tehran 13114-16846, Iran
*
Author to whom correspondence should be addressed.
Energies 2022, 15(24), 9405; https://doi.org/10.3390/en15249405
Submission received: 22 November 2022 / Revised: 7 December 2022 / Accepted: 9 December 2022 / Published: 12 December 2022

Abstract

:
An increase in energy demand in the coming years is inevitable, and therefore it is necessary to provide optimal solutions for this future need. This paper examines the future energy demands of the southern regions of Iran (with a hot and dry climate and high energy needs). In this regard, the overall structure of the research has been divided into three parts. In the first part, using historical energy consumption data, the energy demand in 2030 is predicted. This is carried out utilizing a time series analysis method, namely Holt–Winters. Then, relying on the plans of the Iran Ministry of Energy, various energy plans have been designed and energy modeling has been carried out for both base and forecast years. Finally, regarding a multi-criteria decision-making approach, energy plans are ranked and the best scenarios are selected and analyzed. The results of modeling and multi-criteria analysis showed that comprehensive and simultaneous development in the construction of thermal and renewable power plants is the best option to meet future energy needs.

1. Introduction

The usage of various energies is growing in the modern world as a result of relative population growth, technological advancements, and improved social conditions. Predictions about how to meet demand for the coming years have been made as a result of the rise in energy demand. An increase in environmental pollution emissions due to increased energy use also harms the biological environment by causing a rise in that environment’s pollutant emissions. In recent decades, in addition to environmental concerns, there have also been concerns about the reduction of fossil resources. The shortage of energy supply in areas such as industry, transportation, and households, as well as the cost of energy production in other methods, are just a few of the issues that will be exacerbated by the global decline in non-renewable resources. One of the most effective strategies to avoid the aforementioned issues is to provide accurate predictions, control scenarios, and energy production plans so that decision makers can react to future energy flows. Using solutions such as replacing or combining renewable and non-renewable energy systems in order to increase or support production can answer some of the future needs.
Electricity consumption in Iran in 2018 was equal to 272.8 TWh [1]. The increase in this amount of consumption will occur for several years to come due to the constant growth rate. As such, it is expected that by 2030, the demand will exceed the supply. As a result, it is essential to research the use of various energy supply techniques to expand output, taking into account production standards and pollution levels to select the optimum option for the given circumstances and geographical location. Examining different future energy supply methods helps increase reliability and efficiency.
The granting of subsidies for financial support to people and producers for the use of energy has occurred in recent years as a result of Iran’s competitive advantage in the extraction and production of oil and its products. This has led to the cost of installing and maintaining new, renewable energy systems being much over the economic threshold. Due to the lack of economic justification for clean energy projects for consumers, culturalization has not been able to increase the speed of using these energies [2]. However, today, with worries about the depletion of fossil fuels and the rise of renewable technology, a promising future for these systems might be imagined. The combination of renewable systems in order to support the energy network or increase production capacity can be one of the most important and practical solutions [3].
The use of different decision-making methods is widely applied in various industries, including energy and sustainability [4], to choose the most efficient and productive way. One technique for determining the ranking and position of each technique based on the importance and weighting of various aspects is multi-criteria decision making. It is possible to rank and draw conclusions on how to use efficient futures because the energy sector uses this strategy.
Fatine Ezbakhe et al. [5] analyzed the sustainable development of renewable systems in Turkey. The MCDM approach was used to select the method and improve sustainability development. They have also presented a model called ELimination and Choice Translating REALITY (ELECTRE) III. In this model, uncertainty is expressed as upper and lower limits. The results showed that the best renewable option is related to wind energy. Solar and geothermal energy are the next options. Furthermore, due to the high score of wind energy, it is very important to pay attention to the policies of officials and stakeholders.
Wimmler et al. [6] have investigated the multi-criteria support method for renewable energy systems. To lessen the burden of dependency on fossil fuels, it is necessary to collect energy flows for electricity from a variety of sources. Generating electricity from renewable energy sources and combining it with electricity storage has become a challenge that cannot be ignored in the near future. The purpose of this review is to find the gap created in recent studies in order to achieve a better situation and a suitable method for the future. The results show that new concepts, including energy time and vector change, are necessary for island energy planning. In addition, due to the island conditions and dependence on fossil resources, sustainable development also has this dependence.
Katal and Fazelpour [7] conducted an study to determine and prove the compatibility of existing power plants in Iran using observational data for multi-criteria decision analysis. In this study, five power plants built in Iran were taken into account, and the most ideal mode was introduced based on the choice of several criteria and the choice of the proper index. The results showed that the VIKOR method is a suitable method for selection and ranking, but it is better to use other methods for validation.
Nadizadeh Shorabeh et al. [8] investigated the conditions for the establishment of multiple renewable energy farms in Iran using the MCDM method. This experiment was conducted with the aim of investigating the potential of renewable resources in eastern Iran. Fuzzy logic was used for uncertainty and network analysis logic was applied to obtain the required weights. The results showed that between 5 and 23% of the studied areas, according to the type of geography, have suitable conditions for establishing these farms.
Yousefi et al. [9] studied the integration of a hybrid CCHP system, consisting of renewable and non-renewable CHP components, into a large commercial building. Considering three different objective functions, the GA was applied in three different single objective optimization problems to find the best size of the system components. Then, using AHP, the most profitable answer was determined.
Ribeiro et al. [10] investigated future scenarios for the electricity generation sector using the MCDM tool. The purpose of this research was to eliminate the long-term electricity problem. Five scenarios were proposed to supply electricity. The basis of the work of three scenarios in this research was based on fossil energy; one scenario was a combination of hydroelectric power with gas and one scenario was based on renewable energy. The final results show that there are two solutions with different basic characteristics: (1) maximum renewable with higher costs than coal, but leading to a significant reduction in external energy dependence. (2) Using coal as a source of electricity at a much lower cost, but keeping in mind its ever-increasing decline.
Santos et al. [11] investigated scenarios for the future electricity supply in Brazil based on multi-criteria evaluation and based on low carbon emissions and a carbon emission fee. The findings indicated that biomass and wind energy utilization are the best possibilities for Brazil’s electricity supply in 2050, whereas scenarios with a greater percentage of fossil fuel sources are the least favored. Ghodusinejad et al. [12] evaluated the performance of a PV system in five different cities of Iran with different climatic conditions to assess the effect of weather conditions on the efficiency and performance of PV panels. They ranked the cities using SMART method.
Some papers have used EDAS method in energy modeling and environmental issues to rank alternatives and scenarios [13,14,15,16]. Demirtas et al. [17] have conducted research on the most efficient method of renewable energy consumption. The studies conducted by the EDAS multi-criteria decision-making method and the fuzzy method have been evaluated and ranked. This ranking has been made considering political, economic, social, technological, legal and environmental dimensions. The obtained results showed that the most efficient method is geothermal, and solar and wind are placed in the second and third positions, respectively.
By combining scenario planning, energy system analysis, and multi-criteria analysis, Witt et al. [18] sought a way to develop and evaluate energy scenarios. Using a wide range of parameters can have a positive effect on choosing a solution and improving performance. This study offered a methodology for combining scenario planning, energy system analysis, and multi-criteria analysis to evaluate the sustainability, competitiveness, and supply security of future energy systems. The results showed that the combination of these three methods is more transparent and the decision support process is more tangible for the development and evaluation of energy scenarios.
Karatop et al. [19] analyzed the decision making related to the investment of renewable systems in Turkey. The study is based on fuzzy combinations and EDAS decision making. Investigations are based on five forms of renewable energy: hydropower, solar energy, wind energy, geothermal energy and biomass. The results showed that the best energy alternatives for Turkey are hydropower and wind, respectively.
According to the literature review, it seems that in most of these researches, the issue of energy modeling was focused on looking at the present time. In fact, an integrated approach that simultaneously includes supply and demand forecasting has not received much attention, nor have energy modeling and multi-criteria analysis. On the other hand, this issue has not been discussed much in papers studying the Iranian energy system. The purpose of this study is to investigate the future trend of consumption and predict how to meet the demand for Hormozgan province in Iran. Initially, based on reliable information, the energy consumption of the Hormozgan Province is forecasted for 2030. Forecasting the amount of consumption leads to planning and providing effective solutions in order to meet the energy demand. Then, energy modeling is performed using the EnergyPlan model, regarding seven different scenarios for the energy supply in 2030. The Renewable Energy Organization of Iran’s (SATBA) studies and the philosophy of increasing demand for new energies were used to choose the scenarios that were put forth. The results of modeling the presented scenarios are weighted based on the data provided by the CRTIC method. Then, all scenarios are ranked by the EDAS method. Finally, according to the specified indicators and the ranking, the best ways to meet the demand of 2030 for Hormozgan province are determined.
The innovation of this research and its contribution to the literature can include the following: (a) Energy modeling of Hormozgan province based on real data and policies of the Ministry of Energy of Iran; (b) Presenting an integrated approach based on time series analysis, energy supply and demand modeling, and multi-criteria decision making in the study of current and future energy policies in the study area. In this regard, it can be assumed that the presentation of this integrated approach can provide sufficient insight to the decision makers of the energy field of Hormozgan province. Considering the high potential of renewable energy in this province, and at the same time the low development of these resources, the most important hypothesis of this paper is that the all-round development of renewable energy resources can be a way forward in providing the future energy of the province.
In this regard, this paper is comprised of six sections. The research framework is presented in Section 2. Demand forecasting is conducted and presented thoroughly in Section 3. Multi-criteria energy planning scope is described in Section 4. Results of the energy planning and decision-making are presented and discussed in Section 5. Finally, the conclusion of the paper is presented in Section 6.

2. Research Framework

2.1. Study Area

Iran, located between 25 to 40 degrees north latitude, is in a region with one of the highest potentials of solar energy in the world. The amount of solar radiation in Iran is estimated between 1800 to 2200 kWh/m2/year, which is higher than the global average [2,20]. Hormozgan province, with an area of 70,199 square kilometers, is one of the southern provinces of Iran and located at 25 north latitude and 52 east longitude. Due to the climatic characteristics and the location of Hormozgan province in the subtropical region, warm weather is the most important climatic phenomenon. Hormozgan is one of the hot and dry regions of Iran and its climate is characterised by semi-desert and desert environments. The coastal climate is very hot and humid in summer and sometimes the temperature exceeds 52 °C. The average annual temperature of this region is about 27 °C. The climatic features of Hormozgan are a long hot season and a short cool season [21]. Figure 1 illustrates the exact location of Hormozgan in Iran.
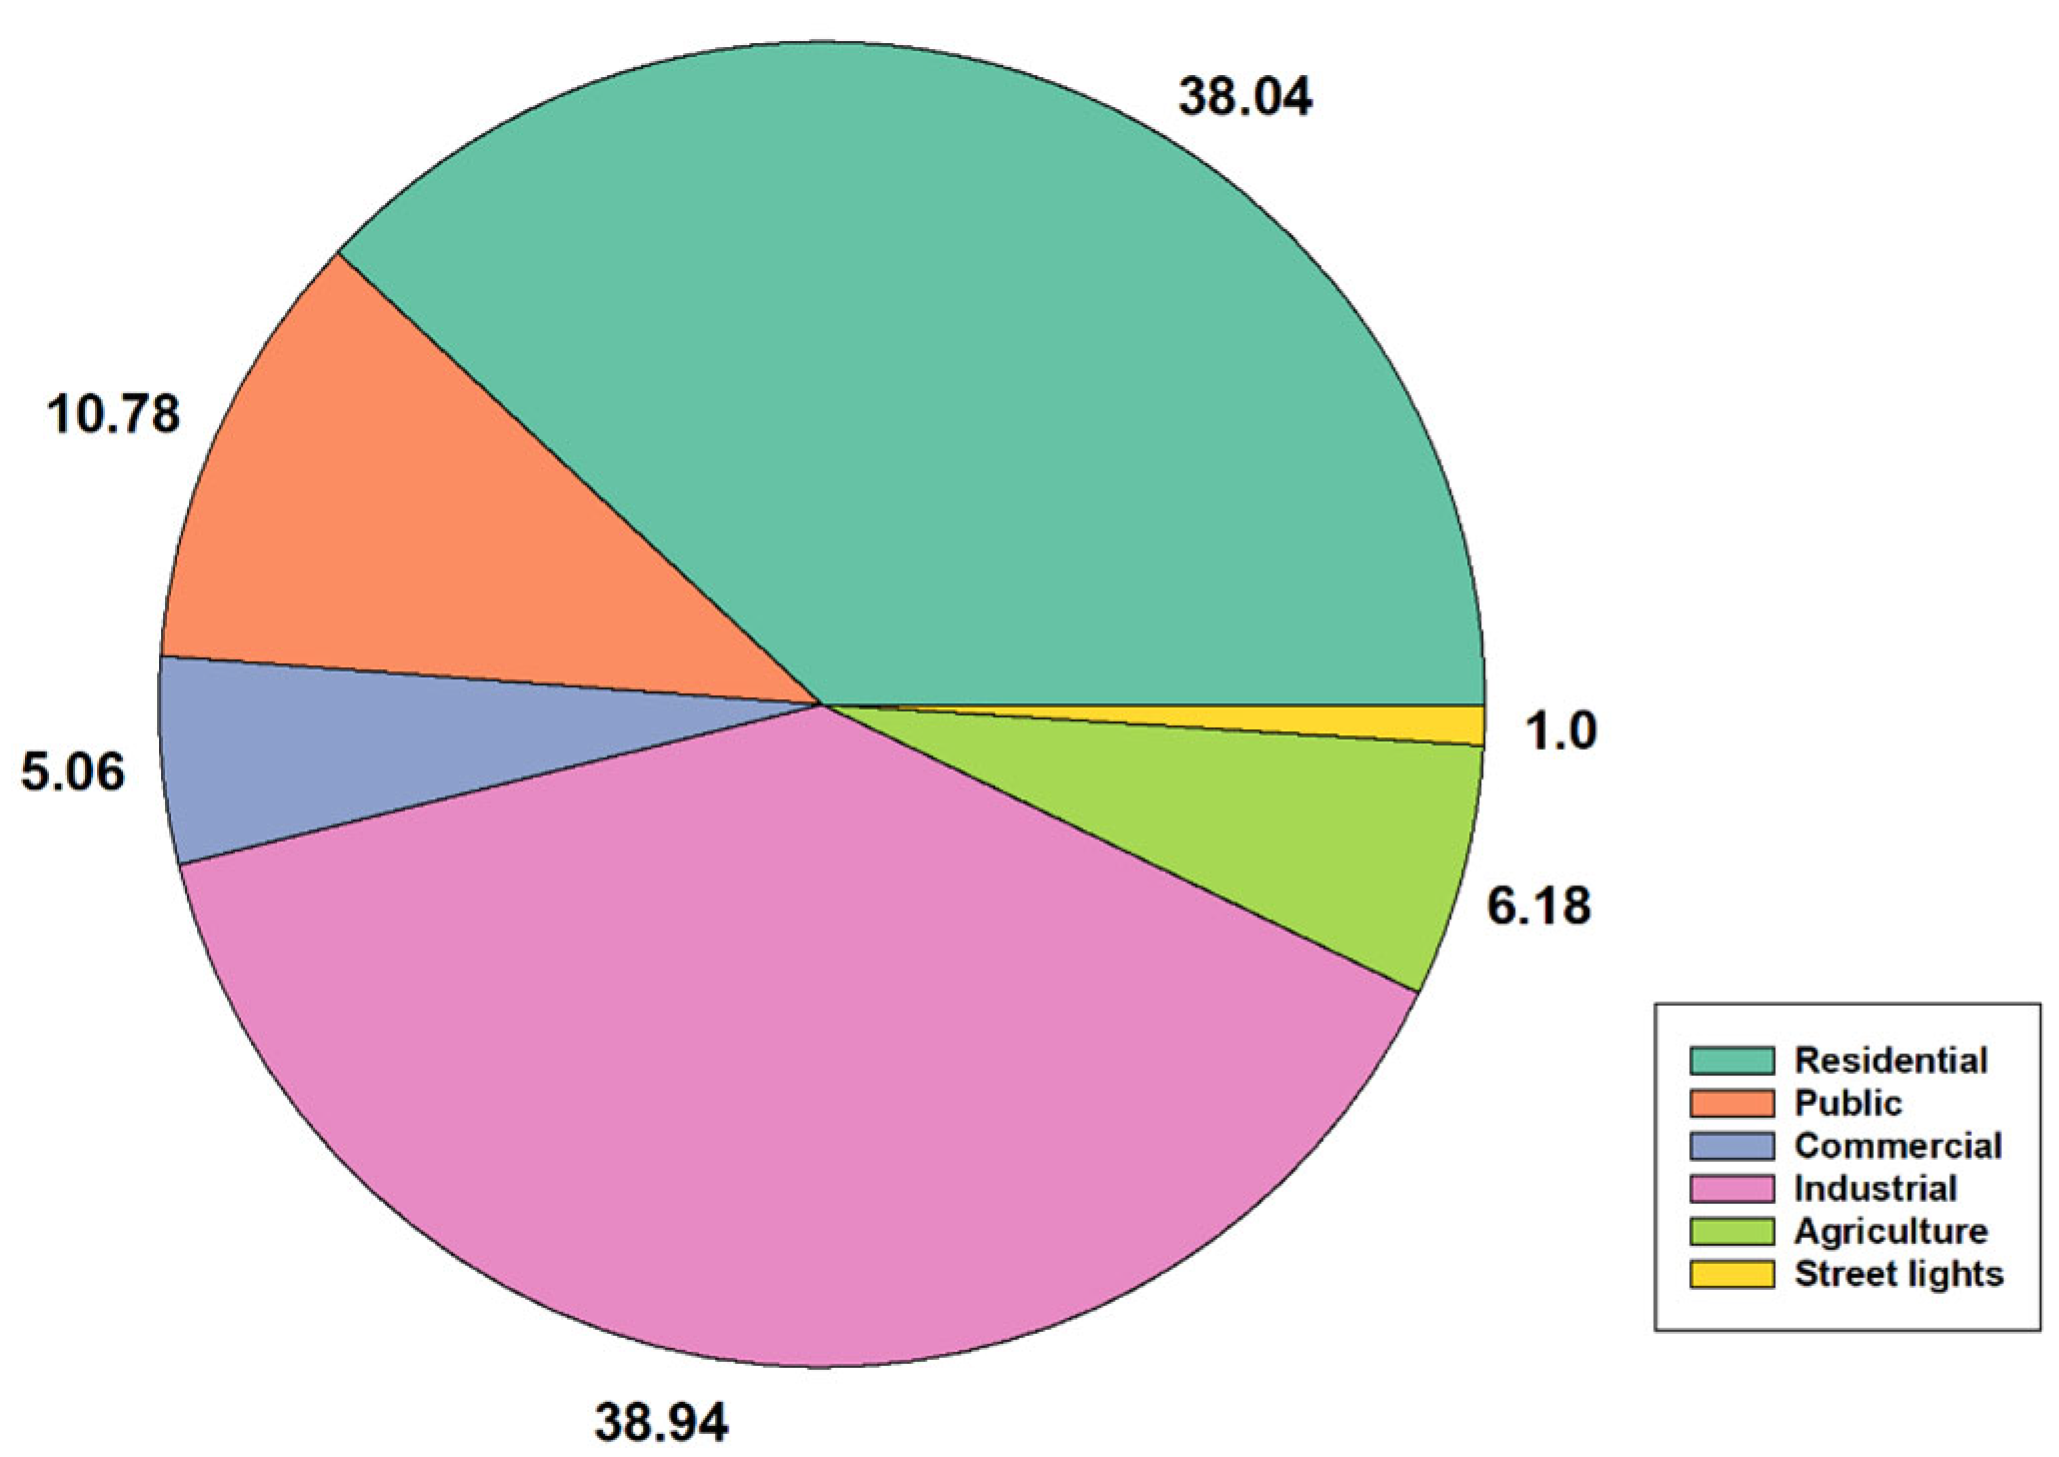
As far as the power generation sector is concerned, the nominal capacity of installed power plants is 3497.5 MW in 2018 (except Qeshm Island). All this amount belongs to fossil fuel power plants and renewable energy sources do not contribute to the province’s electricity supply. The details of installed powerplants in Hormozgan is provided in Table 1. The majority of power consumption in 2017, belongs to Industrial and Residential sectors, accounting for about 39% and 38% of total electricity consumption, respectively. The breakdown of sectors’ energy consumption is shown in Figure 2 [22].
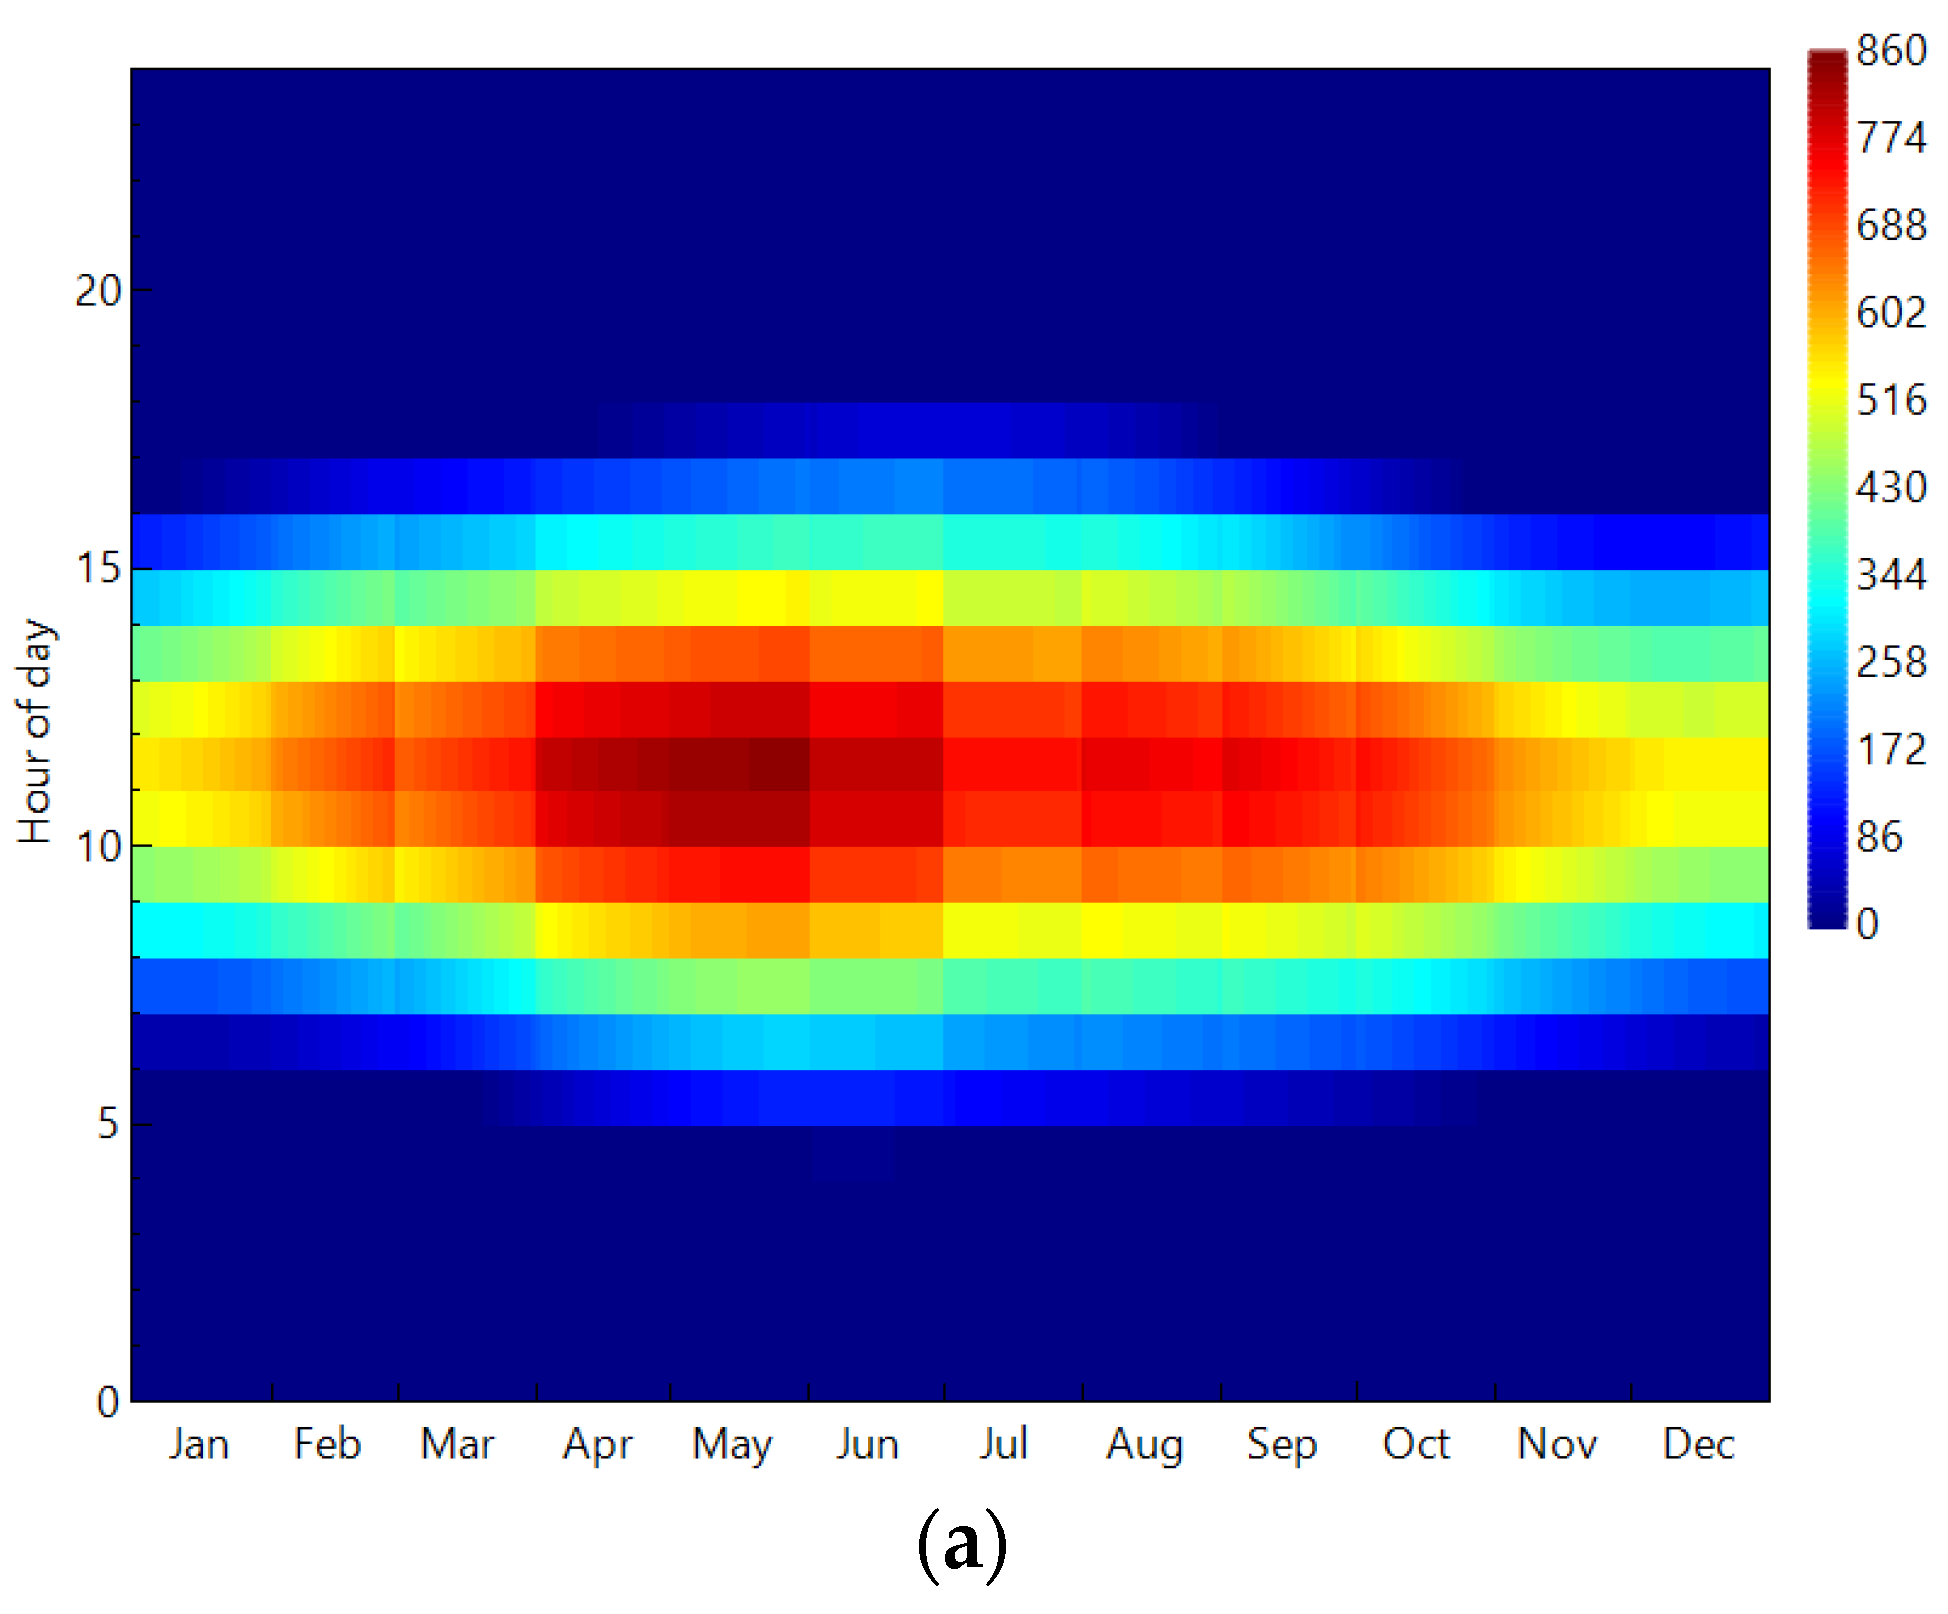
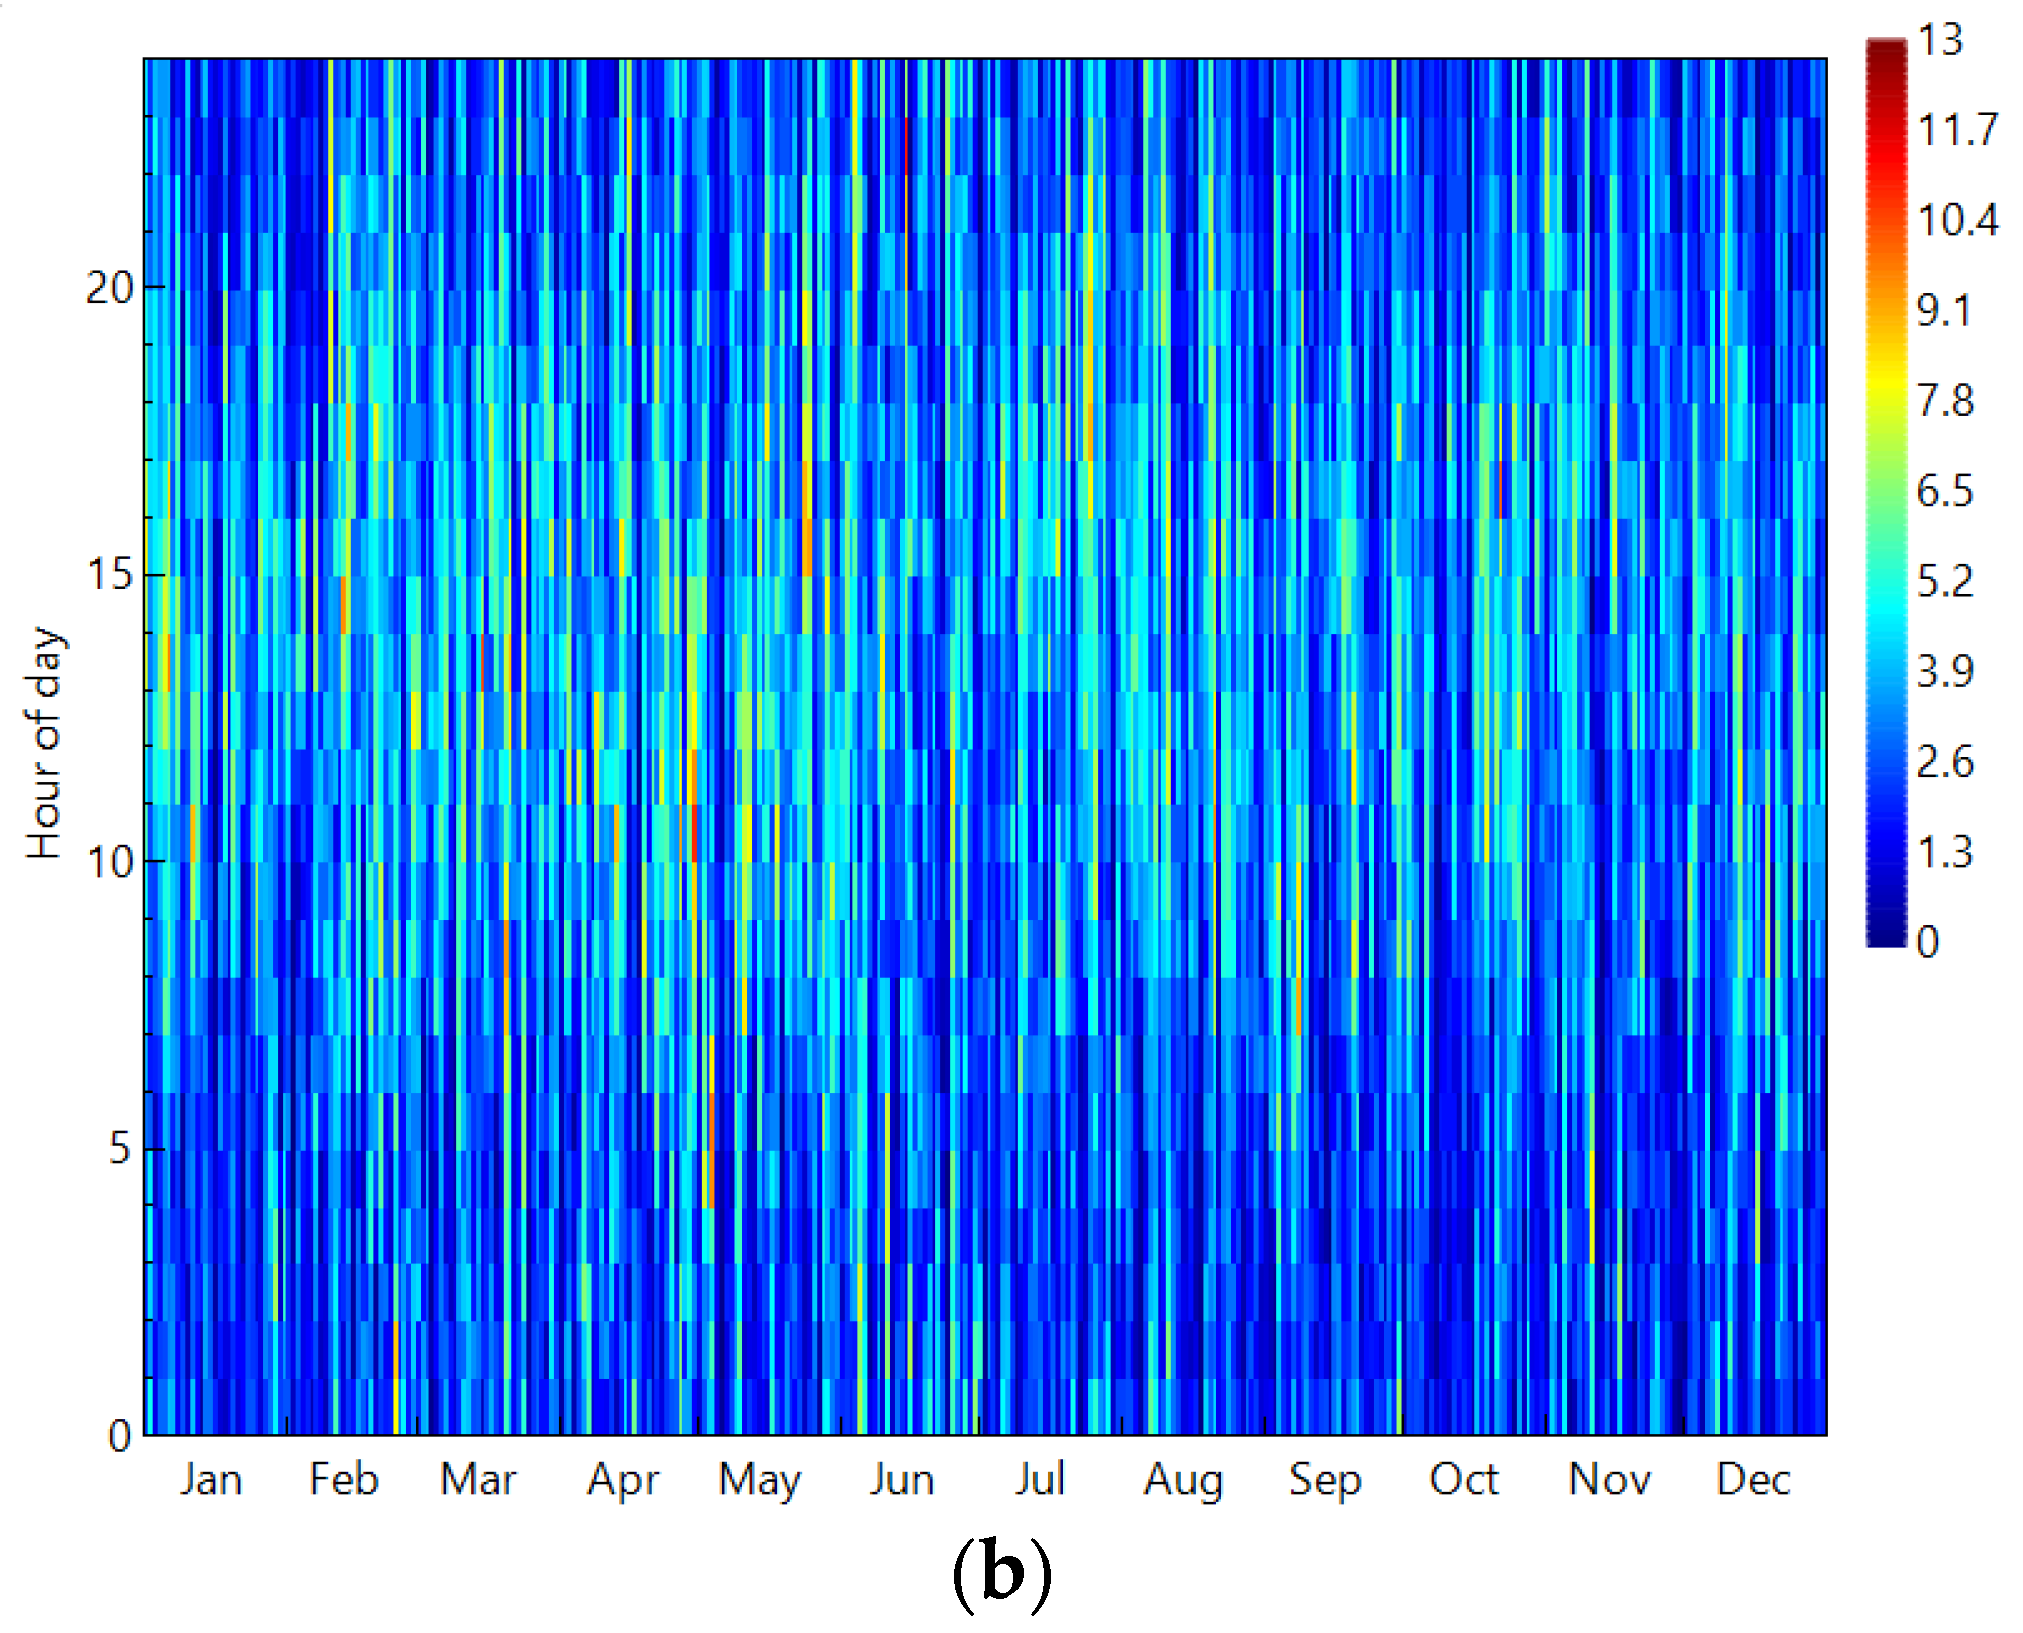
Due to its location at low latitudes, the southern regions of Iran, including Hormozgan, favors a very high potential of solar energy within the country, where the global solar irradiation ranges between 863 to 2456 kWh/m2/year, a prominent value [23]. In contrast, although the potential of wind energy in Hormozgan is not as strong as the solar potential, it is to an extent that cannot be ignored. Therefore, the study area is one of the most suitable regions in the country for harvesting both wind and solar power [24,25]. Figure 3 depicts the heat map for annual solar GHI and wind speed of Hormozgan.

2.2. Study Process

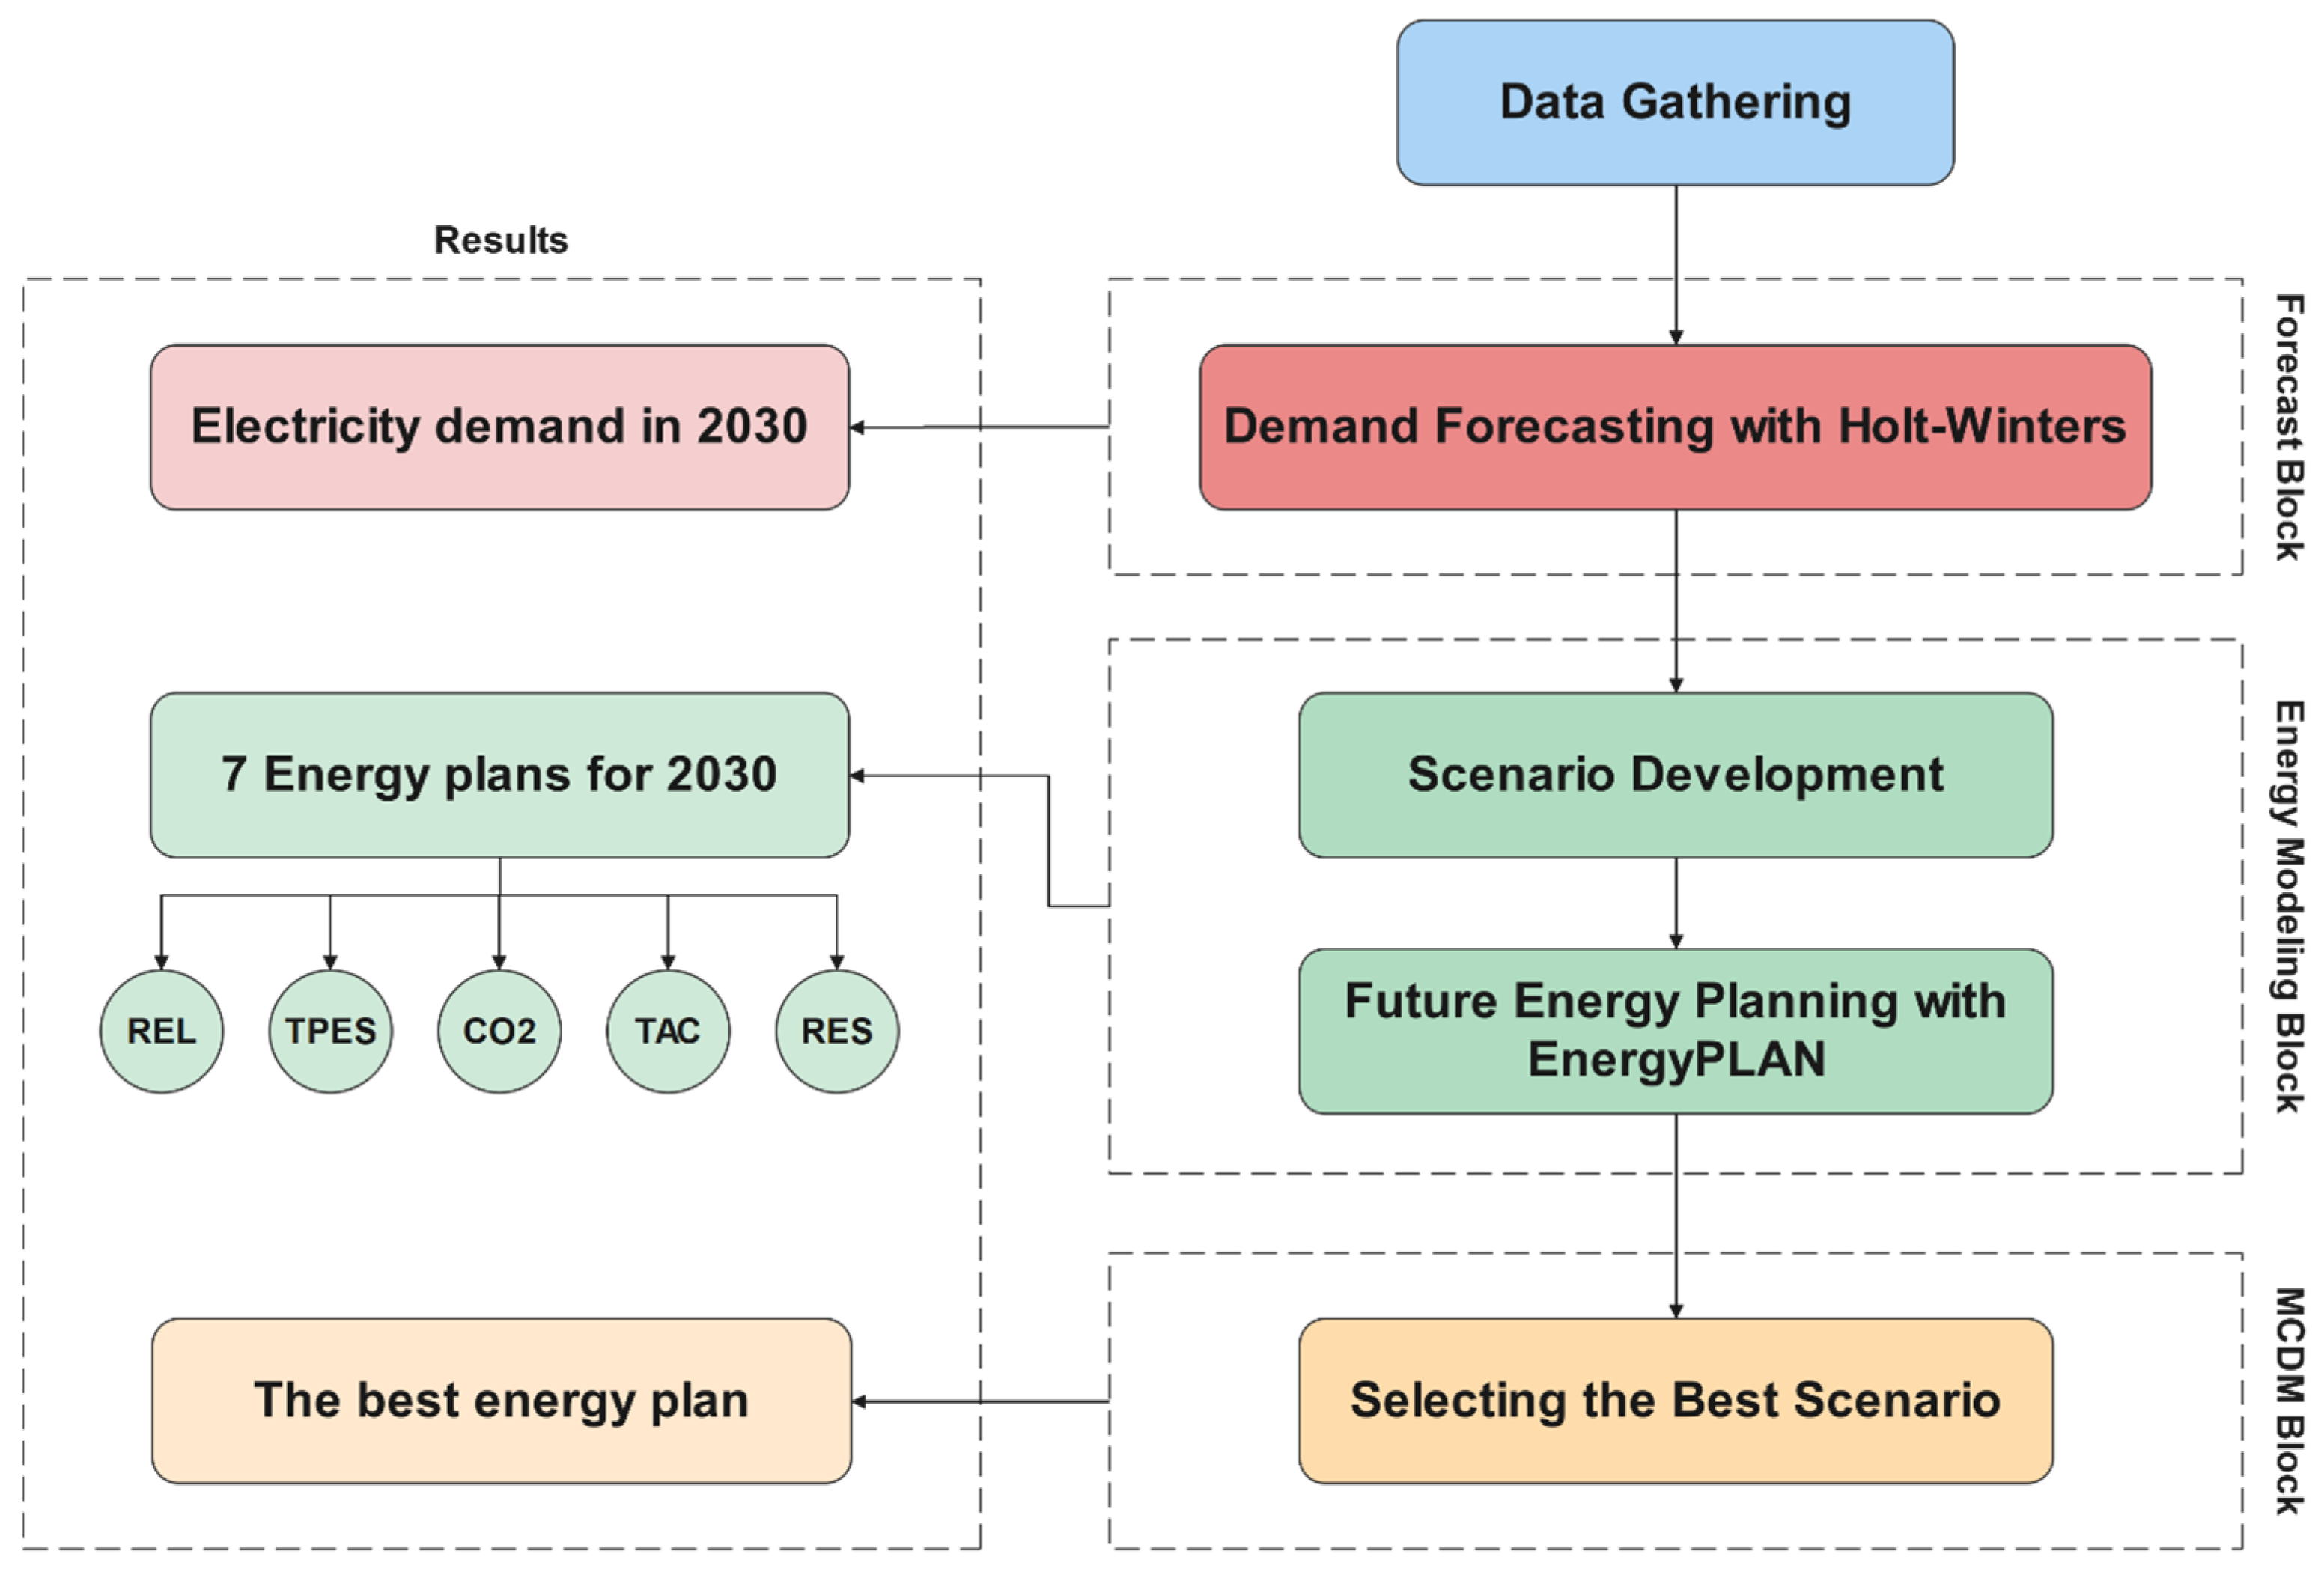
The research process in this paper consists of a multilayer structure. Figure 4 shows the research flow diagram. As can be seen in Figure 4, in the initial phase, the necessary data for the research were collected. The data comprise the current installed capacity of powerplants, annual electricity consumption history, energy development programs in the province, climate data, etc.
Next, the main process of the paper is conducted. As shown in Figure 4, the research process in this paper consists of the three main building blocks as follows.
  • Forecast block
  • Energy modeling block
  • Decision making block
Each block, while being essentially independent, is an important part of the research chain. The results extracted from each block alone represent prominent information about the energy system of the study area, and at the same time, they are used as input to the next block and form the overall structure of the research.

2.2.1. Forecast Block

Energy planning models play an undeniable role in policy making for the energy sector. The forecasting of energy demand and supply is the key component of an energy planning model [26]. The need to predict the performance of individual components of the energy system or the overall system behavior motivates the development of planning models [27]. Energy demand forecasting is the heart of future energy management, which is required for the appropriate allocation of resources. During the last decade, several new techniques have been proposed for energy planning, in order to accurately forecast the future energy needs. These includes traditional methods such as time series analysis, regression, econometric, as well as soft computing techniques such as fuzzy logic, evolutionary algorithms, and neural networks [28].
As stated earlier, energy forecasting is applied in this paper to predict the electricity demand of the study area for the horizon 2030. The Holt–Winters method is utilized to conduct the forecast based on the historical data on electricity consumption. The result of this building block would be the electricity demand in 2030, being used as the main input for future energy planning.

2.2.2. Energy Modeling Block

Models are one the most essential tools for energy systems planning and management. A model is defined and could be understood as a simplified representation of the real world’s energy system [29]. The energy models are classified and analyzed in different aspects, including geographic coverage, spatial and temporal resolution, time horizon, and sectoral coverage, etc. In various energy systems, particularly a large-scale system such as a regional energy market, energy models may help to provide an understanding of the relationships between different components of the energy system and between different time periods, under various assumptions and scenarios [30]. Energy models are mainly developed to solve a problem or to answer a specified question, and in this context, scenarios are of great importance. Future long-term analysis may be conducted by means of scenario development in the energy sector in order to evaluate the impact of various policies [31].
This paper also pursues the scenario development approach, and in this regard, seven different scenarios are considered as future energy development plans. In an iterative process, the energy system of the case study area is modeled and analyzed in all seven energy plans. Hence, seven distinct sets of answers are produced.
Due to the importance of energy modeling, numerous energy modeling tools have been developed in the past decades. The EnergyPLAN computer model is utilized in this paper. EnergyPLAN is an energy system analysis tool, created for the research in the design of future sustainable energy systems with a special focus high shares of renewable energy sources. It is designed to enable the synergies within the whole energy system, as expressed in the smart energy system concept. EnergyPLAN provides different analysis aspects and facilitates the study of the conversion of renewable electricity into other energy carriers, such as heat, hydrogen, green gases and electrofuels, as well as the implementation of energy efficiency improvements and energy conservation [32].
As shown in Figure 4, five output data are calculated and extracted as indicators of the performance of the energy system in each scenario. The selected indices are wide-ranging and cover various dimensions of the energy system’s performance. Therefore, the energy system is comprehensively evaluated in various aspects. These five indices and output data of the energy model are as follows:
Reliability Index (REL): Self-sufficiency is one of the fundamental indicators of resilience in energy systems. Self-sufficiency in energy supply is directly related to reliability and high reliability in an energy system leads to its greater robustness. In this regard, the reliability index is considered as one of the evaluation indicators of the energy system. The need for energy imports from outside the province’s energy system (TWh) is determined as this criterion.
Energy Supply Index (TPES): An energy system may include different energy carriers. These energy carriers can be primary or secondary energy or classified as fossil and renewable resources. In order to understand the total amount of energy consumed, the energy supply index, in the form of Total Primary Energy Supply (TWh), is introduced.
Environmental Index (CO2): Environmental studies and evaluation of the effects of the energy system on climate change are an integral part of energy systems planning. Therefore, the next indicator considered is in this area. CO2 emission rate (Mt) was determined as the environmental indicator.
Economic Index (TAC): In order to economically evaluate the energy system, it is necessary to include the economic index in the study and planning. In this context, the Total Annual Cost index is considered.
Renewables Index (RES): Expanding the use of renewable energy is one of the main pillars of sustainable development and energy transition. The greater the share of renewable energy resources in an energy basket, the more sustainable, resilient, and low carbon the energy system will be. The Renewables Index, in the form of the Renewable Energy Share (RES) of primary energy, is defined to consider the amount of benefit of the energy system from renewable resources.

2.2.3. Decision Making Block

Multi-criteria decision-making (MCDM) approaches are one of the most implemented decision-making tools for complex decision-making problems, in order to evaluate several alternatives considering multiple decision criteria and indicators. MCDM methods have been applied for several complicated problems that have considered the concept of future energy planning to make the best decision for an energy system. Energy systems are often complex systems that are affected by many factors and at the same time, affect different factors. Due to this complexity, particularly in choosing among various alternative energy sources and technologies, MCDM is applied as an effective tool. MCDM includes decision support and evaluation for addressing complex problems with high uncertainty, challenging objectives, multi-interests and perspectives. Generally, MCDM methods are mainly applied to conduct two critical types of problems; first, these methods are utilized to investigate the importance of considered decision indicators in a problem. Second, they are used to determine an overall comparative ranking of several alternatives concerning defined decision factors or indicators [33,34,35].
As seen in Figure 4, this paper is founded on a multi-criteria decision-making basis because there are several scenarios and energy plans designed for the future, and therefore, it is needed to select the best energy plan based on the evaluation of different indicators. Over the past few decades, various MCDM methods have been introduced. In this paper, a combined method is used to comparatively evaluate the energy plans. First, the CRITIC method has been applied in order to verify the weights of indicators; then, the EDAS method has been used to prioritize the alternatives based on the derived indicators’ weights.

3. Demand Forecasting

In order to forecast the electricity demand in 2030, the Holt–Winters (HW) method is used in this paper. Proposed by Holt [36] and Winters [37], the HW model is an extension of the exponentially weighted moving average method. The exponentially weighted moving average model forecasts future values based on past data, placing more weight on the recent observations. The HW model smooths the trend values with two smoothing coefficients (ranging between 0 and 1) and incorporates an explicit linear trend in the forecast [38].
The Holt–Winters linear exponential smoothing is conducted using Equations (1)–(3) [39]:
s t = α a t + ( 1 α ) ( s t 1 + b t 1 )
b t = β ( s t s t 1 ) + ( 1 β ) b t 1
f t = s t + i b t
where a t is the real value at timestep t, s t is the smoothed estimate at timestep t, b t is the trend value at timestep t, α is the level smoothing coefficient, and β is the trend smoothing coefficient.
Equation (1) smooths the actual value in a recursive approach by weighting the current level (α) and then adjusts s t directly for the trend of the previous period, b t 1 , by adding it to the previous smoothed data, s t 1 . This brings s t to the approximate base of the current data value. Equation (2) addresses the trend of data, where it updates the trend, expressed as the difference between the last two smoothed values. It modifies the trend by smoothing with β in the last period ( s t s t 1 ) and adding it to the previous estimate of the trend multiplied by ( 1 β ). Finally, Equation (3) is used to forecast the future data. The trend, b t , is multiplied by the number of periods ahead to be forecast, i, and added to the base value, s t [39].
In this paper, RapidMiner Studio is used to apply Holt–Winters. The model is applied with values of 0.5 and 0.1 for α and β, respectively. The result of the forecast model is depicted in Figure 5. As is shown in Figure 5, the first observed piece of data is equal to 7566.6 GWh, which belongs to 2007, while the last observed one is 16,423.2 for 2018. The trend of the historical data as well as the forecast data is almost linear, which is natural due to the nature of the HW method. The predicted demand of electricity in 2030 is found to be 25,805.2 GWh, which is almost 1.57 of the demand on the base year.

4. Multi-Criteria Energy Planning

4.1. Scenario Development

The growth of energy consumption in the coming decades is undeniable for a number of reasons, including population growth, improved social welfare, industrial and transportation growth, and so on. One of the main challenges in the field of management and planning of energy systems is allocating and finding the best solution to meet this increased energy need in the future.
The need for optimal policy in the energy sector has always been one of the strategic priorities in the upstream documents of countries, so the role of these policies in the interests of current and future generations cannot be ignored. Since there is a direct relationship between energy consumption and industrial and construction developments, the issue of an energy crisis has been recognized as a major problem of the present century. This has led to increased attention to renewable energy. Given the breadth of renewable resources, it is necessary to develop a strategic plan to improve executive action in this area. Therefore, renewable energy resources assessment, as a way to develop an appropriate strategy to reduce environmental consequences, is considered an undeniable necessity [40]. In this regard, various national documents have been developed regarding sites with high potential and evaluation of renewable energy sources in Iran.
Due to Hormozgan’s strong solar potential, solar systems have received the most attention compared to other sources. Hormozgan province’s average GHI is 12121.8 kWh m 2 , and its specific photovoltaic output power is similarly 1789.3 kWh m 2 , demonstrating the region’s excellent solar potential. The high number of sunny days and the appropriate GHI have a direct effect on the energy production process [41]. In addition to the very high potential of solar energy in Hormozgan, this province also has a favorable potential for wind energy. The process of building a solar or wind power plant in Iran is possible through the registration of a construction permit in SATBA. Figure 6 shows the location of the permits issued for the construction of future wind and solar power plants for Hormozgan province. After issuing the license and building the power plant, a power purchase agreement (PPA) is concluded between SATBA and the investor. As can be seen, 29 licenses for the construction of solar power plants and 6 licenses for wind power plants have been registered in Hormozgan.
In this context, in order to respond to increase of demand in 2030, seven energy plans have been defined. Figure 7 presents the defined energy plans in a diagram. The potential, position, and indicators mentioned are taken into consideration for each of the scenarios.
  • Plan 1 (BAU): examines the lack of capacity increase considering Business-As-Usual. In this scenario, the lack of capacity increase has been investigated in order to reduce construction costs and importing power.
  • Plan 2 (THERMAL): The second scenario involves increasing the thermal power plant’s capacity by as much as 1000 MW and, if necessary, optimizing it through cost-control measures.
  • Plan 3 (SOLAR+): According to SATBA studies, a solar power plant development plan with a capacity of 1900 MW (based on the potential of Hormozgan) has been developed. This development plan is based on the governmental financial resources and investments. This plan considers that this development plan will be implemented by the Iranian government by 2030.
  • Plan 4 (SOLAR): In this plan, it is assumed that instead of government investment in the development of solar energy, the permits for the construction of solar power plants by the private sector will be completed and all expected power plants will be put into operation by 2030 (see Figure 6).
  • Plan 5 (WIND): 450 MW of electric energy will be provided by the wind power plant (based on the current wind power plant construction permits), and the financial resources will also be provided by the private sector.
  • Plan 6 (RENEWABLES): The sixth scenario involves the private sector increasing renewable energy sources such as wind and solar in accordance with potential and geographic location. In other words, all the potential capacities of wind and solar power plants shown in Figure 6 should be put into operation by 2030.
  • Plan 7 (RE + THERMAL): This considers the combination of thermal and renewable power plants in order to provide 5265 MW of electric energy for the desired demand in 2030. In other words, it is a combination of the second and sixth scenarios.
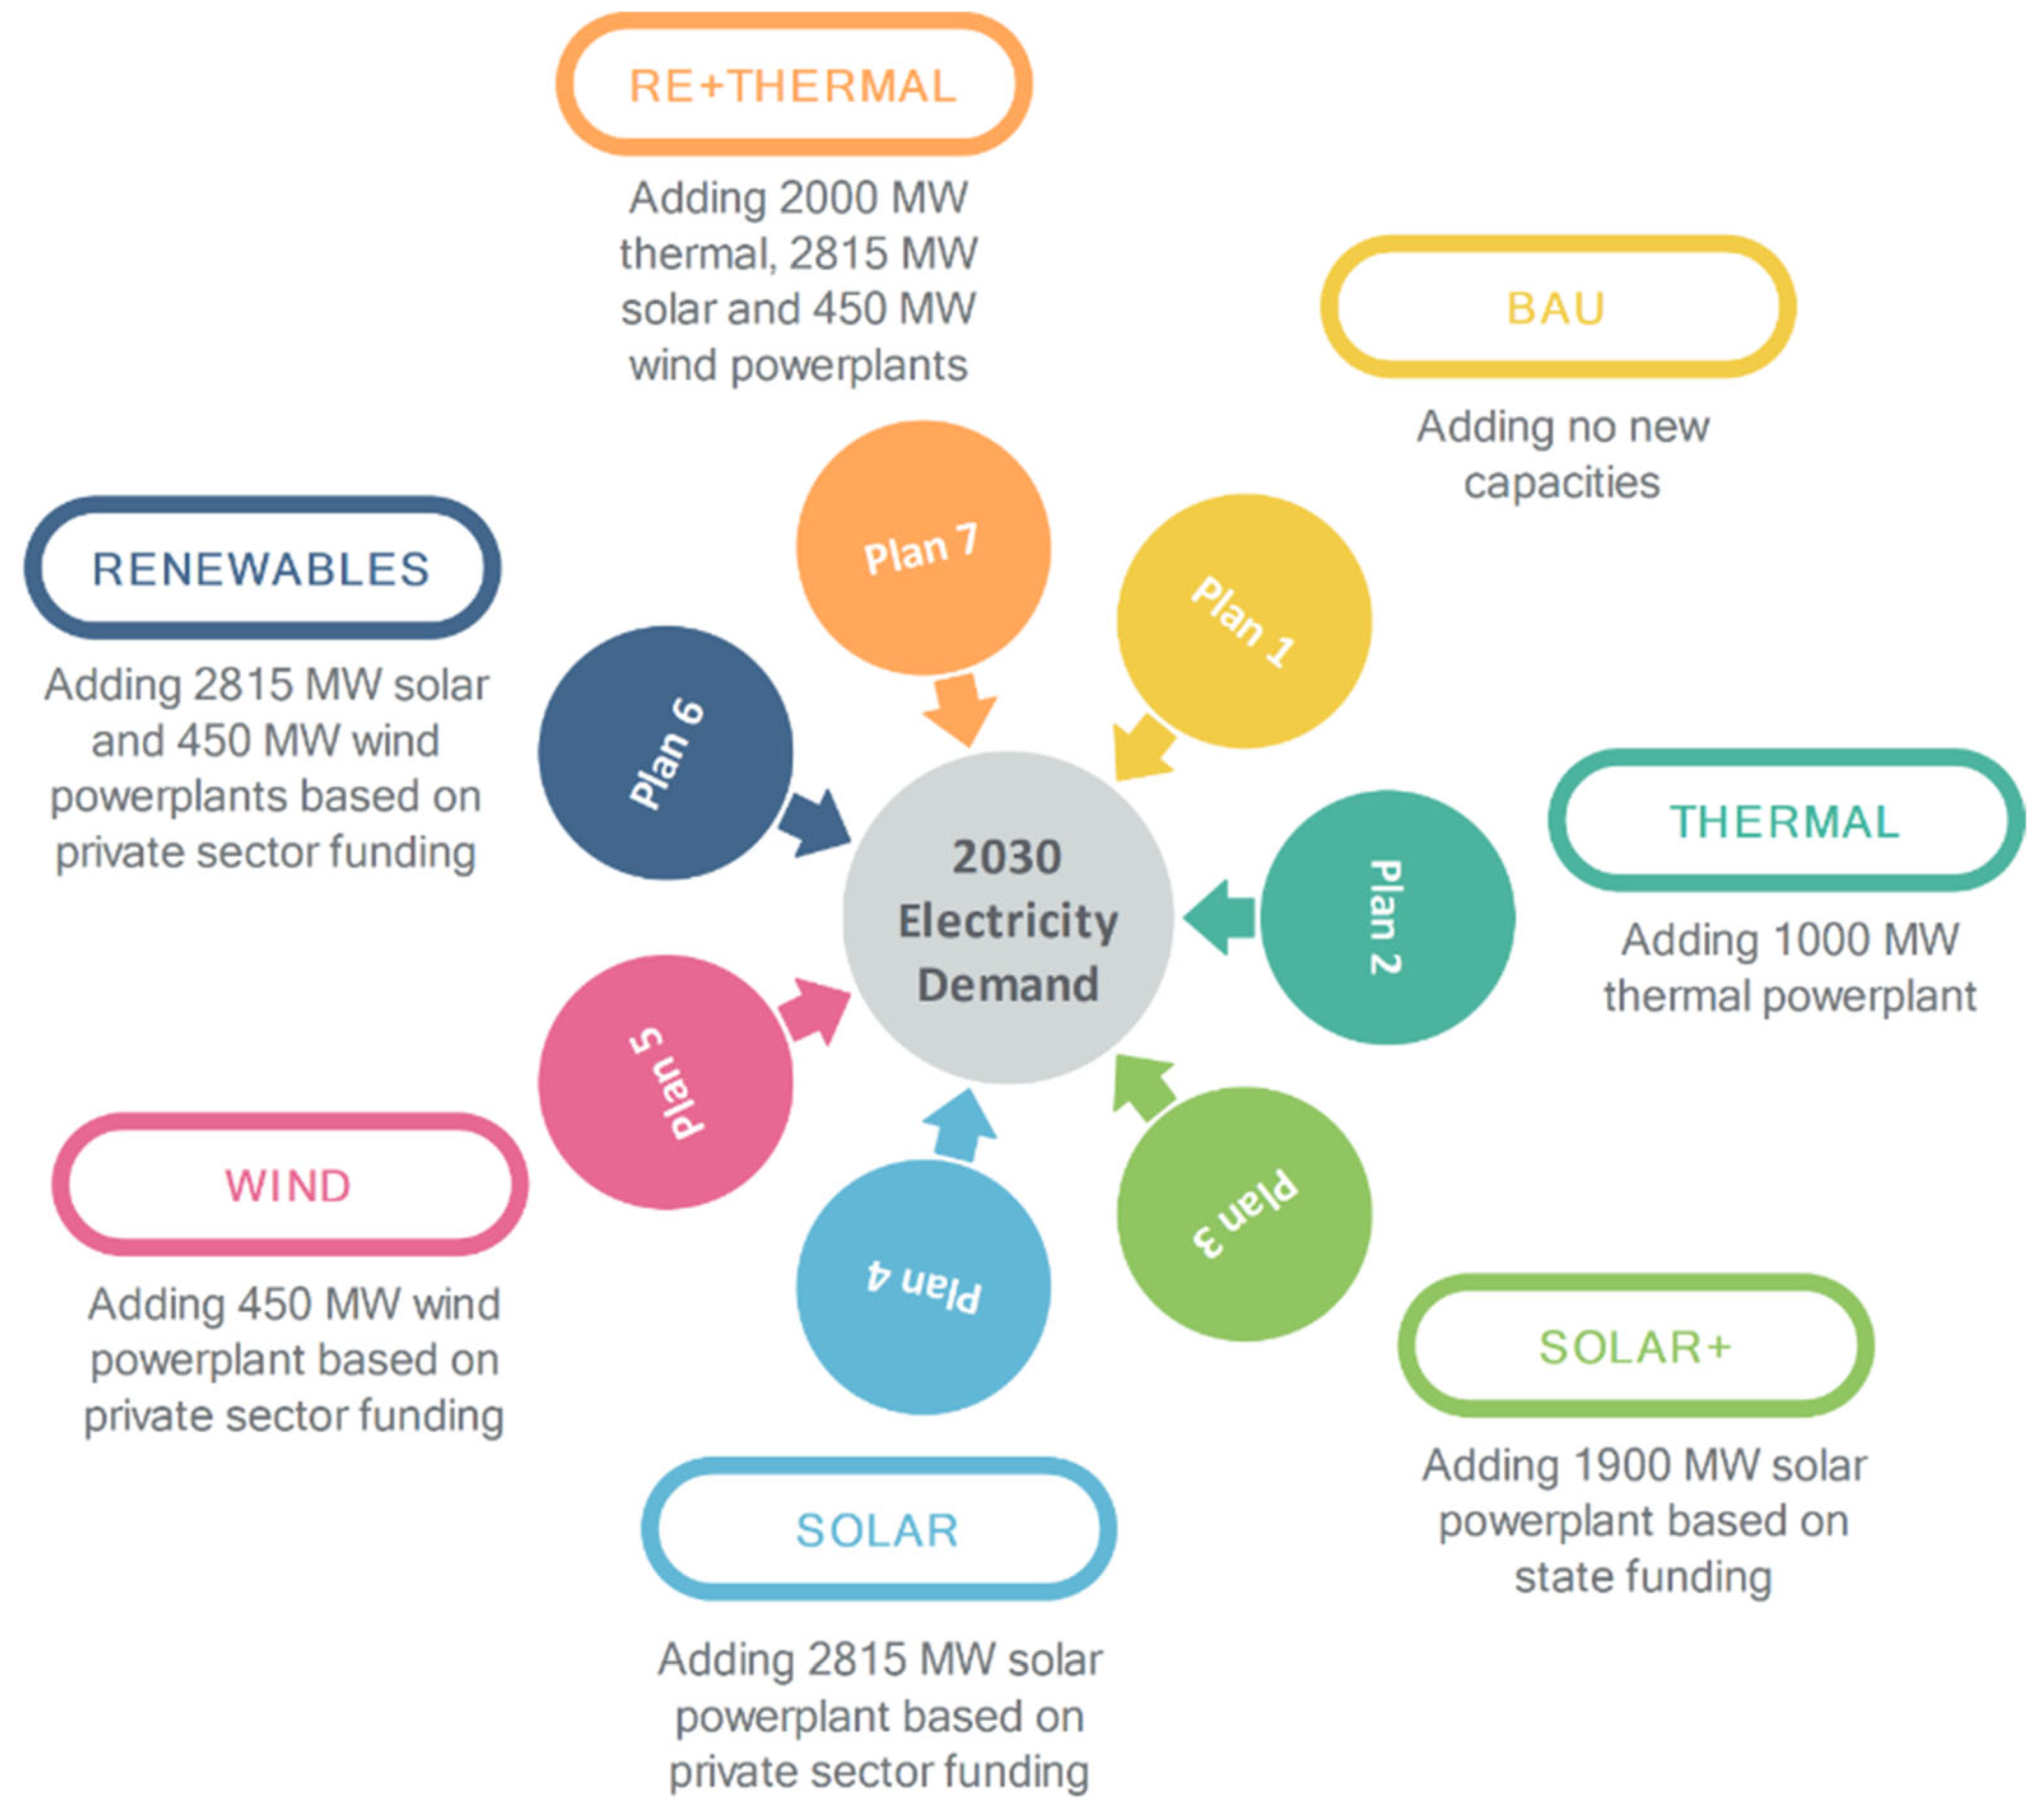
Figure 7. Seven energy plans considered in the paper.
Energies 15 09405 g007
In order to model energy and examine the desired scenarios, information such as power plant efficiency and the cost of CO2, which is one of the main desired parameters, is presented in Table 2.
Furthermore, the investment costs for the construction of the discussed power plants and the useful life span of the power plants are also presented in Table 3. The high cost of construction is one of the things that make the private and public sectors hesitant to implement.

4.2. Multi-Criteria Analysis

The optimal choice among various conditions occurs when multi-criteria decision making is used in energy cycles and systems, and other situations are categorized and ranked in a systematic way. Choosing the best and most important parameter and ranking them will reduce the amount of error and increase reliability. The high potential to ensure the reduction of production and trial and error, saving money and time, along with achieving the optimal mode, are the main reasons for using multi-criteria decision making in energy systems.

4.2.1. CRITIC

The standard deviation is used in the original CRITIC technique to calculate how starkly each criterion contrasts with the others [42]. The approach makes sure that a criterion with a higher standard deviation or contrast intensity is given a higher weight. In this process, the traits do not compete with one another, and the weights of the attributes are determined by the decision matrix. The qualitative traits are transformed into quantitative attributes, and the CRITIC technique does not require attribute independence.
Following are the steps of the CRITIC technique for an MCDM problem with m choices and n criteria.

Step 1: Forming the Decision Matrix

As shown in the following, the properties of the decision matrix are dictated by the information obtained from the decision maker, while the technique and alternatives are entered to produce the decision matrix.
X = [ r 11 r 1 j r 1 n r i 1 r i j r i n r m 1 r m j r m n ] m × n ; i = 1 , , m ; j = 1 , , n
The decision matrix’s element for the i t h alternative in the j t h attribute is represented by the above equation, r i j .

Step 2: The Normalized Decision Matrix

To normalize the attributes, the following equation have to be implemented:
Positive   attribute x i j = r i j r i r i + r i ; i = 1 , , m , j = 1 , , n
Negative   attribute x i j = r i j r i + r i r i + ; i = 1 , , m , j = 1 , , n  
where x i j , r i + , and r i represent a normalized value of the aforementioned matrix, r i + = max ( r 1 , r 2 , , r m ) , and r i = min ( r 1 , r 2 , , r m ) , respectively.

Step 3: The Correlation Coefficient

Equation (6) calculates the correlation coefficient.
ρ j k = i = 1 m ( x i j x j ¯ ) ( x i k x k ¯ ) / i = 1 m ( x i j x j ¯ ) 2 i = 1 m ( x i k x k ¯ ) 2
x j ¯ = 1 n j = 1 n x i j ; i = 1 , , m
where x j ¯ is the mean of j t h attributes and calculated as stated in the Equation (7). The x k ¯ is the mean of the k t h attributes and is calculated same as x j ¯ . The ρ j k is the correlation coefficient between k t h and j t h attributes.

Step 4: The Index (C)

First, the standard deviation must be calculated before calculating the index (C).
σ j = 1 n 1 j = 1 n ( x i j x j ¯ ) 2 ; i = 1 , , m
C j = σ j k = 1 n ( 1 ρ j k ) ; j = 1 , , n

Step 5: The Weight of Attributes

Equation (10) determines the weight of each attribute ( ζ j ) [43]:
ζ j = C j j = 1 n C j ; j = 1 , , n

4.2.2. EDAS

The evaluation based on the distance from average solution method (EDAS) has a significant role in decision-making problems, especially when more conflicting criteria exist in multicriteria group decision-making (MCGDM) problems. By calculating the difference between each option and the ideal value, the optimal alternative is identified. The EDAS method is a compensatory strategy in which the traits are unconnected to one another and the qualitative traits are transformed into quantitative traits.
All steps are described below [43]. The assessment scores of alternatives must be organized in descending order for the final ranking of alternatives, and the final ranking will be established.
  • Step 1: The average solution
Equation (11) is used to calculate each attribute’s a v e r a g e   s o l u t i o n :
A V j = i = 1 m r i j m ; j = 1 , , n
  • Step 2: The positive and negative distances
Regarding the positive and negative nature of attributes, the positive distances from average (PDA) and negative distances from average (NDA) of the positive attributes are calculated as follows:
P D A i j = max ( 0 , ( r i j A V j ) ) A V j ; i = 1 , , m , j = 1 , , n
N D A i j = max ( 0 , ( A V j r i j ) ) A V j ; i = 1 , , m , j = 1 , , n
Accordingly, the values of PDA and NDA for negative attributes are calculated as follows:
P D A i j = max ( 0 , ( A V j r i j ) ) A V j ; i = 1 , , m , j = 1 , , n
N D A i j = max ( 0 , ( r i j A V j ) ) A V j ; i = 1 , , m , j = 1 , , n
  • Step 3: The weighted PDA and NDA
Considering the weight of the attributes determined in Step 2, Equations (16) and (17) are used to calculate the values of the weighted PDA and weighted NDA of each alternative, respectively:
S P i = j = 1 n P D A i j . w j ; i = 1 , , m
S N i = j = 1 n N D A i j . w j ; i = 1 , , m
  • Step 4: The weighted normalized PDA and NDA
The values obtained from Equations (16) and (17) should be normalized as follows:
N S P i = S P i m a x i ( S P i ) , i = 1 , , m
N S N i = S N i m a x i ( S N i ) , i = 1 , , m
  • Step 5: The Appraisal Score and final ranking
The appraisal score for each alternative is computed as follows:
A S i = 1 2 ( N S P i + N S N i ) ; i = 1 , , m
In order to make the final ranking of alternatives, the corresponding appraisal scores are arranged in a descending order.

5. Results and Discussion

Modeling findings and multi-criteria outcomes are the two explanations given in the results section. The reason for this division is the complete explanation of the results of each section, as well as the possibility of comparing and distinguishing the methods.

5.1. Energy Modeling Results

The energy system is modeled by the EnergyPLAN software when the input data values are chosen and the intended scenarios are stated. This is done once for the base year of 2018 and once for the target year of 2030 in the seven scenarios proposed. Five indicators have been examined for the purpose of complete comparison and detailed examination of the scenarios. These include Reliability, Energy Supply, Environmental, Economic and Renewables indices, denoting energy import, total primary energy supply, CO2 emission, total annual costs and renewable penetration, respectively.
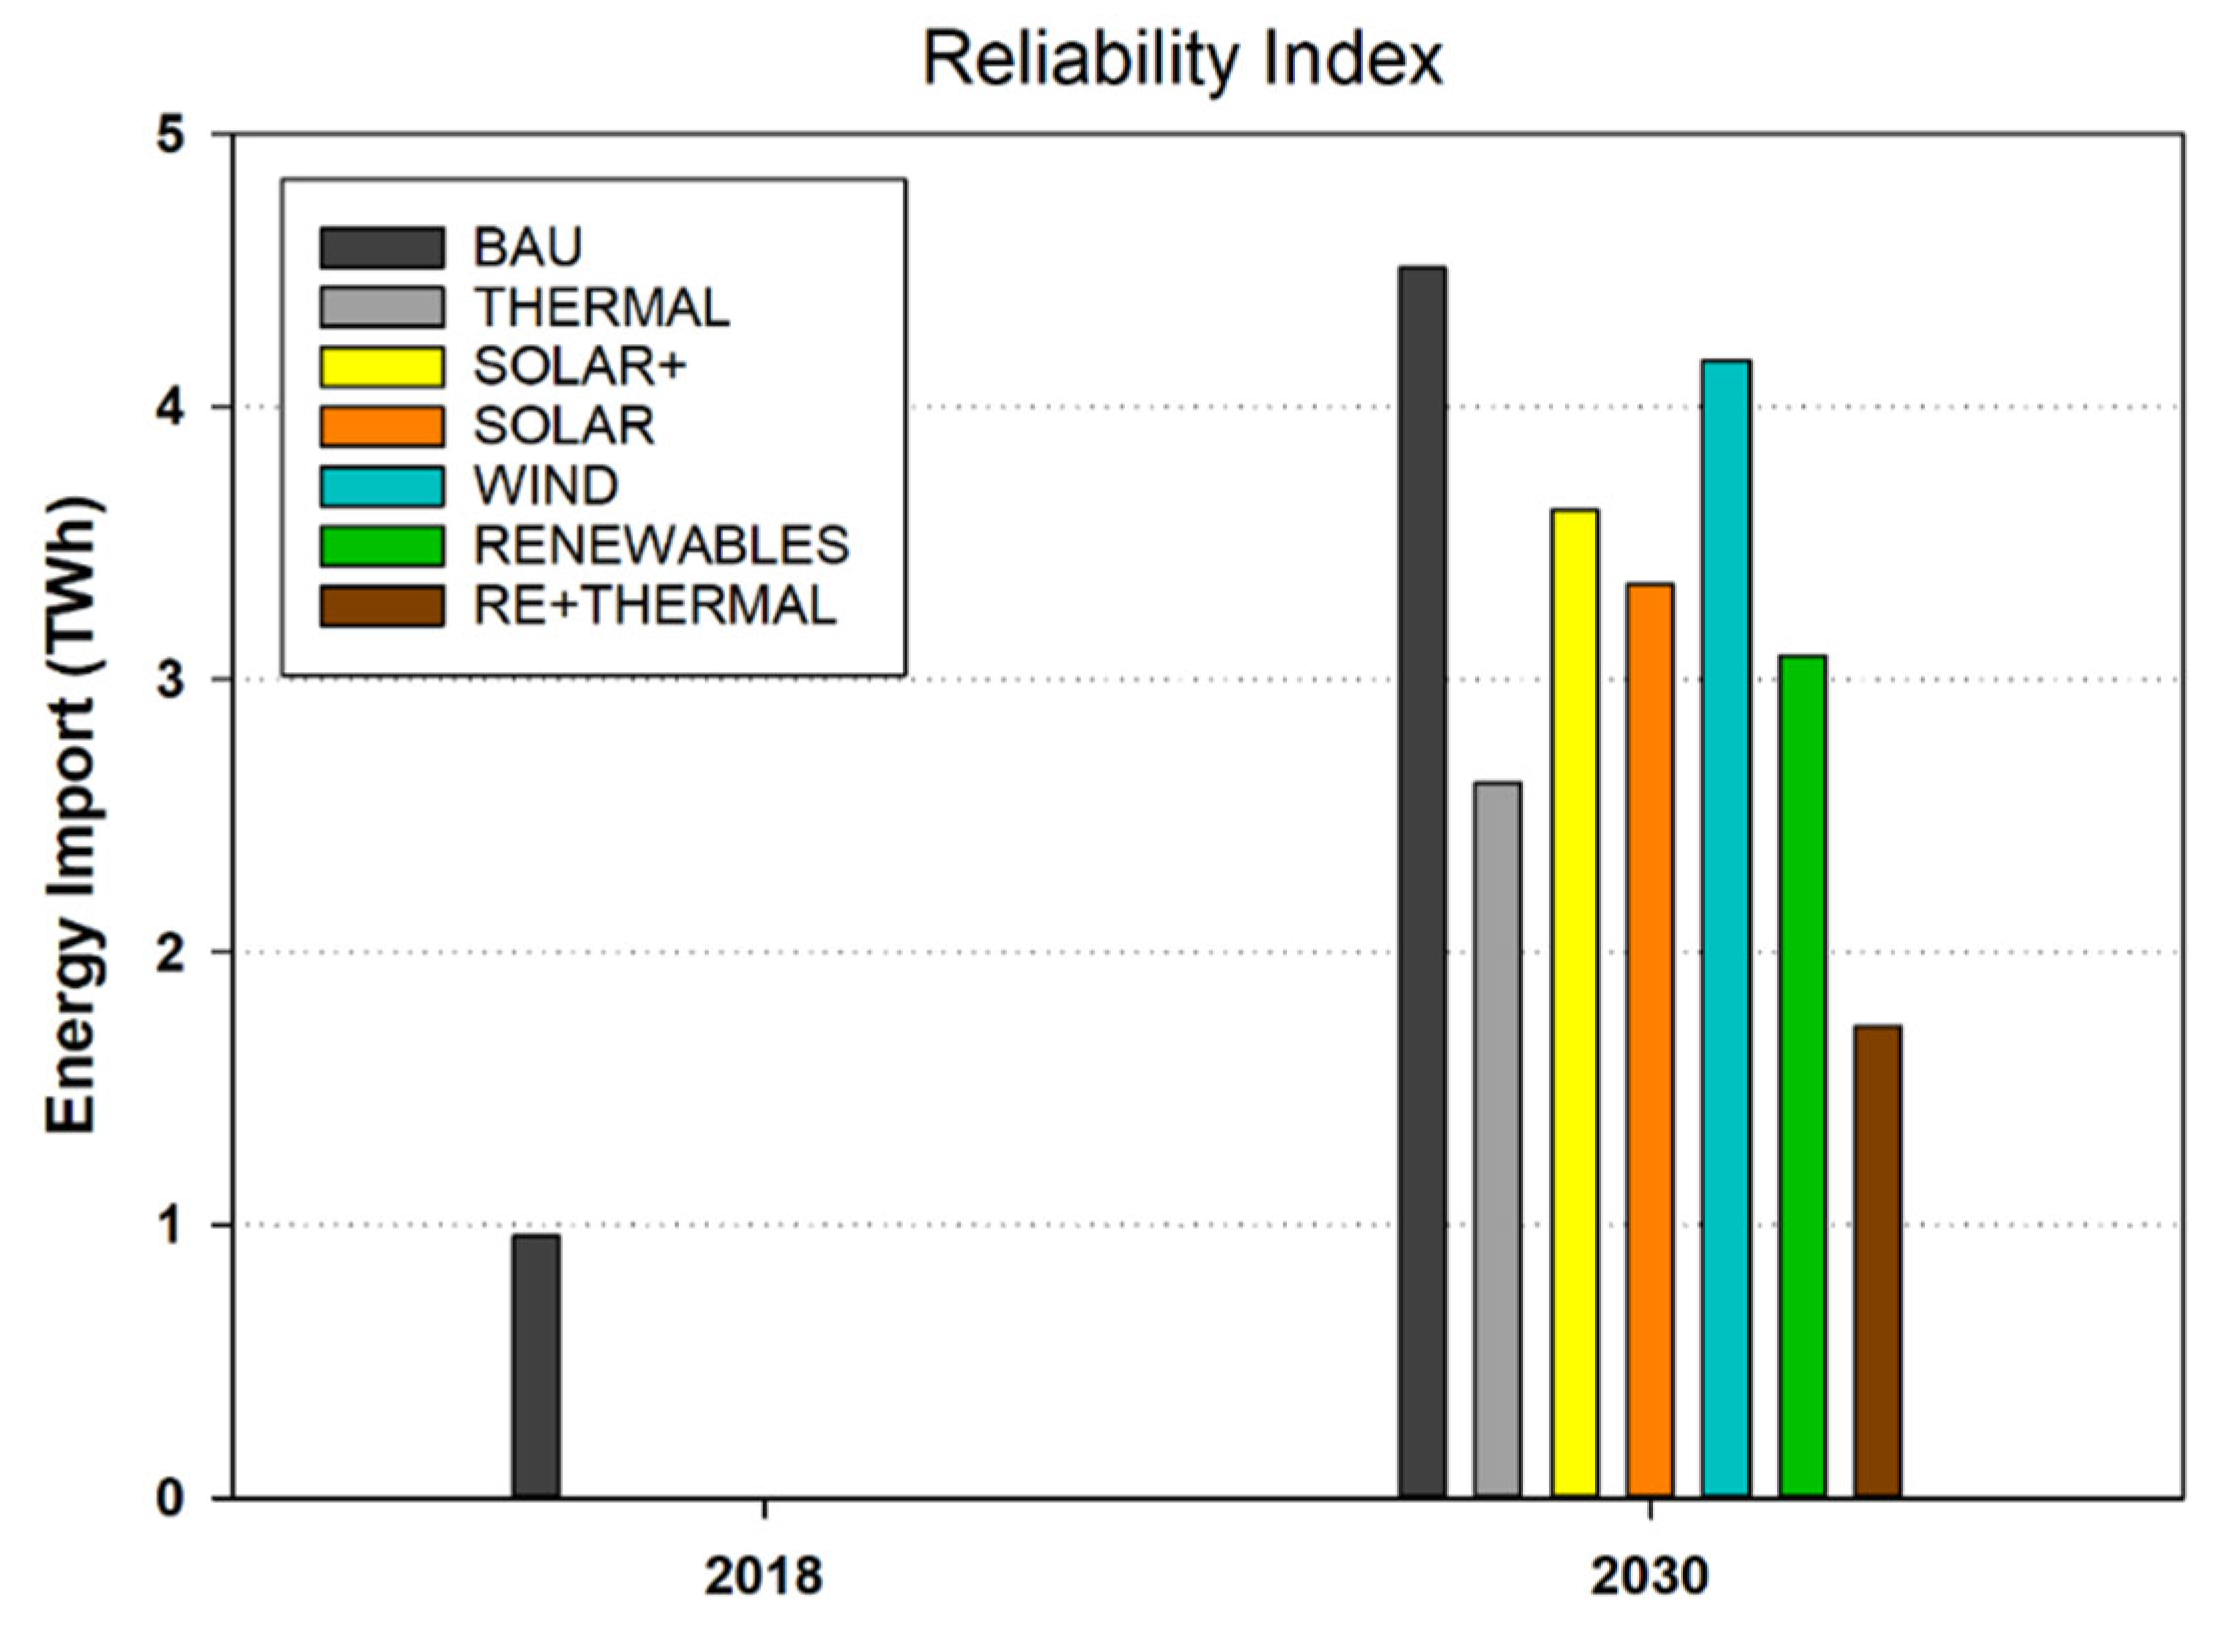
Figure 8 shows the reliability index in the scenarios. The existence of energy imports demonstrates the system’s dependability. To achieve relative reliability, the amount of energy imported is defined differently in each scenario. For example, the imported energy in 2018 is equal to 0.96 T W h y e a r in the absence of other scenarios and only in the base case. However, for 2030, the base case, or the first scenario, calls for the import of 4.51 T W h y e a r of energy in order to achieve the necessary reliability. In other words, the ratio of 2030 to 2018 for energy supply with high reliability or energy self-sufficiency is equal to 4.69, which shows the importance of energy supply and examining different scenarios in order to supply energy demand for the future. Examining the dependability index for several scenarios reveals that in 2030, the seventh scenario, with its 1.73 T W h y e a r comparable import requirement, offers the best scenario for maintaining reliability. In general, it can be seen that in the next 10 years, the need for energy and its supply is one of the main concerns of researchers. Among all the scenarios in the renewable sector, the wind energy scenario needs the most import, and the combination of renewable and thermal needs the least.
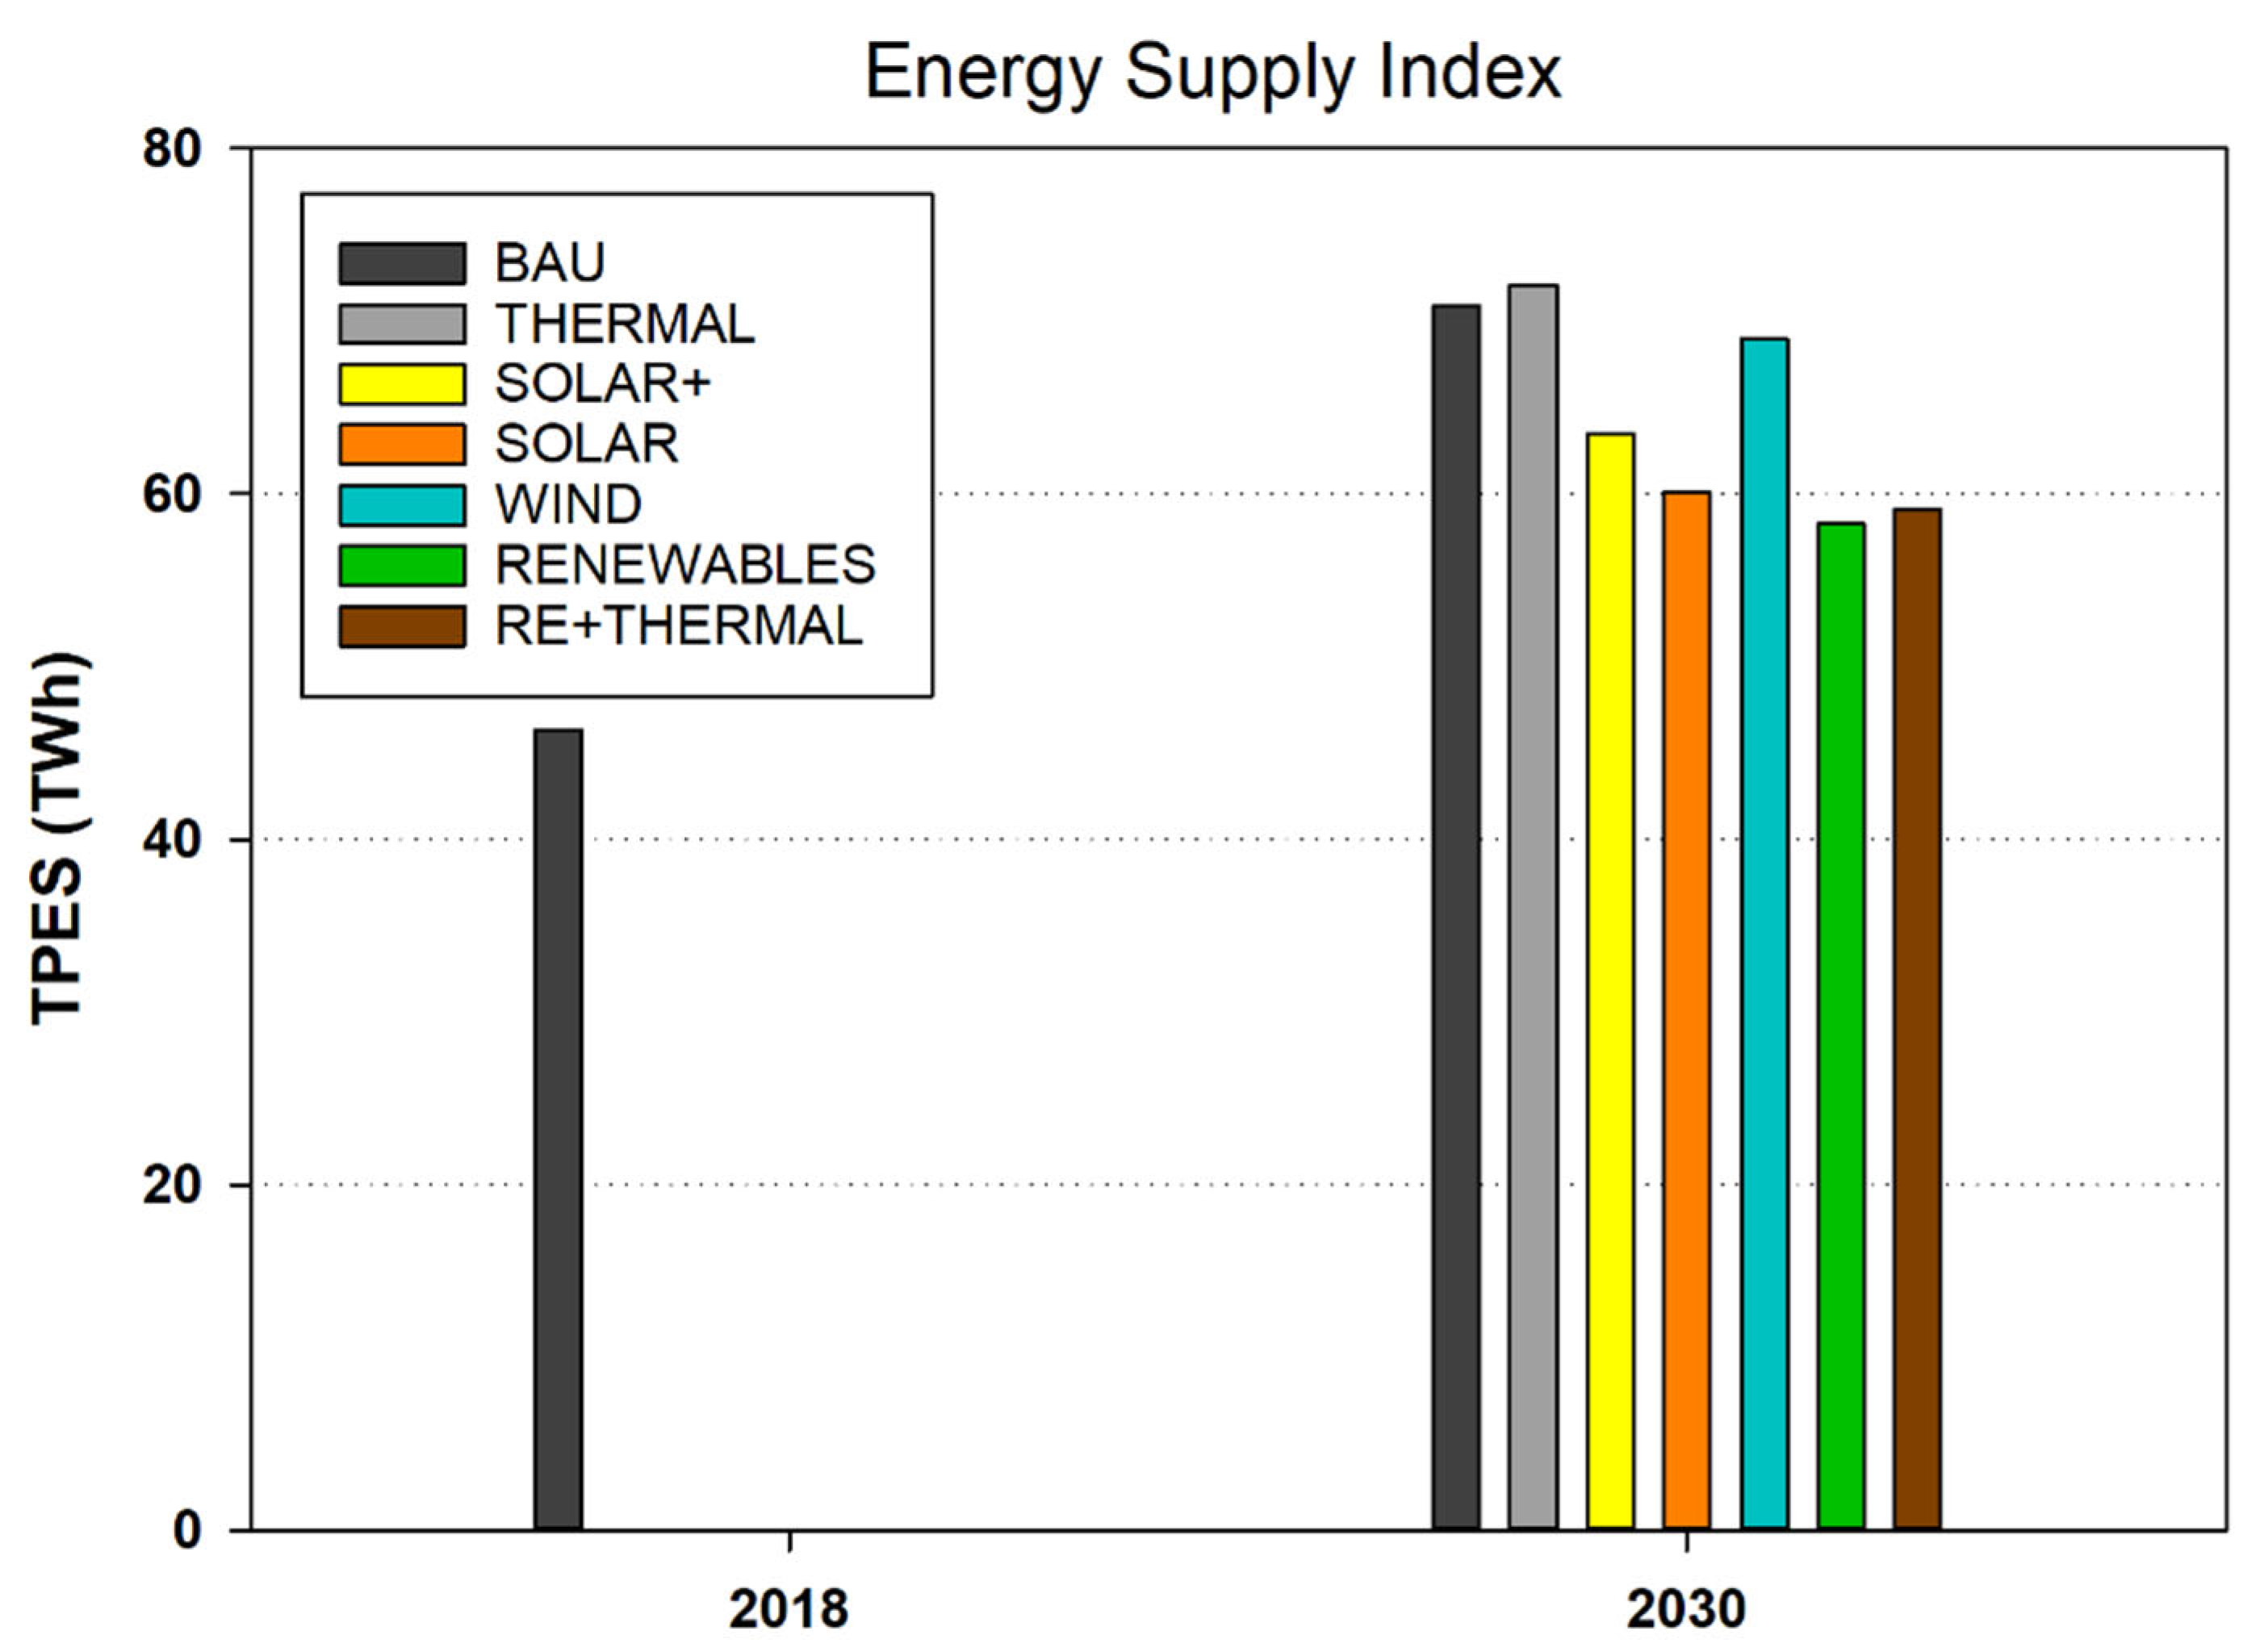
In order to understand the total amount of energy consumed, the energy supply index, in the form of Total Primary Energy Supply, is introduced (Figure 9). According to the defined index, the total amount of primary energy supply is different according to each scenario. This TPES is equivalent to 46.31 TWh year as of 2018, but by 2030, the amount will rise to 70.87 TWh year as a result of increased demand and affluence. The highest amount of TPES in 2030 is related to the second scenario and the lowest amount is related to the sixth scenario. This means that if the sixth scenario is used for energy supply in 2030, less production is needed, which is the most optimal state in this index. The high TPES in some scenarios is related to the type of scenario definition in addition to the environmental conditions.
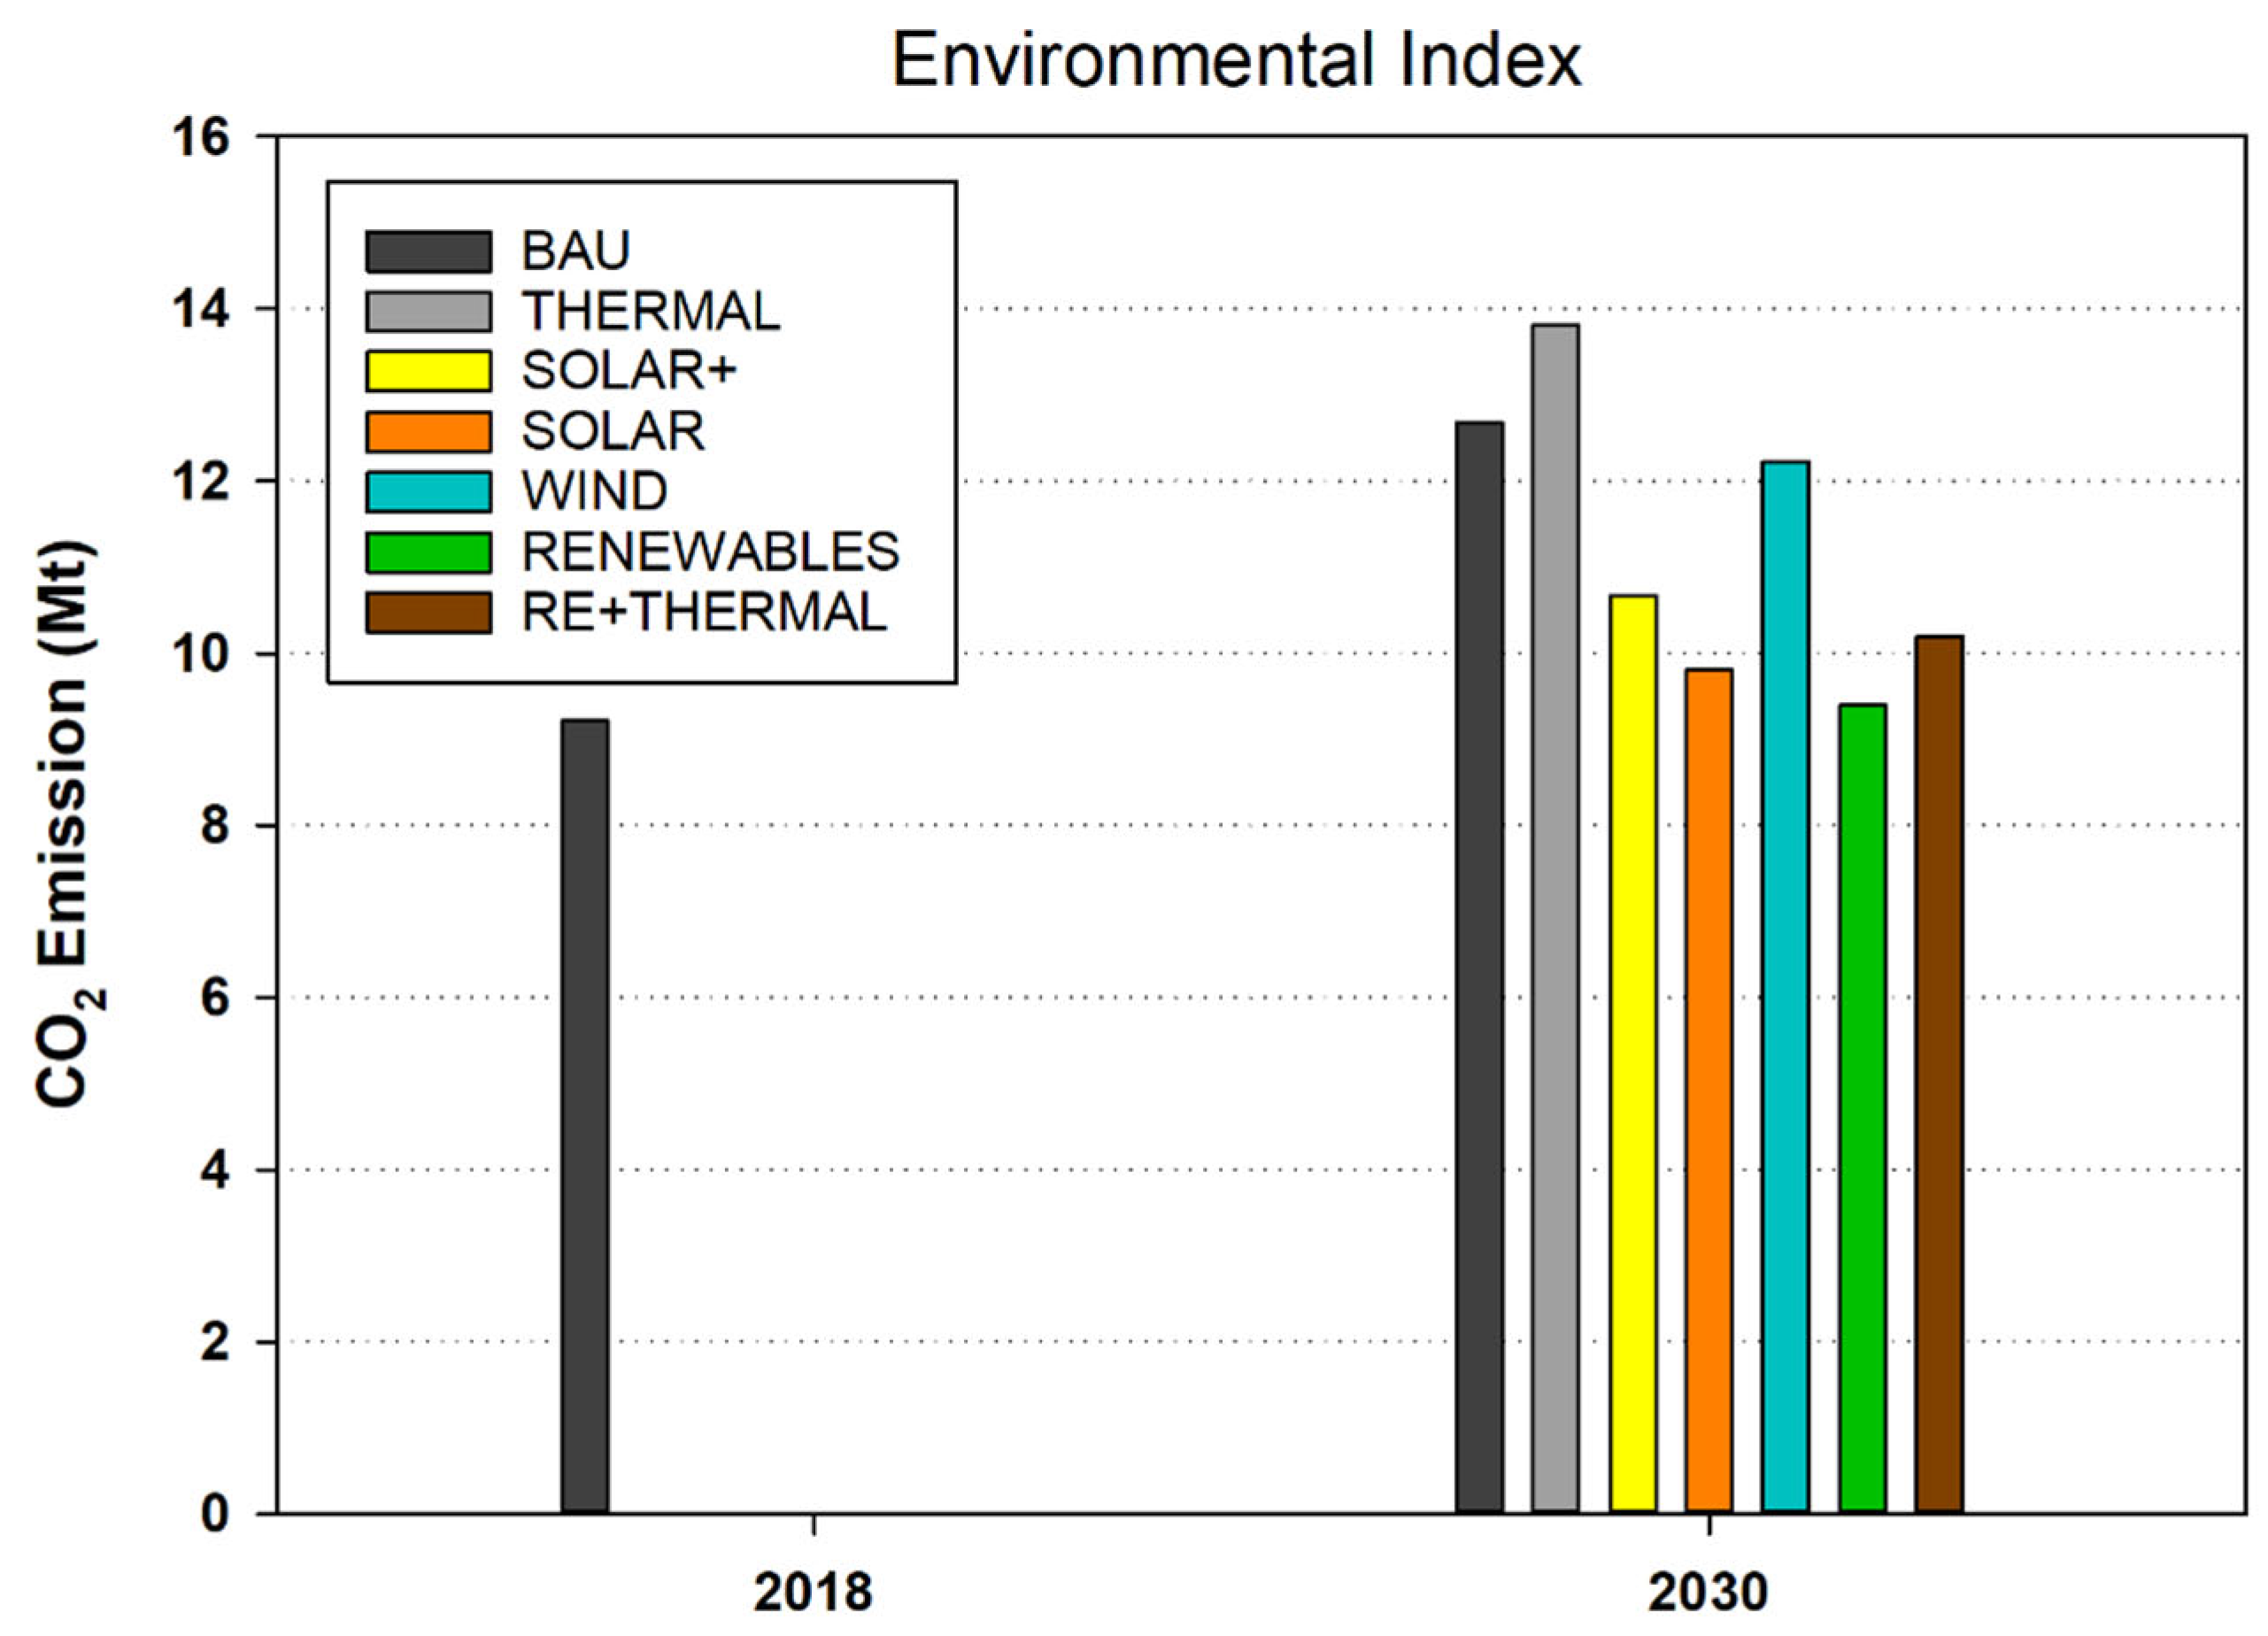
In the cycles of production, distribution, and consumption, a rise in energy production leads to an increase in the creation of pollutants. Therefore, one of the main problems of increasing production is the increase in the amount of environmental pollutants. The worry about rising pollution is lessened by using renewable energy. Renewable energy technologies produce significantly less pollution than other systems do. Figure 10 examines the emission of CO2 during the years 2018 and 2030. The emission rate of CO2 in 2018 is equal to 9.21 Mt, and considering the base case, this amount has increased to 12.68 Mt during the first scenario in 2030. It can be seen that the highest emission of CO2 in 2030 is related to the thermal power plant. Additionally, scenario 6′s combination of renewable energy sources has the lowest mode of CO2 emission, which is 9.36 Mt. This problem demonstrates that by increasing production, it is possible to limit the amount of CO2 released to a certain level.
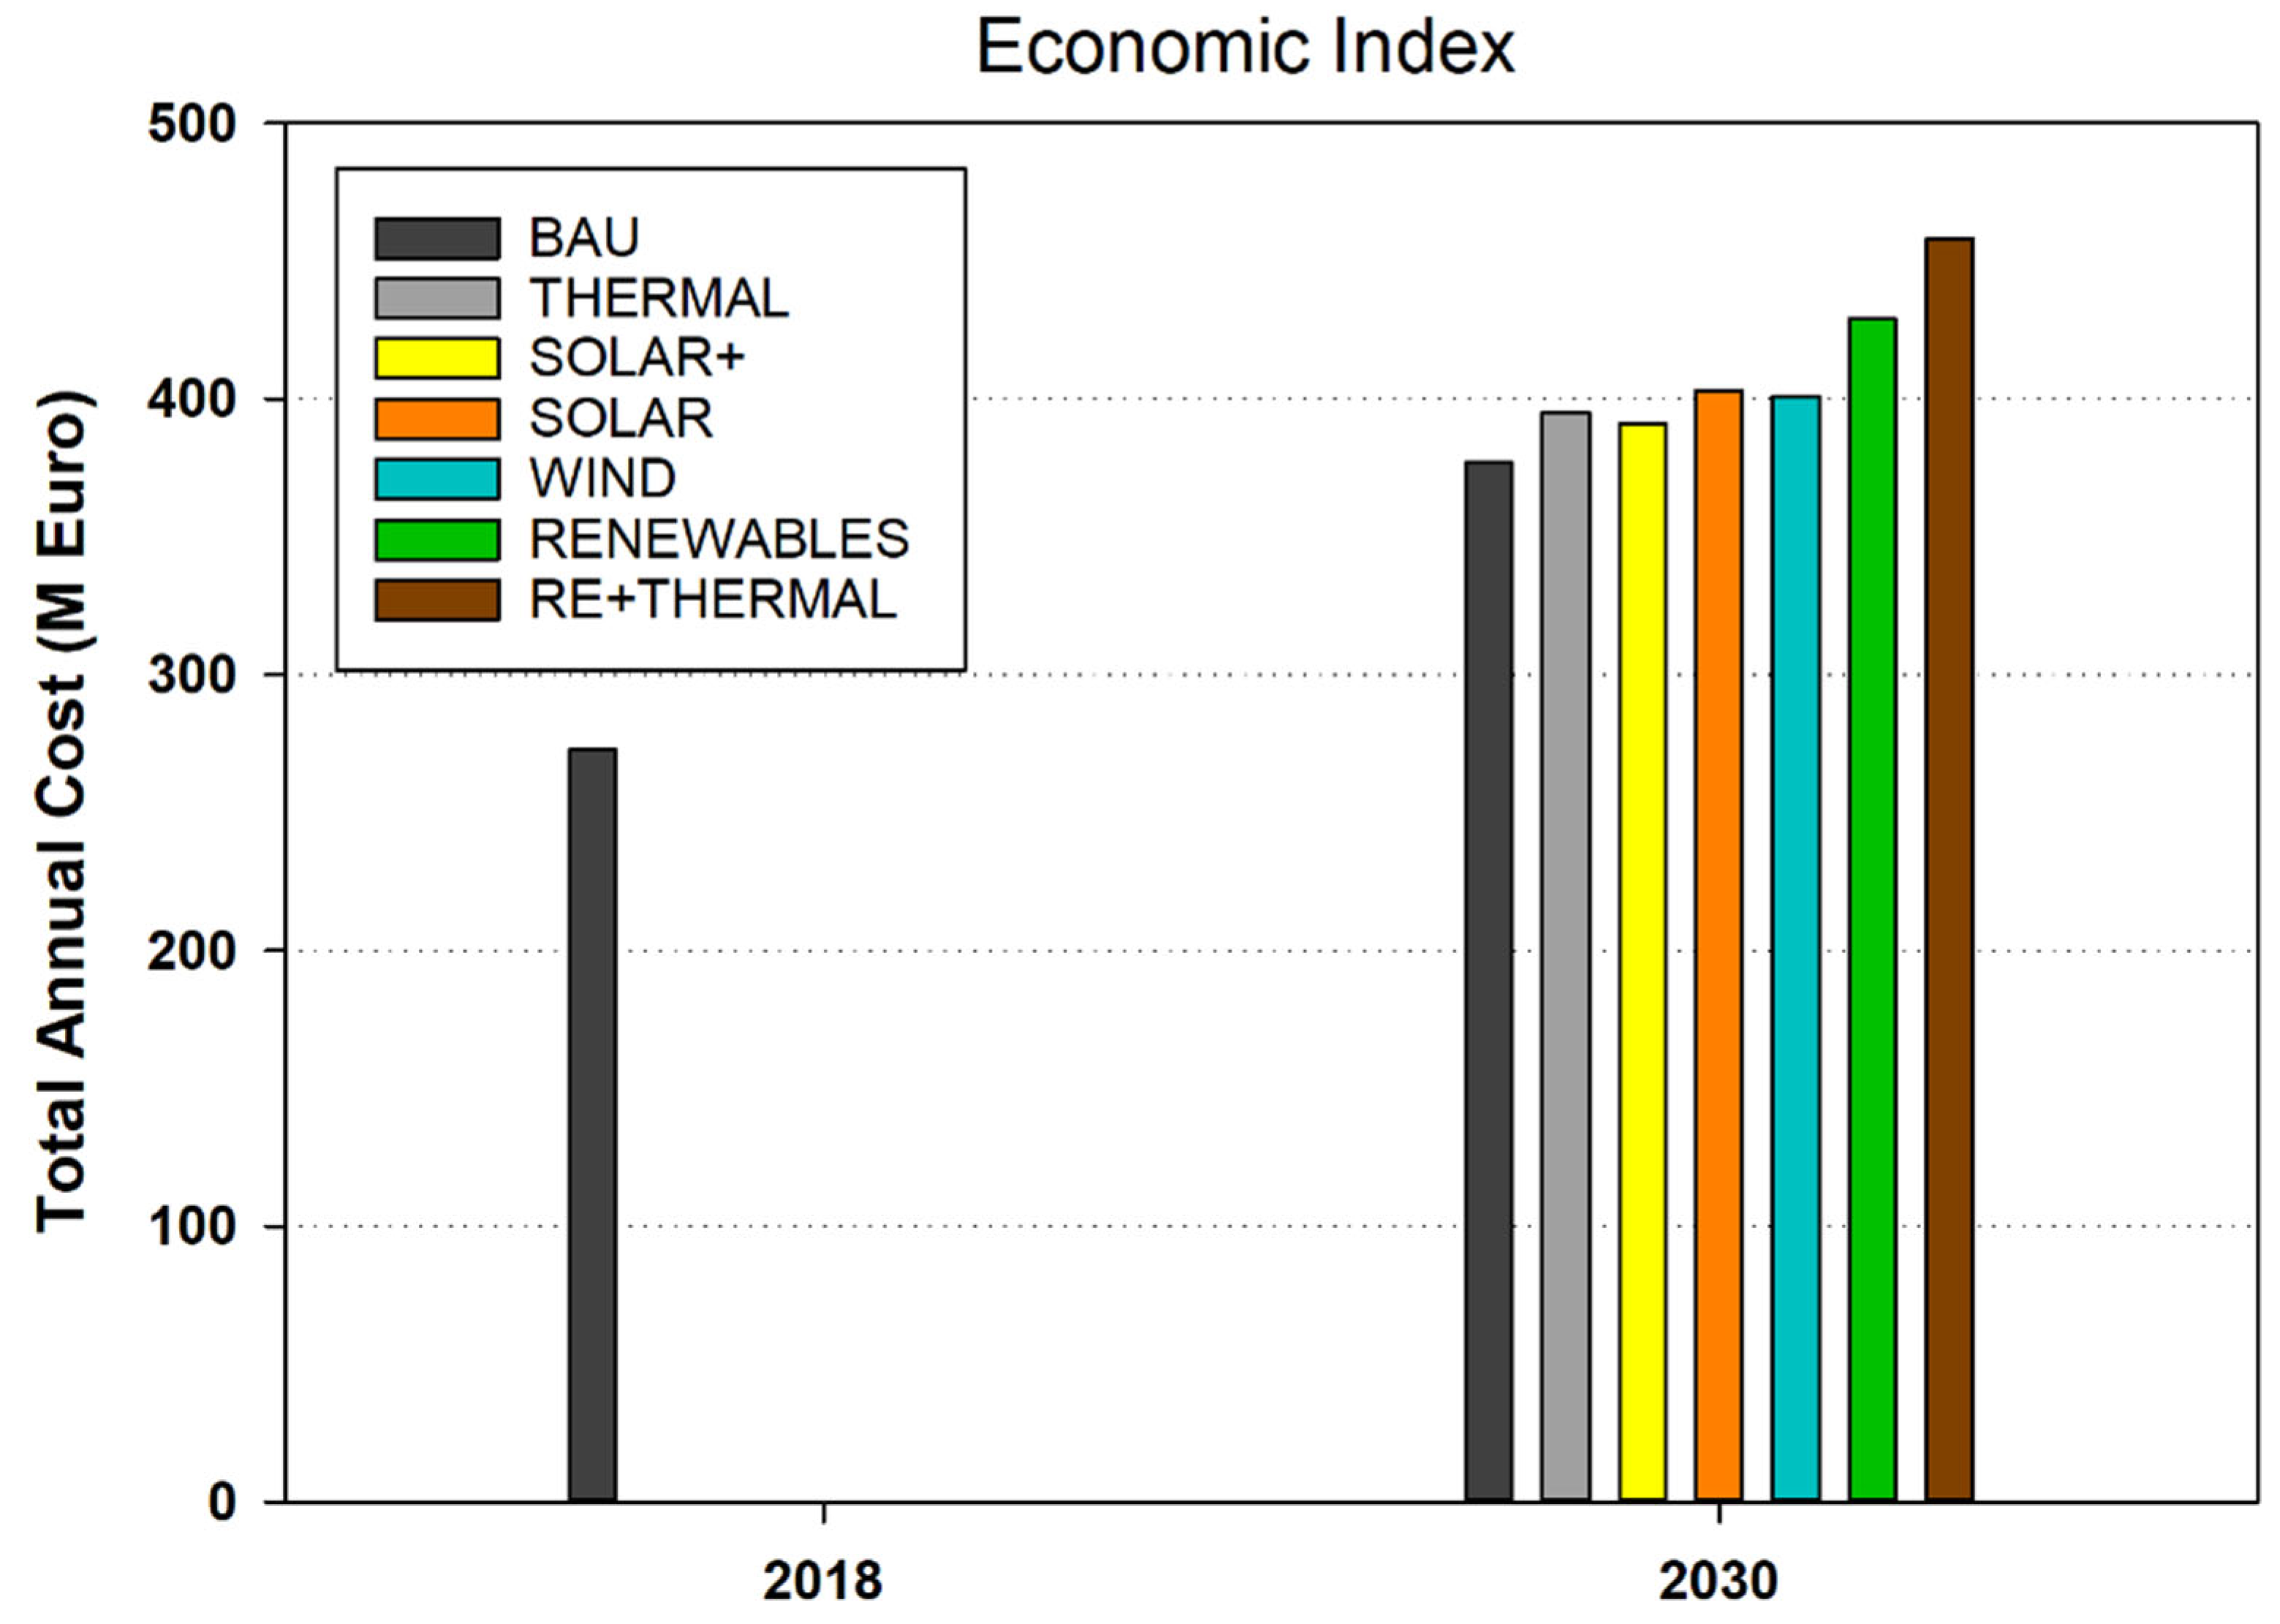
One of the indicators discussed is the economic index in the scenarios mentioned. For all scenarios in the economic index, costs including startup, maintenance, fixed costs, and imposed charges are among the factors taken into account. Figure 11 considers the economic index of all scenarios in 2030 plus the economic index of 2018. The findings indicate that the pace of cost growth has grown by 38.09 percent from 2018 to 2030. If expenses are based on 2018, it is evident that the first scenario will have the lowest annual cost in 2030, and the third scenario will have the lowest yearly cost for renewable energy. Therefore, paying attention to the level of supply of demand along with the cost can have a direct effect on the process of determining the feasibility of a scenario.
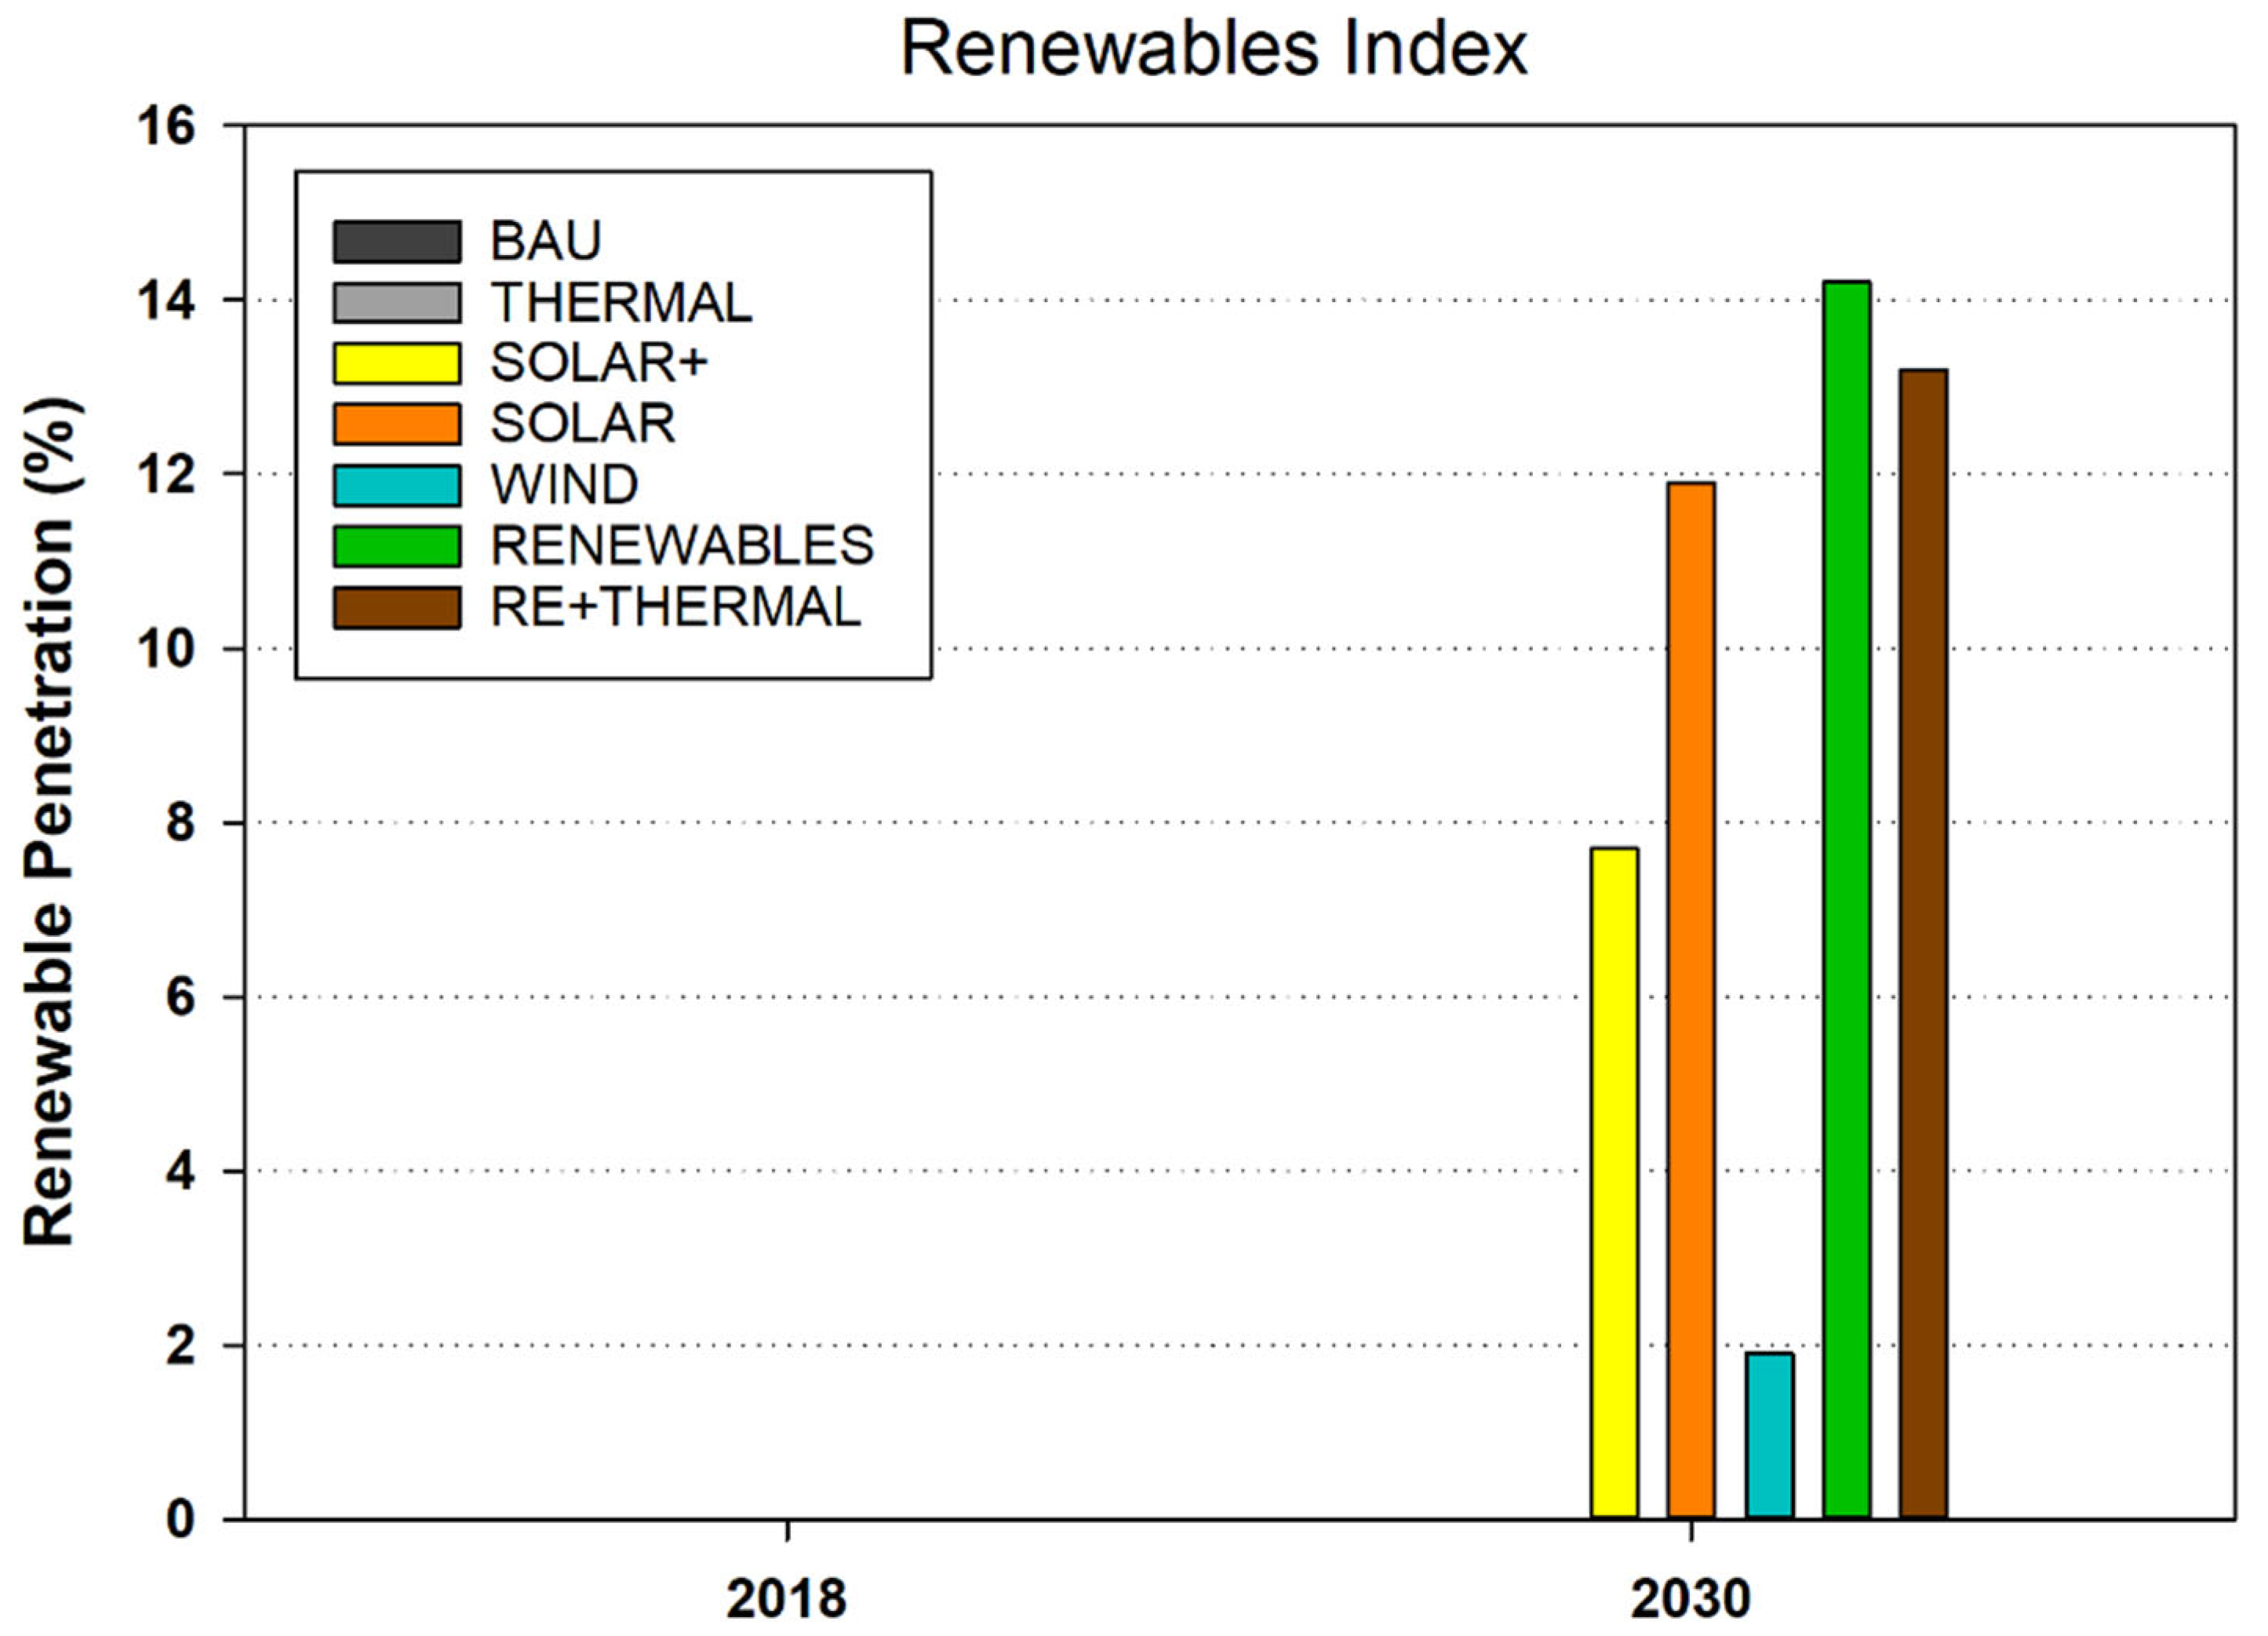
The renewable energy index, in the form of RES share of primary energy, is defined to take into account the profit of the energy system from renewable sources (Figure 12). Thanks to the large capacity specified for the sixth scenario, this index will be at a high level in 2030. It should be remembered that the production capacity and amount have a direct correlation with the renewable index. In such a way the difference in the quantity of renewable index can be noticed by increasing the amount of energy output by the solar system in scenarios 3 and 4. Furthermore, wind energy has a low percentage of renewable penetration due to the definition of low energy production.
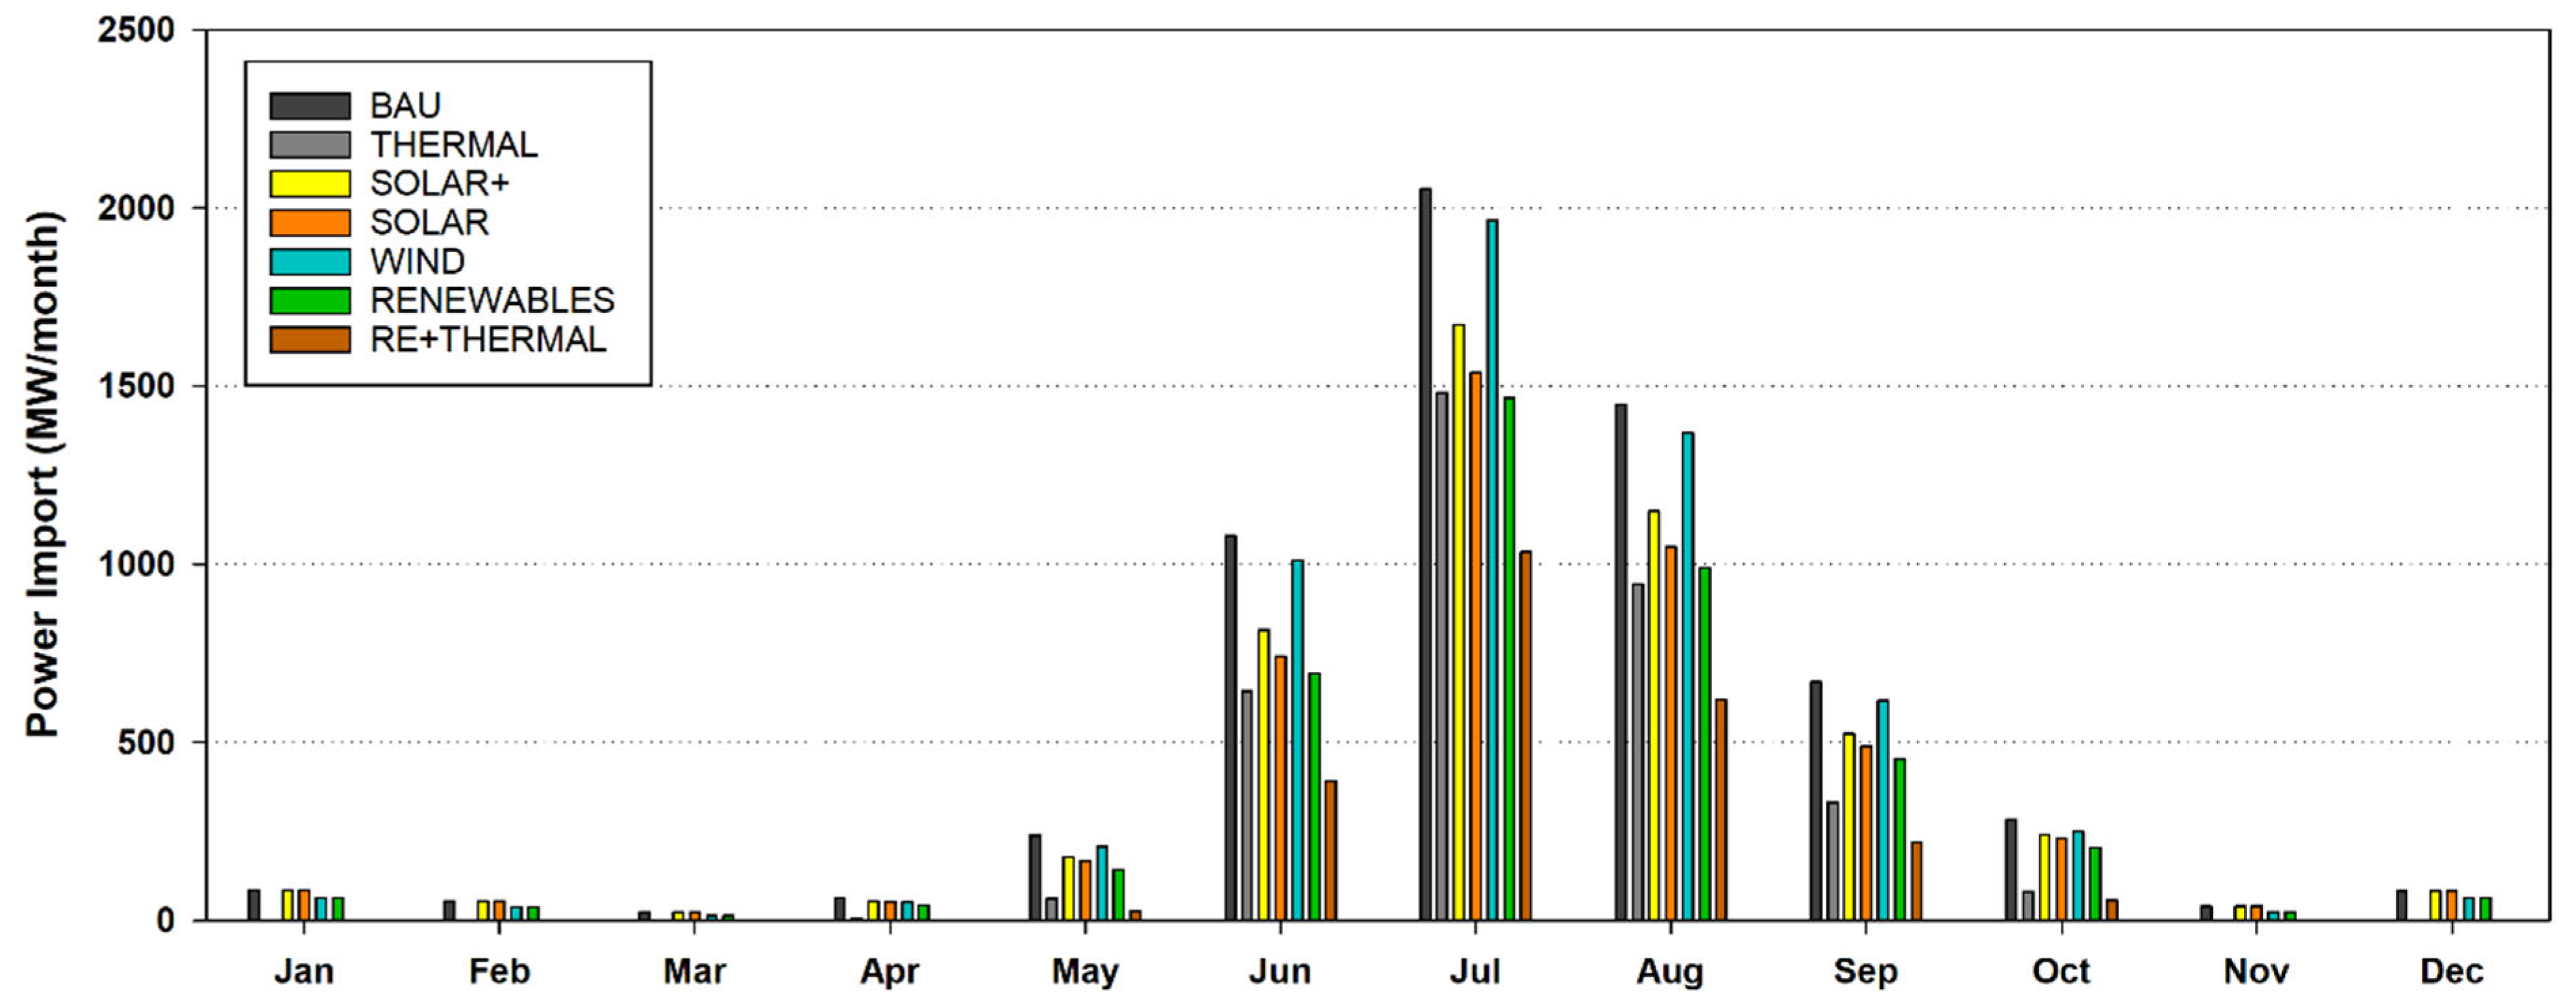
The amount of electricity supply in each time period of the year can be determined based on the amount of production and demand for electric energy in 2030. In Figure 13, it can be seen that the amount of power import in the first month of summer is at its maximum for all scenarios so that for the first scenario in July, it is equal to 2053 MW, but in March, it is equal to 23 MW. This difference in amount shows how the demand fluctuates over time, which changes how much supply is required. It can be seen that in 5 months of the year, in the THERMAL energy plan, power import is not necessary and its amount is considered as zero. In addition, the amount of power imported in the fifth scenario (WIND) is more than other renewable systems, so that this amount in July for fifth scenario is equal to 1965 MW, but for the sixth scenario (RENEWABLES) it is equal to 1467 MW.
As a result of the complex’s increased energy import, the amount of energy exported from the province is decreasing, with the result that during the summer, when energy demand is at its maximum, imports are rising and exports are falling dramatically. Figure 14 shows energy exports for a period of one year in 2030. In August, the amount of export for all scenarios is zero, and in April, it has its highest amount. In order to avoid using scenarios 1, 2, and 5 for export at any time of the year, it is important to keep in mind that there will never be enough output and that there will always be a sense of need. It is clear that the scenarios that had the largest share in energy import (Figure 13) will not have a share in energy export.
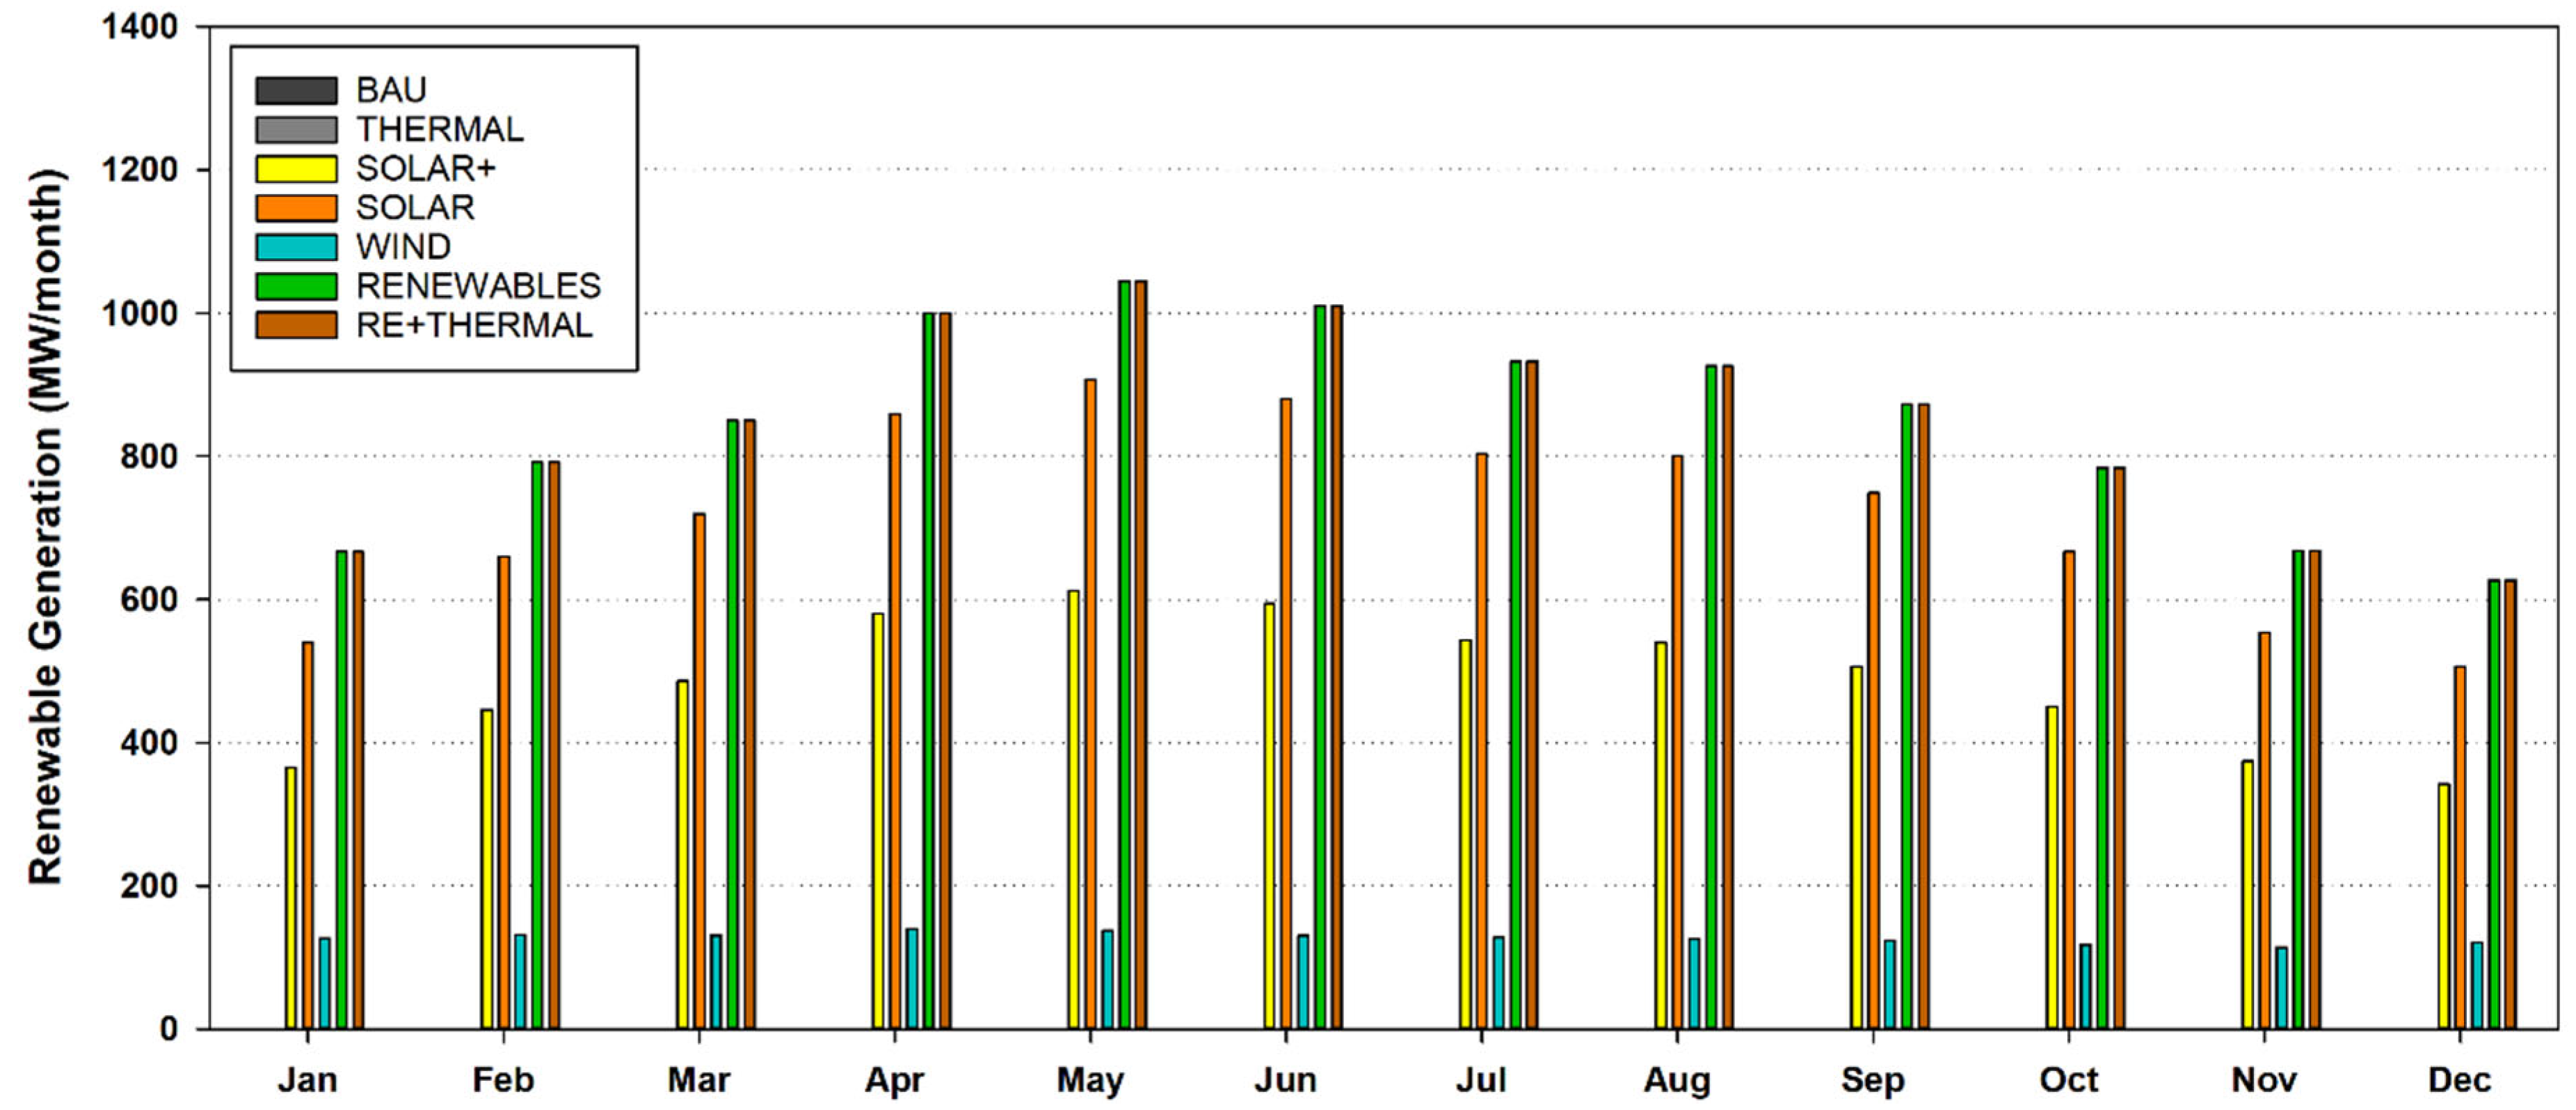
We can give Figure 15 for the monthly power generation of the renewable system projected for 2030, taking into account the minimal depreciation of renewable systems. It is obvious that the scenarios in which the solar system is specified (combined and non-combined) have the largest energy output at this time of year, notably in May, due to the increase in solar energy production in spring and summer. In addition, due to the importance of climatic conditions in the efficiency of photovoltaic panels, the amount of energy production is completely different in different months. According to the type of regional climate in the south of Iran and because of the stability of the wind flow, it produces an approximately constant amount of energy throughout the year, as shown in Figure 15 for scenario 5.
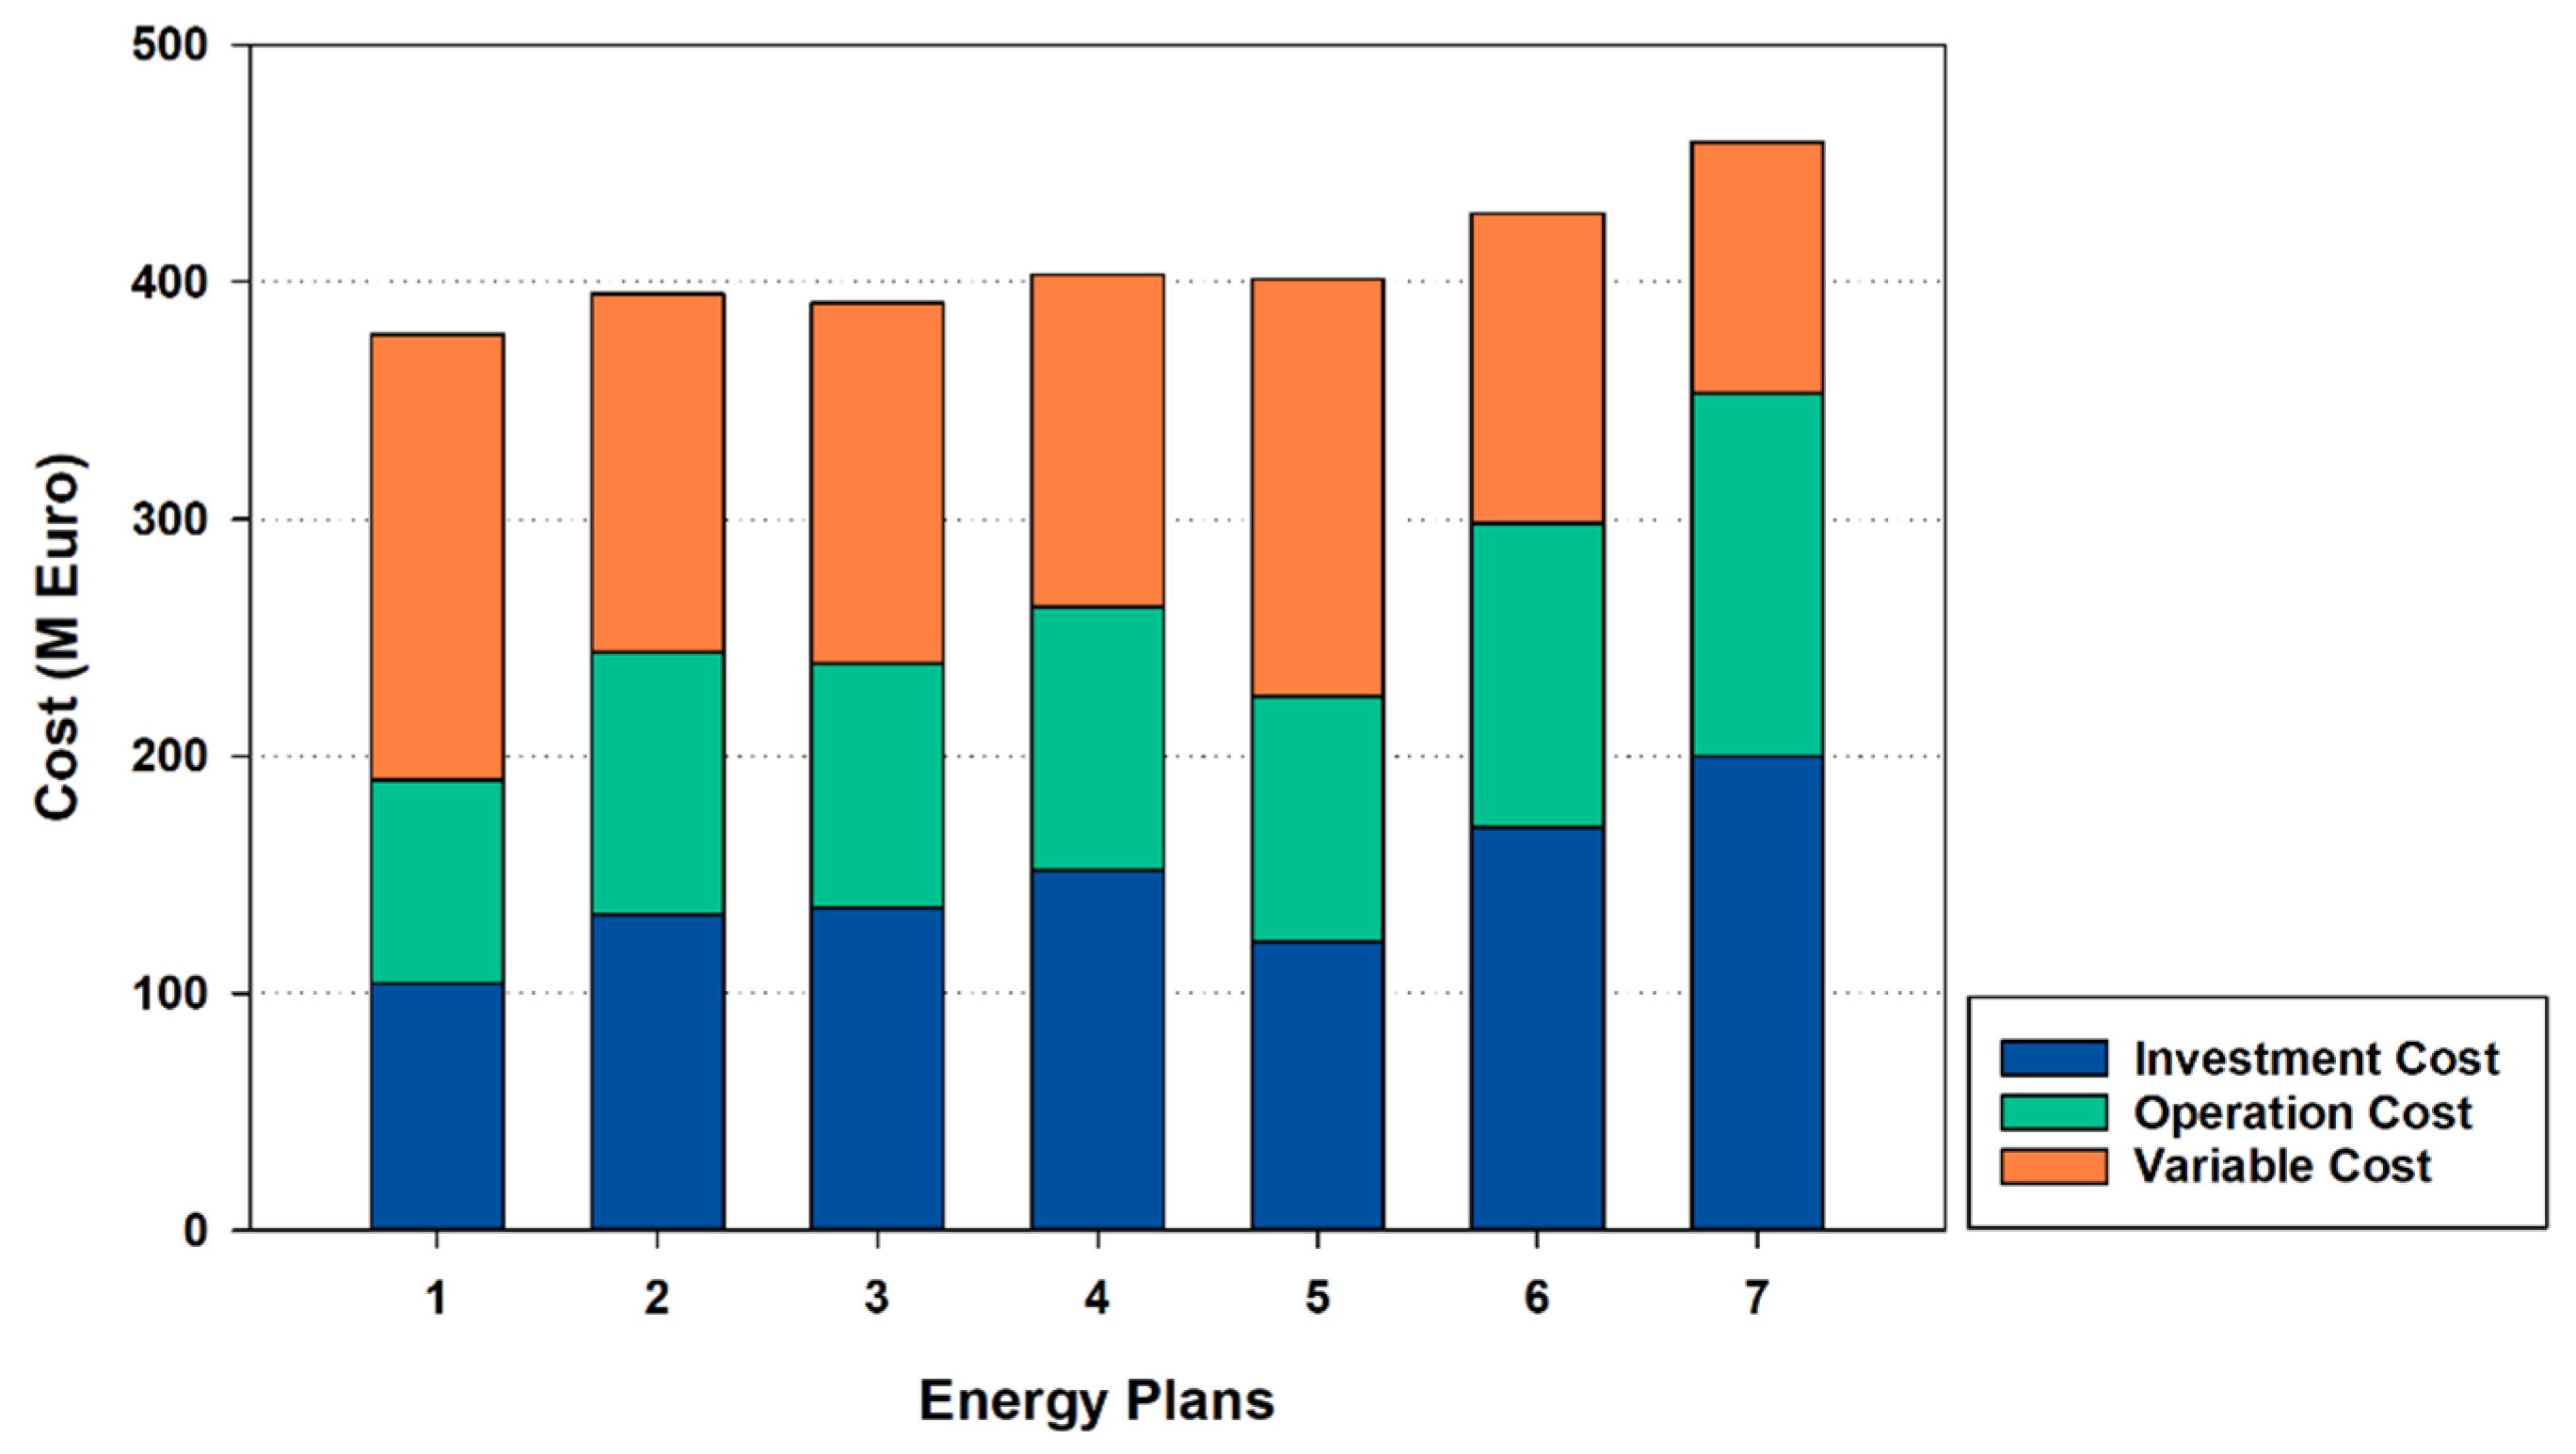
Keeping in mind the number of different costs for setting up and promoting the proposed scenarios, the applied costs are divided into three categories, namely, investment cost, operation cost, and variable cost (Figure 16). The investment cost is completely different in each sector and considering the work efficiency, the work process can be completely changed. The seventh scenario’s investment cost is the highest, but the system’s high efficiency can make it workable. On the other hand, the seventh scenario likewise has higher operational and structural costs than the other scenarios, but it also has present and ongoing costs as well as extra costs. In general, scenarios 1 to 5 are almost in the same category in terms of the final cost, and the first five scenarios can be used according to the potential and location of the region according to the type of investment. It should be kept in mind that some financial considerations have increased or decreased during each scenario. The first scenario, for instance, might be given with the lowest average investment and operational cost, but the variable costs in this scenario are higher than those in others. This should be kept in mind if the first scenario is adopted. One of the most important investment parameters is variable costs, which is a very effective option.

5.2. MCDM Results

5.2.1. Criteria Weighting

The results of energy modeling and the ranking of each index are reviewed in this section. One of the things that have been considered in the system is giving each parameter weight in accordance with its position and importance. The investigated decision matrix, which is derived from the outputs of energy modeling, is presented in Table 4. In order to properly weigh each system, the minimum and maximum are specified in each index. Furthermore, the first four indicators are of the cost type, and the last indicator is of the benefit type.
Equation (6) can be used to retrieve the correlation coefficient by writing the normalized decision matrix. The ratio of the covariance of two variables to the product of their standard deviation, which expresses the strength of the relationship between the two variables in each system, is the correlation coefficient between criteria and parameters. Table 5 examines the correlation coefficient between the five desired indicators for all scenarios.
Finally, after determining the correlation of the parameters, the weight of the attributes can be accessed by specifying the desired index ( C j ). Table 6 shows the final index and weights of the criteria. C j index has the highest value for annual cost and the lowest value for CO2 emission. The final weight for the annual cost is substantially high and more than in other circumstances due to the significant difference in the index C j . TAC, which is equal to 34.2% of the final weighting, comes in top place, while energy import, at 19.43%, is in second. Additionally, the next three places belong to RES, TPES, and CO2 criteria, respectively. It is obvious that the index C j has a direct effect on the final weight.

5.2.2. Energy Plans Ranking

The average solution can be found using Formula (11), and then the positive and negative distances can be calculated. The amount of positive and negative distance from the average solution is specified separately in Table 7. Additionally, the RES parameter in scenarios 1 and 2 are linked to the greatest value for NDA. Weighting can be applied to the positive and negative distances from the average solution based on the measured positive and negative distances. According to Table 8, the weighting has been carried out for all the scenarios mentioned in the investigated indicators and the final result can be obtained based on the weighting.
Table 9 displays the ranking and overall assessment score for the seven investigated energy plans. It can be seen that the seventh scenario is ranked first, followed by scenarios 1 and 2. The placement of Scenario 4 and Scenario 3 in the last positions suggests that these scenarios will not be appropriate for implementation to reach the target capacity in 2030. On the other hand, scenarios 7 and 1 will be the most appropriate scenarios to meet demand in 2030, but it should be remembered that scenario 7, a combined scenario, is extremely appropriate given the recent increase in CO2 emissions and loss in fossil fuel reserves.
Plan 7, which is chosen as the best scenario, has performed well in most indicators. In this scenario, since the largest amount of increase in energy production capacity has been taken into account, the least amount has been imported. In TPES, CO2 and RES indicators, this plan has taken the second place among the scenarios (after plan 6). Considering the amount of investment, it is obvious that it ranks last in terms of the TAC index. However, in a total of five indicators, this scenario has been chosen as the best. Despite the high weight of the TAC index, due to the prominent performance in other indices, Energy Plan 7 has won the first place. On the other hand, Plan 1 has won the second place. Although in this scenario, the value of RES and power import indices is quite unfavorable, due to the low value of TAC index, the second rank has been obtained. In this plan, the high weight of the TAC index has shown its effect. The first and second place of this ranking is an example of all-or-nothing policy.
Plan 2 and 6 are placed in the third and fourth positions, respectively. This shows the importance of comprehensive (and not partial) development in the construction of thermal or renewable power plant capacities. Plan 2 has performed better in Power Import and TAC indicators, and on the other hand, plan 6 has been higher in TPES, CO2 and RES indicators. In fact, these two scenarios have shown relatively balanced performance compared to each other.

6. Conclusions

The usage of various energies is growing in the modern world as a result of the relative population growth, technological advancements, and improved social conditions. Predictions about how to meet demand for the coming years have been made as a result of the rise in energy demand. Finding solutions for energy supply has become one of many research projects’ primary objectives due to concerns about the future availability of energy. The use of different technologies in the field of energy supply for different places has caused renewable energies to enter the field of competition. The purpose of this research is to predict the best energy supply solutions for Hormozgan province in 2030. In this study, the energy consumption of the province of Hormozgan is first projected for 2030 based on historical data using Holt-Winters model, and then it is analyzed by presenting scenarios to satisfy this need. The use of indicators such as CO2 emissions, the construction cost and even the annual consumption cost has helped in the comprehensive review of this research. The results obtained by the future energy planning, were assessed utilizing a multi-criteria decision-making approach. In this regard, the investigated future energy plans were reviewed and ranked based on determined criteria. The final results can be concluded as follows:
  • The usage of renewable energies is desired for the future and is receiving more attention as a result of the higher CO2 emissions in the non-renewable scenarios for 2030 compared to the renewable scenarios. However, using the sixth scenario, which combines solar and wind power, results in a large decrease in CO2 emissions. Thus, the greatest strategy for reducing environmental pollutants is to use a combination of renewable energy sources.
  • The annual cost was checked in the proposed scenarios and it was found that the best scenario in terms of cost (least expensive) is the first scenario, i.e., BAU (no investment and total import of power). The sixth and seventh scenarios are not good options to choose from because of the high annual cost.
  • The importance of production costs and energy supply strategies has increased as a result of the inclusion of the five indicators to make the study more thorough. Of all the indicators, the indicator with the greatest value—which is equivalent to 34.20 percent—is related to the total annual cost. However, the weighted range for the remaining indicators was between 14.46 and 19.43, demonstrating the major significance of the annual cost and the project’s economic component.
  • The seventh scenario is the best choice among the suggested scenarios when using the multi-criteria decision-making approach, taking into account the desired indicators and their weighting (the combination of thermal and renewable power plants in order to provide 5265 MW of electric energy for the desired demand in 2030). The use of this plan, keeping in mind the current pollution standards, can meet the energy needs of Hormozgan province for 2030. The first and second scenarios can be the next choices. Considering the applied policies and attention to efforts to use renewable systems, reducing the use of fossil and non-renewable resources should be considered important.
The most important limitation of this research was the validation of the primary data, which was solved by relying on the official sources of the Ministry of Energy of Iran. As an extension to this research, some ideas can be applied, including considering other energy resources within the energy modeling, using machine learning methods in order to forecast the energy demand, conducting the DEMATEL method in order to analyze the cause-effect trend, applying other methods of alternatives ranking and particularly fuzzy-based methods, etc.

Author Contributions

Conceptualization, M.H.G. and A.G.; Data curation, H.Y. and M.H.G.; Investigation, A.G.; Methodology, M.H.G.; Resources, H.Y.; Software, M.H.G.; Supervision, H.Y.; Validation, H.Y., M.H.G. and A.G.; Writing—original draft, A.G.; Writing—review & editing, M.H.G. All authors have read and agreed to the published version of the manuscript.

Funding

This research received no external funding.

Conflicts of Interest

The authors declare no conflict of interest.

Nomenclature

Abbreviations
MCDMMulti-criteria decision making
CCHPCombined cooling, heating and power
CHPCombined heating and power
GAGenetic algorithm
AHPAnalytical hierarchy process
EDASEvaluation based on Distance from Average Solution
CRITICThe CRiteria Importance Through Intercriteria Correlation
GHIGlobal horizontal irradiation
HWHolt–Winters
Variables and parameters
ttimestep
a t real value at timestep t
s t smoothed estimate at timestep t
b t trend value at timestep t
α level smoothing coefficient
β trend smoothing coefficient
r i j decision matrix’s element for the i t h alternative in the j t h attribute
x i j normalized decision matrix’s element
ρ j k correlation coefficient between k t h and j t h attributes
σ j standard deviation of j t h attributes
ζ j final weight of j t h attributes
A V j average solution of j t h attributes
PDApositive distances from average solution
NDAnegative distances from average solution
S P i weighted PDA for the i t h alternative
S N i weighted NDA for the i t h alternative
N S P i normalized weighted PDA for the i t h alternative
N S N i normalized weighted NDA for the i t h alternative
A S i Final appraisal score

References

  1. IEA. IRAN Electricity Consumption 2018. Available online: https://www.iea.org/data-and-statistics/data-browser?country=IRAN&fuel=Energy%20consumption&indicator=TotElecCons (accessed on 23 May 2022).
  2. Yousefi, H.; Ghodusinejad, M.; Noorollahi, Y. Analysis of the effects of flat and tiered pricing methods on the economic feasibility of residential photovoltaic systems. Tabriz J. Electr. Eng. 2018, 48, 943–950. [Google Scholar]
  3. Yousefi, H.; Ghodusinejad, M.H. Feasibility Study of a Hybrid Energy System for Emergency Off-grid Operating Conditions. Majlesi J. Electr. Eng. 2017, 11, 7–14. [Google Scholar]
  4. Kamali Saraji, M.; Streimikiene, D.; Kyriakopoulos, G.L. Fermatean fuzzy CRITIC-COPRAS method for evaluating the challenges to industry 4.0 adoption for a sustainable digital transformation. Sustainability 2021, 13, 9577. [Google Scholar] [CrossRef]
  5. Ezbakhe, F.; Pérez-Foguet, A. Decision analysis for sustainable development: The case of renewable energy planning under uncertainty. Eur. J. Oper. Res. 2021, 291, 601–613. [Google Scholar] [CrossRef]
  6. Wimmler, C.; Hejazi, G.; Fernandes, E.; Moreira, C.; Connors, S. Multi-criteria decision support methods for renewable energy systems on islands. J. Clean Energy Technol. 2015, 3, 185–195. [Google Scholar] [CrossRef] [Green Version]
  7. Katal, F.; Fazelpour, F. Multi-criteria evaluation and priority analysis of different types of existing power plants in Iran: An optimized energy planning system. Renew. Energy 2018, 120, 163–177. [Google Scholar] [CrossRef]
  8. Shorabeh, S.N.; Argany, M.; Rabiei, J.; Firozjaei, H.K.; Nematollahi, O. Potential assessment of multi-renewable energy farms establishment using spatial multi-criteria decision analysis: A case study and mapping in Iran. J. Clean. Prod. 2021, 295, 126318. [Google Scholar] [CrossRef]
  9. Yousefi, H.; Ghodusinejad, M.H.; Noorollahi, Y. GA/AHP-based optimal design of a hybrid CCHP system considering economy, energy and emission. Energy Build. 2017, 138, 309–317. [Google Scholar] [CrossRef]
  10. Ribeiro, F.; Ferreira, P.; Araújo, M. Evaluating future scenarios for the power generation sector using a Multi-Criteria Decision Analysis (MCDA) tool: The Portuguese case. Energy 2013, 52, 126–136. [Google Scholar] [CrossRef] [Green Version]
  11. Santos, M.; Ferreira, P.; Araújo, M.; Portugal-Pereira, J.; Lucena, A.; Schaeffer, R. Scenarios for the future Brazilian power sector based on a multi-criteria assessment. J. Clean. Prod. 2017, 167, 938–950. [Google Scholar] [CrossRef]
  12. Ghodusinejad, M.H.; Ghodrati, A.; Zahedi, R.; Yousefi, H. Multi-criteria modeling and assessment of PV system performance in different climate areas of Iran. Sustain. Energy Technol. Assess. 2022, 53, 102520. [Google Scholar] [CrossRef]
  13. Yazdani, M.; Torkayesh, A.E.; Santibanez-Gonzalez, E.D.; Otaghsara, S.K. Evaluation of renewable energy resources using integrated Shannon Entropy—EDAS model. Sustain. Oper. Comput. 2020, 1, 35–42. [Google Scholar] [CrossRef]
  14. Asante, D.; He, Z.; Adjei, N.O.; Asante, B. Exploring the barriers to renewable energy adoption utilising MULTIMOORA-EDAS method. Energy Policy 2020, 142, 111479. [Google Scholar] [CrossRef]
  15. Polat, G.; Bayhan, H.G. Selection of HVAC-AHU system supplier with environmental considerations using Fuzzy EDAS method. Int. J. Constr. Manag. 2022, 22, 1863–1871. [Google Scholar] [CrossRef]
  16. Behzad, M.; Zolfani, S.H.; Pamucar, D.; Behzad, M. A comparative assessment of solid waste management performance in the Nordic countries based on BWM-EDAS. J. Clean. Prod. 2020, 266, 122008. [Google Scholar] [CrossRef]
  17. Demirtas, O.; Derindag, O.F.; Zarali, F.; Ocal, O.; Aslan, A. Which renewable energy consumption is more efficient by fuzzy EDAS method based on PESTLE dimensions? Environ. Sci. Pollut. Res. 2021, 28, 36274–36287. [Google Scholar] [CrossRef]
  18. Witt, T.; Dumeier, M.; Geldermann, J. Combining scenario planning, energy system analysis, and multi-criteria analysis to develop and evaluate energy scenarios. J. Clean. Prod. 2020, 242, 118414. [Google Scholar] [CrossRef]
  19. Karatop, B.; Taşkan, B.; Adar, E.; Kubat, C. Decision analysis related to the renewable energy investments in Turkey based on a Fuzzy AHP-EDAS-Fuzzy FMEA approach. Comput. Ind. Eng. 2021, 151, 106958. [Google Scholar] [CrossRef]
  20. Yousefi, H.; Ghodusinejad, M.H.; Kasaeian, A. Multi-objective optimal component sizing of a hybrid ICE+ PV/T driven CCHP microgrid. Appl. Therm. Eng. 2017, 122, 126–138. [Google Scholar] [CrossRef]
  21. Hormozgan Province Statistical Yearbook; Iran Statistics Center: Tehran, Iran, 2018.
  22. Iran Energy Balance Report; Iran Ministry of Energy: Tehran, Iran, 2018.
  23. Noorollahi, Y.; Golshanfard, A.; Ansaripour, S.; Khaledi, A.; Shadi, M. Solar energy for sustainable heating and cooling energy system planning in arid climates. Energy 2021, 218, 119421. [Google Scholar] [CrossRef]
  24. Almutairi, K.; Hosseini Dehshiri, S.S.; Hosseini Dehshiri, S.J.; Mostafaeipour, A.; Issakhov, A.; Techato, K. Use of a hybrid wind—solar—diesel—battery energy system to power buildings in remote areas: A case study. Sustainability 2021, 13, 8764. [Google Scholar] [CrossRef]
  25. Nedaei, M. Wind resource assessment in Hormozgan province in Iran. Int. J. Sustain. Energy 2014, 33, 650–694. [Google Scholar] [CrossRef]
  26. Debnath, K.B.; Mourshed, M. Forecasting methods in energy planning models. Renew. Sustain. Energy Rev. 2018, 88, 297–325. [Google Scholar] [CrossRef] [Green Version]
  27. Subramanian, A.S.R.; Gundersen, T.; Adams, T.A. Modeling and simulation of energy systems: A review. Processes 2018, 6, 238. [Google Scholar] [CrossRef] [Green Version]
  28. Suganthi, L.; Samuel, A.A. Energy models for demand forecasting—A review. Renew. Sustain. Energy Rev. 2012, 16, 1223–1240. [Google Scholar] [CrossRef]
  29. Klemm, C.; Vennemann, P. Modeling and optimization of multi-energy systems in mixed-use districts: A review of existing methods and approaches. Renew. Sustain. Energy Rev. 2021, 135, 110206. [Google Scholar] [CrossRef]
  30. Farzaneh, H. Energy Systems Modeling; Springer: Berlin/Heidelberg, Germany, 2019. [Google Scholar]
  31. Ringkjøb, H.-K.; Haugan, P.M.; Solbrekke, I.M. A review of modelling tools for energy and electricity systems with large shares of variable renewables. Renew. Sustain. Energy Rev. 2018, 96, 440–459. [Google Scholar] [CrossRef]
  32. Lund, H.; Thellufsen, J.Z.; Østergaard, P.A.; Sorknæs, P.; Skov, I.R.; Mathiesen, B.V. EnergyPLAN–Advanced analysis of smart energy systems. Smart Energy 2021, 1, 100007. [Google Scholar] [CrossRef]
  33. Abdullah, L.; Najib, L. Sustainable energy planning decision using the intuitionistic fuzzy analytic hierarchy process: Choosing energy technology in Malaysia. Int. J. Sustain. Energy 2016, 35, 360–377. [Google Scholar] [CrossRef]
  34. Zolfani, S.H.; Ecer, F.; Pamučar, D.; Raslanas, S. Neighborhood selection for a newcomer via a novel BWM-based revised MAIRCA integrated model: A case from the Coquimbo-La Serena conurbation, Chile. Int. J. Strateg. Prop. Manag. 2020, 24, 102–118. [Google Scholar] [CrossRef] [Green Version]
  35. Torkayesh, A.E.; Ecer, F.; Pamucar, D.; Karamaşa, Ç. Comparative assessment of social sustainability performance: Integrated data-driven weighting system and CoCoSo model. Sustain. Cities Soc. 2021, 71, 102975. [Google Scholar] [CrossRef]
  36. Holt, C.C. Forecasting seasonals and trends by exponentially weighted moving averages. Int. J. Forecast. 2004, 20, 5–10. [Google Scholar] [CrossRef]
  37. Winters, P.R. Forecasting sales by exponentially weighted moving averages. Manag. Sci. 1960, 6, 324–342. [Google Scholar] [CrossRef]
  38. Hong, W.-C. Hybrid Intelligent Technologies in Energy Demand Forecasting; Springer: Berlin/Heidelberg, Germany, 2020. [Google Scholar]
  39. Hong, W.-C. Intelligent Energy Demand Forecasting; Springer: Berlin/Heidelberg, Germany, 2013. [Google Scholar]
  40. Satkin, M. High Potential Sites and Evaluation of the Country’s Renewable Energy Sources (Hormozgan Province); SATBA: Tehran, Iran, 2019.
  41. ATLAS, G.S. Hormozgan Solar Potential. 2020. Available online: https://globalsolaratlas.info/map?s=27.71981,56.335807&m=site&c=28.016226,55.612793,8 (accessed on 23 May 2022).
  42. Durmaz, E.; Akan, Ş.; Bakır, M. Service quality and financial performance analysis in low-cost airlines: An integrated multi-criteria quadrant application. Int. J. Econ. Bus. Res. 2020, 20, 168–191. [Google Scholar] [CrossRef]
  43. Alinezhad, A.; Khalili, J. New Methods and Applications in Multiple Attribute Decision Making (MADM); Springer: Berlin/Heidelberg, Germany, 2019; Volume 277. [Google Scholar]
Figure 1. Hormozgan province on a map of Iran.
Energies 15 09405 g001
Figure 2. Breakdown of sectors’ energy consumption in 2017 [22].
Energies 15 09405 g002
Figure 3. Heat map of annual: (a) solar GHI; (b) wind speed.
Energies 15 09405 g003aEnergies 15 09405 g003b
Figure 4. The research flow diagram.
Energies 15 09405 g004
Figure 5. Electricity consumption forecast using Holt–Winters.
Energies 15 09405 g005
Figure 6. The location of prospect solar and wind projects; red: wind projects; blue: solar projects.
Energies 15 09405 g006
Figure 8. Energy import as reliability index for base and forecast years.
Energies 15 09405 g008
Figure 9. Total primary energy supply as energy supply index for base and forecast years.
Energies 15 09405 g009
Figure 10. CO2 emission as environmental index for base and forecast years.
Energies 15 09405 g010
Figure 11. Total annual cost as economic index for base and forecast years.
Energies 15 09405 g011
Figure 12. Renewable penetration as renewables index for base and forecast years.
Energies 15 09405 g012
Figure 13. Monthly power import of the system for forecast year.
Energies 15 09405 g013
Figure 14. Monthly power export of the system for forecast year.
Energies 15 09405 g014
Figure 15. Monthly renewable power generation of the system for forecast year.
Energies 15 09405 g015
Figure 16. Total cost breakdown of seven energy plans for forecast year.
Energies 15 09405 g016
Table 1. The details of Hormozgan powerplants and their installed capacity [22].
Powerplant OwnerPowerplant TechnologyTotal Capacity (MW)
SteamGasDiesel
Ministry of Energy12801871.866.13217.9
Major Industries01600160
Private sector0119.60119.6
3497.5
Table 2. Input parameters for energy modeling [23].
ParameterValue
Powerplant efficiency (%)35
Natural gas CO2 content (kg/Gj)57.9
CO2 price (Euro/ton)7
Electricity import price (Euro/MWh)24
Table 3. Cost details for different power generation technologies [23].
TechnologyInvestment CostLifetimeO&M Cost
(% of Inv.)
Thermal powerplant0.74253.32
Solar PV0.69401.28
Wind1.2303.2
Table 4. The results of energy modeling as the initial decision matrix.
Power Import (TWh)TPES
(TWh)
CO2
(Mt)
TAC
(M Euro)
RES
(%)
Decision MatrixPlan14.5170.8712.683770
Plan22.6272.0713.813950
Plan33.6263.510.673917.7
Plan43.3560.079.8140311.9
Plan54.176912.224011.9
Plan63.0958.259.3942914.2
Plan71.7359.1110.1945813.2
Criteria Analysismin1.7358.259.393770
max4.5172.0713.8145814.2
Criteria typeCostCostCostCostBenefit
Table 5. Correlation coefficient between the criteria.
Power ImportTPESCO2TACRES
Power Import1.00000.31150.1458−0.60520.3851
TPES0.31151.00000.9852−0.70540.9960
CO20.14580.98521.0000−0.61850.9671
TAC−0.6052−0.7054−0.61851.0000−0.7385
RES0.38510.99600.9671−0.73851.0000
Table 6. σ j , Cj and final weights of the criteria.
Power ImportTPESCO2TACRES
Std. Dev. ( σ j )0.41400.52000.46000.41100.5441
The Index (Cj)1.55761.25471.15932.74041.3006
Final Weights (%Wj)19.439715.658414.468634.201416.2319
Table 7. Positive and negative distance from average solution.
Power ImportTPESCO2TACRES
PDAPlan10000.07530
Plan20.2057000.03120
Plan300.01850.05180.04100.1022
Plan400.07150.12820.01160.7035
Plan50000.01650
Plan60.06320.09960.165501.0327
Plan70.47550.08630.094500.8896
NDAPlan10.36730.09540.126801
Plan200.11400.227201
Plan30.09740000
Plan40.01560000
Plan50.26420.06650.085900.7280
Plan60000.05220
Plan70000.12330
Table 8. Weighted PDA and NDA for seven energy plans.
Power ImportTPESCO2TACRES
Weighted
PDA
Plan10000.02580
Plan20.0400000.01070
Plan300.00290.00750.01400.0166
Plan400.01120.01860.00400.1142
Plan50000.00560
Plan60.01230.01560.024000.1676
Plan70.09240.01350.013700.1444
Weighted
NDA
Plan10.07140.01490.018300.1623
Plan200.01780.032900.1623
Plan30.01890000
Plan40.00300000
Plan50.05140.01040.012400.1182
Plan60000.01790
Plan70000.04220
Table 9. Final appraisal score and ranks for seven energy plans.
RankEnergy PlanAppraisal Score
1Plan70.57899
2Plan10.54879
3Plan20.49489
4Plan60.44908
5Plan50.37092
6Plan40.28575
7Plan30.11313
Publisher’s Note: MDPI stays neutral with regard to jurisdictional claims in published maps and institutional affiliations.