
Multi-Criteria Future Energy System Planning and Analysis for Hot Arid Areas of Iran


Abstract
:1. Introduction
2. Research Framework
2.1. Study Area
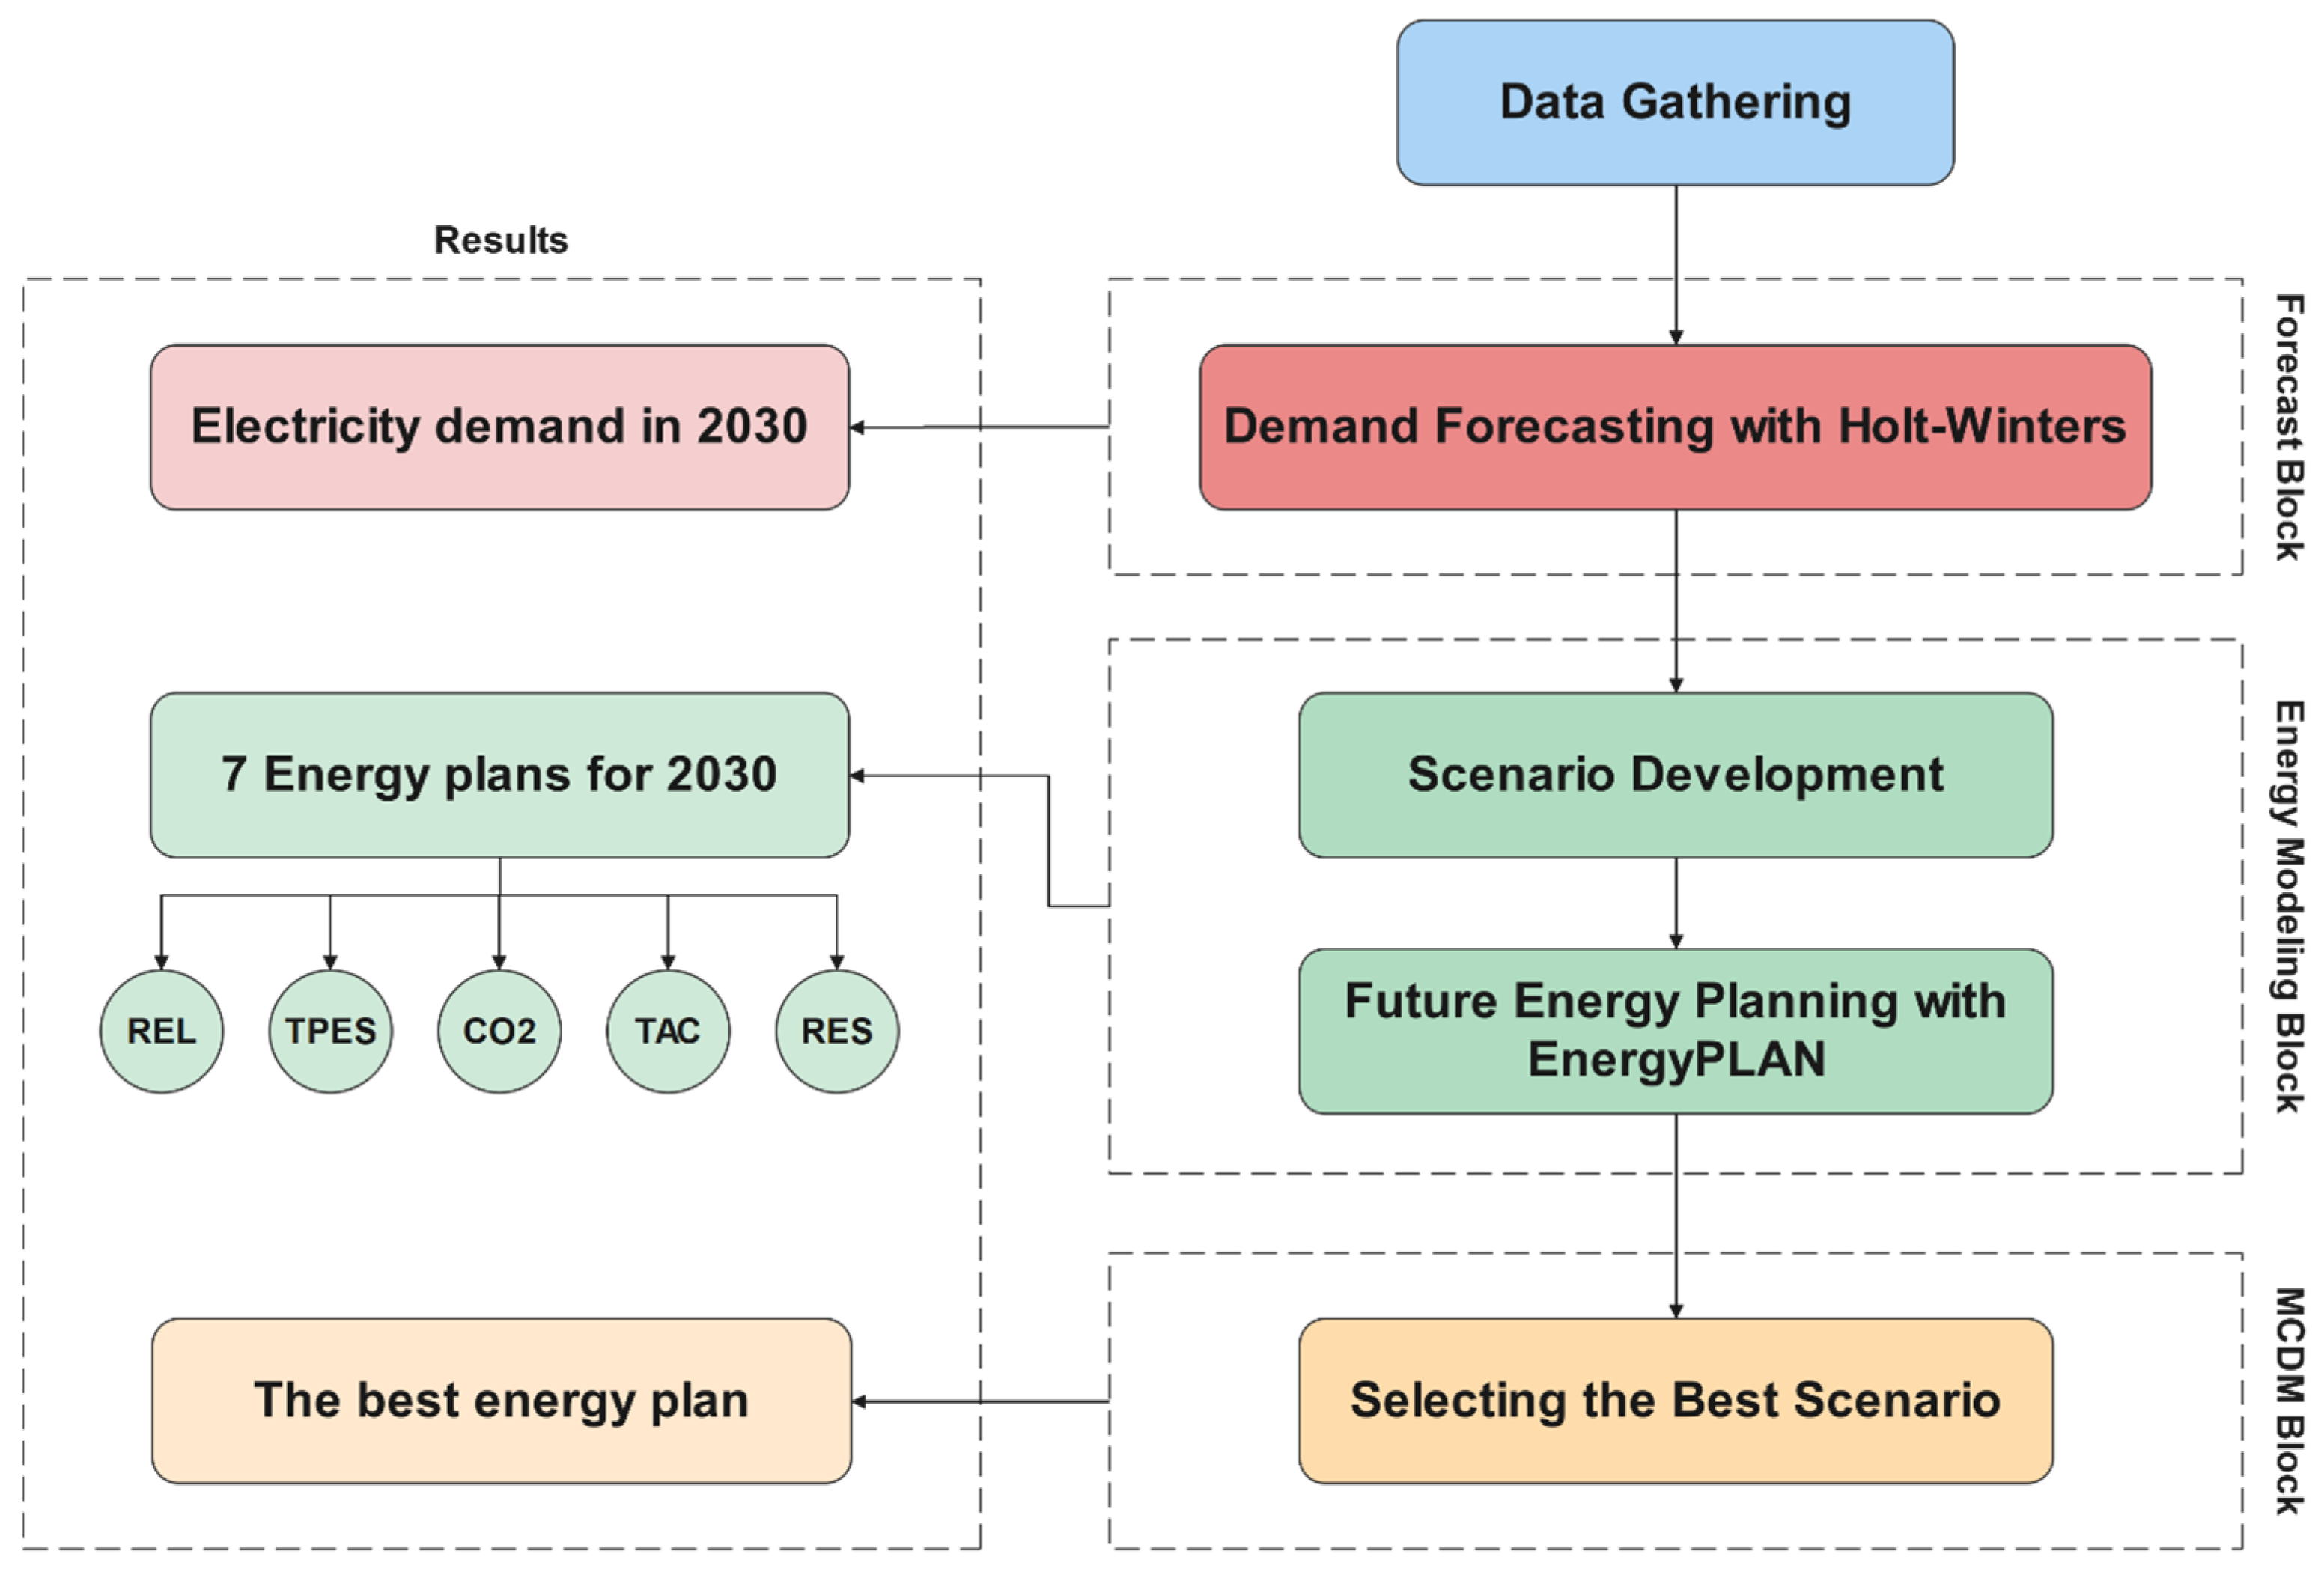
2.2. Study Process
- Forecast block
- Energy modeling block
- Decision making block
2.2.1. Forecast Block
2.2.2. Energy Modeling Block
2.2.3. Decision Making Block
3. Demand Forecasting
4. Multi-Criteria Energy Planning
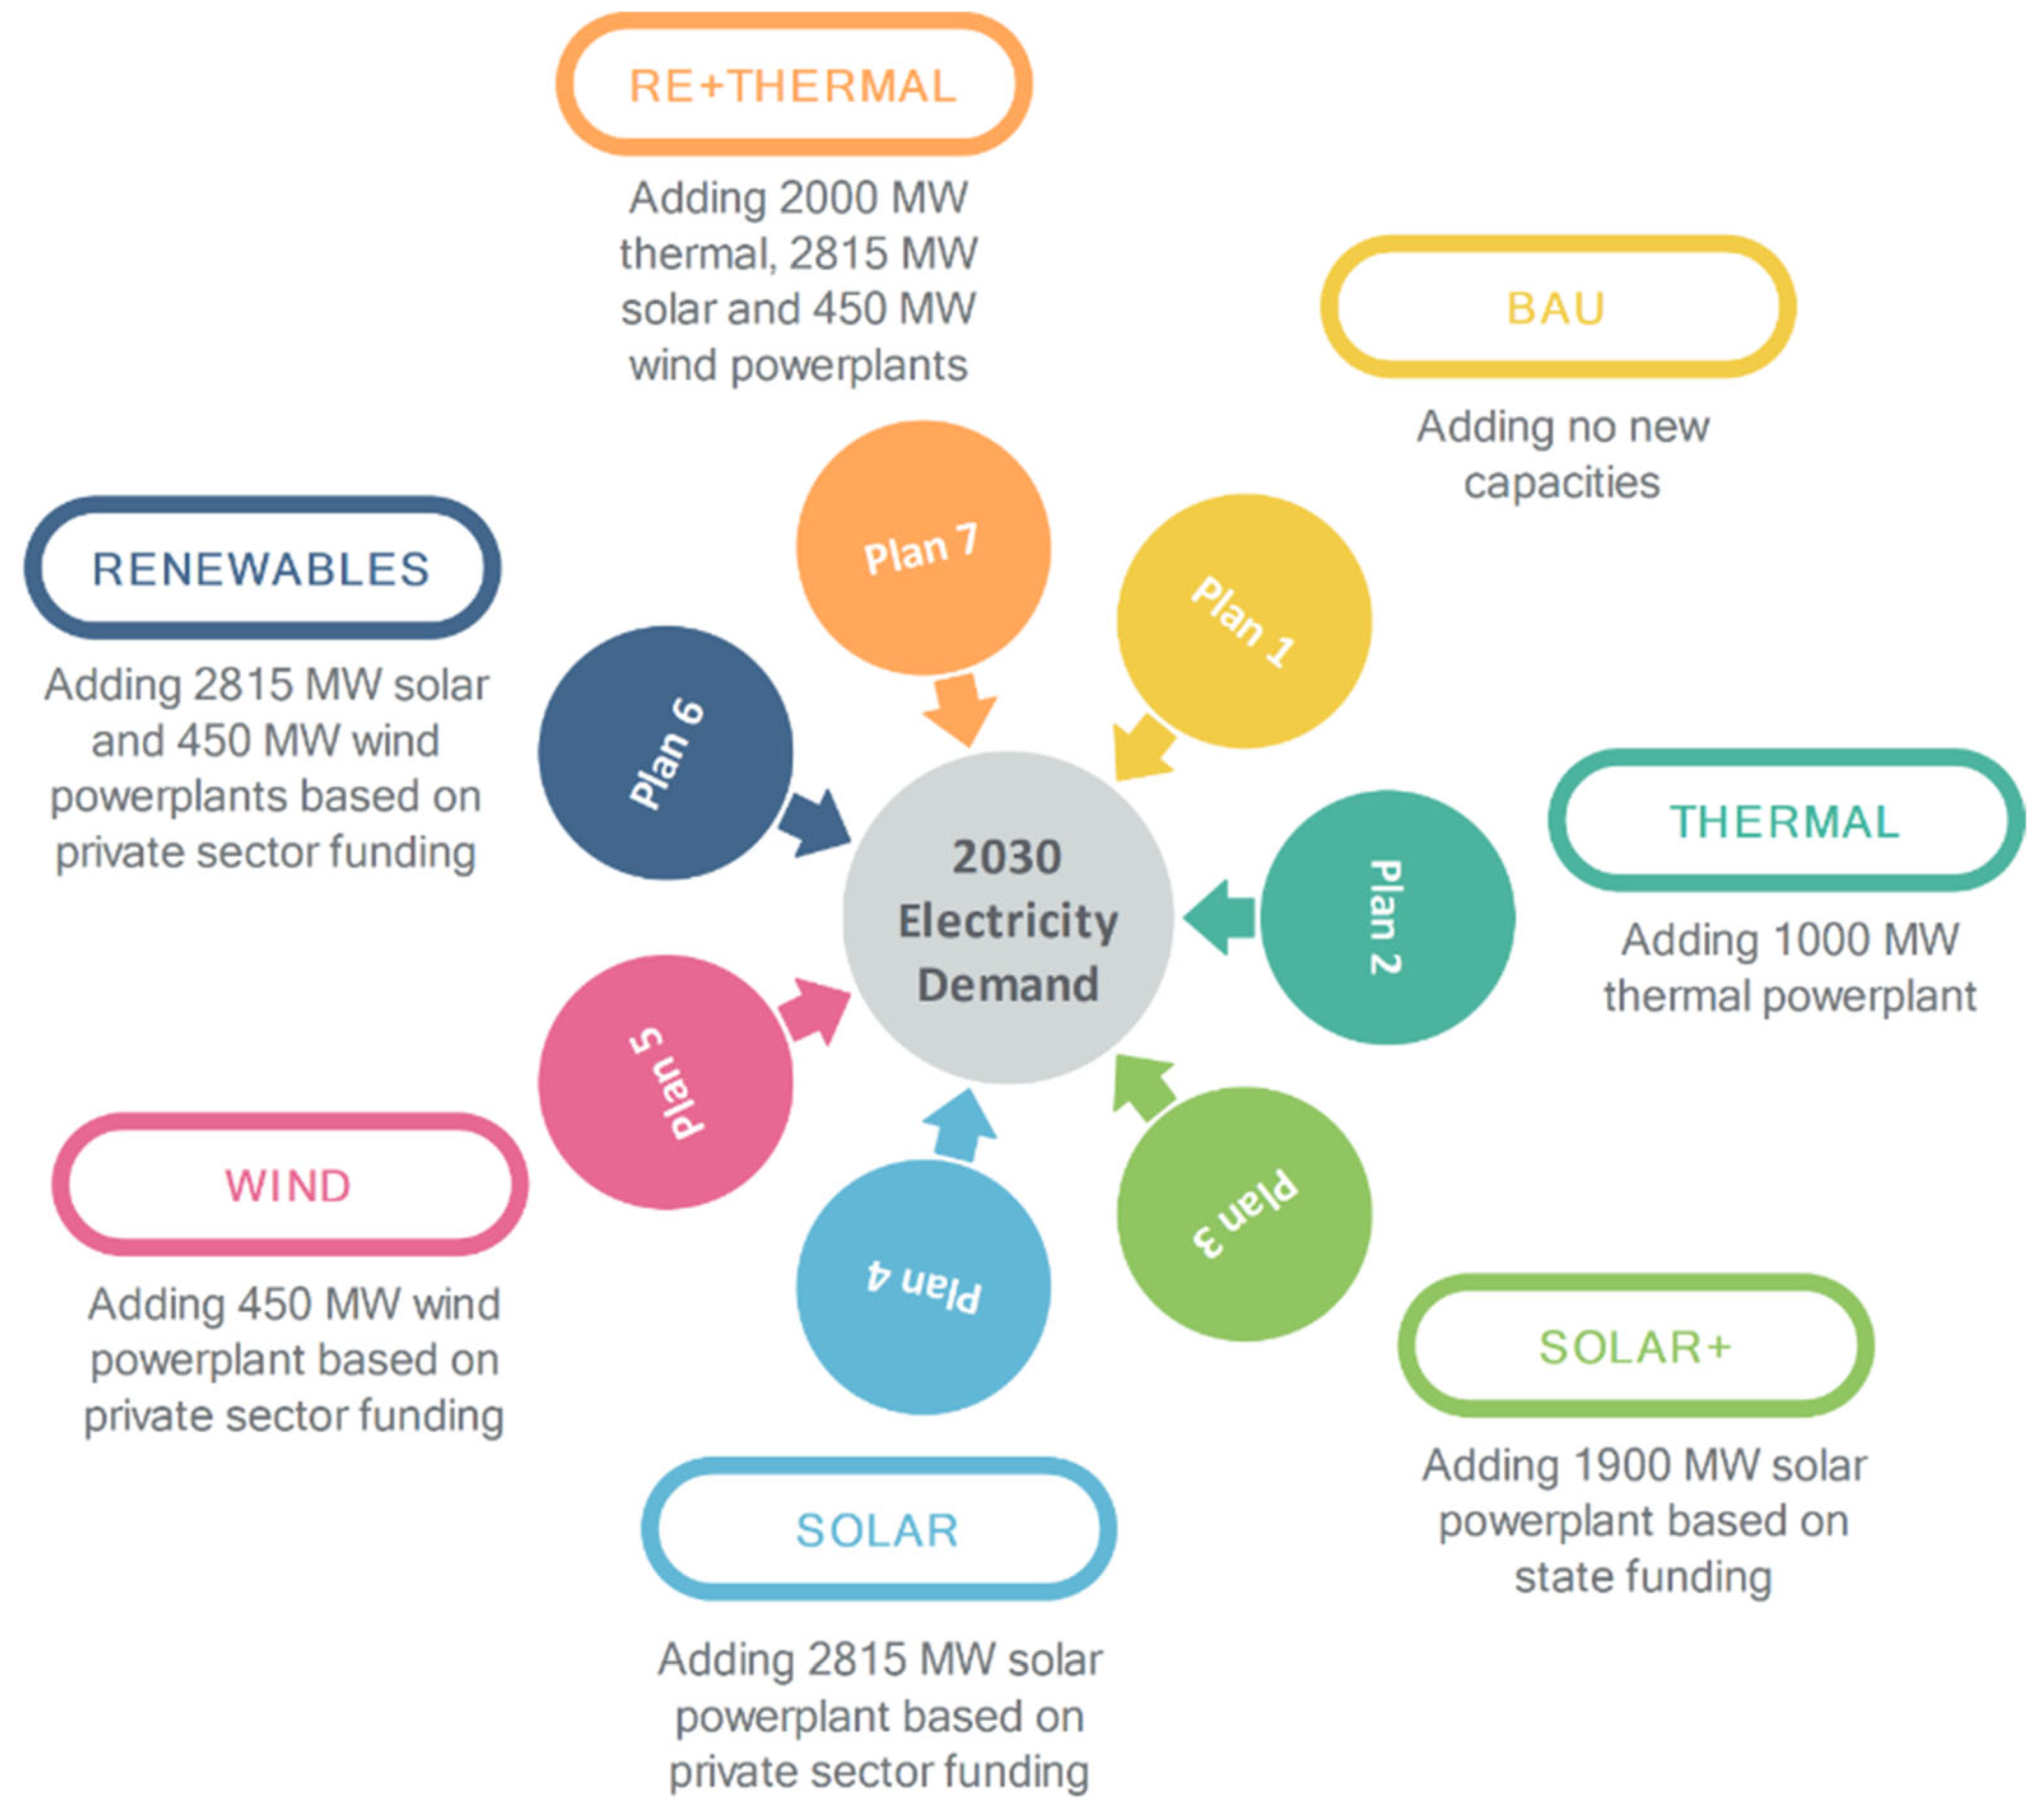
4.1. Scenario Development
- Plan 1 (BAU): examines the lack of capacity increase considering Business-As-Usual. In this scenario, the lack of capacity increase has been investigated in order to reduce construction costs and importing power.
- Plan 2 (THERMAL): The second scenario involves increasing the thermal power plant’s capacity by as much as 1000 MW and, if necessary, optimizing it through cost-control measures.
- Plan 3 (SOLAR+): According to SATBA studies, a solar power plant development plan with a capacity of 1900 MW (based on the potential of Hormozgan) has been developed. This development plan is based on the governmental financial resources and investments. This plan considers that this development plan will be implemented by the Iranian government by 2030.
- Plan 4 (SOLAR): In this plan, it is assumed that instead of government investment in the development of solar energy, the permits for the construction of solar power plants by the private sector will be completed and all expected power plants will be put into operation by 2030 (see Figure 6).
- Plan 5 (WIND): 450 MW of electric energy will be provided by the wind power plant (based on the current wind power plant construction permits), and the financial resources will also be provided by the private sector.
- Plan 6 (RENEWABLES): The sixth scenario involves the private sector increasing renewable energy sources such as wind and solar in accordance with potential and geographic location. In other words, all the potential capacities of wind and solar power plants shown in Figure 6 should be put into operation by 2030.
- Plan 7 (RE + THERMAL): This considers the combination of thermal and renewable power plants in order to provide 5265 MW of electric energy for the desired demand in 2030. In other words, it is a combination of the second and sixth scenarios.
4.2. Multi-Criteria Analysis
4.2.1. CRITIC
Step 1: Forming the Decision Matrix
Step 2: The Normalized Decision Matrix
Step 3: The Correlation Coefficient
Step 4: The Index (C)
Step 5: The Weight of Attributes
4.2.2. EDAS
- Step 1: The average solution
- Step 2: The positive and negative distances
- Step 3: The weighted PDA and NDA
- Step 4: The weighted normalized PDA and NDA
- Step 5: The Appraisal Score and final ranking
5. Results and Discussion
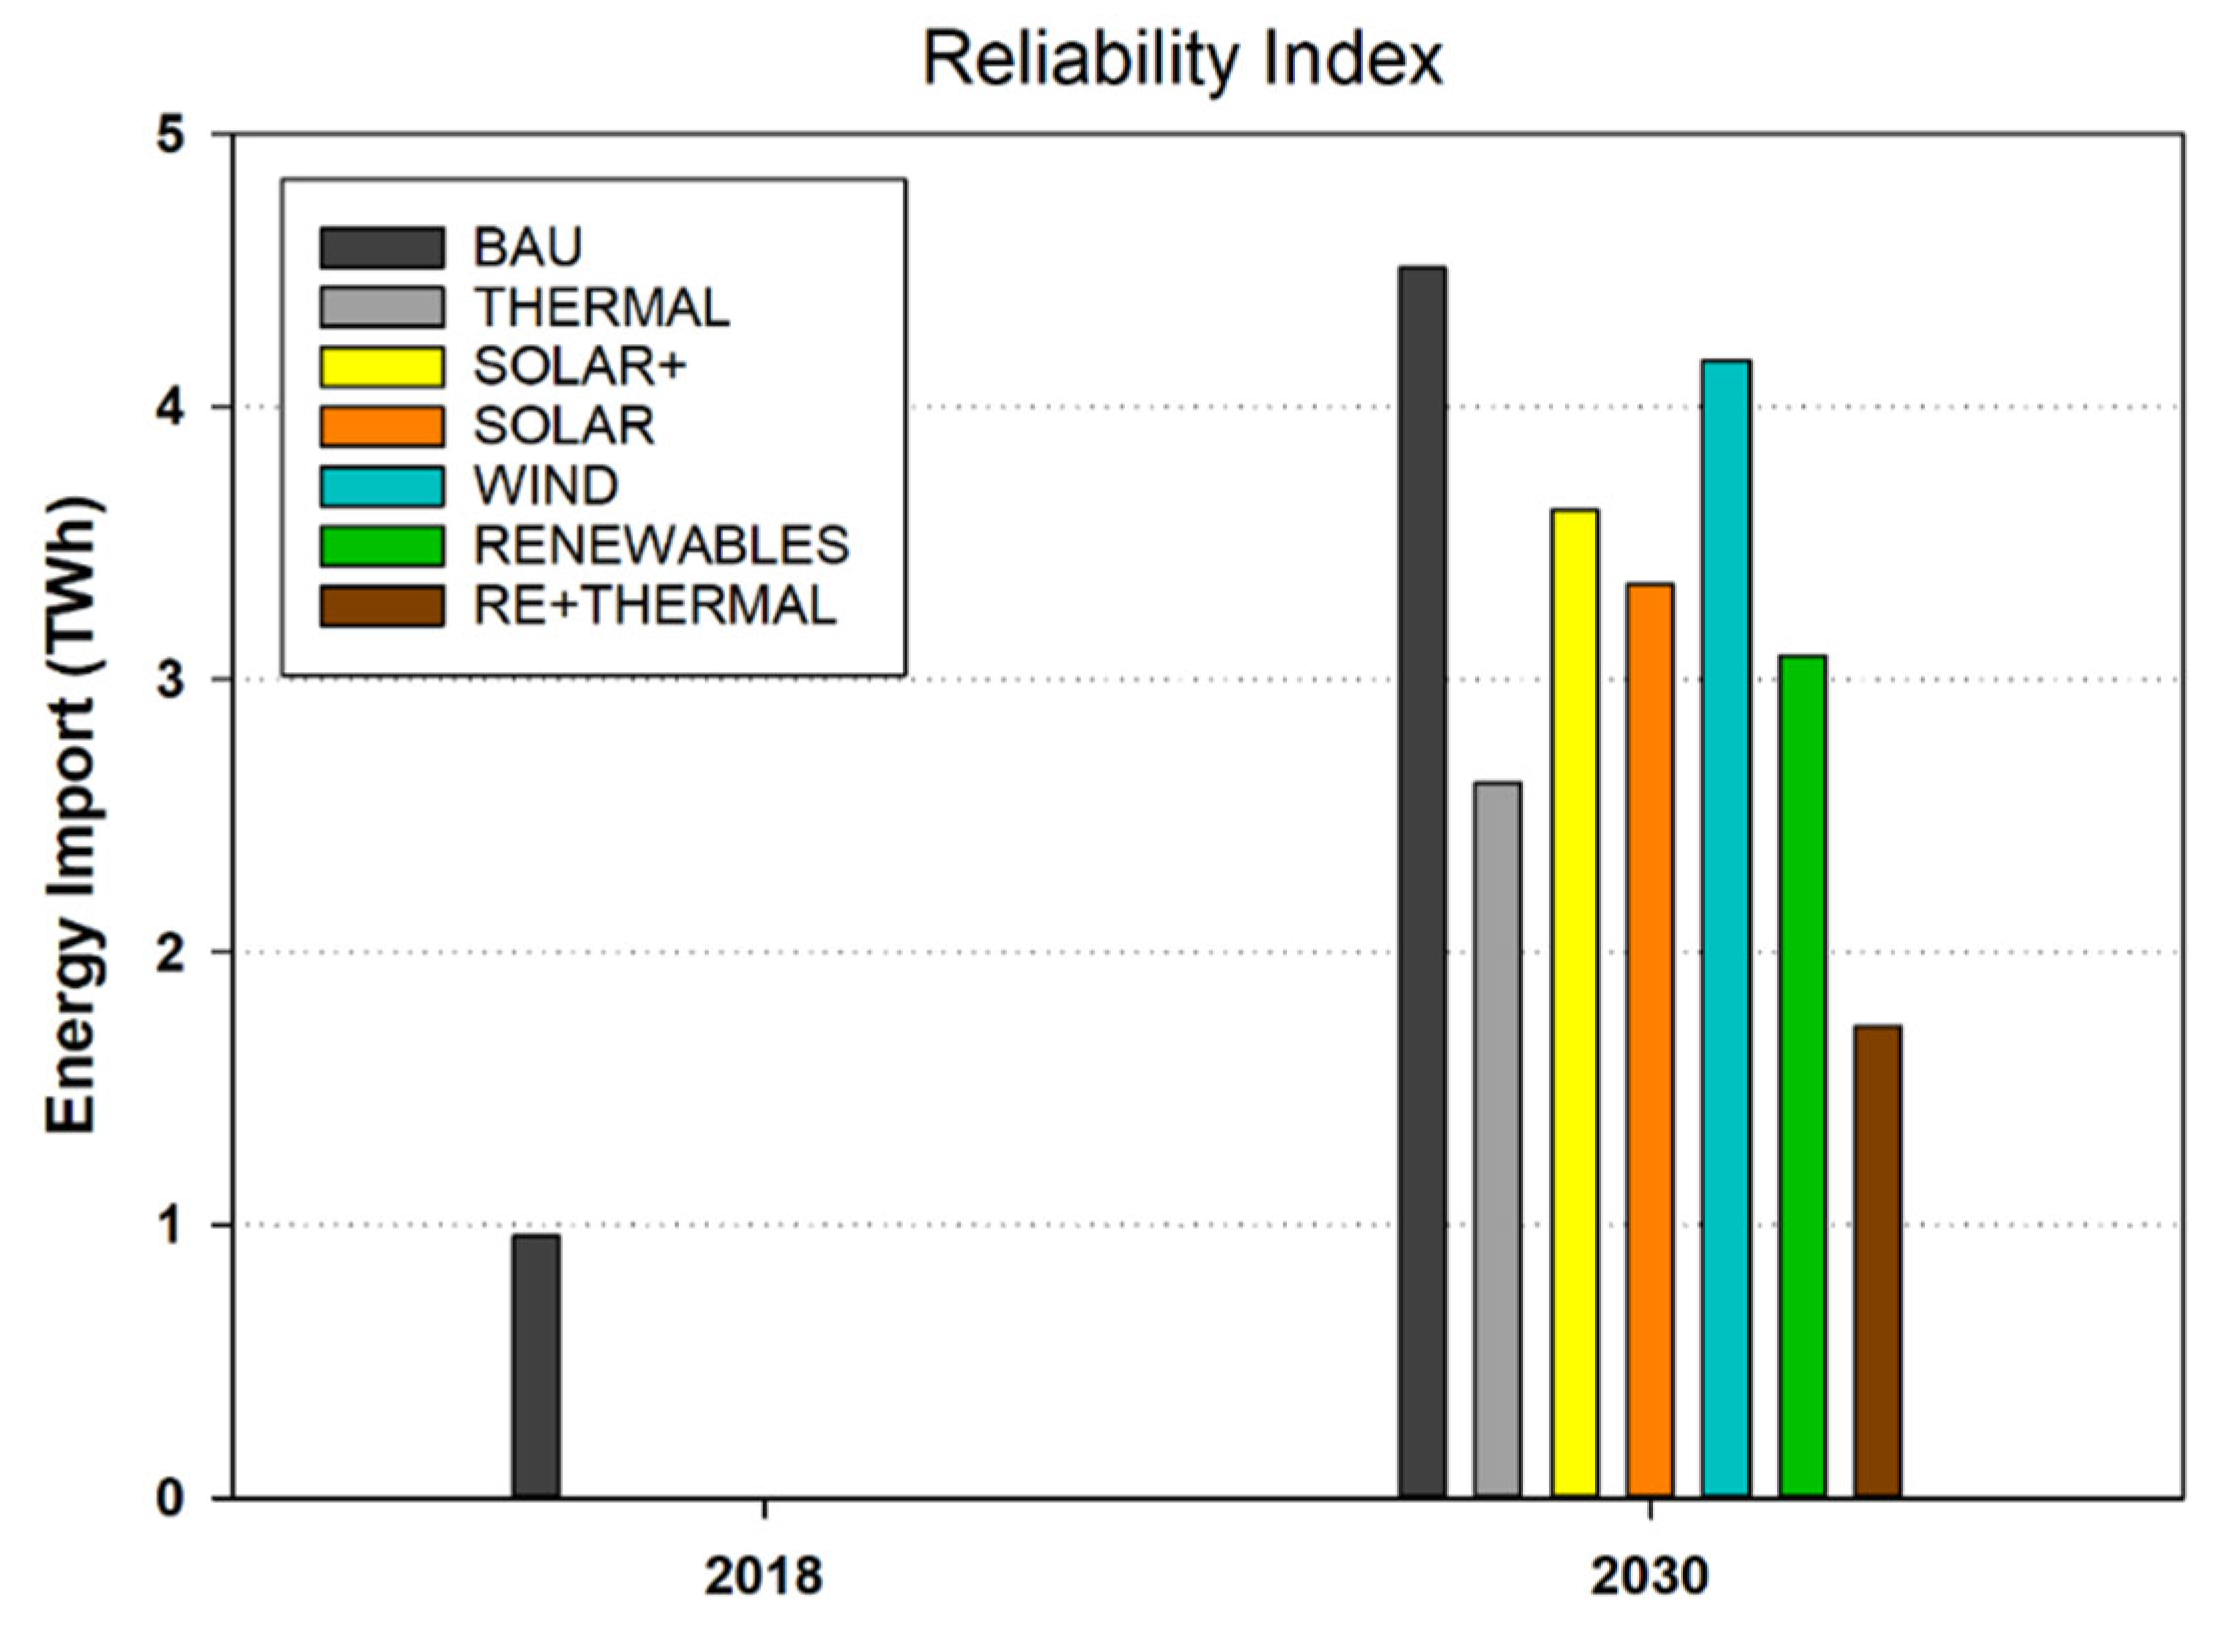
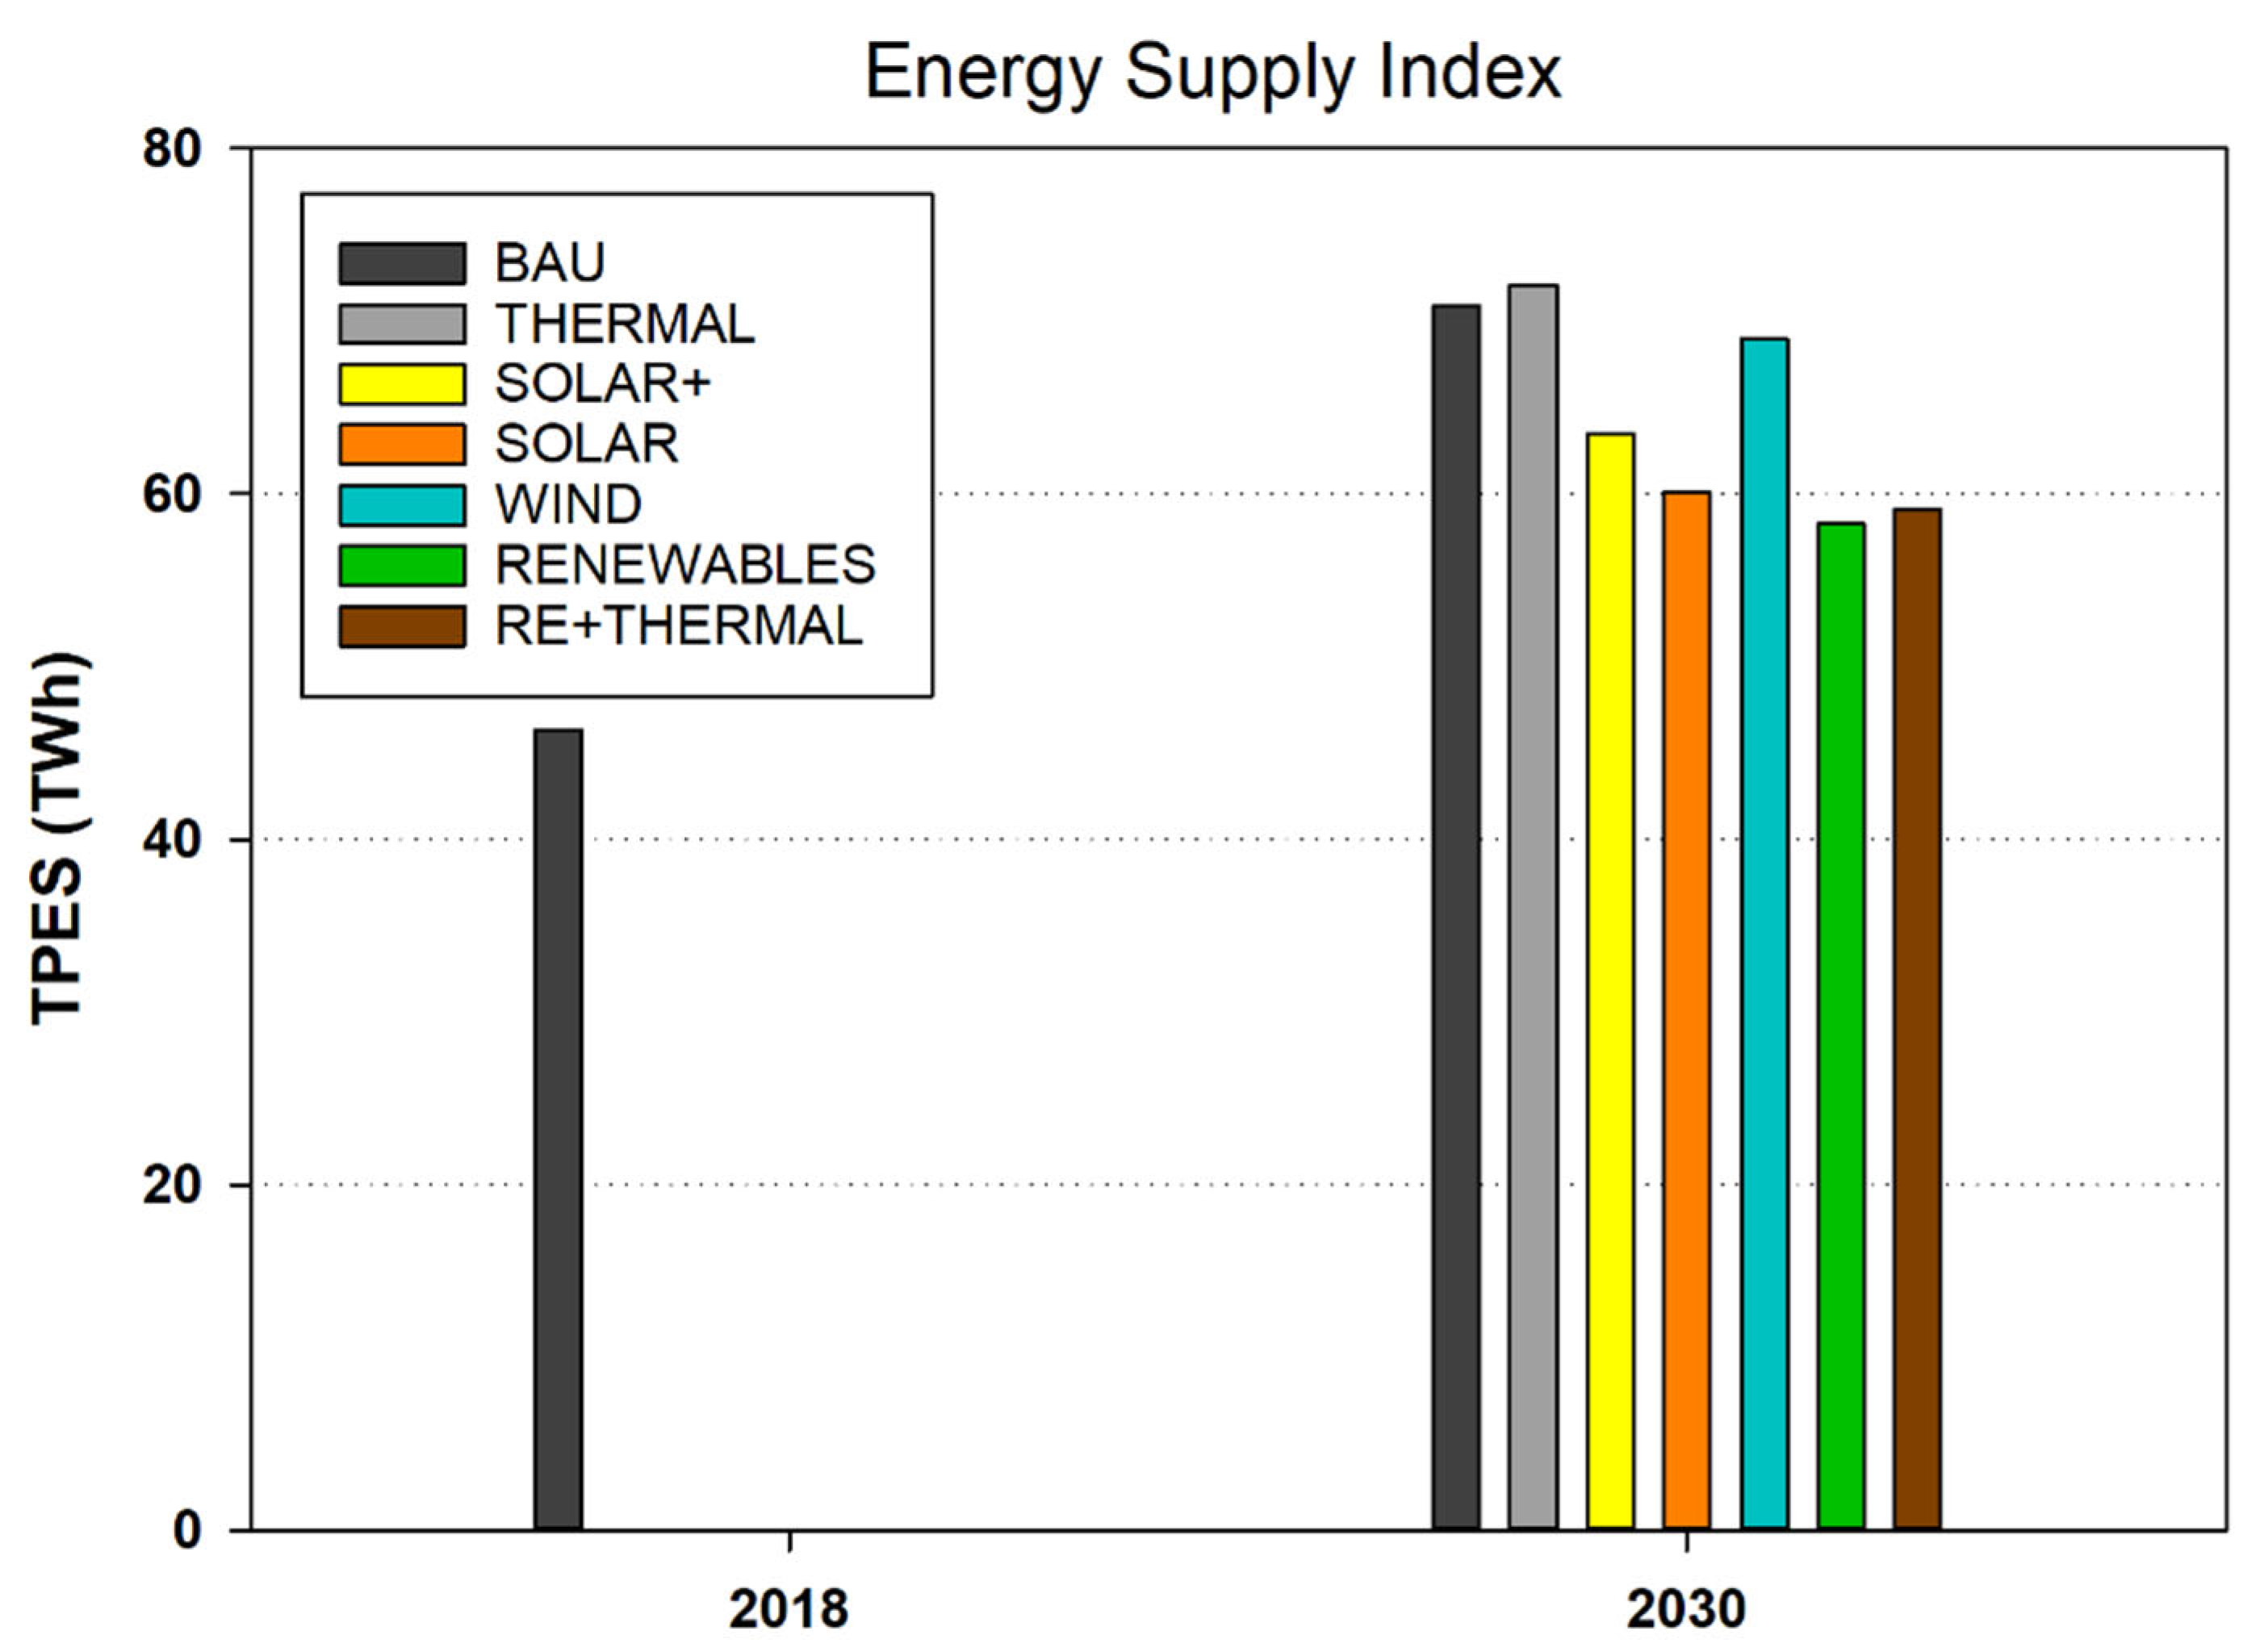
5.1. Energy Modeling Results
5.2. MCDM Results
5.2.1. Criteria Weighting
5.2.2. Energy Plans Ranking
6. Conclusions
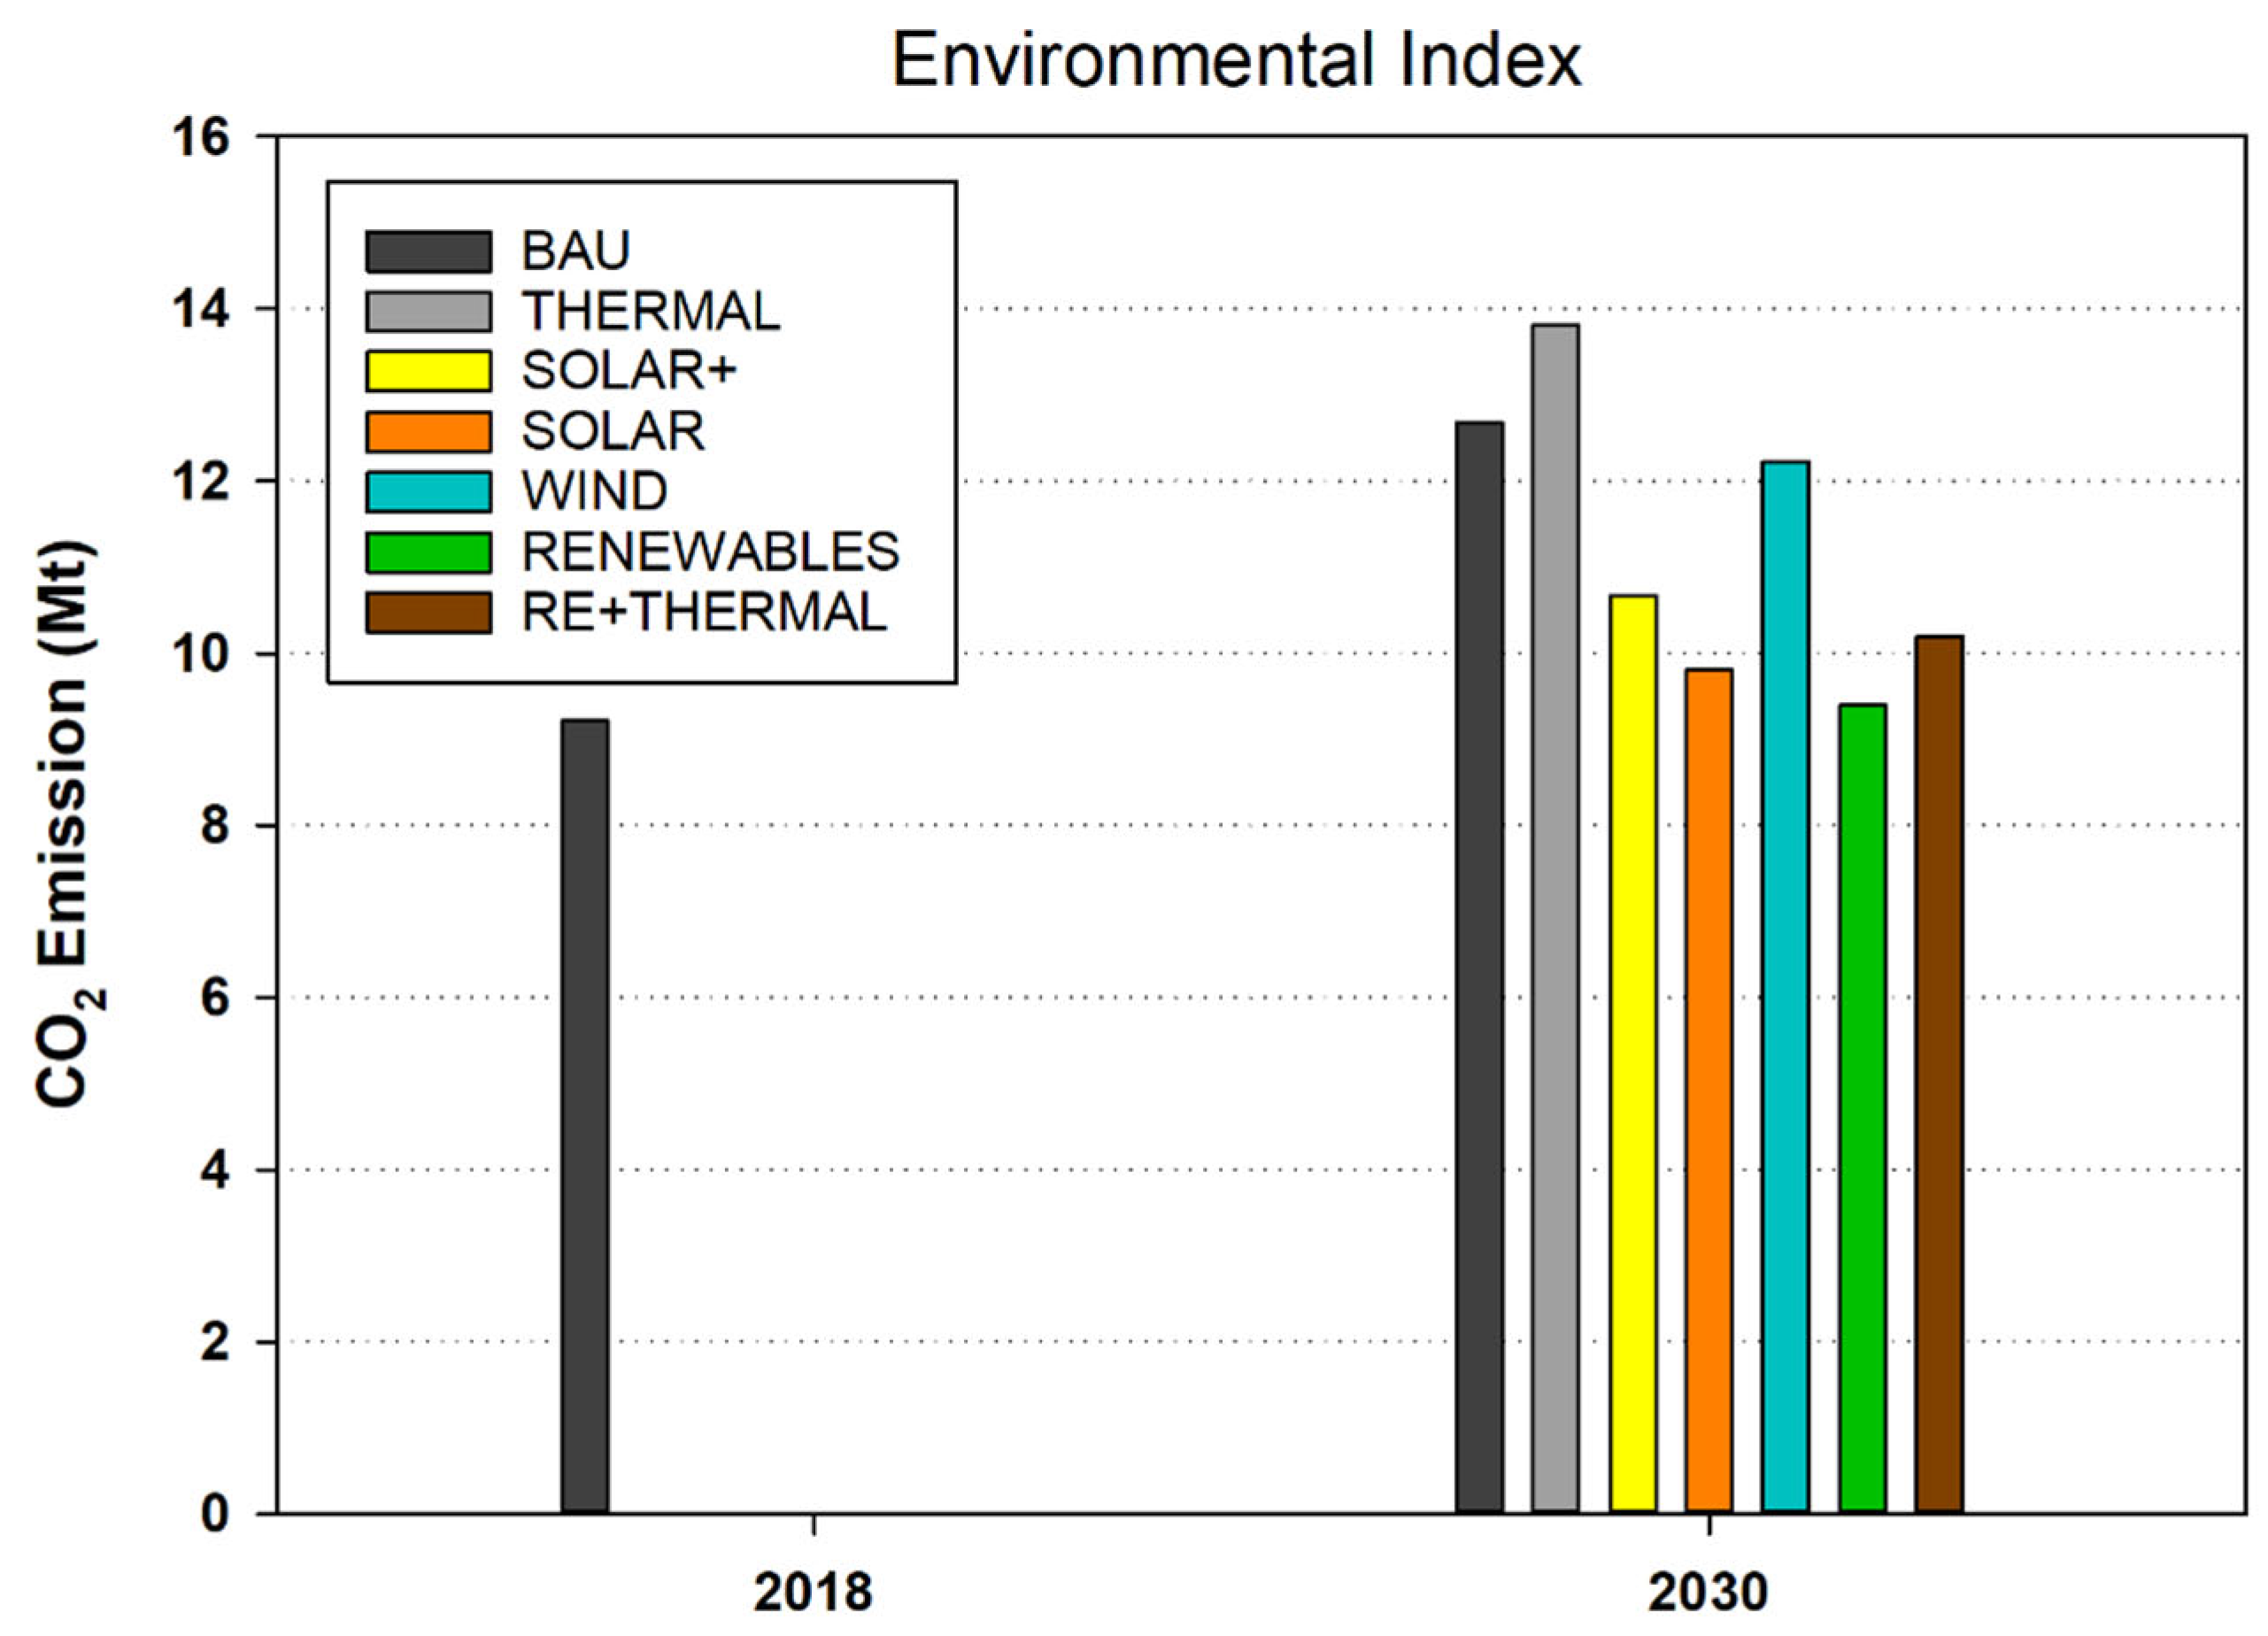
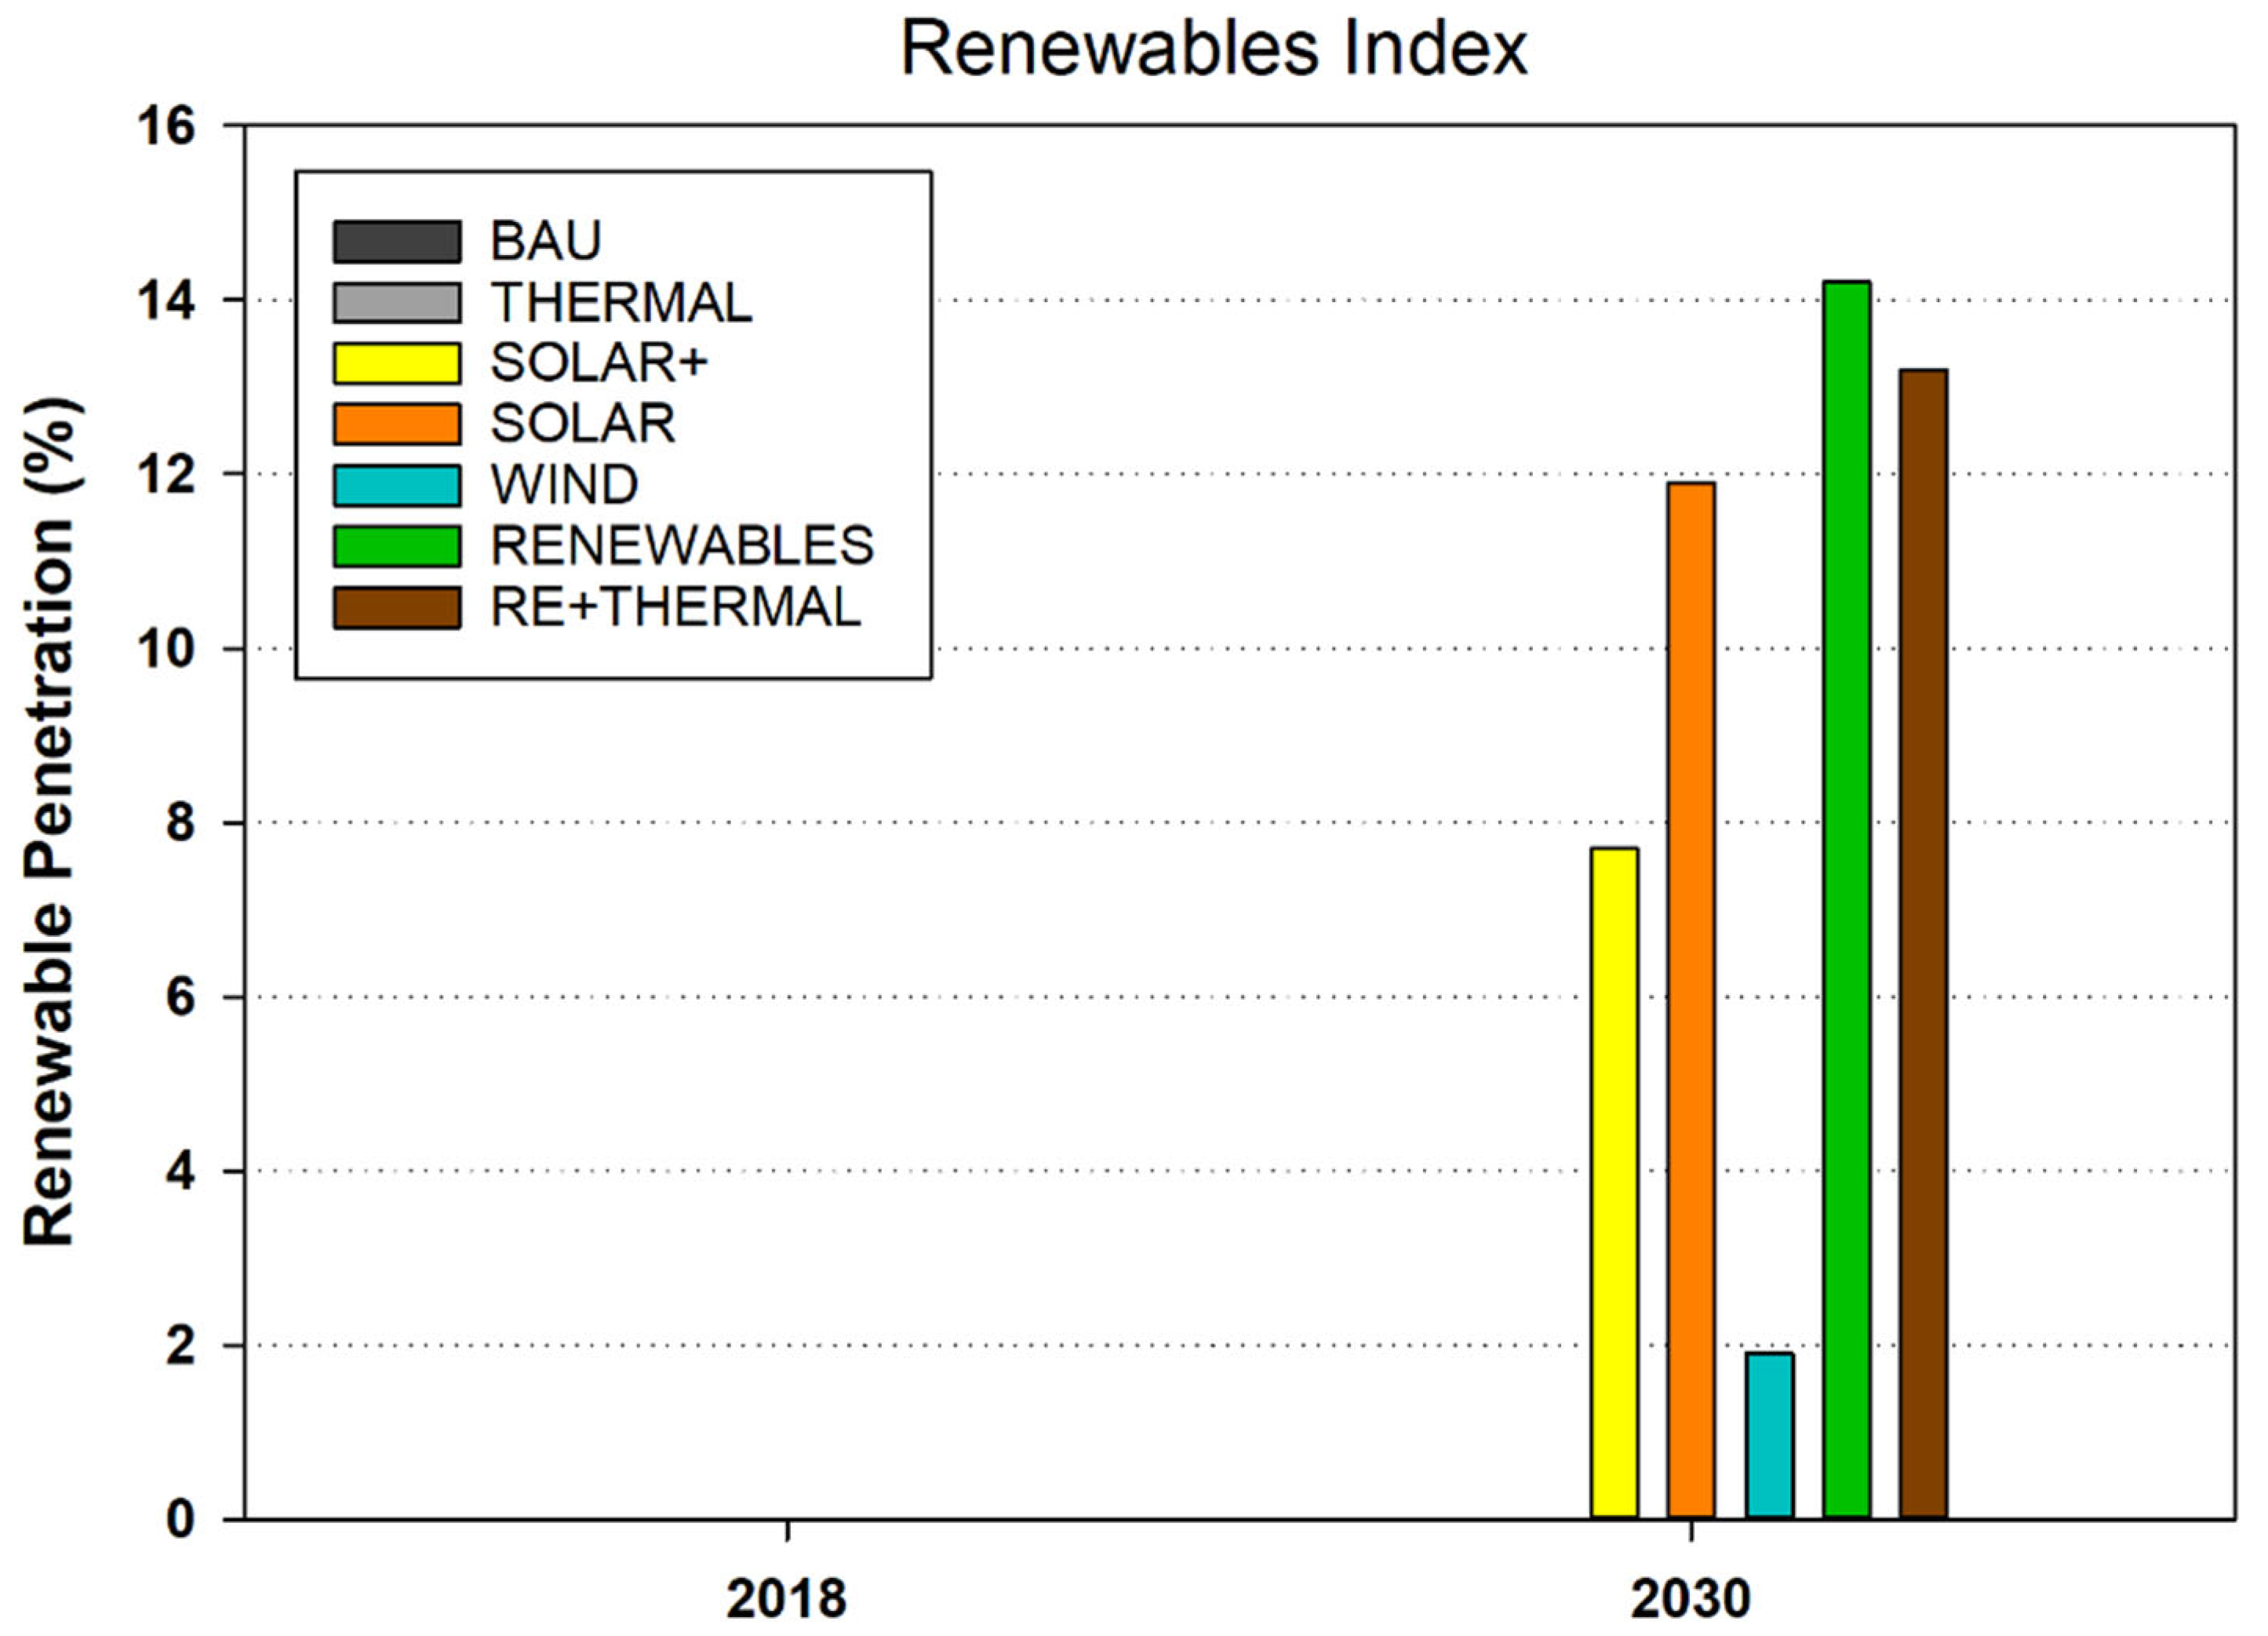
- The usage of renewable energies is desired for the future and is receiving more attention as a result of the higher CO2 emissions in the non-renewable scenarios for 2030 compared to the renewable scenarios. However, using the sixth scenario, which combines solar and wind power, results in a large decrease in CO2 emissions. Thus, the greatest strategy for reducing environmental pollutants is to use a combination of renewable energy sources.
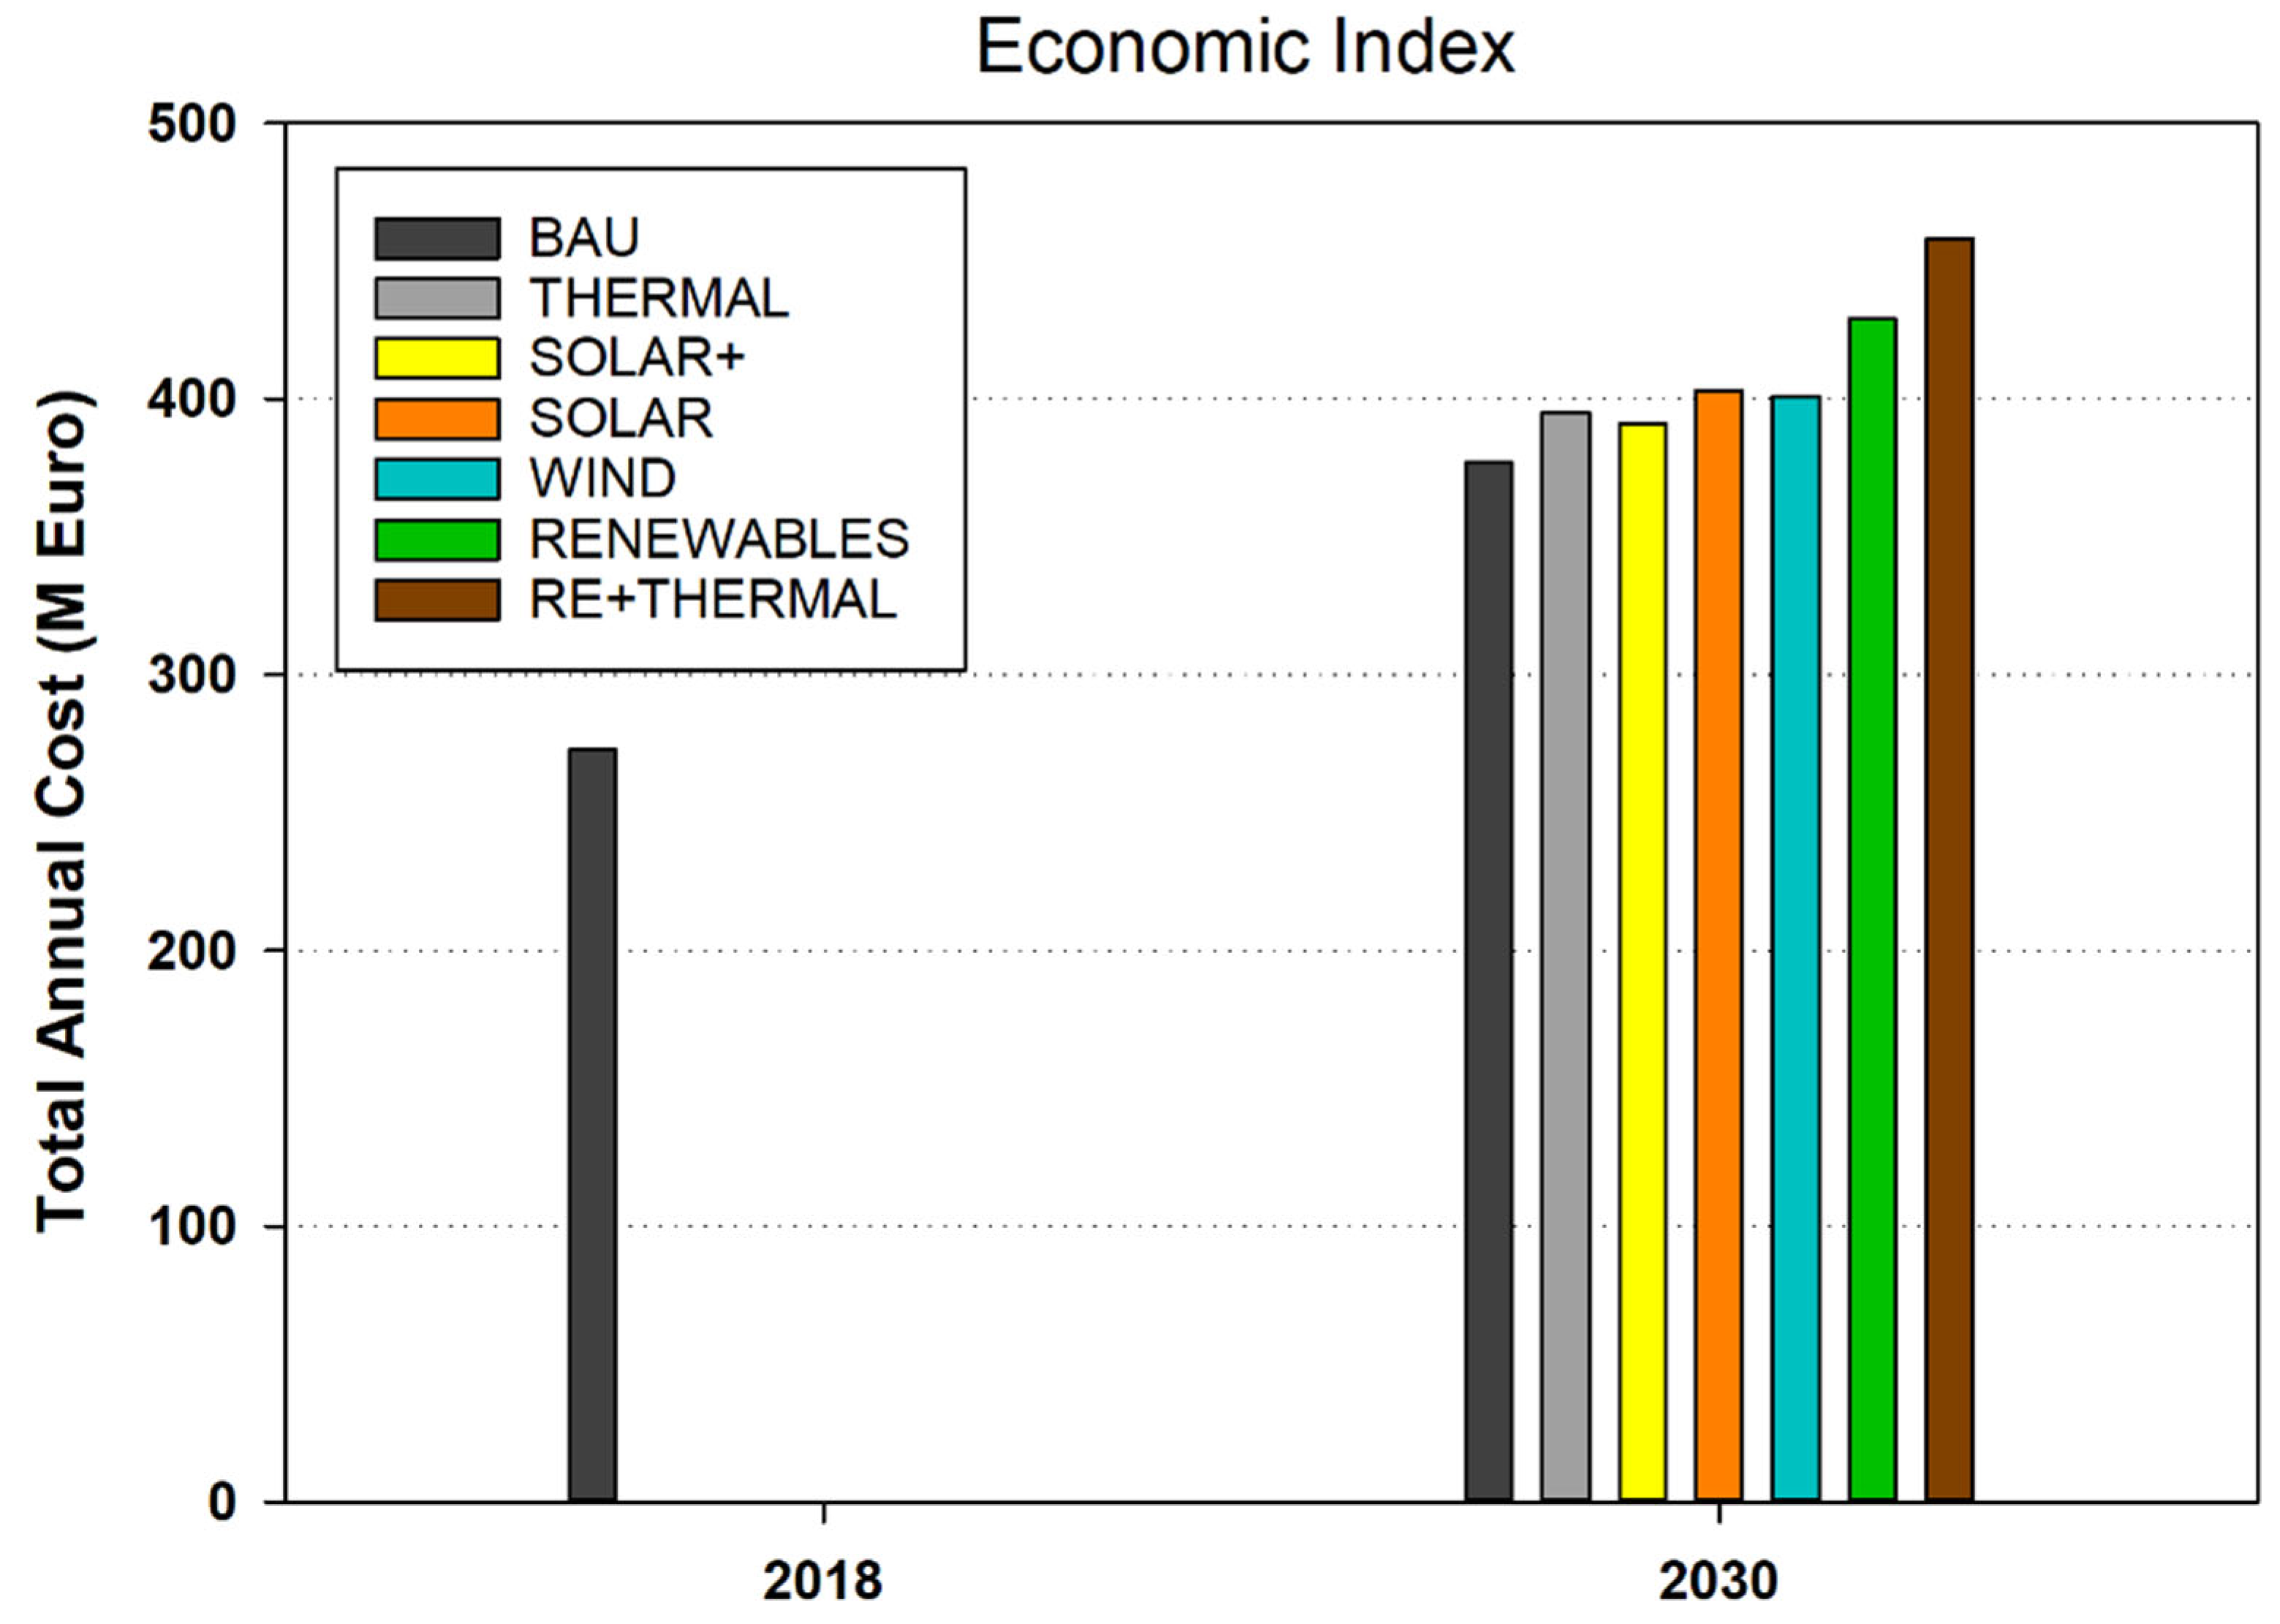
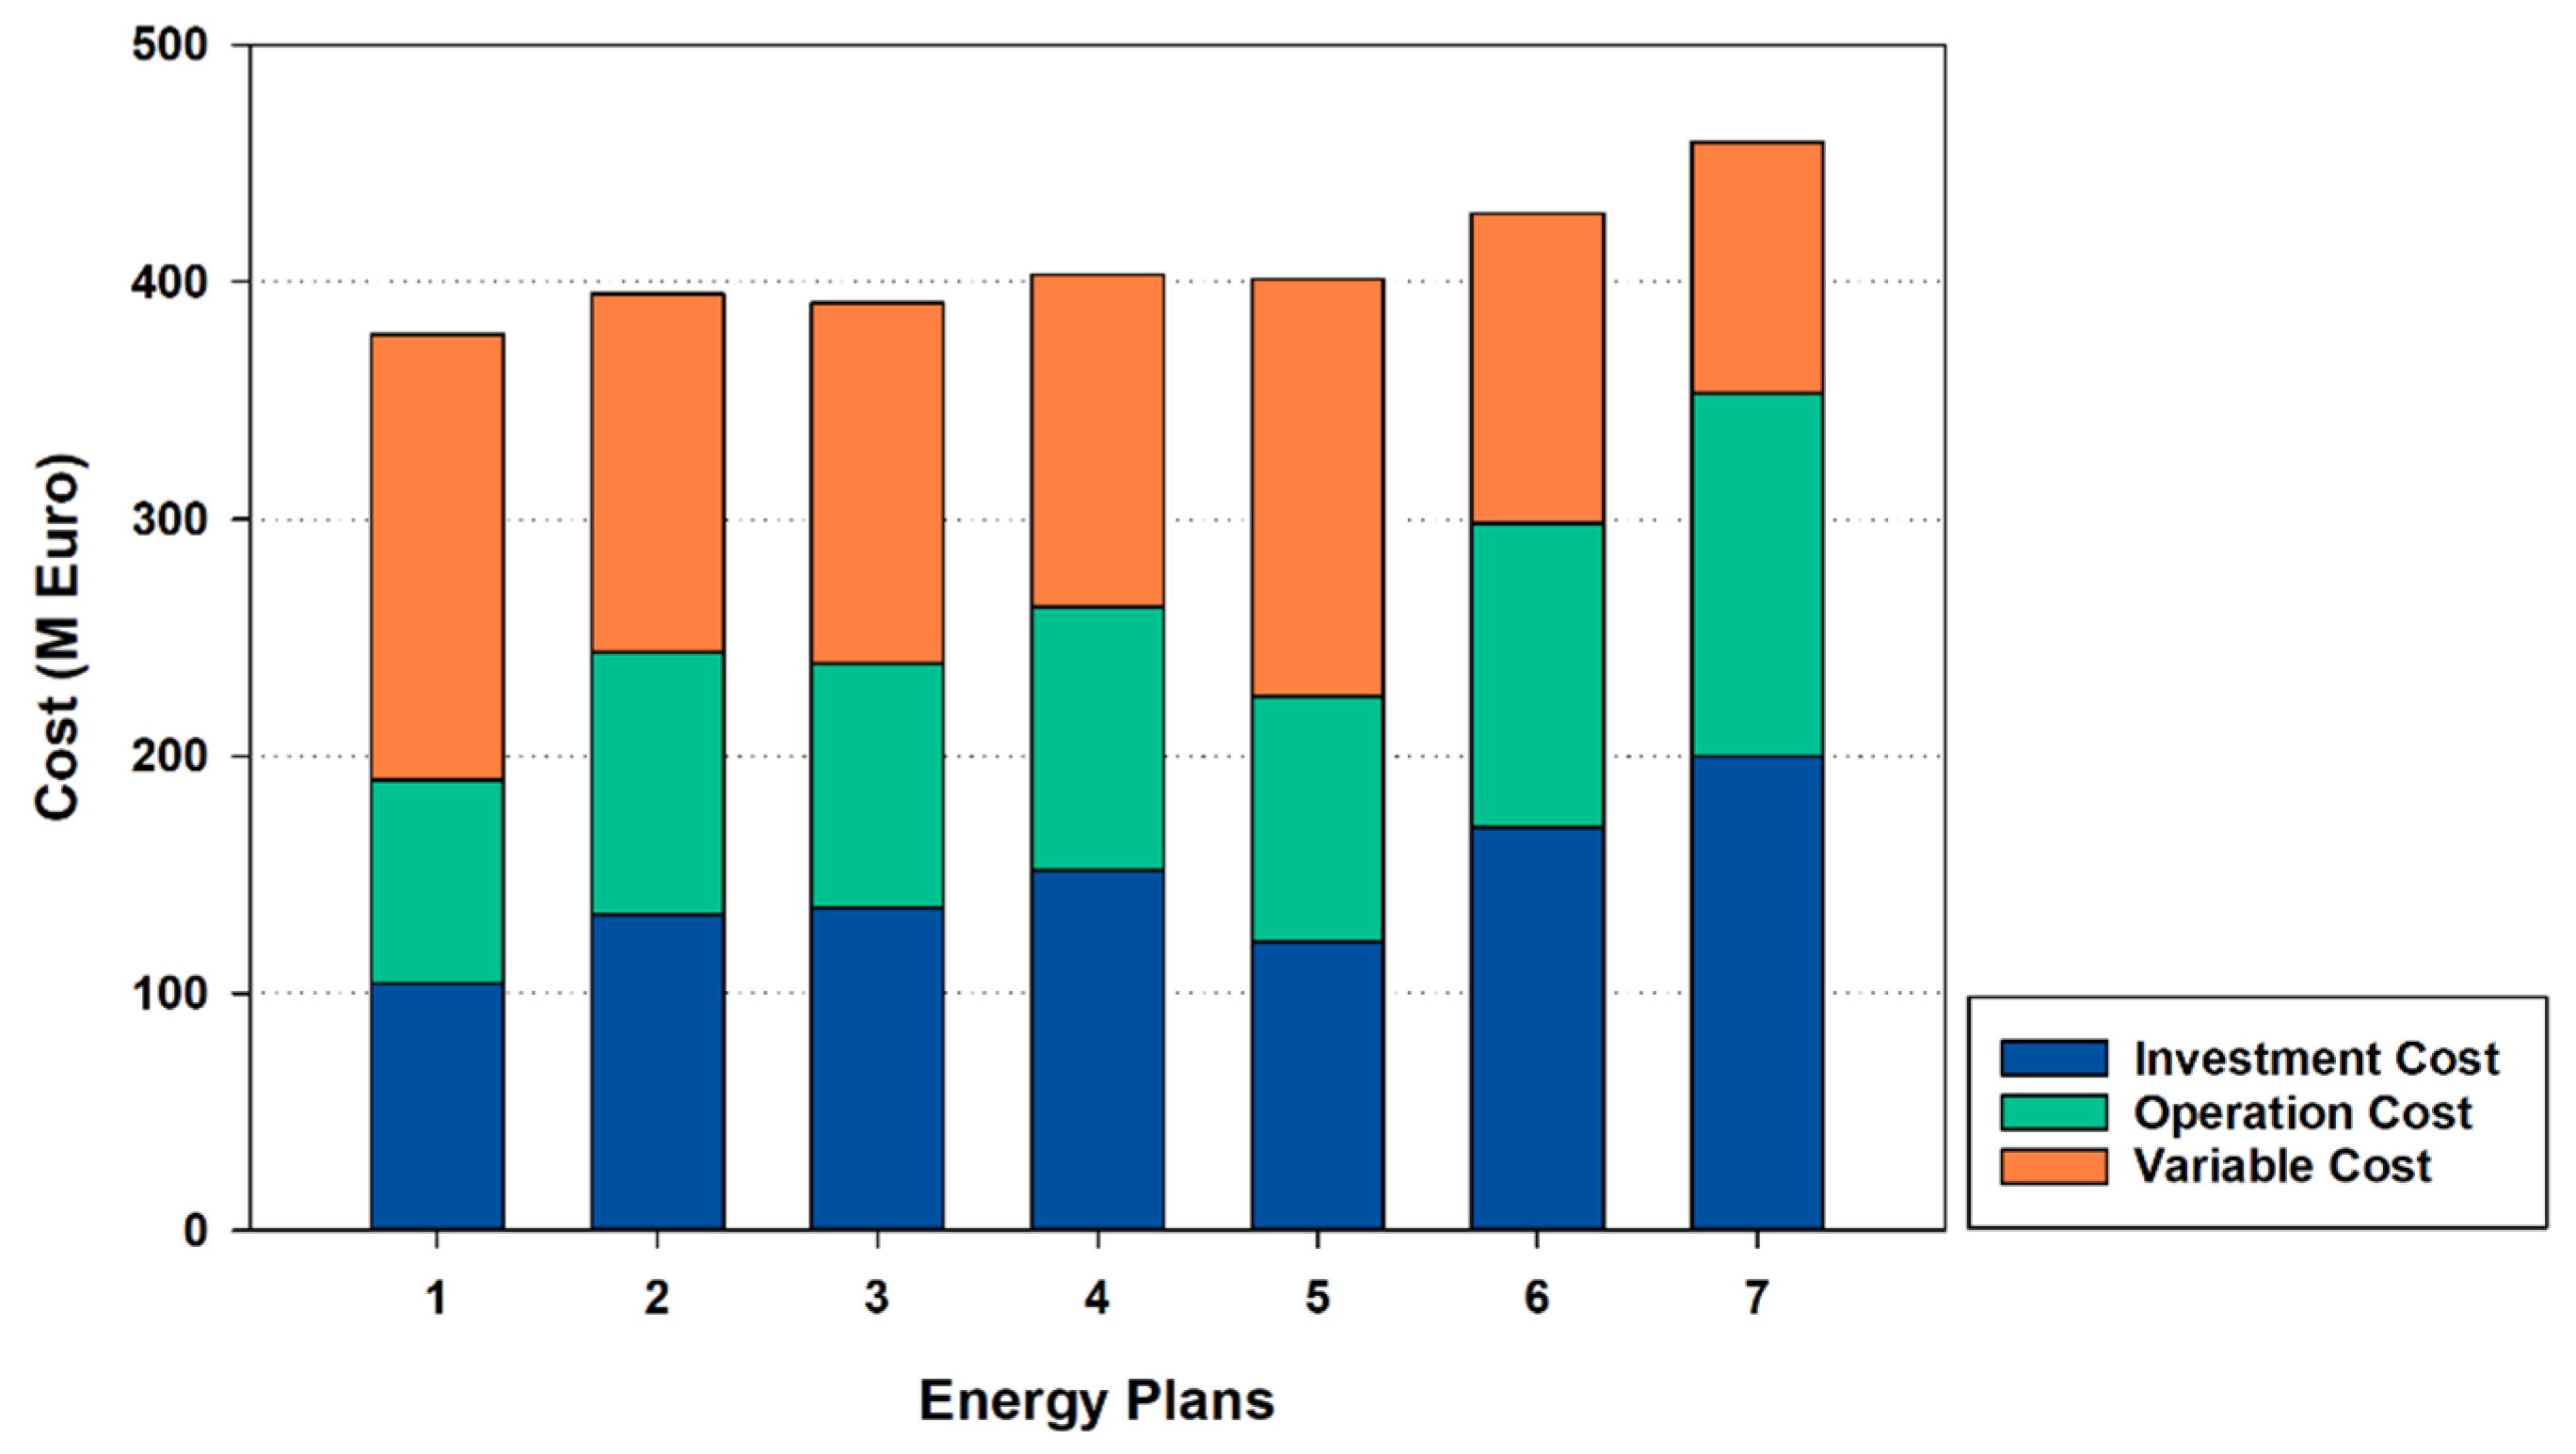
- The annual cost was checked in the proposed scenarios and it was found that the best scenario in terms of cost (least expensive) is the first scenario, i.e., BAU (no investment and total import of power). The sixth and seventh scenarios are not good options to choose from because of the high annual cost.
- The importance of production costs and energy supply strategies has increased as a result of the inclusion of the five indicators to make the study more thorough. Of all the indicators, the indicator with the greatest value—which is equivalent to 34.20 percent—is related to the total annual cost. However, the weighted range for the remaining indicators was between 14.46 and 19.43, demonstrating the major significance of the annual cost and the project’s economic component.
- The seventh scenario is the best choice among the suggested scenarios when using the multi-criteria decision-making approach, taking into account the desired indicators and their weighting (the combination of thermal and renewable power plants in order to provide 5265 MW of electric energy for the desired demand in 2030). The use of this plan, keeping in mind the current pollution standards, can meet the energy needs of Hormozgan province for 2030. The first and second scenarios can be the next choices. Considering the applied policies and attention to efforts to use renewable systems, reducing the use of fossil and non-renewable resources should be considered important.
Author Contributions
Funding
Conflicts of Interest
Nomenclature
| Abbreviations | |
| MCDM | Multi-criteria decision making |
| CCHP | Combined cooling, heating and power |
| CHP | Combined heating and power |
| GA | Genetic algorithm |
| AHP | Analytical hierarchy process |
| EDAS | Evaluation based on Distance from Average Solution |
| CRITIC | The CRiteria Importance Through Intercriteria Correlation |
| GHI | Global horizontal irradiation |
| HW | Holt–Winters |
| Variables and parameters | |
| t | timestep |
| real value at timestep t | |
| smoothed estimate at timestep t | |
| trend value at timestep t | |
| level smoothing coefficient | |
| trend smoothing coefficient | |
| decision matrix’s element for the alternative in the attribute | |
| normalized decision matrix’s element | |
| correlation coefficient between and attributes | |
| standard deviation of attributes | |
| final weight of attributes | |
| average solution of attributes | |
| PDA | positive distances from average solution |
| NDA | negative distances from average solution |
| weighted PDA for the alternative | |
| weighted NDA for the alternative | |
| normalized weighted PDA for the alternative | |
| normalized weighted NDA for the alternative | |
| Final appraisal score | |
References
- IEA. IRAN Electricity Consumption 2018. Available online: https://www.iea.org/data-and-statistics/data-browser?country=IRAN&fuel=Energy%20consumption&indicator=TotElecCons (accessed on 23 May 2022).
- Yousefi, H.; Ghodusinejad, M.; Noorollahi, Y. Analysis of the effects of flat and tiered pricing methods on the economic feasibility of residential photovoltaic systems. Tabriz J. Electr. Eng. 2018, 48, 943–950. [Google Scholar]
- Yousefi, H.; Ghodusinejad, M.H. Feasibility Study of a Hybrid Energy System for Emergency Off-grid Operating Conditions. Majlesi J. Electr. Eng. 2017, 11, 7–14. [Google Scholar]
- Kamali Saraji, M.; Streimikiene, D.; Kyriakopoulos, G.L. Fermatean fuzzy CRITIC-COPRAS method for evaluating the challenges to industry 4.0 adoption for a sustainable digital transformation. Sustainability 2021, 13, 9577. [Google Scholar] [CrossRef]
- Ezbakhe, F.; Pérez-Foguet, A. Decision analysis for sustainable development: The case of renewable energy planning under uncertainty. Eur. J. Oper. Res. 2021, 291, 601–613. [Google Scholar] [CrossRef]
- Wimmler, C.; Hejazi, G.; Fernandes, E.; Moreira, C.; Connors, S. Multi-criteria decision support methods for renewable energy systems on islands. J. Clean Energy Technol. 2015, 3, 185–195. [Google Scholar] [CrossRef] [Green Version]
- Katal, F.; Fazelpour, F. Multi-criteria evaluation and priority analysis of different types of existing power plants in Iran: An optimized energy planning system. Renew. Energy 2018, 120, 163–177. [Google Scholar] [CrossRef]
- Shorabeh, S.N.; Argany, M.; Rabiei, J.; Firozjaei, H.K.; Nematollahi, O. Potential assessment of multi-renewable energy farms establishment using spatial multi-criteria decision analysis: A case study and mapping in Iran. J. Clean. Prod. 2021, 295, 126318. [Google Scholar] [CrossRef]
- Yousefi, H.; Ghodusinejad, M.H.; Noorollahi, Y. GA/AHP-based optimal design of a hybrid CCHP system considering economy, energy and emission. Energy Build. 2017, 138, 309–317. [Google Scholar] [CrossRef]
- Ribeiro, F.; Ferreira, P.; Araújo, M. Evaluating future scenarios for the power generation sector using a Multi-Criteria Decision Analysis (MCDA) tool: The Portuguese case. Energy 2013, 52, 126–136. [Google Scholar] [CrossRef] [Green Version]
- Santos, M.; Ferreira, P.; Araújo, M.; Portugal-Pereira, J.; Lucena, A.; Schaeffer, R. Scenarios for the future Brazilian power sector based on a multi-criteria assessment. J. Clean. Prod. 2017, 167, 938–950. [Google Scholar] [CrossRef]
- Ghodusinejad, M.H.; Ghodrati, A.; Zahedi, R.; Yousefi, H. Multi-criteria modeling and assessment of PV system performance in different climate areas of Iran. Sustain. Energy Technol. Assess. 2022, 53, 102520. [Google Scholar] [CrossRef]
- Yazdani, M.; Torkayesh, A.E.; Santibanez-Gonzalez, E.D.; Otaghsara, S.K. Evaluation of renewable energy resources using integrated Shannon Entropy—EDAS model. Sustain. Oper. Comput. 2020, 1, 35–42. [Google Scholar] [CrossRef]
- Asante, D.; He, Z.; Adjei, N.O.; Asante, B. Exploring the barriers to renewable energy adoption utilising MULTIMOORA-EDAS method. Energy Policy 2020, 142, 111479. [Google Scholar] [CrossRef]
- Polat, G.; Bayhan, H.G. Selection of HVAC-AHU system supplier with environmental considerations using Fuzzy EDAS method. Int. J. Constr. Manag. 2022, 22, 1863–1871. [Google Scholar] [CrossRef]
- Behzad, M.; Zolfani, S.H.; Pamucar, D.; Behzad, M. A comparative assessment of solid waste management performance in the Nordic countries based on BWM-EDAS. J. Clean. Prod. 2020, 266, 122008. [Google Scholar] [CrossRef]
- Demirtas, O.; Derindag, O.F.; Zarali, F.; Ocal, O.; Aslan, A. Which renewable energy consumption is more efficient by fuzzy EDAS method based on PESTLE dimensions? Environ. Sci. Pollut. Res. 2021, 28, 36274–36287. [Google Scholar] [CrossRef]
- Witt, T.; Dumeier, M.; Geldermann, J. Combining scenario planning, energy system analysis, and multi-criteria analysis to develop and evaluate energy scenarios. J. Clean. Prod. 2020, 242, 118414. [Google Scholar] [CrossRef]
- Karatop, B.; Taşkan, B.; Adar, E.; Kubat, C. Decision analysis related to the renewable energy investments in Turkey based on a Fuzzy AHP-EDAS-Fuzzy FMEA approach. Comput. Ind. Eng. 2021, 151, 106958. [Google Scholar] [CrossRef]
- Yousefi, H.; Ghodusinejad, M.H.; Kasaeian, A. Multi-objective optimal component sizing of a hybrid ICE+ PV/T driven CCHP microgrid. Appl. Therm. Eng. 2017, 122, 126–138. [Google Scholar] [CrossRef]
- Hormozgan Province Statistical Yearbook; Iran Statistics Center: Tehran, Iran, 2018.
- Iran Energy Balance Report; Iran Ministry of Energy: Tehran, Iran, 2018.
- Noorollahi, Y.; Golshanfard, A.; Ansaripour, S.; Khaledi, A.; Shadi, M. Solar energy for sustainable heating and cooling energy system planning in arid climates. Energy 2021, 218, 119421. [Google Scholar] [CrossRef]
- Almutairi, K.; Hosseini Dehshiri, S.S.; Hosseini Dehshiri, S.J.; Mostafaeipour, A.; Issakhov, A.; Techato, K. Use of a hybrid wind—solar—diesel—battery energy system to power buildings in remote areas: A case study. Sustainability 2021, 13, 8764. [Google Scholar] [CrossRef]
- Nedaei, M. Wind resource assessment in Hormozgan province in Iran. Int. J. Sustain. Energy 2014, 33, 650–694. [Google Scholar] [CrossRef]
- Debnath, K.B.; Mourshed, M. Forecasting methods in energy planning models. Renew. Sustain. Energy Rev. 2018, 88, 297–325. [Google Scholar] [CrossRef] [Green Version]
- Subramanian, A.S.R.; Gundersen, T.; Adams, T.A. Modeling and simulation of energy systems: A review. Processes 2018, 6, 238. [Google Scholar] [CrossRef] [Green Version]
- Suganthi, L.; Samuel, A.A. Energy models for demand forecasting—A review. Renew. Sustain. Energy Rev. 2012, 16, 1223–1240. [Google Scholar] [CrossRef]
- Klemm, C.; Vennemann, P. Modeling and optimization of multi-energy systems in mixed-use districts: A review of existing methods and approaches. Renew. Sustain. Energy Rev. 2021, 135, 110206. [Google Scholar] [CrossRef]
- Farzaneh, H. Energy Systems Modeling; Springer: Berlin/Heidelberg, Germany, 2019. [Google Scholar]
- Ringkjøb, H.-K.; Haugan, P.M.; Solbrekke, I.M. A review of modelling tools for energy and electricity systems with large shares of variable renewables. Renew. Sustain. Energy Rev. 2018, 96, 440–459. [Google Scholar] [CrossRef]
- Lund, H.; Thellufsen, J.Z.; Østergaard, P.A.; Sorknæs, P.; Skov, I.R.; Mathiesen, B.V. EnergyPLAN–Advanced analysis of smart energy systems. Smart Energy 2021, 1, 100007. [Google Scholar] [CrossRef]
- Abdullah, L.; Najib, L. Sustainable energy planning decision using the intuitionistic fuzzy analytic hierarchy process: Choosing energy technology in Malaysia. Int. J. Sustain. Energy 2016, 35, 360–377. [Google Scholar] [CrossRef]
- Zolfani, S.H.; Ecer, F.; Pamučar, D.; Raslanas, S. Neighborhood selection for a newcomer via a novel BWM-based revised MAIRCA integrated model: A case from the Coquimbo-La Serena conurbation, Chile. Int. J. Strateg. Prop. Manag. 2020, 24, 102–118. [Google Scholar] [CrossRef] [Green Version]
- Torkayesh, A.E.; Ecer, F.; Pamucar, D.; Karamaşa, Ç. Comparative assessment of social sustainability performance: Integrated data-driven weighting system and CoCoSo model. Sustain. Cities Soc. 2021, 71, 102975. [Google Scholar] [CrossRef]
- Holt, C.C. Forecasting seasonals and trends by exponentially weighted moving averages. Int. J. Forecast. 2004, 20, 5–10. [Google Scholar] [CrossRef]
- Winters, P.R. Forecasting sales by exponentially weighted moving averages. Manag. Sci. 1960, 6, 324–342. [Google Scholar] [CrossRef]
- Hong, W.-C. Hybrid Intelligent Technologies in Energy Demand Forecasting; Springer: Berlin/Heidelberg, Germany, 2020. [Google Scholar]
- Hong, W.-C. Intelligent Energy Demand Forecasting; Springer: Berlin/Heidelberg, Germany, 2013. [Google Scholar]
- Satkin, M. High Potential Sites and Evaluation of the Country’s Renewable Energy Sources (Hormozgan Province); SATBA: Tehran, Iran, 2019.
- ATLAS, G.S. Hormozgan Solar Potential. 2020. Available online: https://globalsolaratlas.info/map?s=27.71981,56.335807&m=site&c=28.016226,55.612793,8 (accessed on 23 May 2022).
- Durmaz, E.; Akan, Ş.; Bakır, M. Service quality and financial performance analysis in low-cost airlines: An integrated multi-criteria quadrant application. Int. J. Econ. Bus. Res. 2020, 20, 168–191. [Google Scholar] [CrossRef]
- Alinezhad, A.; Khalili, J. New Methods and Applications in Multiple Attribute Decision Making (MADM); Springer: Berlin/Heidelberg, Germany, 2019; Volume 277. [Google Scholar]


| Powerplant Owner | Powerplant Technology | Total Capacity (MW) | ||
|---|---|---|---|---|
| Steam | Gas | Diesel | ||
| Ministry of Energy | 1280 | 1871.8 | 66.1 | 3217.9 |
| Major Industries | 0 | 160 | 0 | 160 |
| Private sector | 0 | 119.6 | 0 | 119.6 |
| 3497.5 | ||||
| Parameter | Value |
|---|---|
| Powerplant efficiency (%) | 35 |
| Natural gas CO2 content (kg/Gj) | 57.9 |
| CO2 price (Euro/ton) | 7 |
| Electricity import price (Euro/MWh) | 24 |
| Technology | Investment Cost | Lifetime | O&M Cost (% of Inv.) |
|---|---|---|---|
| Thermal powerplant | 0.74 | 25 | 3.32 |
| Solar PV | 0.69 | 40 | 1.28 |
| Wind | 1.2 | 30 | 3.2 |
| Power Import (TWh) | TPES (TWh) | CO2 (Mt) | TAC (M Euro) | RES (%) | ||
| Decision Matrix | Plan1 | 4.51 | 70.87 | 12.68 | 377 | 0 |
| Plan2 | 2.62 | 72.07 | 13.81 | 395 | 0 | |
| Plan3 | 3.62 | 63.5 | 10.67 | 391 | 7.7 | |
| Plan4 | 3.35 | 60.07 | 9.81 | 403 | 11.9 | |
| Plan5 | 4.17 | 69 | 12.22 | 401 | 1.9 | |
| Plan6 | 3.09 | 58.25 | 9.39 | 429 | 14.2 | |
| Plan7 | 1.73 | 59.11 | 10.19 | 458 | 13.2 | |
| Criteria Analysis | min | 1.73 | 58.25 | 9.39 | 377 | 0 |
| max | 4.51 | 72.07 | 13.81 | 458 | 14.2 | |
| Criteria type | Cost | Cost | Cost | Cost | Benefit |
| Power Import | TPES | CO2 | TAC | RES | |
|---|---|---|---|---|---|
| Power Import | 1.0000 | 0.3115 | 0.1458 | −0.6052 | 0.3851 |
| TPES | 0.3115 | 1.0000 | 0.9852 | −0.7054 | 0.9960 |
| CO2 | 0.1458 | 0.9852 | 1.0000 | −0.6185 | 0.9671 |
| TAC | −0.6052 | −0.7054 | −0.6185 | 1.0000 | −0.7385 |
| RES | 0.3851 | 0.9960 | 0.9671 | −0.7385 | 1.0000 |
| Power Import | TPES | CO2 | TAC | RES | |
|---|---|---|---|---|---|
| Std. Dev. () | 0.4140 | 0.5200 | 0.4600 | 0.4110 | 0.5441 |
| The Index (Cj) | 1.5576 | 1.2547 | 1.1593 | 2.7404 | 1.3006 |
| Final Weights (%Wj) | 19.4397 | 15.6584 | 14.4686 | 34.2014 | 16.2319 |
| Power Import | TPES | CO2 | TAC | RES | ||
|---|---|---|---|---|---|---|
| PDA | Plan1 | 0 | 0 | 0 | 0.0753 | 0 |
| Plan2 | 0.2057 | 0 | 0 | 0.0312 | 0 | |
| Plan3 | 0 | 0.0185 | 0.0518 | 0.0410 | 0.1022 | |
| Plan4 | 0 | 0.0715 | 0.1282 | 0.0116 | 0.7035 | |
| Plan5 | 0 | 0 | 0 | 0.0165 | 0 | |
| Plan6 | 0.0632 | 0.0996 | 0.1655 | 0 | 1.0327 | |
| Plan7 | 0.4755 | 0.0863 | 0.0945 | 0 | 0.8896 | |
| NDA | Plan1 | 0.3673 | 0.0954 | 0.1268 | 0 | 1 |
| Plan2 | 0 | 0.1140 | 0.2272 | 0 | 1 | |
| Plan3 | 0.0974 | 0 | 0 | 0 | 0 | |
| Plan4 | 0.0156 | 0 | 0 | 0 | 0 | |
| Plan5 | 0.2642 | 0.0665 | 0.0859 | 0 | 0.7280 | |
| Plan6 | 0 | 0 | 0 | 0.0522 | 0 | |
| Plan7 | 0 | 0 | 0 | 0.1233 | 0 |
| Power Import | TPES | CO2 | TAC | RES | ||
|---|---|---|---|---|---|---|
| Weighted PDA | Plan1 | 0 | 0 | 0 | 0.0258 | 0 |
| Plan2 | 0.0400 | 0 | 0 | 0.0107 | 0 | |
| Plan3 | 0 | 0.0029 | 0.0075 | 0.0140 | 0.0166 | |
| Plan4 | 0 | 0.0112 | 0.0186 | 0.0040 | 0.1142 | |
| Plan5 | 0 | 0 | 0 | 0.0056 | 0 | |
| Plan6 | 0.0123 | 0.0156 | 0.0240 | 0 | 0.1676 | |
| Plan7 | 0.0924 | 0.0135 | 0.0137 | 0 | 0.1444 | |
| Weighted NDA | Plan1 | 0.0714 | 0.0149 | 0.0183 | 0 | 0.1623 |
| Plan2 | 0 | 0.0178 | 0.0329 | 0 | 0.1623 | |
| Plan3 | 0.0189 | 0 | 0 | 0 | 0 | |
| Plan4 | 0.0030 | 0 | 0 | 0 | 0 | |
| Plan5 | 0.0514 | 0.0104 | 0.0124 | 0 | 0.1182 | |
| Plan6 | 0 | 0 | 0 | 0.0179 | 0 | |
| Plan7 | 0 | 0 | 0 | 0.0422 | 0 |
| Rank | Energy Plan | Appraisal Score |
|---|---|---|
| 1 | Plan7 | 0.57899 |
| 2 | Plan1 | 0.54879 |
| 3 | Plan2 | 0.49489 |
| 4 | Plan6 | 0.44908 |
| 5 | Plan5 | 0.37092 |
| 6 | Plan4 | 0.28575 |
| 7 | Plan3 | 0.11313 |
Publisher’s Note: MDPI stays neutral with regard to jurisdictional claims in published maps and institutional affiliations. |
© 2022 by the authors. Licensee MDPI, Basel, Switzerland. This article is an open access article distributed under the terms and conditions of the Creative Commons Attribution (CC BY) license (https://creativecommons.org/licenses/by/4.0/).
Share and Cite
Yousefi, H.; Ghodusinejad, M.H.; Ghodrati, A. Multi-Criteria Future Energy System Planning and Analysis for Hot Arid Areas of Iran. Energies 2022, 15, 9405. https://doi.org/10.3390/en15249405
Yousefi H, Ghodusinejad MH, Ghodrati A. Multi-Criteria Future Energy System Planning and Analysis for Hot Arid Areas of Iran. Energies. 2022; 15(24):9405. https://doi.org/10.3390/en15249405
Chicago/Turabian StyleYousefi, Hossein, Mohammad Hasan Ghodusinejad, and Armin Ghodrati. 2022. "Multi-Criteria Future Energy System Planning and Analysis for Hot Arid Areas of Iran" Energies 15, no. 24: 9405. https://doi.org/10.3390/en15249405